fixed income securities - williams...
TRANSCRIPT
Fixed Income Securities
Topics to be Discussed Description of Fixed Income Securities Characteristics Used to Evaluate Securities Fixed Income Securities Treasury Bonds Agency Bonds Municipal Bonds Corporate Bonds Institutional Bonds Evaluation of Bonds Preferred Stock
Description of Fixed Income Securities
Fixed income securities are a group of investment vehicles that offer a fixed periodic return Key forms of fixed income securities bonds preferred stock
Characteristics Used to Evaluate Fixed Income Securities
Manner of Payment
many fixed income securities offer periodic payments (e.g. semiannual interest) and a specified amount payable at maturity
some securities offer no periodic interest Risk
what is the nature of the security protecting the investor’s investment
Class Notes Fixed Income Securities - 2 -
Yield current yield annual interest/current market value example $10,000, 22-years until maturity, 7 3/4% bond trading at 80.13 interest = $10,000 x 7 3/4% = $775 trading price = $10,000 x 80.13% = $8,013 current yield = $775/$8,013 = 9.67%
this does not consider difference between purchase price and maturity value yield to maturity
yield to maturity considers not only the periodic payments but also the difference between the purchase price and the maturity value
yield reflects the earnings if investor holds security to maturity example
$10,000, 22-years until maturity, 7 3/4% bond, trading at 80.13 present value tables 8,013 = present value of $10,000 + present value of interest What interest rate makes this equation true? bond tables (see next page) yield is 10% (not 9.67%)
yield to call when fixed income security is callable prior to maturity, yield to maturity is
not necessarily applicable if called, issuer will pay premium over 100% of face value similar to yield to maturity present value rate which makes all cash payments to call date equal to
market value Taxes on income
interest on some debt instruments not subject to federal and/or state and local taxes
Liquidity
degree of activity in secondary bond market will affect the price that can be obtained if and when a bond is sold

Class Notes Fixed Income Securities - 3 -
Bond Yield Table
7.75% Years Yield 18.5 19.0 19.5 20.0 20.5 21.0 21.5 22.0 8.50% 93.07 92.99 92.92 92.85 92.78 92.71 92.65 92.59 8.60% 92.20 92.11 92.03 91.95 91.88 91.80 91.73 91.67 8.70% 91.34 91.25 91.16 91.07 90.99 90.91 90.83 90.76 8.80% 90.49 90.39 90.29 90.20 90.11 90.02 89.94 89.86 8.90% 89.66 89.55 89.44 89.34 89.25 89.15 89.07 88.98 9.00% 88.84 88.72 88.61 88.50 88.40 88.30 88.20 88.11 9.10% 88.02 87.90 87.78 87.67 87.56 87.45 87.35 87.26 9.20% 87.22 87.09 86.97 86.85 86.73 86.62 86.52 86.42 9.30% 86.43 86.30 86.16 86.04 85.92 85.80 85.69 85.59 9.40% 85.66 85.51 85.37 85.24 85.12 85.00 84.88 84.77 9.50% 84.89 84.74 84.59 84.46 84.33 84.20 84.08 83.97 9.60% 84.13 83.97 83.83 83.68 83.55 83.42 83.30 83.18 9.70% 83.38 83.22 83.07 82.92 82.78 82.65 82.52 82.40 9.80% 82.64 82.48 82.32 82.17 82.02 81.89 81.76 81.63 9.90% 81.92 81.75 81.58 81.43 81.28 81.14 81.00 80.87 10.00% 81.20 81.02 80.86 80.70 80.54 80.40 80.26 80.13 10.20% 79.79 79.61 79.43 79.26 79.11 78.95 78.81 78.67 10.40% 78.42 78.23 78.05 77.87 77.71 77.55 77.40 77.26 10.60% 77.09 76.89 76.70 76.52 76.35 76.19 76.03 75.88 10.80% 75.79 75.59 75.39 75.20 75.03 74.86 74.70 74.55 11.00% 74.53 74.32 74.12 73.93 73.74 73.57 73.41 73.26 11.20% 73.30 73.08 72.88 72.68 72.50 72.32 72.15 72.00 11.40% 72.10 71.88 71.67 71.47 71.28 71.10 70.93 70.78 11.60% 70.93 70.71 70.49 70.29 70.10 69.92 69.75 69.59 11.80% 69.79 69.56 69.35 69.14 68.95 68.77 68.60 68.43 12.00% 68.68 68.45 68.23 68.03 67.83 67.65 67.47 67.31
SOURCE:Reproduced from Expanded Bond Value Tables, Pub. 83, copyright 1970, page 844, Financial Publishing Co., Boston, MA
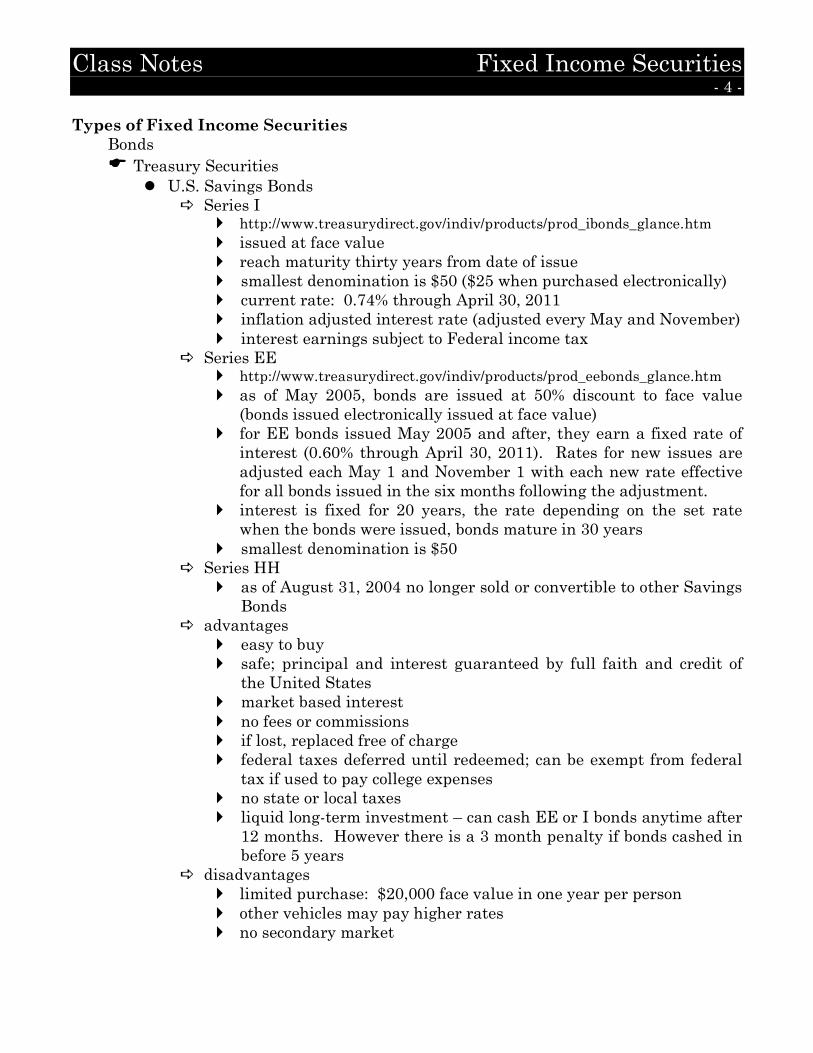
Class Notes Fixed Income Securities - 4 - Types of Fixed Income Securities Bonds Treasury Securities U.S. Savings Bonds Series I http://www.treasurydirect.gov/indiv/products/prod_ibonds_glance.htm issued at face value reach maturity thirty years from date of issue smallest denomination is $50 ($25 when purchased electronically) current rate: 0.74% through April 30, 2011 inflation adjusted interest rate (adjusted every May and November) interest earnings subject to Federal income tax Series EE http://www.treasurydirect.gov/indiv/products/prod_eebonds_glance.htm as of May 2005, bonds are issued at 50% discount to face value
(bonds issued electronically issued at face value) for EE bonds issued May 2005 and after, they earn a fixed rate of
interest (0.60% through April 30, 2011). Rates for new issues are adjusted each May 1 and November 1 with each new rate effective for all bonds issued in the six months following the adjustment.
interest is fixed for 20 years, the rate depending on the set rate when the bonds were issued, bonds mature in 30 years
smallest denomination is $50 Series HH as of August 31, 2004 no longer sold or convertible to other Savings
Bonds advantages easy to buy safe; principal and interest guaranteed by full faith and credit of
the United States market based interest no fees or commissions if lost, replaced free of charge federal taxes deferred until redeemed; can be exempt from federal
tax if used to pay college expenses no state or local taxes liquid long-term investment – can cash EE or I bonds anytime after
12 months. However there is a 3 month penalty if bonds cashed in before 5 years
disadvantages limited purchase: $20,000 face value in one year per person other vehicles may pay higher rates no secondary market
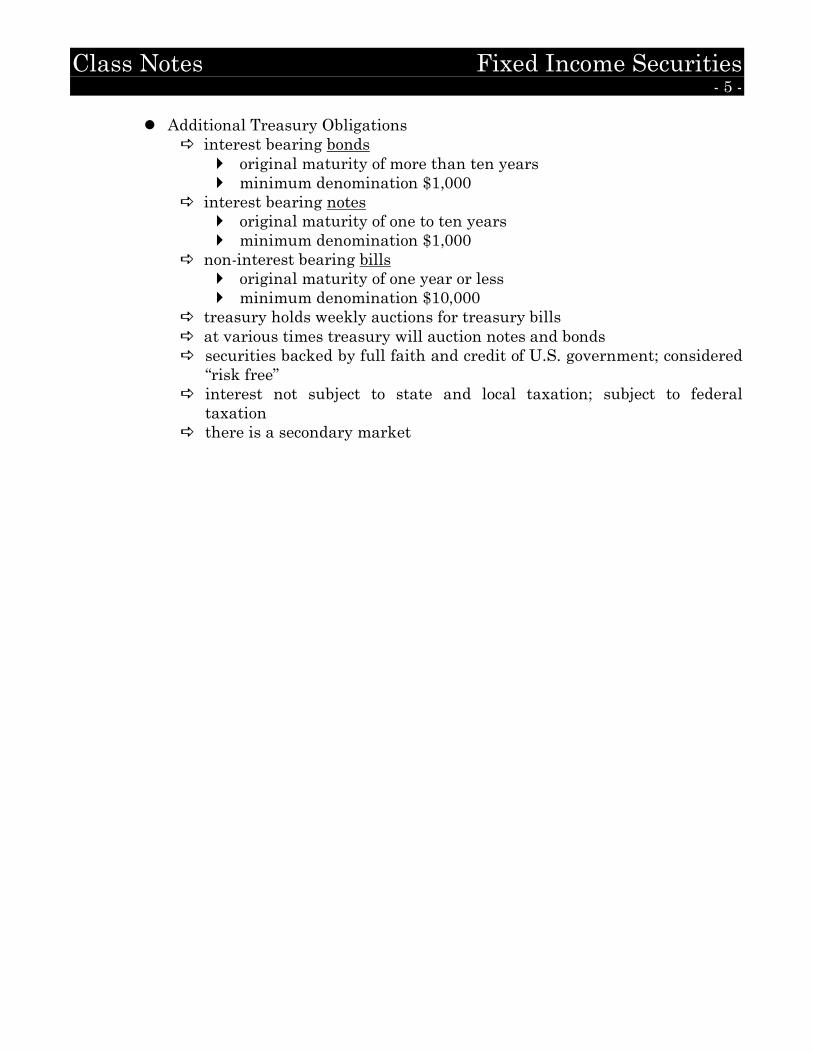
Class Notes Fixed Income Securities - 5 - Additional Treasury Obligations
interest bearing bonds original maturity of more than ten years minimum denomination $1,000
interest bearing notes original maturity of one to ten years
minimum denomination $1,000
non-interest bearing bills original maturity of one year or less minimum denomination $10,000
treasury holds weekly auctions for treasury bills
at various times treasury will auction notes and bonds securities backed by full faith and credit of U.S. government; considered
“risk free”
interest not subject to state and local taxation; subject to federal taxation
there is a secondary market
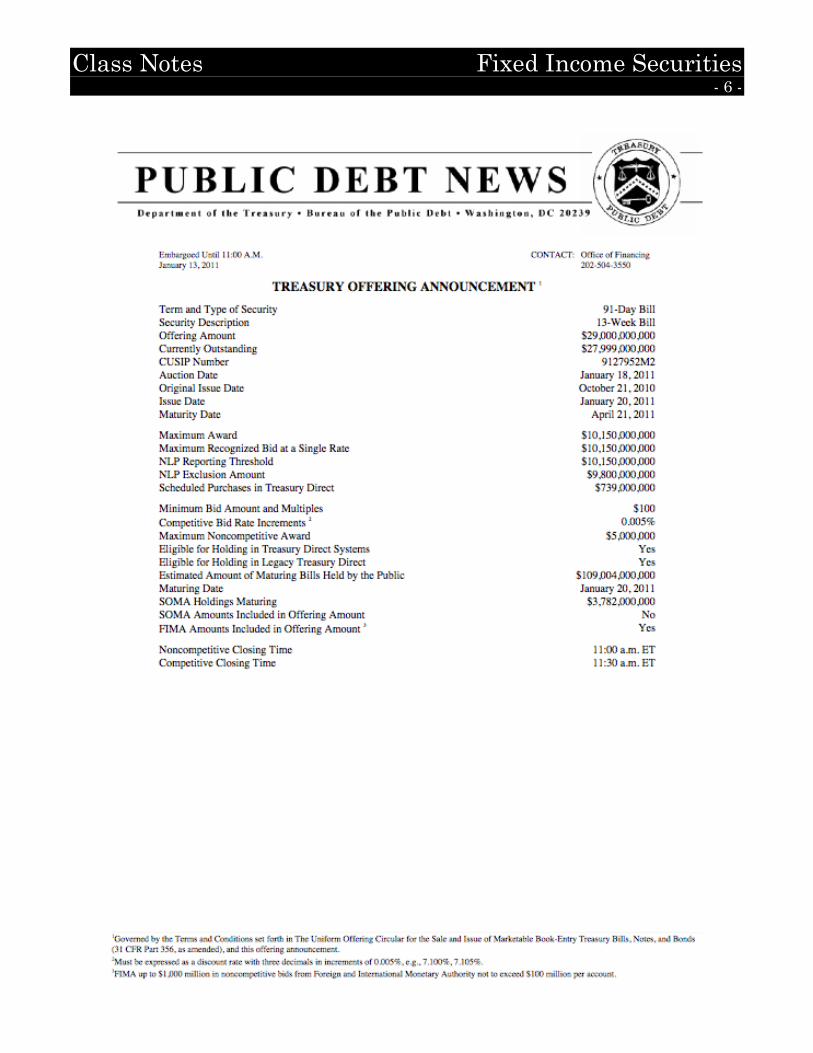
Class Notes Fixed Income Securities - 6 -

Class Notes Fixed Income Securities - 7 -
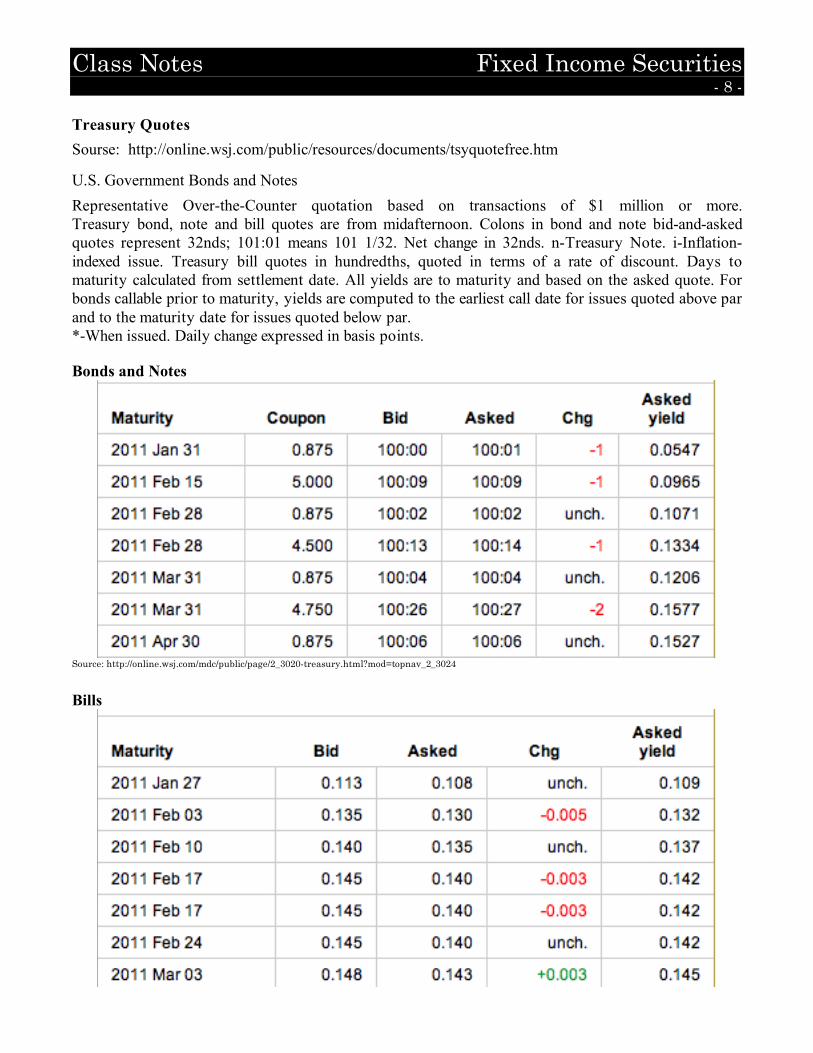
Class Notes Fixed Income Securities - 8 - Treasury Quotes Sourse: http://online.wsj.com/public/resources/documents/tsyquotefree.htm
U.S. Government Bonds and Notes Representative Over-the-Counter quotation based on transactions of $1 million or more. Treasury bond, note and bill quotes are from midafternoon. Colons in bond and note bid-and-asked quotes represent 32nds; 101:01 means 101 1/32. Net change in 32nds. n-Treasury Note. i-Inflation-indexed issue. Treasury bill quotes in hundredths, quoted in terms of a rate of discount. Days to maturity calculated from settlement date. All yields are to maturity and based on the asked quote. For bonds callable prior to maturity, yields are computed to the earliest call date for issues quoted above par and to the maturity date for issues quoted below par. *-When issued. Daily change expressed in basis points. Bonds and Notes
Source: http://online.wsj.com/mdc/public/page/2_3020-treasury.html?mod=topnav_2_3024
Bills

Class Notes Fixed Income Securities - 9 - Agency Bonds
bonds issued by political subdivisions of the U.S. government
some backed by full faith and credit of U.S.; others guaranteed by issuing agency
historically, agency issues have offered higher yields than treasury obligations
many are exempt from state and local taxes
secondary (OTC) market for agency bonds Municipal Bonds
bonds are the issue of states, counties, cities, and other political subdivisions such as school districts and water and sewer districts
two broad classes of bonds: general obligation and revenue
interest immune from federal income tax (capital gains are taxable)
due to tax advantage, interest rates on municipal bonds less than other comparable taxable bonds
secondary (OTC) market for municipal bonds Corporate Bonds
terms of corporate bonds vary as to security, risk, yield, and maturity
usual denomination $1,000
usual term 25 to 40 years
interest usually paid semiannually
secondary market (OTC and exchanges) Institutional Bonds
smallest segment of bond market
obligations marketed by variety of private, non-profit institutions schools, hospitals, churches secondary market almost nonexistent
Class Notes Fixed Income Securities - 10 -
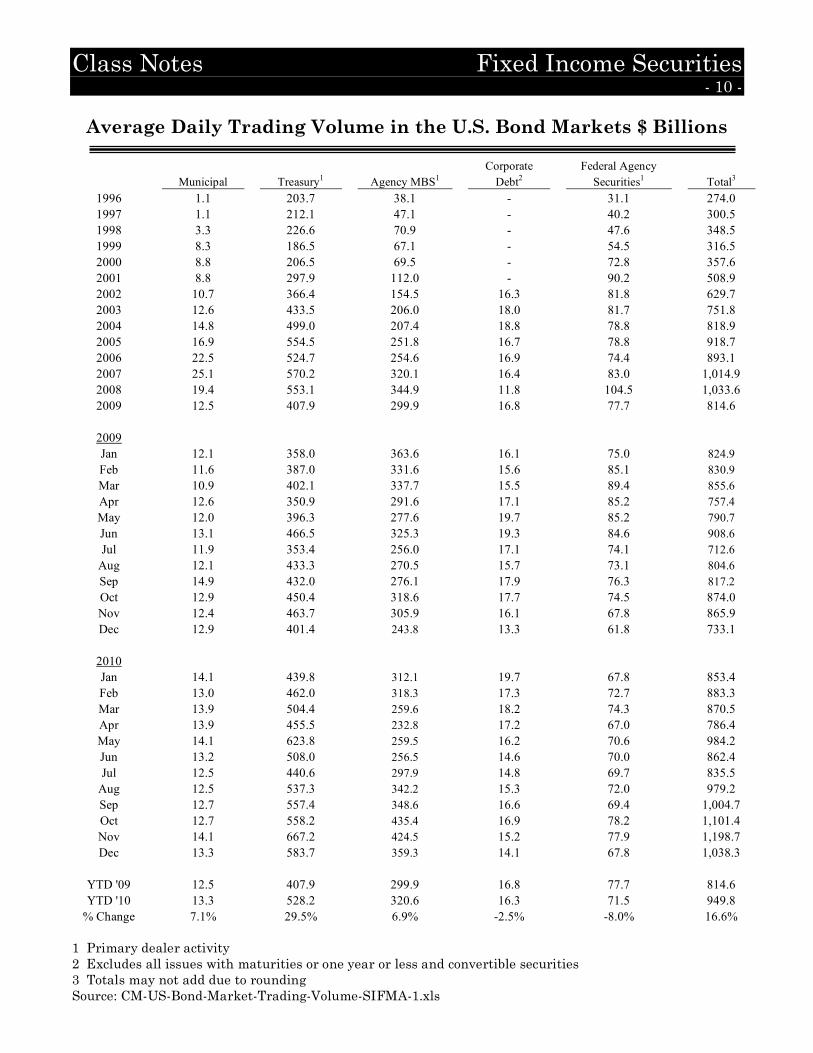
Average Daily Trading Volume in the U.S. Bond Markets $ Billions
Corporate Federal Agency Municipal Treasury1 Agency MBS1 Debt2 Securities1 Total3
1996 1.1 203.7 38.1 - 31.1 274.0 1997 1.1 212.1 47.1 - 40.2 300.5 1998 3.3 226.6 70.9 - 47.6 348.5 1999 8.3 186.5 67.1 - 54.5 316.5 2000 8.8 206.5 69.5 - 72.8 357.6 2001 8.8 297.9 112.0 - 90.2 508.9 2002 10.7 366.4 154.5 16.3 81.8 629.7 2003 12.6 433.5 206.0 18.0 81.7 751.8 2004 14.8 499.0 207.4 18.8 78.8 818.9 2005 16.9 554.5 251.8 16.7 78.8 918.7 2006 22.5 524.7 254.6 16.9 74.4 893.1 2007 25.1 570.2 320.1 16.4 83.0 1,014.9 2008 19.4 553.1 344.9 11.8 104.5 1,033.6 2009 12.5 407.9 299.9 16.8 77.7 814.6
2009 Jan 12.1 358.0 363.6 16.1 75.0 824.9 Feb 11.6 387.0 331.6 15.6 85.1 830.9 Mar 10.9 402.1 337.7 15.5 89.4 855.6 Apr 12.6 350.9 291.6 17.1 85.2 757.4 May 12.0 396.3 277.6 19.7 85.2 790.7 Jun 13.1 466.5 325.3 19.3 84.6 908.6 Jul 11.9 353.4 256.0 17.1 74.1 712.6
Aug 12.1 433.3 270.5 15.7 73.1 804.6 Sep 14.9 432.0 276.1 17.9 76.3 817.2 Oct 12.9 450.4 318.6 17.7 74.5 874.0 Nov 12.4 463.7 305.9 16.1 67.8 865.9 Dec 12.9 401.4 243.8 13.3 61.8 733.1
2010 Jan 14.1 439.8 312.1 19.7 67.8 853.4 Feb 13.0 462.0 318.3 17.3 72.7 883.3 Mar 13.9 504.4 259.6 18.2 74.3 870.5 Apr 13.9 455.5 232.8 17.2 67.0 786.4 May 14.1 623.8 259.5 16.2 70.6 984.2 Jun 13.2 508.0 256.5 14.6 70.0 862.4 Jul 12.5 440.6 297.9 14.8 69.7 835.5
Aug 12.5 537.3 342.2 15.3 72.0 979.2 Sep 12.7 557.4 348.6 16.6 69.4 1,004.7 Oct 12.7 558.2 435.4 16.9 78.2 1,101.4 Nov 14.1 667.2 424.5 15.2 77.9 1,198.7 Dec 13.3 583.7 359.3 14.1 67.8 1,038.3
YTD '09 12.5 407.9 299.9 16.8 77.7 814.6 YTD '10 13.3 528.2 320.6 16.3 71.5 949.8
% Change 7.1% 29.5% 6.9% -2.5% -8.0% 16.6% 1 Primary dealer activity 2 Excludes all issues with maturities or one year or less and convertible securities 3 Totals may not add due to rounding Source: CM-US-Bond-Market-Trading-Volume-SIFMA-1.xls

Class Notes Fixed Income Securities - 11 - Evaluation of Bonds
Major bond rating agencies Moody’s Standard & Poors Fitch Ratings
BOND RATINGS
Credit Risk Moody's Standard
and Poor's
Fitch Ratings
Investment Grade
Highest Quality Aaa AAA AAA High Quality Aa AA AA Upper Medium A A A Medium Baa BBB BBB
Not Investment Grade Lower Medium Ba BB BB Lower Grade B B B Poor Grade Caa CCC CCC Speculative Ca CC CC No Payments / Bankruptcy C D C In Default C D D
Note to Bond Rating Table: Moody's uses a modifier of 1, 2 or 3 to show relative
standing in a category. Standard and Poor's and Fitch Ratings use a modifier of plus or minus.

Class Notes Fixed Income Securities - 12 -
Evaluation of Bonds (continued) Inadequacy of ratings
every bond in a category not necessarily of equal quality rating agencies sometimes differ in evaluation of some issues raters are too slow in changing ratings raters may be influenced by profit motive Deficiencies of historical rate of returns
studies of investment returns must have beginning and closing date: choice of these dates may influence results
historical rate of return cannot be taken as indicative of future rate of return
your investments are in specific securities, not “average security”; rates of return for specific securities vary greatly

Class Notes Fixed Income Securities - 13 - Preferred Stock Compared to bonds dividend amount fixed, but may be skipped (rarely) dividends on preferred stock lower claim than interest to bondholders Compared to common stock
dividends on preferred higher claim than dividends to common stockholders safer -- prior claim on assets unless participating stock, cannot provide access to higher earnings lacks substantial capital gains potential
Attraction to individual lower unit cost than bonds more frequent dividend payments (quarterly) than bond interest
(semiannually)
Attraction to corporation
substantial (70%) tax exemption