fixed income investing in individual bonds & separately ... year . more than 5,000 in ......
TRANSCRIPT
1
Investing in Individual Bonds & Separately Managed Accounts
Fixed Income
January 31, 2018
Fidelity Brokerage Services LLC, Member NYSE, SIPC 900 Salem Street, Smithfield, RI 02917 832020.1.0
2
Agenda
• Bond market context • Why invest in individual bonds? • Building and maintaining an individual bond portfolio • Investing in Separately Managed Accounts • Questions
3
2017 Bond Market Context
4
2017 Bond Market Recap
0%
2%
4%
6%
8%
10%
Hig
h Yi
eld
Cor
pora
te
Inve
stm
ent G
rade
Cor
pora
te
Mun
icip
al
Trea
sury
Infla
tion
Pro
tect
ed
Mor
tgag
e-Ba
cked
Trea
sury
Age
ncy
Ret
urn
(%)
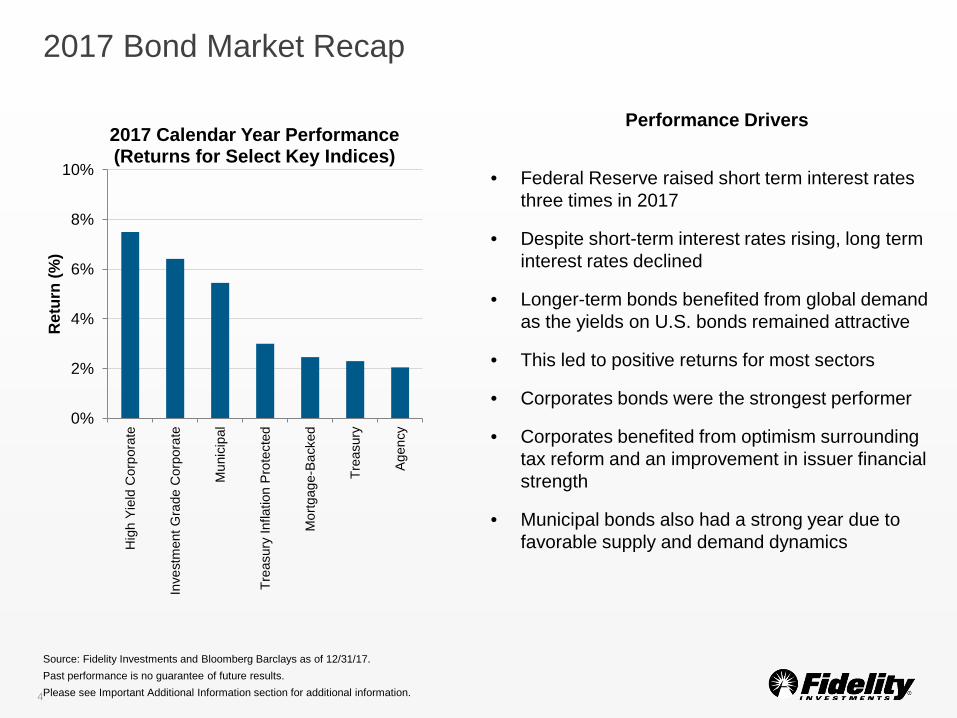
2017 Calendar Year Performance (Returns for Select Key Indices)
• Federal Reserve raised short term interest rates three times in 2017
• Despite short-term interest rates rising, long term interest rates declined
• Longer-term bonds benefited from global demand as the yields on U.S. bonds remained attractive
• This led to positive returns for most sectors
• Corporates bonds were the strongest performer
• Corporates benefited from optimism surrounding tax reform and an improvement in issuer financial strength
• Municipal bonds also had a strong year due to favorable supply and demand dynamics
Performance Drivers
Source: Fidelity Investments and Bloomberg Barclays as of 12/31/17. Past performance is no guarantee of future results. Please see Important Additional Information section for additional information.
5
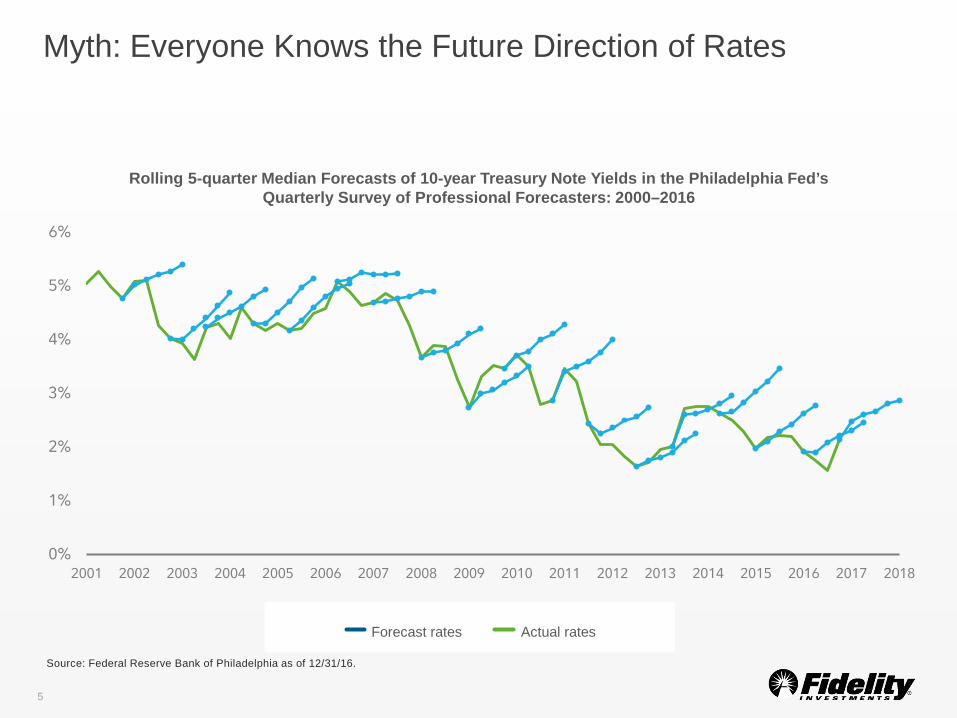
Myth: Everyone Knows the Future Direction of Rates
0%
1%
2%
3%
4%
5%
6%
2001 2002 2003 2004 2005 2006 2007 2008 2009 2010 2011 2012 2013 2014 2015 2016 2017 2018
Forecast rates Actual rates
Rolling 5-quarter Median Forecasts of 10-year Treasury Note Yields in the Philadelphia Fed’s Quarterly Survey of Professional Forecasters: 2000–2016
Source: Federal Reserve Bank of Philadelphia as of 12/31/16.

6
Why Invest in Individual Bonds?
7
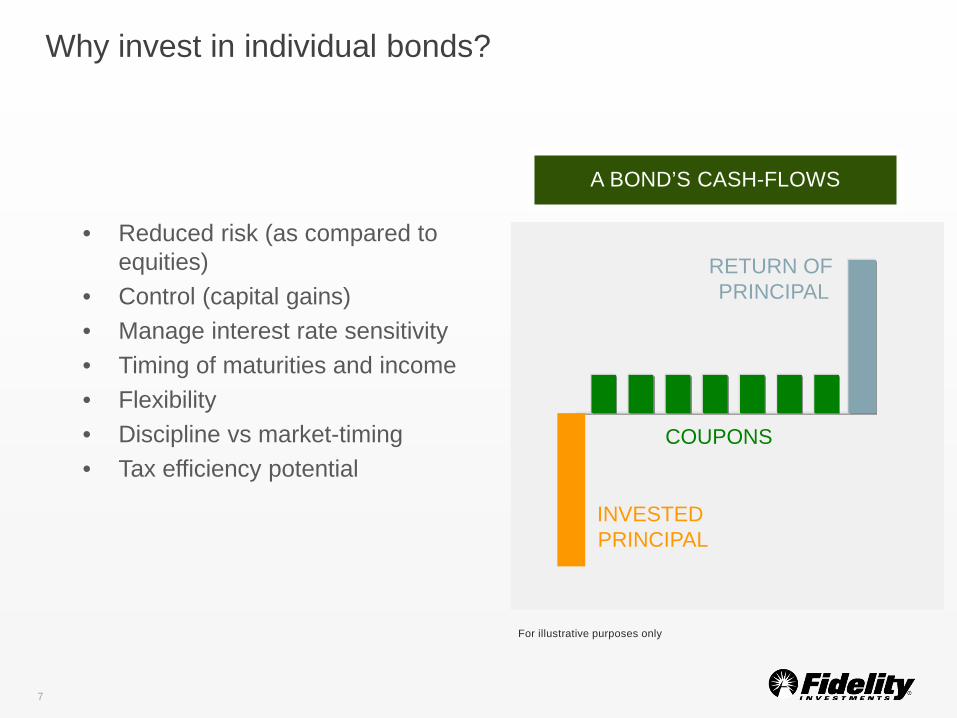
Why invest in individual bonds?
• Reduced risk (as compared to equities)
• Control (capital gains) • Manage interest rate sensitivity • Timing of maturities and income • Flexibility • Discipline vs market-timing • Tax efficiency potential
INVESTED PRINCIPAL
COUPONS
RETURN OF PRINCIPAL
A BOND’S CASH-FLOWS
For illustrative purposes only
8
Investing in Individual Bonds
9
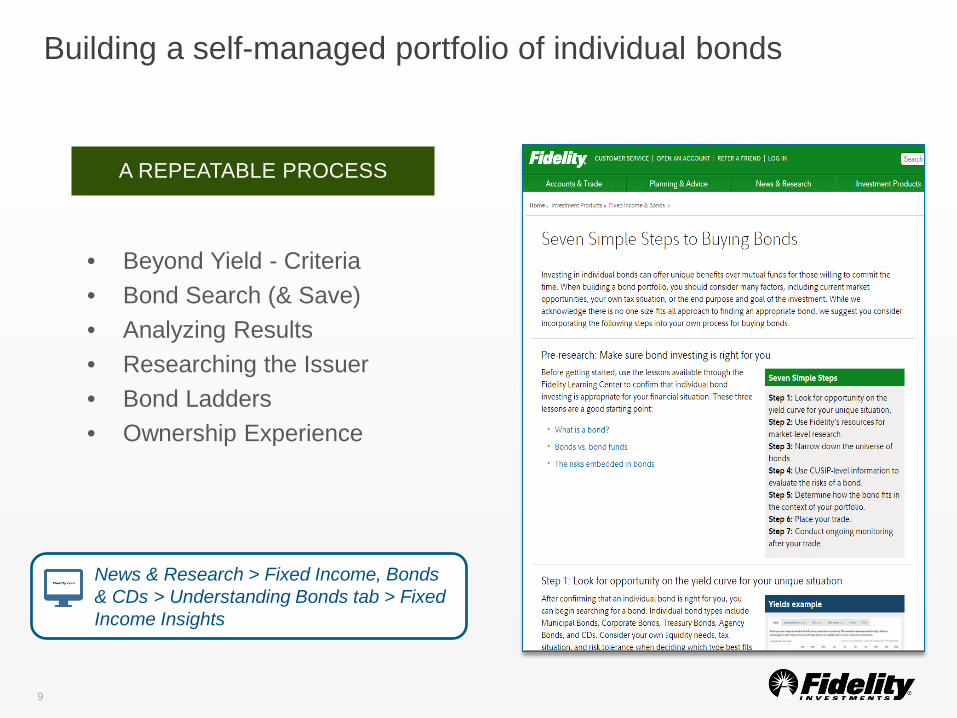
Building a self-managed portfolio of individual bonds
• Beyond Yield - Criteria • Bond Search (& Save) • Analyzing Results • Researching the Issuer • Bond Ladders • Ownership Experience
A REPEATABLE PROCESS
News & Research > Fixed Income, Bonds & CDs > Understanding Bonds tab > Fixed Income Insights
10
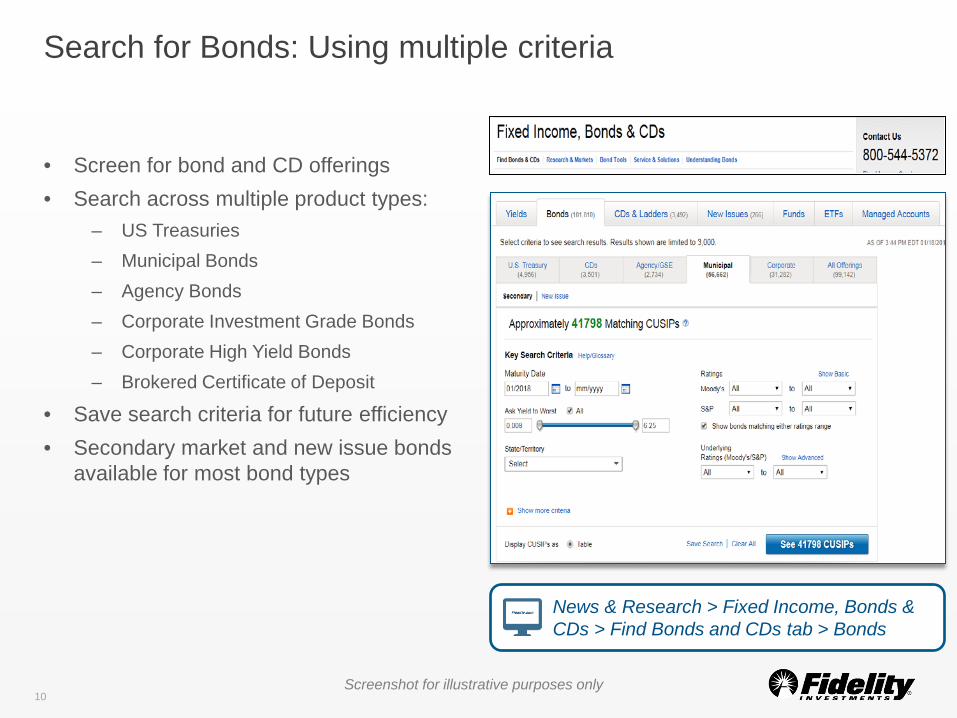
• Screen for bond and CD offerings • Search across multiple product types:
– US Treasuries – Municipal Bonds – Agency Bonds – Corporate Investment Grade Bonds – Corporate High Yield Bonds – Brokered Certificate of Deposit
• Save search criteria for future efficiency • Secondary market and new issue bonds
available for most bond types
Search for Bonds: Using multiple criteria
News & Research > Fixed Income, Bonds & CDs > Find Bonds and CDs tab > Bonds
Screenshot for illustrative purposes only
11
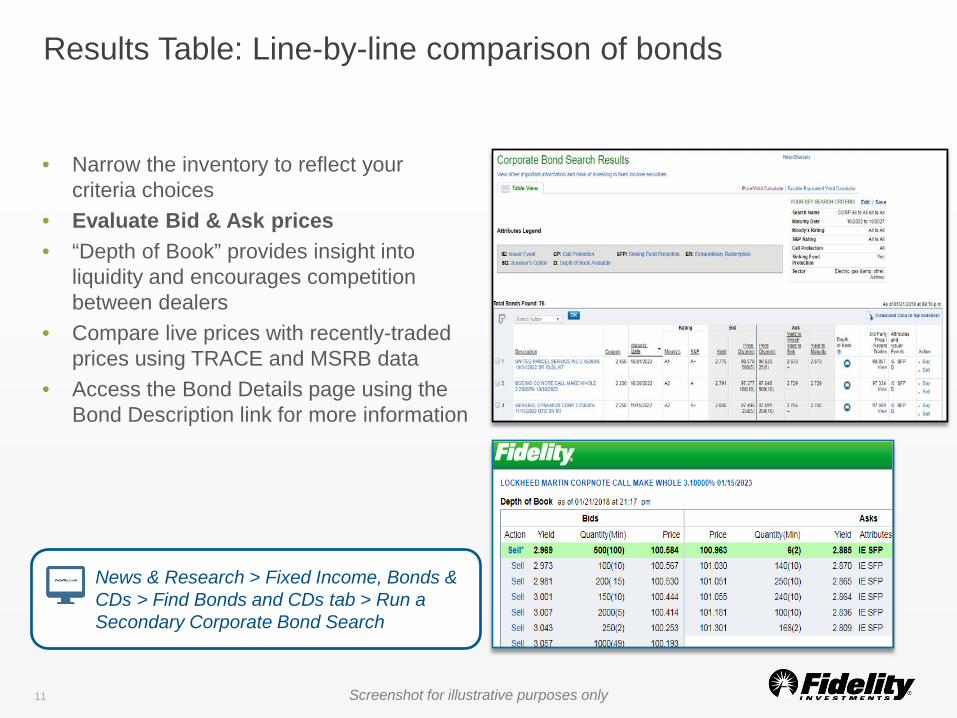
• Narrow the inventory to reflect your criteria choices
• Evaluate Bid & Ask prices • “Depth of Book” provides insight into
liquidity and encourages competition between dealers
• Compare live prices with recently-traded prices using TRACE and MSRB data
• Access the Bond Details page using the Bond Description link for more information
Results Table: Line-by-line comparison of bonds
Screenshot for illustrative purposes only
News & Research > Fixed Income, Bonds & CDs > Find Bonds and CDs tab > Run a Secondary Corporate Bond Search
12
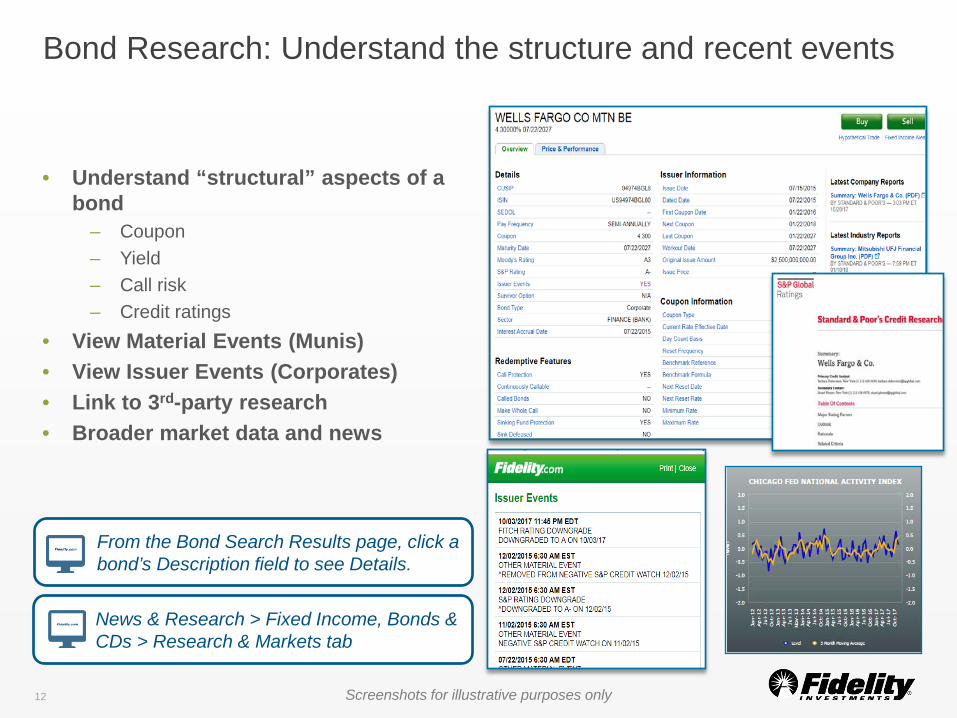
• Understand “structural” aspects of a
bond – Coupon – Yield – Call risk – Credit ratings
• View Material Events (Munis) • View Issuer Events (Corporates) • Link to 3rd-party research • Broader market data and news
Bond Research: Understand the structure and recent events
From the Bond Search Results page, click a bond’s Description field to see Details.
Screenshots for illustrative purposes only
News & Research > Fixed Income, Bonds & CDs > Research & Markets tab
13
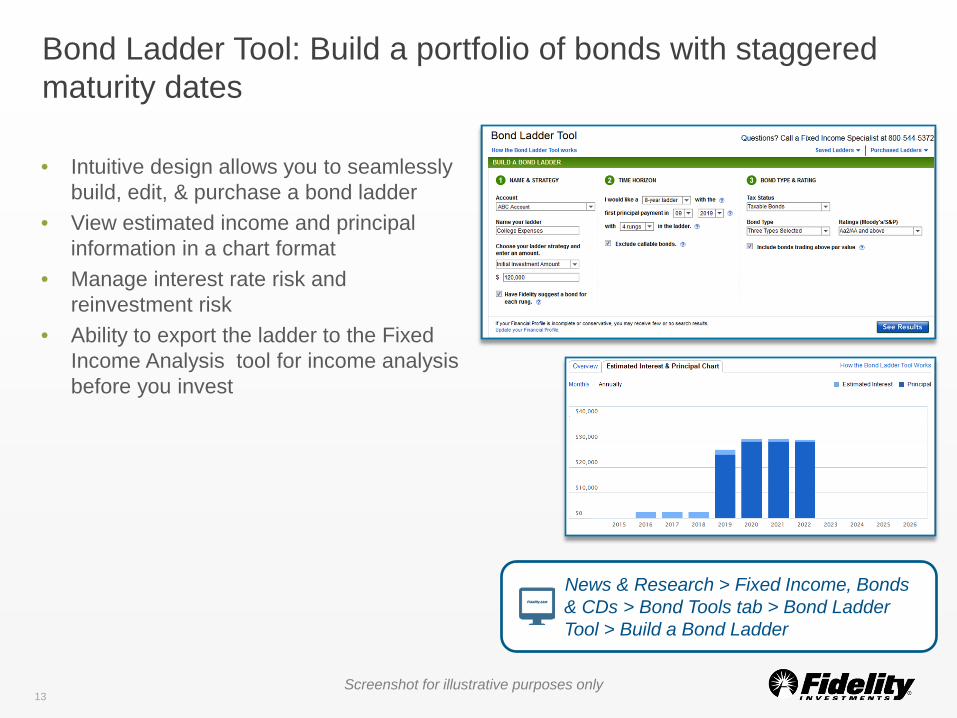
• Intuitive design allows you to seamlessly build, edit, & purchase a bond ladder
• View estimated income and principal information in a chart format
• Manage interest rate risk and reinvestment risk
• Ability to export the ladder to the Fixed Income Analysis tool for income analysis before you invest
Bond Ladder Tool: Build a portfolio of bonds with staggered maturity dates
News & Research > Fixed Income, Bonds & CDs > Bond Tools tab > Bond Ladder Tool > Build a Bond Ladder
Screenshot for illustrative purposes only
14
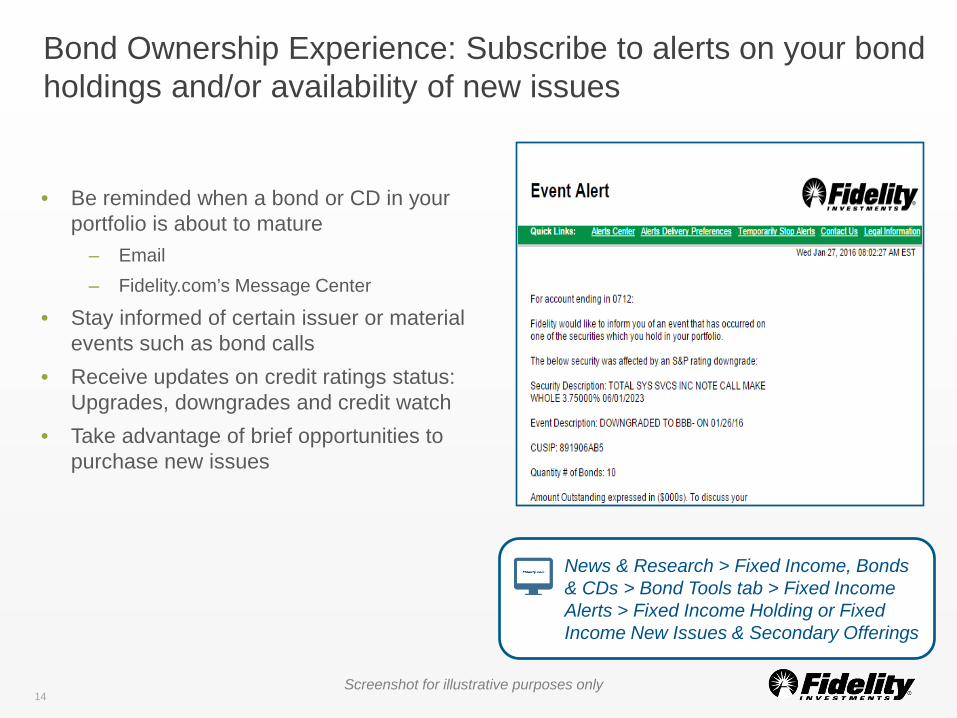
• Be reminded when a bond or CD in your portfolio is about to mature
– Email – Fidelity.com’s Message Center
• Stay informed of certain issuer or material events such as bond calls
• Receive updates on credit ratings status: Upgrades, downgrades and credit watch
• Take advantage of brief opportunities to purchase new issues
News & Research > Fixed Income, Bonds & CDs > Bond Tools tab > Fixed Income Alerts > Fixed Income Holding or Fixed Income New Issues & Secondary Offerings
Screenshot for illustrative purposes only
Bond Ownership Experience: Subscribe to alerts on your bond holdings and/or availability of new issues
15
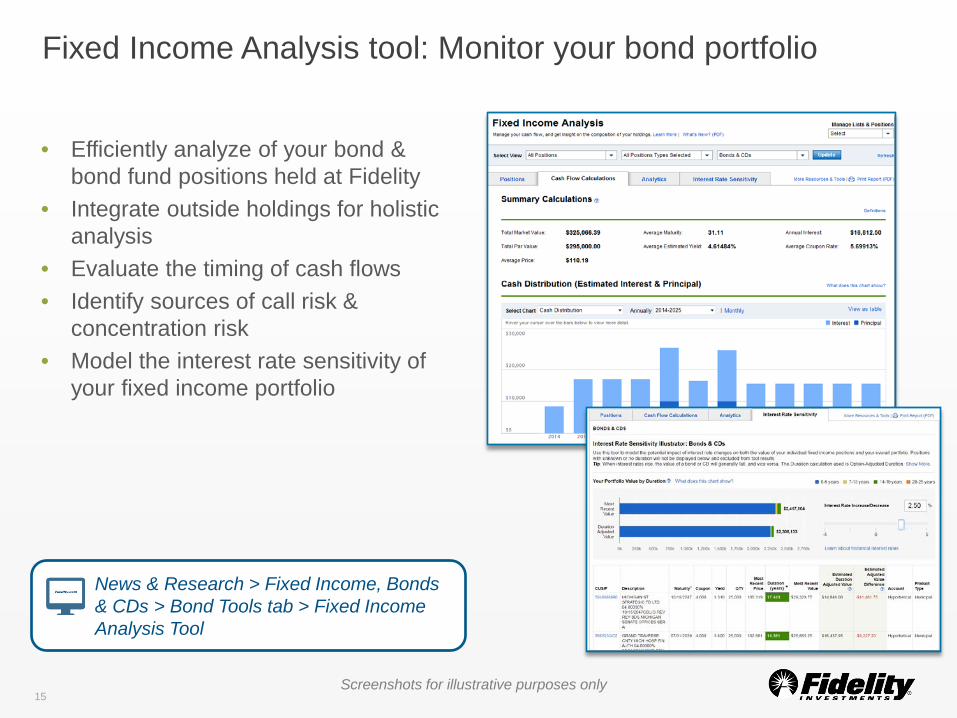
• Efficiently analyze of your bond & bond fund positions held at Fidelity
• Integrate outside holdings for holistic analysis
• Evaluate the timing of cash flows • Identify sources of call risk &
concentration risk • Model the interest rate sensitivity of
your fixed income portfolio
Fixed Income Analysis tool: Monitor your bond portfolio
News & Research > Fixed Income, Bonds & CDs > Bond Tools tab > Fixed Income Analysis Tool
Screenshots for illustrative purposes only
16
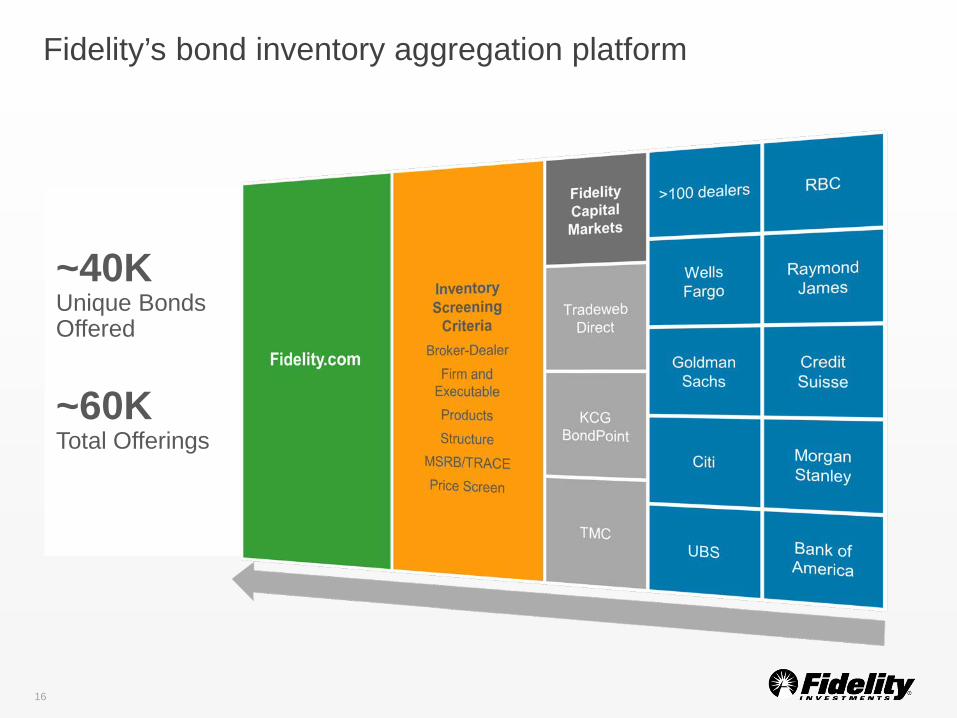
~40K Unique Bonds Offered ~60K Total Offerings
Fidelity’s bond inventory aggregation platform
17
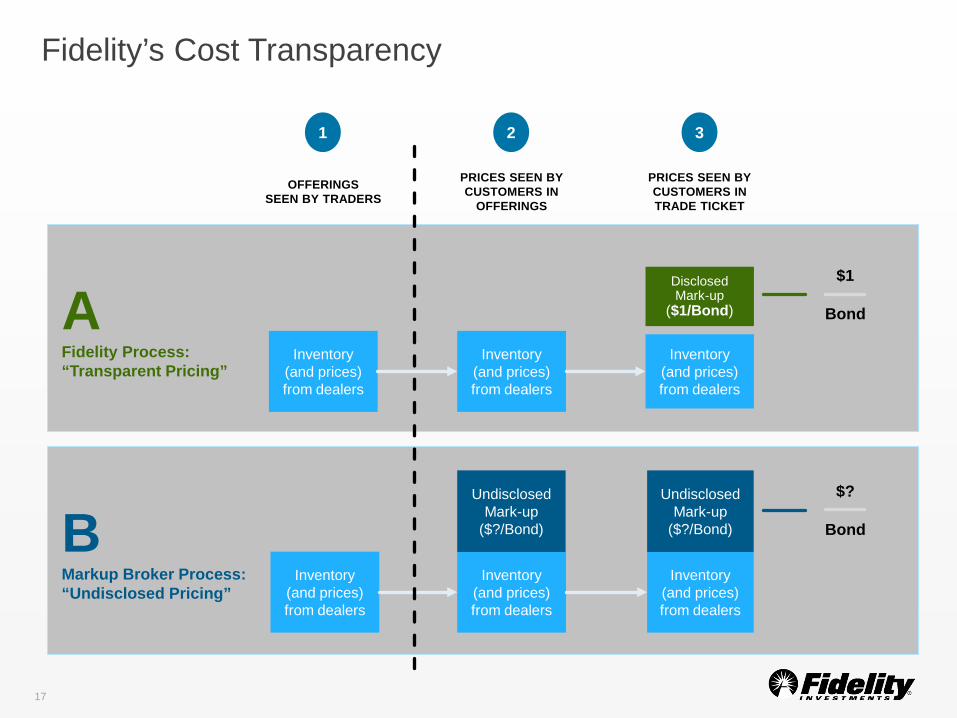
A Fidelity Process: “Transparent Pricing”
OFFERINGS SEEN BY TRADERS
PRICES SEEN BY CUSTOMERS IN
OFFERINGS
PRICES SEEN BY CUSTOMERS IN TRADE TICKET
B Markup Broker Process: “Undisclosed Pricing”
Inventory (and prices) from dealers
Inventory (and prices) from dealers
Disclosed Mark-up
($1/Bond)
Inventory (and prices) from dealers
$1
Bond
1 2 3
Inventory (and prices) from dealers
Inventory (and prices) from dealers
Inventory (and prices) from dealers
Undisclosed Mark-up
($?/Bond)
Undisclosed Mark-up
($?/Bond)
$?
Bond
Fidelity’s Cost Transparency

18
Investing in a Separately Managed Account (SMA)
Investing in a Separately Managed Account (SMA)
19
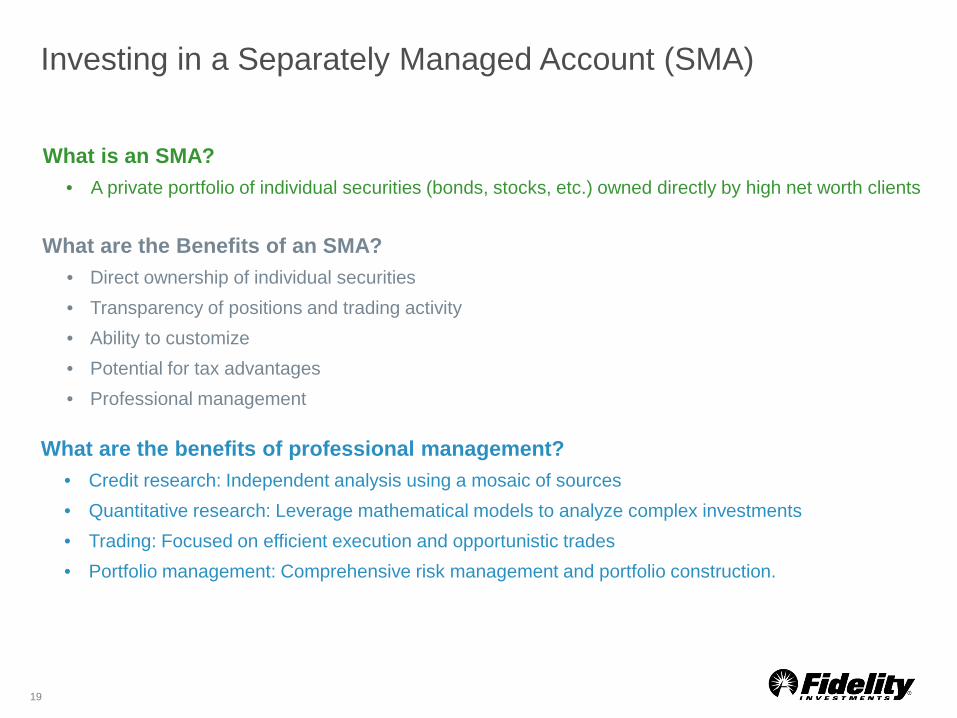
What are the Benefits of an SMA? • Direct ownership of individual securities • Transparency of positions and trading activity • Ability to customize • Potential for tax advantages • Professional management
What are the benefits of professional management? • Credit research: Independent analysis using a mosaic of sources • Quantitative research: Leverage mathematical models to analyze complex investments • Trading: Focused on efficient execution and opportunistic trades • Portfolio management: Comprehensive risk management and portfolio construction.
What is an SMA? • A private portfolio of individual securities (bonds, stocks, etc.) owned directly by high net worth clients
Fidelity’s Global Footprint Offers Important Investment Insights
20
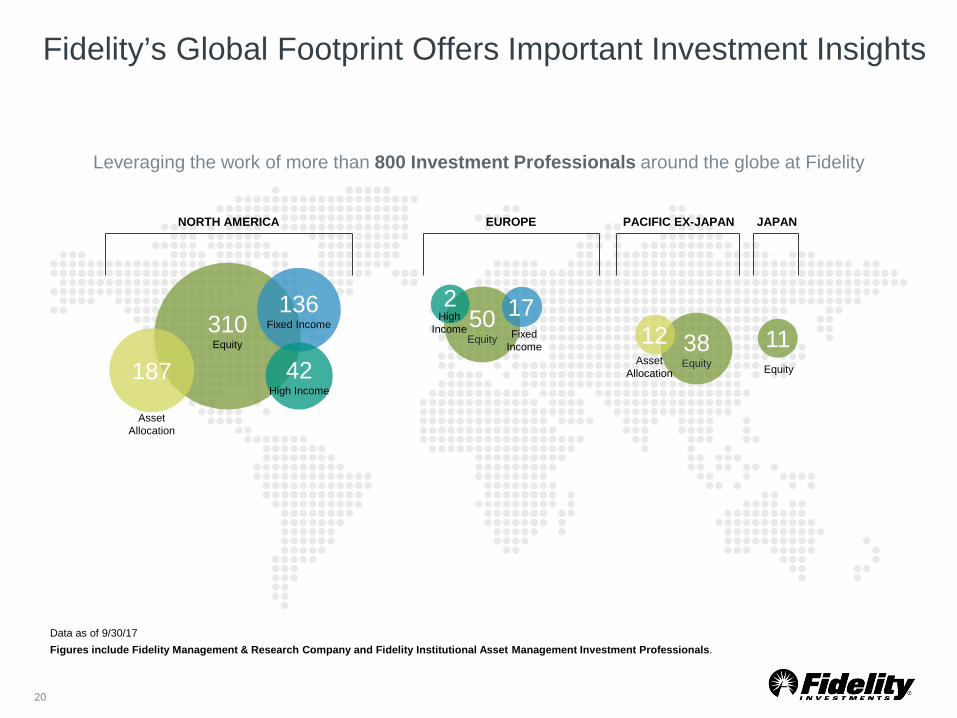
Data as of 9/30/17 Figures include Fidelity Management & Research Company and Fidelity Institutional Asset Management Investment Professionals.
Leveraging the work of more than 800 Investment Professionals around the globe at Fidelity
310 Equity
136 Fixed Income 50
Equity 38 Equity
12 11 187
Asset Allocation
Asset Allocation
Fixed Income
Equity
2
42 High Income
High Income
NORTH AMERICA EUROPE JAPAN PACIFIC EX-JAPAN
17
Dedicated Team Embedded in Broader Fixed Income Division
21
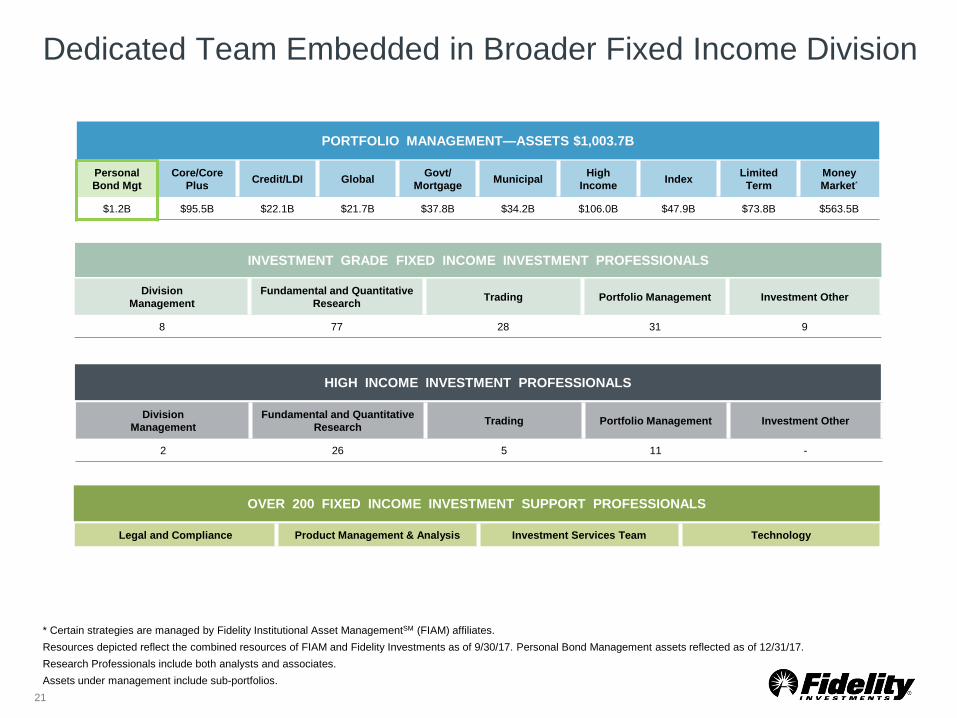
* Certain strategies are managed by Fidelity Institutional Asset ManagementSM (FIAM) affiliates. Resources depicted reflect the combined resources of FIAM and Fidelity Investments as of 9/30/17. Personal Bond Management assets reflected as of 12/31/17. Research Professionals include both analysts and associates. Assets under management include sub-portfolios.
PORTFOLIO MANAGEMENT—ASSETS $1,003.7B
INVESTMENT GRADE FIXED INCOME INVESTMENT PROFESSIONALS
Personal Bond Mgt
Core/Core Plus Credit/LDI Global Govt/
Mortgage Municipal High Income Index Limited
Term Money Market*
$1.2B $95.5B $22.1B $21.7B $37.8B $34.2B $106.0B $47.9B $73.8B $563.5B
Division Management
Fundamental and Quantitative Research Trading Portfolio Management Investment Other
8 77 28 31 9
HIGH INCOME INVESTMENT PROFESSIONALS
Division Management
Fundamental and Quantitative Research Trading Portfolio Management Investment Other
2 26 5 11 -
OVER 200 FIXED INCOME INVESTMENT SUPPORT PROFESSIONALS
Legal and Compliance Product Management & Analysis Investment Services Team Technology
Investment Success Requires In-Depth Research
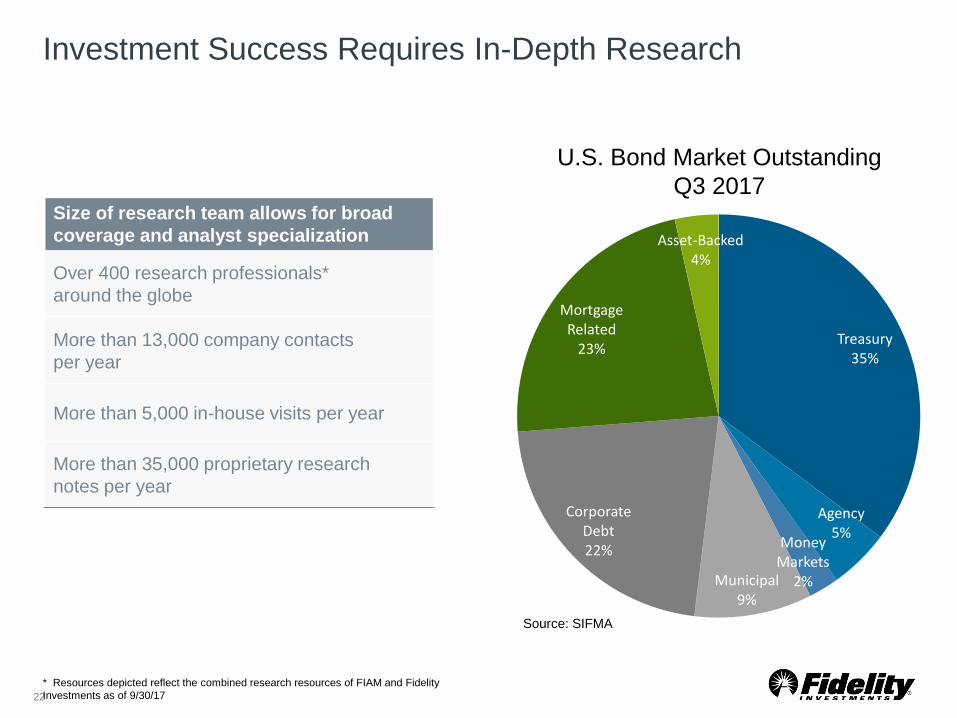
Treasury 35%
Agency 5% Money
Markets 2% Municipal
9%
Corporate Debt 22%
Mortgage Related
23%
Asset-Backed 4%
22
Size of research team allows for broad coverage and analyst specialization
Over 400 research professionals* around the globe
More than 13,000 company contacts per year
More than 5,000 in-house visits per year
More than 35,000 proprietary research notes per year
U.S. Bond Market Outstanding Q3 2017
* Resources depicted reflect the combined research resources of FIAM and Fidelity Investments as of 9/30/17
Source: SIFMA
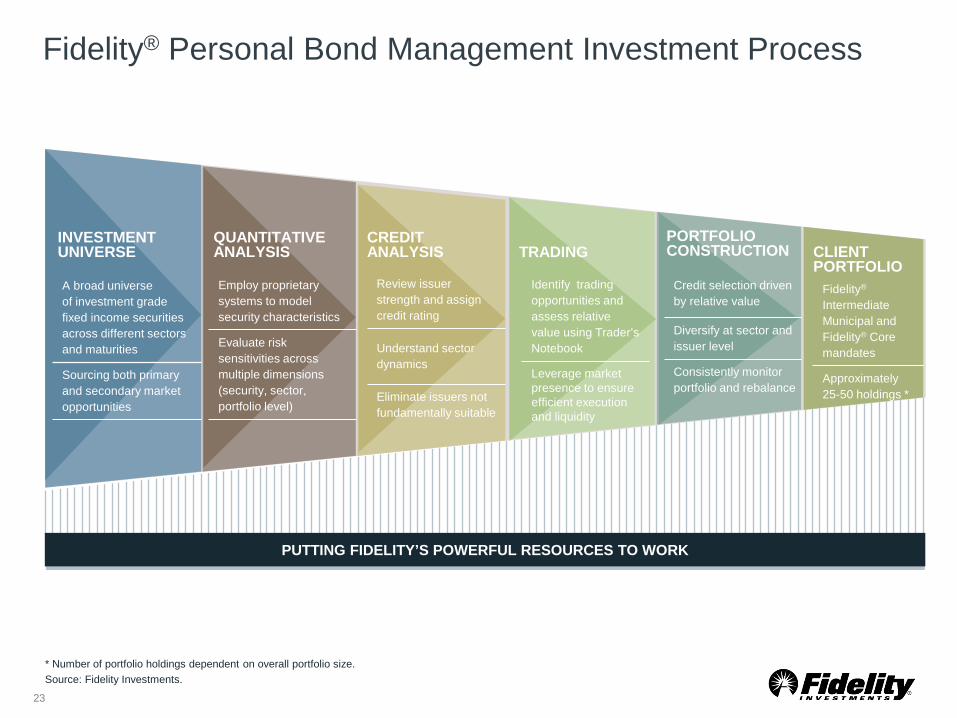
Fidelity® Personal Bond Management Investment Process
23
PUTTING FIDELITY’S POWERFUL RESOURCES TO WORK
INVESTMENT UNIVERSE
A broad universe of investment grade fixed income securities across different sectors and maturities
Sourcing both primary and secondary market opportunities
CREDIT ANALYSIS
Review issuer strength and assign credit rating
Understand sector dynamics
Eliminate issuers not fundamentally suitable
CLIENT PORTFOLIO
Fidelity® Intermediate Municipal and Fidelity® Core mandates
Approximately 25-50 holdings *
* Number of portfolio holdings dependent on overall portfolio size. Source: Fidelity Investments.
QUANTITATIVE ANALYSIS
Employ proprietary systems to model security characteristics
Evaluate risk sensitivities across multiple dimensions (security, sector, portfolio level)
PORTFOLIO CONSTRUCTION
Credit selection driven by relative value
Diversify at sector and issuer level
Consistently monitor portfolio and rebalance
TRADING
Identify trading opportunities and assess relative value using Trader’s Notebook
Leverage market presence to ensure efficient execution and liquidity
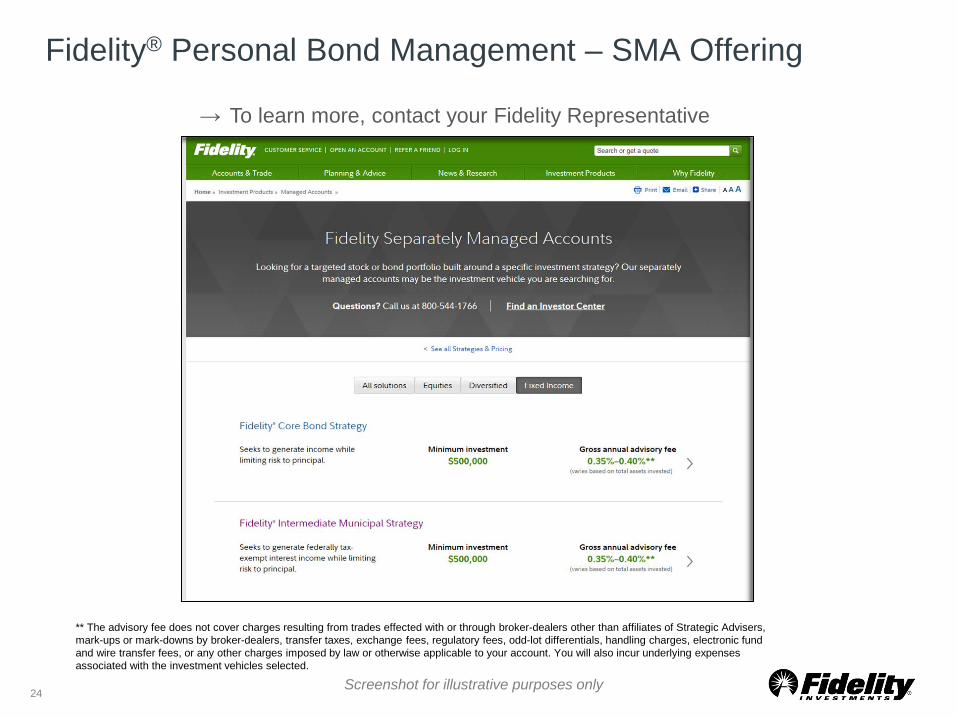
Fidelity® Personal Bond Management – SMA Offering
Screenshot for illustrative purposes only 24
→ To learn more, contact your Fidelity Representative
** The advisory fee does not cover charges resulting from trades effected with or through broker-dealers other than affiliates of Strategic Advisers, mark-ups or mark-downs by broker-dealers, transfer taxes, exchange fees, regulatory fees, odd-lot differentials, handling charges, electronic fund and wire transfer fees, or any other charges imposed by law or otherwise applicable to your account. You will also incur underlying expenses associated with the investment vehicles selected.
Summary
25
26
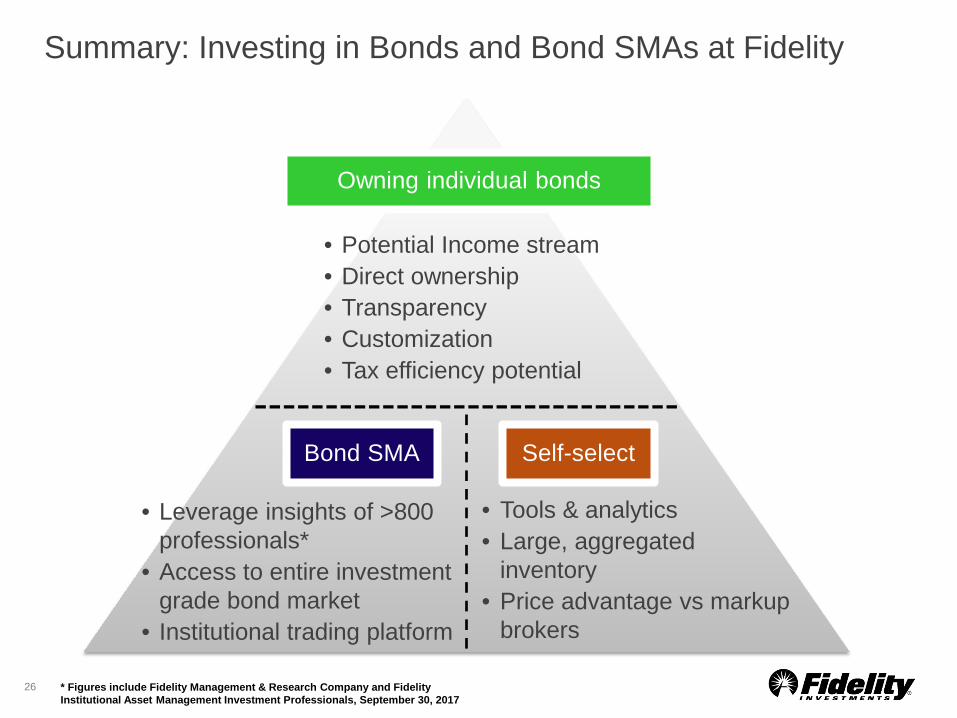
Summary: Investing in Bonds and Bond SMAs at Fidelity
------------------------------
• Potential Income stream • Direct ownership • Transparency • Customization • Tax efficiency potential
• Leverage insights of >800
professionals* • Access to entire investment
grade bond market • Institutional trading platform
• Tools & analytics • Large, aggregated
inventory • Price advantage vs markup
brokers
Owning individual bonds
Bond SMA Self-select
* Figures include Fidelity Management & Research Company and Fidelity Institutional Asset Management Investment Professionals, September 30, 2017
Important Additional Information
Market Indices
* Index returns on slide 4 represented by: Agency – Bloomberg Barclays U.S. Agency Index; Credit – Bloomberg Barclays U.S. Credit Bond Index; High Yield – BofA ML U.S. High Yield Index; MBS (Mortgage-Backed Securities) – Bloomberg Barclays MBS Index; Municipal – Bloomberg Barclays Municipal Bond Index; TIPS (Treasury Inflation-Protected Securities) – Bloomberg Barclays U.S. TIPS Index; Treasuries – Bloomberg Barclays U.S. Treasury Index. The index performance includes the reinvestment of dividends and interest income. It is not possible to invest directly in an index. All market indices are unmanaged. Index performance is not meant to represent that of any Fidelity mutual fund. Securities indices are not subject to fees and expenses typically associated with managed accounts or investment funds.
Bloomberg Barclays Municipal Bond Index is a market value-weighted index of investment-grade municipal bonds with maturities of one year or more.
Bloomberg Barclays U.S. Agency Bond Index is a market value-weighted index of U.S. Agency government and investment-grade corporate fixed-rate debt issues.
Bloomberg Barclays U.S. Credit Bond Index is a market value-weighted index of investment-grade corporate fixed-rate debt issues with maturities of one year or more.
Bloomberg Barclays U.S. Corporate High Yield Bond Index is a market value-weighted index that covers the universe of dollar-denominated, fixed-rate, non-investment grade debt.
Bloomberg Barclays U.S. MBS Index is a market value-weighted index of fixed-rate securities that represent interests in pools of mortgage loans, including balloon mortgages, with original terms of 15 and 30 years that are issued by the Government National Mortgage Association (GNMA), the Federal National Mortgage Association (FNMA), and the Federal Home Loan Mortgage Corp. (FHLMC). Bloomberg Barclays U.S. Treasury Inflation-Protected Securities (TIPS) Index (Series-L) is a market value-weighted index that measures the performance of inflation-protected securities issued by the U.S. Treasury. Bloomberg Barclays U.S. Treasury Bond Index is a market value-weighted index of public obligations of the U.S. Treasury with maturities of one year or more.
27
Important Additional Information (Cont’d)
28
Minimum concessions of $19.95 apply if traded with a Fidelity representative. For U.S. Treasury purchases traded with a Fidelity representative, a flat charge of $19.95 per trade applies. A $250 maximum applies to all trades, reduced to a $50 maximum for bonds maturing in one year or less. Fixed income trading requires a Fidelity brokerage account with a minimum opening balance of $2,500. Rates are for U.S. dollar–denominated bonds; additional fees and minimums apply for non-dollar bond trades. Other conditions may apply; see Fidelity.com/commissions for details. Please note that concessions may affect the total cost of the transaction and the total, or "effective," yield of your investment. The offering broker, which may be our affiliate National Financial Services LLC, may separately mark up or mark down the price of the security and may realize a trading profit or loss on the transaction. Any screenshots, charts, or company trading symbols mentioned, are provided for illustrative purposes only and should not be considered an offer to sell, a solicitation of an offer to buy, or a recommendation for the security. In general the bond market is volatile, and fixed income securities carry interest rate risk. (As interest rates rise, bond prices usually fall, and vice versa. This effect is usually more pronounced for longer-term securities.) Fixed income securities also carry inflation risk, liquidity risk, call risk and credit and default risks for both issuers and counterparties. Unlike individual bonds, most bond funds do not have a maturity date, so avoiding losses caused by price volatility by holding them until maturity is not possible. Any fixed income security sold or redeemed prior to maturity may be subject to a substantial gain or loss. The Fixed Income Analysis tool, and Bond Ladder tool are designed for educational purposes only and you should not rely on them as the primary basis for your investment, financial or tax planning decisions. A bond ladder, depending on the types and amount of securities within it, may not ensure adequate diversification of your investment portfolio. While diversification does not ensure a profit or guarantee against loss, a lack of diversification may result in heightened volatility of your portfolio value. You must perform your own evaluation as to whether a bond ladder and the securities held within it are consistent with your investment objectives, risk tolerance, and financial circumstances. To learn more about diversification and its effects on your portfolio, contact a representative. Fidelity® Strategic Disciplines is a service of Strategic Advisers, Inc., a registered investment adviser and a Fidelity Investments company. Fidelity® Strategic Disciplines includes the Fidelity® Intermediate Municipal Strategy and the Fidelity® Core Bond Strategy. These discretionary money management services are provided for a fee. Brokerage services are provided by Fidelity Brokerage Services LLC. Custody and other services are provided by National Financial Services LLC. Both are Fidelity Investments companies and members of NYSE and SIPC. © 2018 FMR LLC. All rights reserved. Fidelity Brokerage Services, Member NYSE, SIPC, 900 Salem Street, Smithfield, RI 02917. 832020.1.0

Questions
29
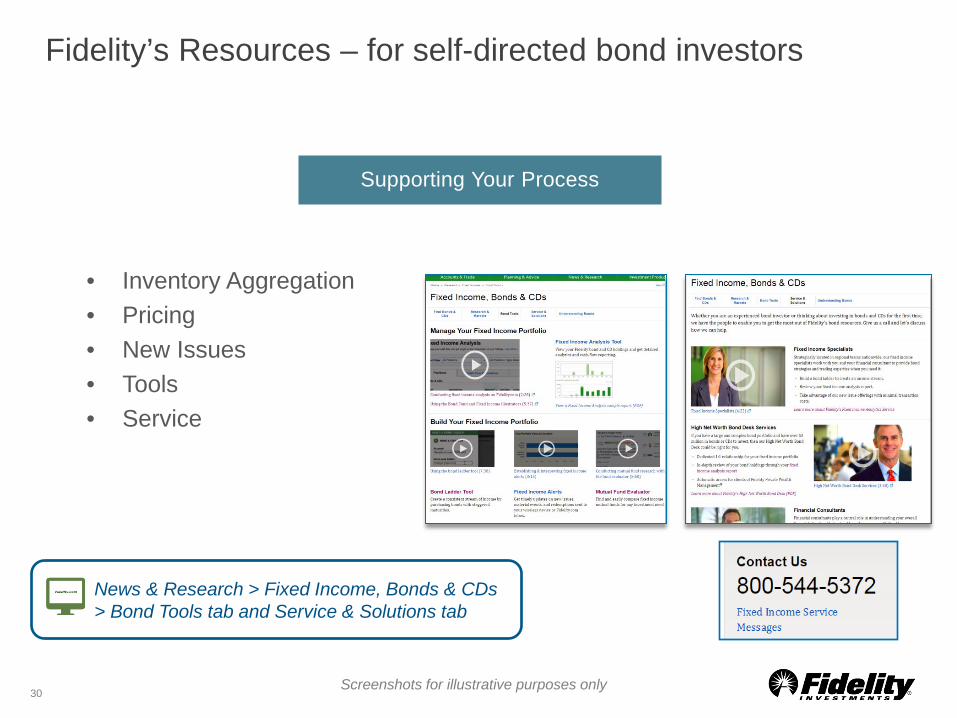
Fidelity’s Resources – for self-directed bond investors
• Inventory Aggregation • Pricing • New Issues • Tools • Service
Supporting Your Process
Screenshots for illustrative purposes only
News & Research > Fixed Income, Bonds & CDs > Bond Tools tab and Service & Solutions tab
30