fisheries of the united states, 2012 - science & technology · updated information on how u.s....
TRANSCRIPT

About the ReportEach year NOAA Fisheries compiles key fisheries statistics from the previous year into an annual snapshot documenting fishing’s importance to the nation. The 2012 report provides landings totals for both domestic recreational and commercial fisheries by species and allows us to track important indicators such as annual seafood consumption and the productivity of top fishing ports. These statistics provide valuable insights, but to fully understand the overall condition of our fisheries, they must be looked at in combination with other biological, social, and economic factors of ecosystem and ocean health.
Sustainable Fisheries, Jobs, and the EconomyFisheries, whether for commerce or recreation, play an enormous role in the U.S. economy. In 2012, U.S. commercial fishermen landed 9.6 billion pounds of seafood valued at $5.1 billion. Fish processors, icehouses, restaurants, grocery stores, bait and tackle shops, fuel stations, and a multitude of other businesses benefit from healthy commercial and recreational fishing.
Healthy Stocks Mean Healthy EconomiesContinuing to maintain high commercial fish landings and values is good news for fishermen, fishing communities, and for the Americans who want sustainable, healthy U.S. seafood. We are seeing that responsible management is helping us “turn the corner” towards more sustainable and profitable commercial fisheries.
Fisheries of the United States, 2012A Statistical Snapshot of 2012 Fish Landings
NOAA Fisheries releases its annual summary report on U.S. recreational and commercial fishery landings.
U.S. Fisheries Facts• U.S.commercialfishermenlanded9.6billionpoundsofseafoodvaluedat$5.1billion.
• DutchHarbor,AlaskaandNewBedford,Massachusettsremainthetopcommercialfishingports
• Approximately9.4millionsaltwaterrecreationalanglerstookover70milliontripsandcaughtnearly380millionfish,63percentofwhichwerereleased.
Regional HighlightsAlaska led all states in both volume and value of landings. New England also had a 7% increase in landings volume and value.
The top 5 states by volume of landings: The top 5 states by value of landings:1. Alaska (5.3 billion pounds) 1. Alaska ($1.7 billion)2. Louisiana (1.2 billion pounds) 2. Massachusetts ($618.2 million)3. Virginia (461.9 million pounds) 3. Maine ($448.5 million)4. Washington (420.1 million pounds) 4. Louisiana ($356.6 million)5. California (358.2 million pounds) 5. Washington ($302 million)
Recreational Fisheries LandingsRecreational anglers took 70 million trips and caught nearly 380 million fish in 2012. Over 60 percent of these fish were released alive. The estimated total weight of landed catch (almost 140 million fish) was over 200 million pounds. Spotted seatrout remains the top catch among saltwater anglers, with more than 43 million fish caught in 2012. Atlantic croaker, black sea bass, summer flounder, and red drum were among the other most commonly caught species in 2012.
Volume of U.S.Domestic Landings
1991-2012
Value of U.S.Domestic Landings
1991-2012
By the Numbers Commercial Fisheries LandingsU.S. commercial fishermen landed 9.6 billion pounds of seafood in 2012, valued at $5.1 billion. These figures represent small decreases in pounds (2.3 percent) and value (3.2 percent) over 2011, which had the highest landings volume over the last decade and highest value ever recorded. However, poundage and value continue to remain higher than the average of the preceding decade (9.2 billion pounds valued at $4.1 billion).
Trends Among Commercially Important Species
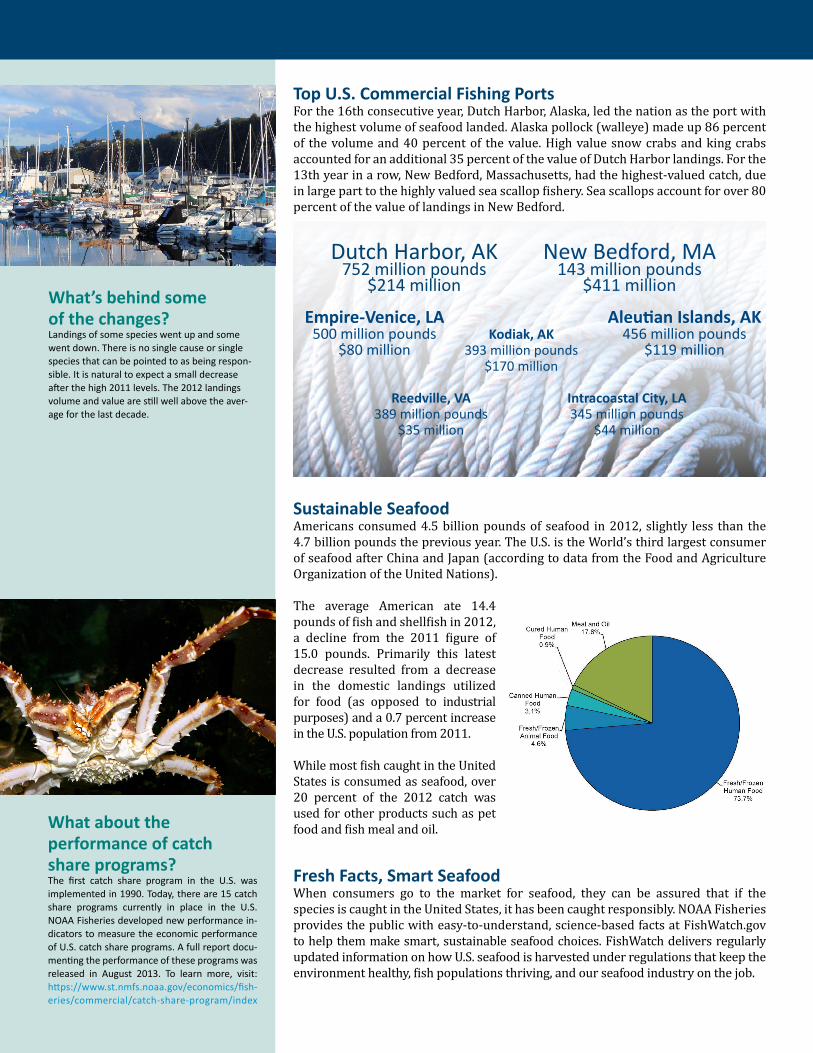
DutchHarbor,AK752millionpounds
$214million
NewBedford,MA143millionpounds
$411million
Empire-Venice, LA500millionpounds
$80million
Aleutian Islands, AK456millionpounds
$119million
Reedville, VA389millionpounds
$35million
Intracoastal City, LA345millionpounds
$44million
Top U.S. Commercial Fishing PortsFor the 16th consecutive year, Dutch Harbor, Alaska, led the nation as the port with the highest volume of seafood landed. Alaska pollock (walleye) made up 86 percent of the volume and 40 percent of the value. High value snow crabs and king crabs accounted for an additional 35 percent of the value of Dutch Harbor landings. For the 13th year in a row, New Bedford, Massachusetts, had the highest-valued catch, due in large part to the highly valued sea scallop fishery. Sea scallops account for over 80 percent of the value of landings in New Bedford.
Sustainable Seafood Americans consumed 4.5 billion pounds of seafood in 2012, slightly less than the 4.7 billion pounds the previous year. The U.S. is the World’s third largest consumer of seafood after China and Japan (according to data from the Food and Agriculture Organization of the United Nations). The average American ate 14.4 pounds of fish and shellfish in 2012, a decline from the 2011 figure of 15.0 pounds. Primarily this latest decrease resulted from a decrease in the domestic landings utilized for food (as opposed to industrial purposes) and a 0.7 percent increase in the U.S. population from 2011.
While most fish caught in the United States is consumed as seafood, over 20 percent of the 2012 catch was used for other products such as pet food and fish meal and oil.What about the
performance of catch share programs?The first catch share program in the U.S. wasimplementedin1990.Today,thereare15catchshare programs currently in place in the U.S.NOAAFisheriesdevelopednewperformancein-dicatorstomeasuretheeconomicperformanceofU.S.catchshareprograms.Afullreportdocu-mentingtheperformanceoftheseprogramswasreleased in August 2013. To learn more, visit:https://www.st.nmfs.noaa.gov/economics/fish-eries/commercial/catch-share-program/index
What’s behind some of the changes?Landingsofsomespecieswentupandsomewentdown.Thereisnosinglecauseorsinglespeciesthatcanbepointedtoasbeingrespon-sible.Itisnaturaltoexpectasmalldecreaseafterthehigh2011levels.The2012landingsvolumeandvaluearestillwellabovetheaver-ageforthelastdecade.
Kodiak, AK393millionpounds
$170million
Fresh Facts, Smart SeafoodWhen consumers go to the market for seafood, they can be assured that if the species is caught in the United States, it has been caught responsibly. NOAA Fisheries provides the public with easy-to-understand, science-based facts at FishWatch.gov to help them make smart, sustainable seafood choices. FishWatch delivers regularly updated information on how U.S. seafood is harvested under regulations that keep the environment healthy, fish populations thriving, and our seafood industry on the job.

For more information visit us online at:
www.nmfs.noaa.gov
Collecting Reliable DataThe collection and analysis of recreational and commercial catches provide scientists and managers with important information they need to make informed decisions. We use a number of different methods—including surveys, catch cards, and logbooks—to gather recreational and commercial fishing landings data. Fishermen’s landings combined with other sources of fishery-independent data give us a good understanding of the health and productivity of the resource.
Improvements to Recreational Fishing DataThrough the Marine Recreational Information Program, NOAA Fisheries has made substantial improvements to how it collects and reports recreational fishing information. The new recreational catch estimation methodology implemented in 2011 was the first step in a series of planned data enhancements, and lays the scientific and statistical foundation to make other significant improvements such as more precise estimates. In March 2013, NOAA introduced a new angler catch survey for gathering catch data from anglers. The new design further increases the accuracy of catch estimates. Data gathered from the new survey will appear in next year’s Fisheries of the U.S. report.
To meet consumer demand, the United States continues to be a major importer of seafood. Over 90 percent of the seafood consumed in the United States is imported, measured by edible weight. This measure has been rising in recent years reflecting an increase in imported seafood. However, a significant portion of this imported seafood is caught by American fishermen, exported overseas for processing, and then reimported to the United States.
While seafood imports do appear to be rising, the exact figure and the significance of this figure is difficult to know. NOAA is investigating better methods to report consumption and imports, to better understand the significance of imported seafood.
America’s aquaculture industry currently supports only 5 percent of U.S. seafood demand, producing primarily oysters, clams, mussels, and some finfish, including salmon. Washington and Maine lead the nation in marine finfish farming. Washington, Virginia and Louisiana lead in shellfish farming.
ImportsandExports