fiscal year 2012 second quarter financial results · fiscal year 2012 second quarter financial...
TRANSCRIPT

Fiscal Year 2012 Second Quarter Financial Results
This presentation includes forward-looking statements relating to our future plans, targets, objectives, expectations and intentions. The forward-looking statements reflect management’s current assumptions and expectations of future events, and accordingly, they are inherently susceptible to uncertainties and changes in circumstances and are not guarantees of future performance. Actual results may differ materially, for a wide range of possible reasons, including general industry and market conditions and general international economic conditions. In light of the many risks and uncertainties, you are advised not to put undue reliance on these statements. The management targets included in this presentation are not projections, and do not represent management’s current estimates of future performance. Rather, they represent targets that management strive to achieve through the successful implementation of the Company’s business strategies. The Company may be unsuccessful in implementing its business strategies, and management may fail to achieve its targets. The Company is under no obligation – and expressly disclaims any such obligation – to update or alter its forward-looking statements. Names of companies, products, and services and such that appear in this material are trademarks or registered marks of their respective companies.
August 3, 2012Rakuten, Inc.
1
FY2012 Second Quarter Results3
Internet Finance5
Contents
Others6
Appendix
eBook Business and Kobo Launch in Japan1
Internet Services4
New Accounting Policy Regarding Loyalty Points The Rakuten Group changed an accounting policy regarding loyalty points and made a retrospective application of such change to the financial statements of previous fiscal years.
Englishnization2
2
eBook Business and Kobo Launch in Japan1
3
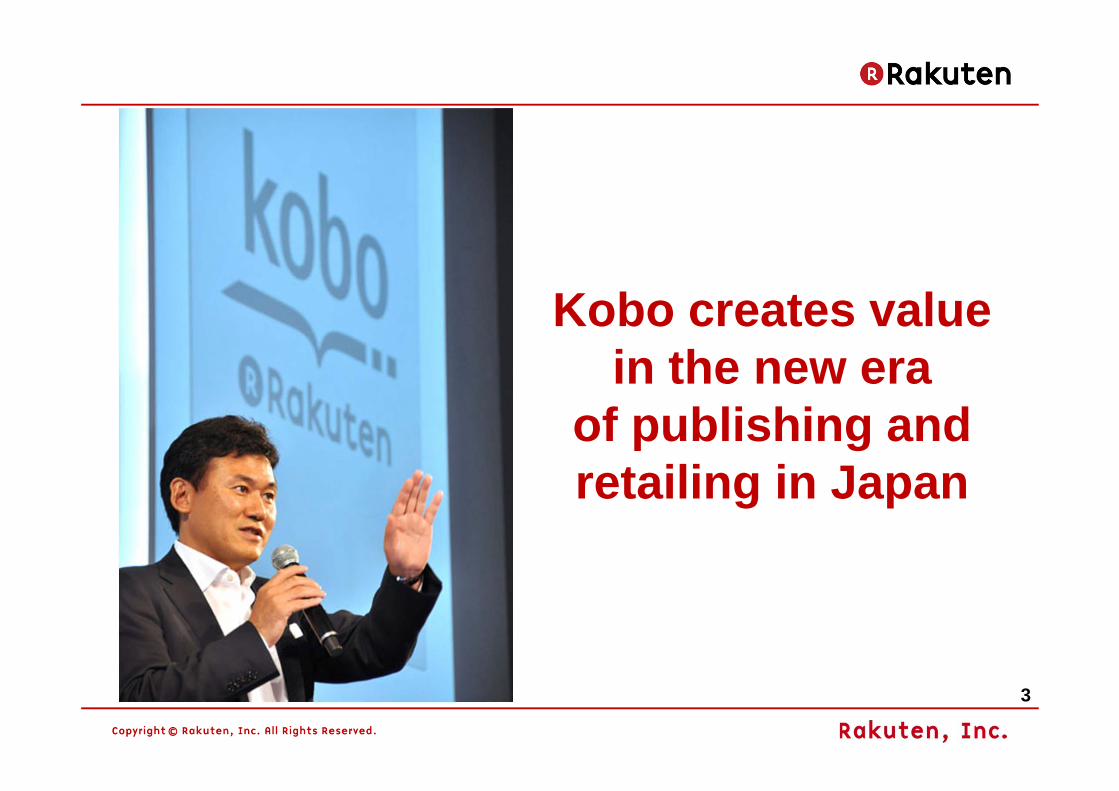
Kobo creates value in the new era
of publishing and retailing in Japan

4
Win-Win Relationship with Publishers
Photo: msn Sankei News, July 20, 2012 ”
Top management of Japanese publishers and the Canadian Ambassador to Japan attended the reception of Kobo’s launch in the Japanese market.
5
Comments From Publishers
“I am surprised at Kobo sales from the service start. We will add as many new eBook titles as possible”. (Kodansha CEO Mr. Noma)
“There have been very surprising sales, despite a few challenges at first. For eBooks to spread even more, I give my support”.
“To be frank, we had high expectations for sales and I suggested we hurry up the delivery of the products”.
“We heard the breaking news about sales in our office, and we were excited that sales were much better than expected”.
“It is a stylish device, and I happened to see a man inside a train happily and proudly reading a novel on the device. It seems at last a new reading style is taking root in Japan”.
“Congratulations on the launch of Rakuten/Kobo. With the Rakuten/Kobo launch into the eReader market, this will be a great contribution to the expansion of the reading population of Japan. I hope that we as a publishing company can help in the development of Rakuten Kobo. We admire the faith of Rakuten CEO Mikitani-san and have high expectations for Rakuten in the development of the publishing industry”.
“Congratulations on the opening of the Rakuten Kobo service. I respect Rakuten’s aggressive promotion of the eBook business. Let’s promote a reading revolution and create a new market”.
6
eBook Business Highlights (Kobo Launch in Japan)
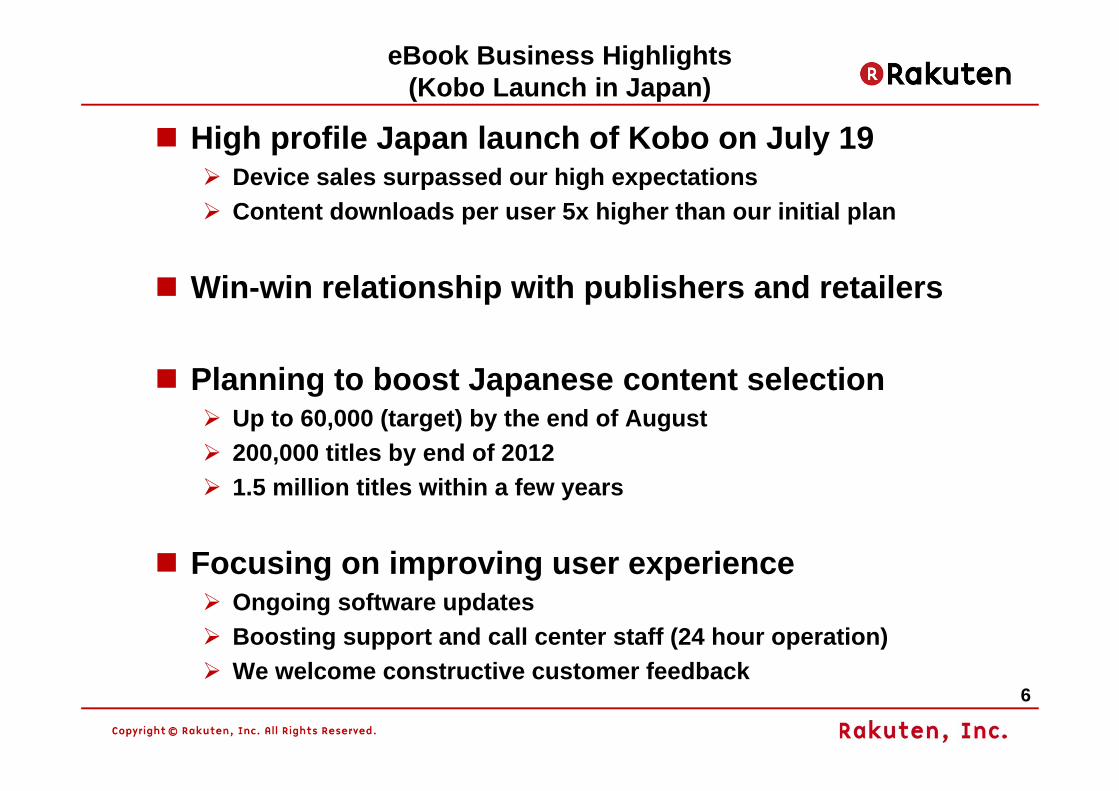
High profile Japan launch of Kobo on July 19Device sales surpassed our high expectationsContent downloads per user 5x higher than our initial plan
Win-win relationship with publishers and retailers
Planning to boost Japanese content selectionUp to 60,000 (target) by the end of August200,000 titles by end of 20121.5 million titles within a few years
Focusing on improving user experienceOngoing software updatesBoosting support and call center staff (24 hour operation) We welcome constructive customer feedback
7
eBook Business Highlights (Kobo Global)
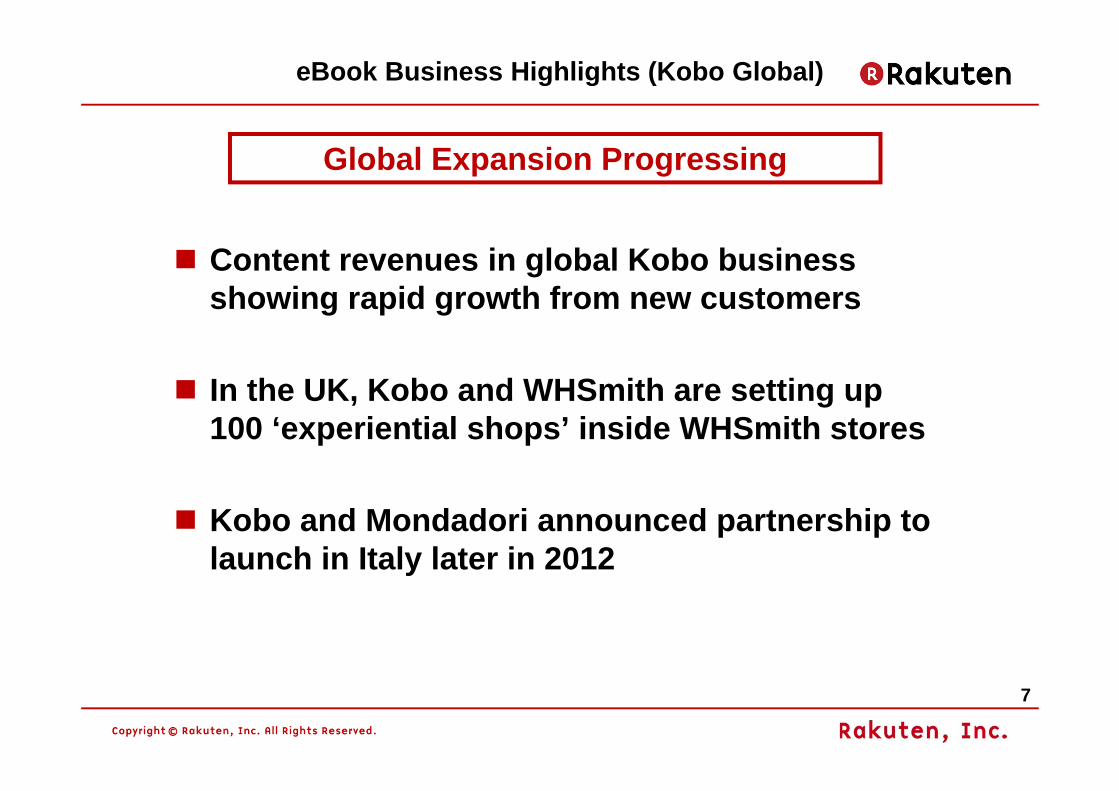
Content revenues in global Kobo business showing rapid growth from new customers
In the UK, Kobo and WHSmith are setting up 100 ‘experiential shops’ inside WHSmith stores
Kobo and Mondadori announced partnership to launch in Italy later in 2012
Global Expansion Progressing
8
Englishnization2
9
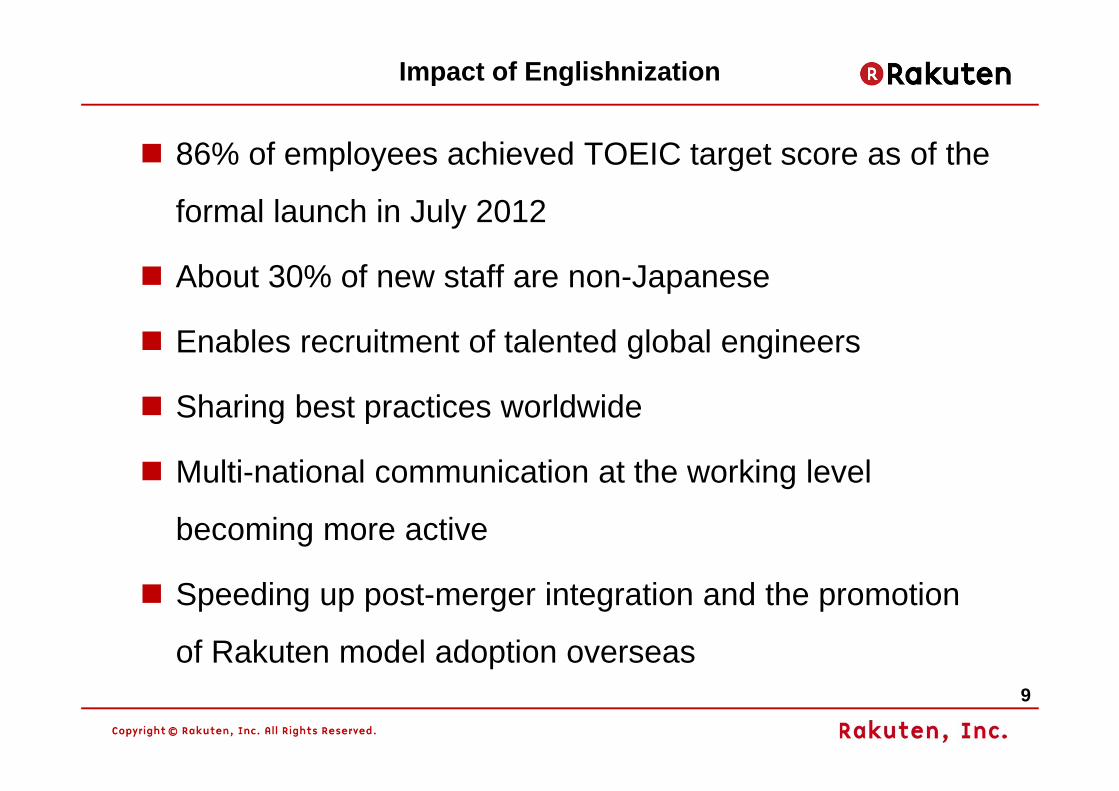
Impact of Englishnization
86% of employees achieved TOEIC target score as of the
formal launch in July 2012
About 30% of new staff are non-Japanese
Enables recruitment of talented global engineers
Sharing best practices worldwide
Multi-national communication at the working level
becoming more active
Speeding up post-merger integration and the promotion
of Rakuten model adoption overseas
10
0%
10%
20%
30%
40%
50%
60%
70%
80%
90%
100%
86%
8%4%
Mar2011
Jan.2012
1%
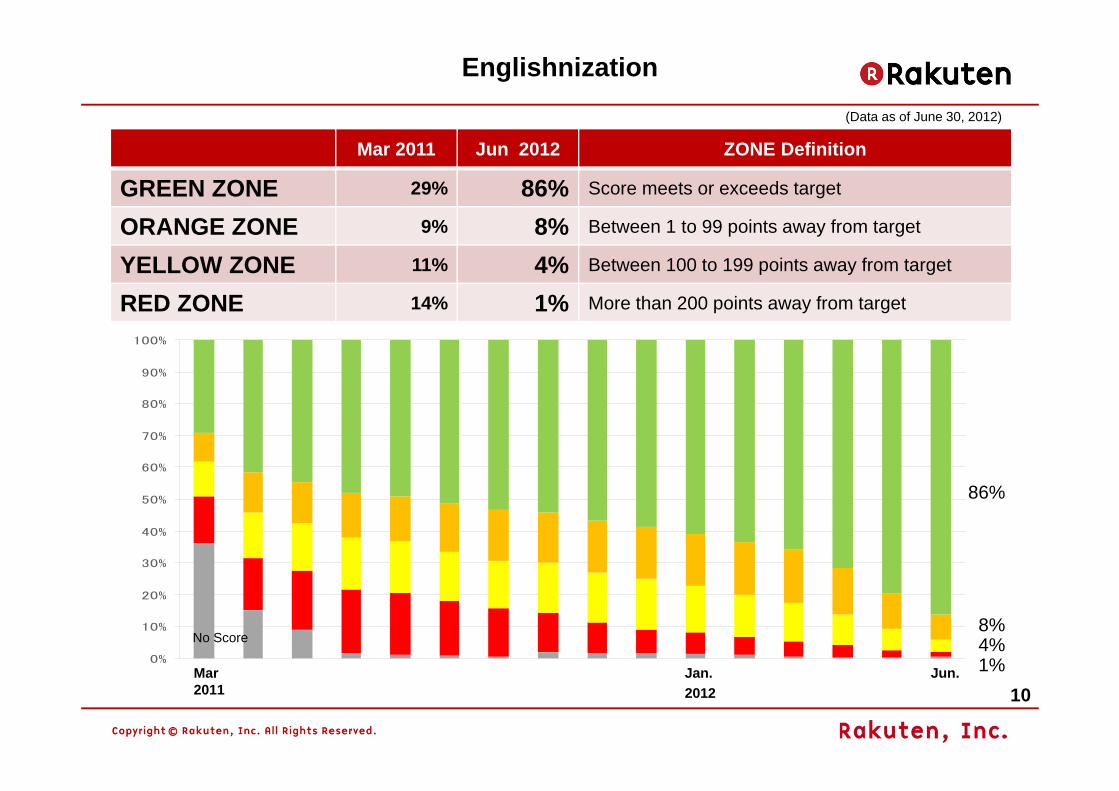
(Data as of June 30, 2012)
Mar 2011 Jun 2012 ZONE Definition
GREEN ZONE 29% 86% Score meets or exceeds target
ORANGE ZONE 9% 8% Between 1 to 99 points away from target
YELLOW ZONE 11% 4% Between 100 to 199 points away from target
RED ZONE 14% 1% More than 200 points away from target
Jun.
Englishnization
No Score
11
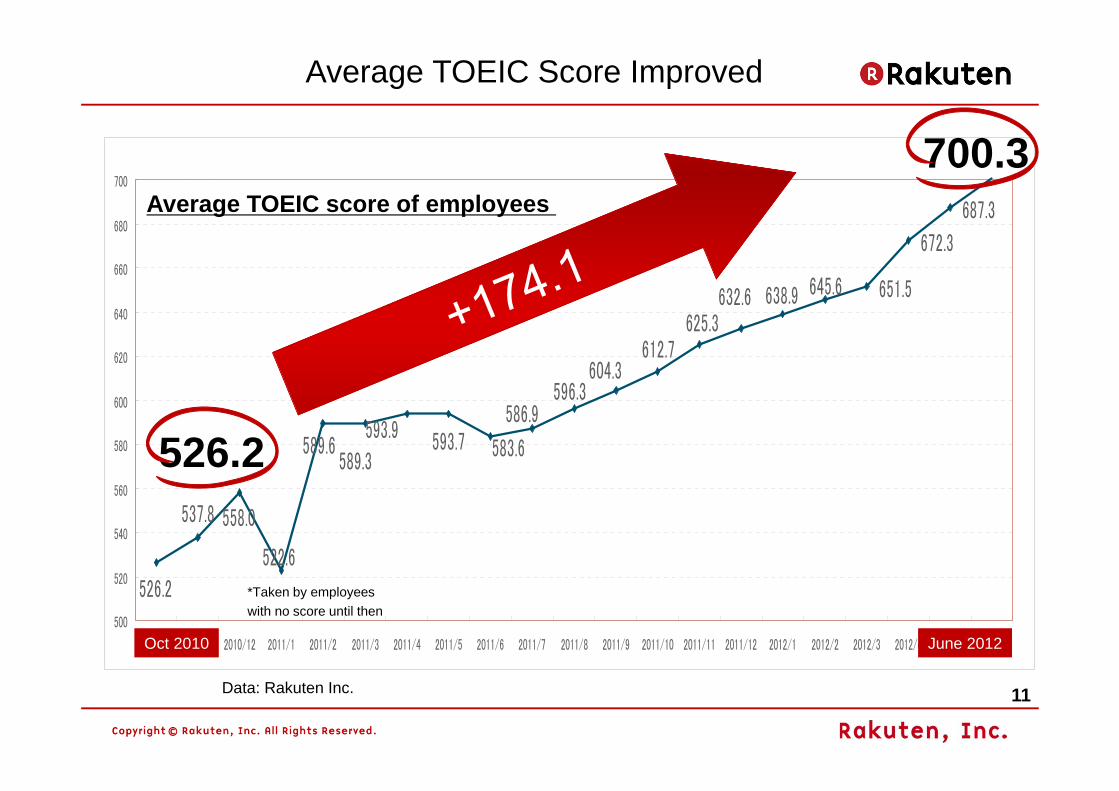
651.5
672.3
687.3
645.6638.9632.6625.3
612.7604.3
596.3586.9
583.6593.7593.9
589.3589.6
522.6
558.0537.8
526.2500
520
540
560
580
600
620
640
660
680
700
2010/10 2010/11 2010/12 2011/1 2011/2 2011/3 2011/4 2011/5 2011/6 2011/7 2011/8 2011/9 2011/10 2011/11 2011/12 2012/1 2012/2 2012/3 2012/4 2012/5 2012/6
700.3
526.2
Oct 2010 June 2012
Average TOEIC score of employees
Average TOEIC Score Improved
Data: Rakuten Inc.
*Taken by employeeswith no score until then
12
FY2012 Second Quarter Results3
13
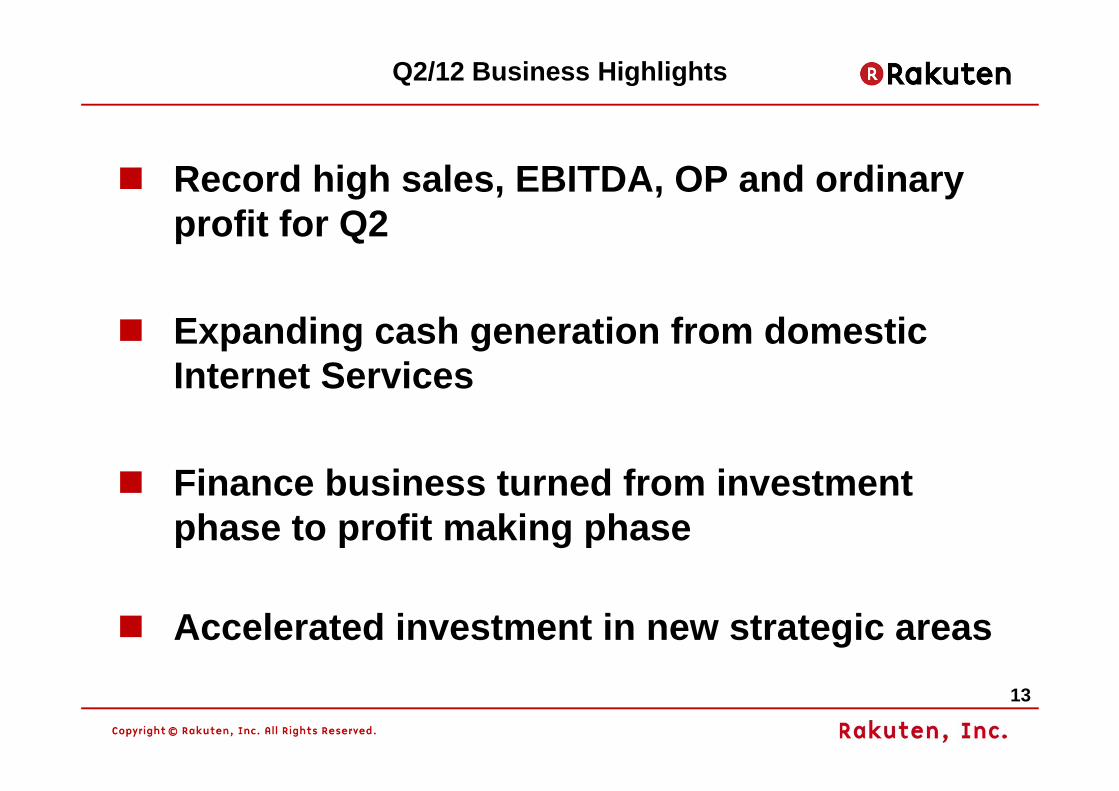
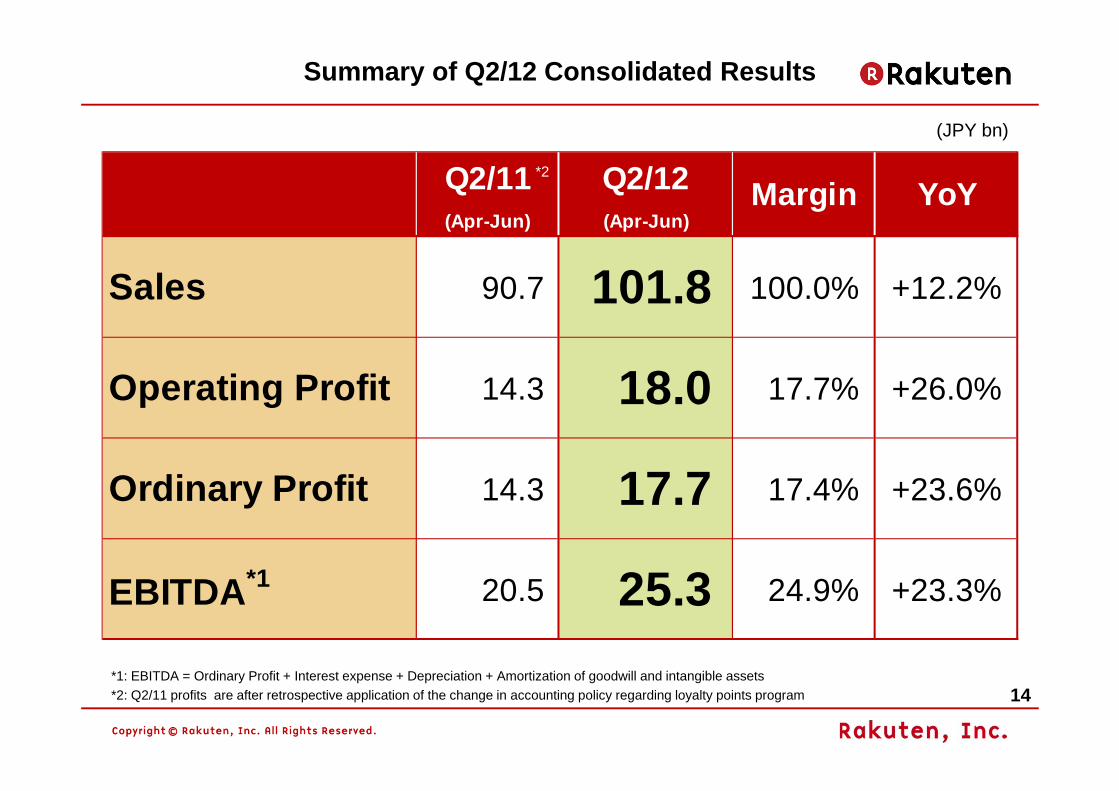
Record high sales, EBITDA, OP and ordinary profit for Q2
Expanding cash generation from domestic Internet Services
Finance business turned from investment phase to profit making phase
Accelerated investment in new strategic areas
Q2/12 Business Highlights
14
Q2/11 Q2/12(Apr-Jun) (Apr-Jun)
Sales 90.7 101.8 100.0% +12.2%
Operating Profit 14.3 18.0 17.7% +26.0%
Ordinary Profit 14.3 17.7 17.4% +23.6%
EBITDA*1 20.5 25.3 24.9% +23.3%
Margin YoY
(JPY bn)
*1: EBITDA = Ordinary Profit + Interest expense + Depreciation + Amortization of goodwill and intangible assets*2: Q2/11 profits are after retrospective application of the change in accounting policy regarding loyalty points program
Summary of Q2/12 Consolidated Results
*2
15
(JPY bn)
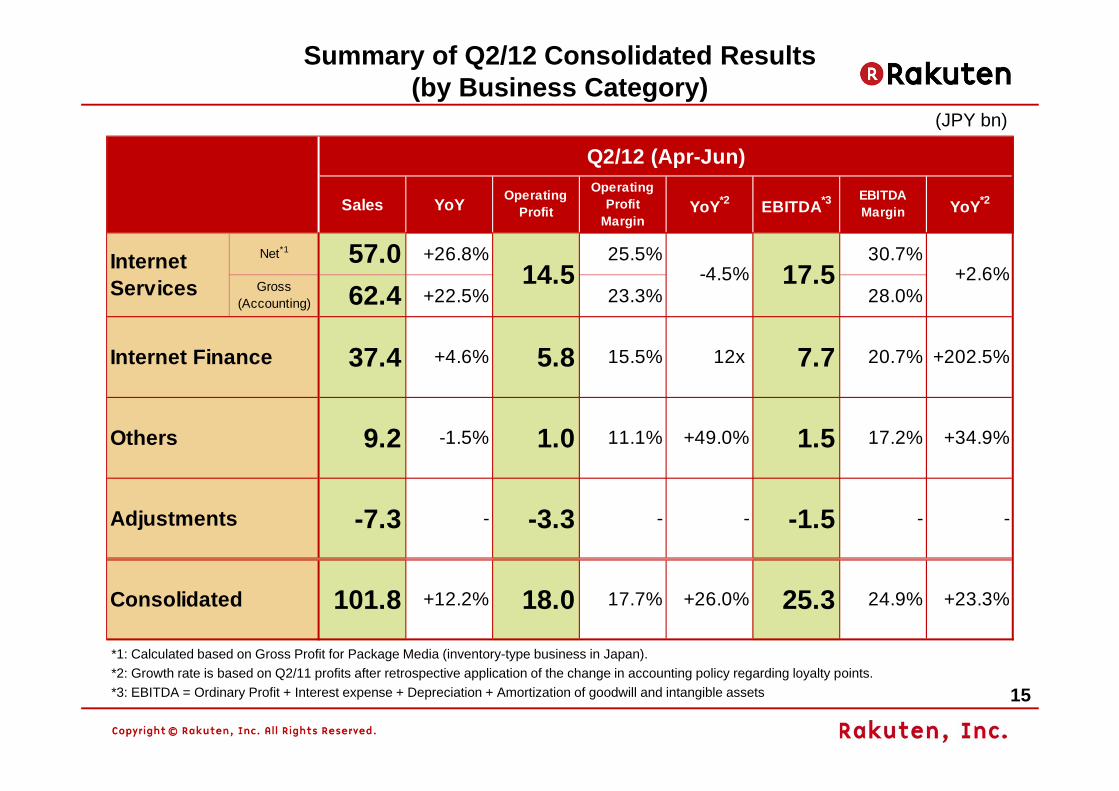
*1: Calculated based on Gross Profit for Package Media (inventory-type business in Japan).*2: Growth rate is based on Q2/11 profits after retrospective application of the change in accounting policy regarding loyalty points. *3: EBITDA = Ordinary Profit + Interest expense + Depreciation + Amortization of goodwill and intangible assets
Summary of Q2/12 Consolidated Results (by Business Category)
Sales YoY OperatingProfit
OperatingProfit
MarginYoY*2 EBITDA*3 EBITDA
Margin YoY*2
Net*1 57.0 +26.8% 25.5% 30.7%Gross
(Accounting) 62.4 +22.5% 23.3% 28.0%
37.4 +4.6% 5.8 15.5% 12x 7.7 20.7% +202.5%
9.2 -1.5% 1.0 11.1% +49.0% 1.5 17.2% +34.9%
-7.3 - -3.3 - - -1.5 - -
101.8 +12.2% 18.0 17.7% +26.0% 25.3 24.9% +23.3%
+2.6%InternetServices
Internet Finance
Others
Adjustments
Q2/12 (Apr-Jun)
14.5 17.5-4.5%
Consolidated
16
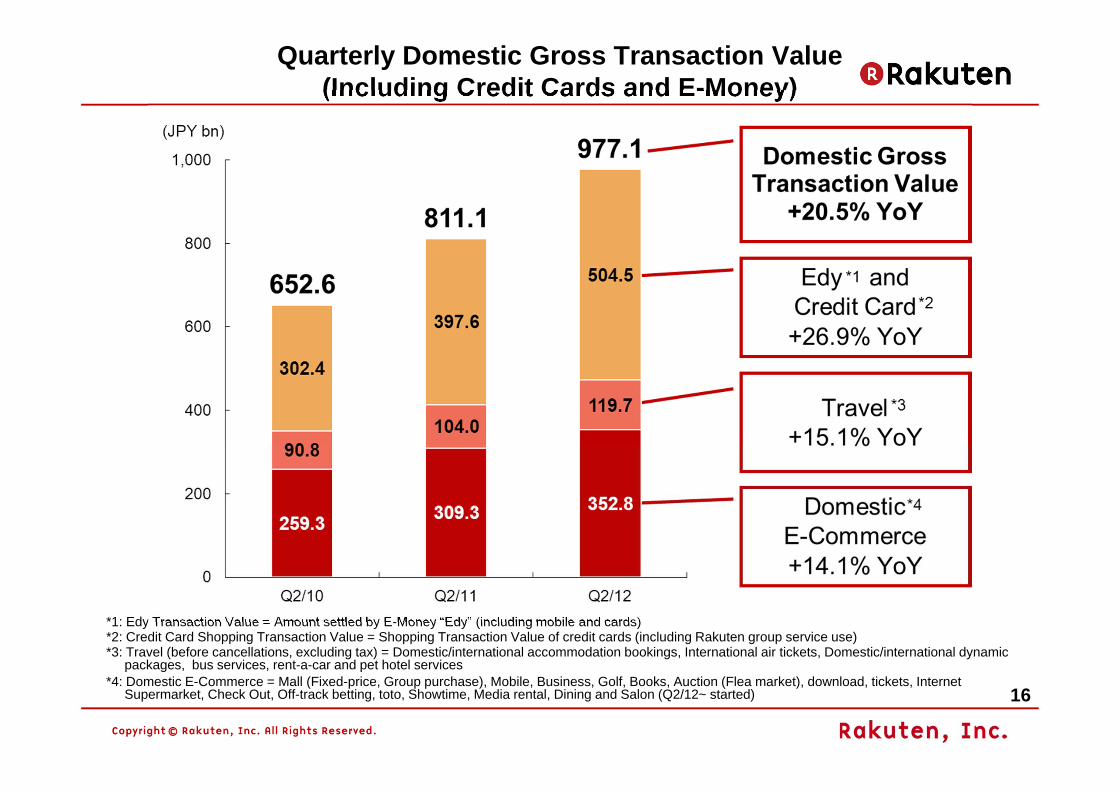
*1: Edy Transaction Value = Amount settled by E-Money “Edy” (including mobile and cards) *2: Credit Card Shopping Transaction Value = Shopping Transaction Value of credit cards (including Rakuten group service use)*3: Travel (before cancellations, excluding tax) = Domestic/international accommodation bookings, International air tickets, Domestic/international dynamic
packages, bus services, rent-a-car and pet hotel services*4: Domestic E-Commerce = Mall (Fixed-price, Group purchase), Mobile, Business, Golf, Books, Auction (Flea market), download, tickets, Internet
Supermarket, Check Out, Off-track betting, toto, Showtime, Media rental, Dining and Salon (Q2/12~ started)
Quarterly Domestic Gross Transaction Value (Including Credit Cards and E-Money)
17
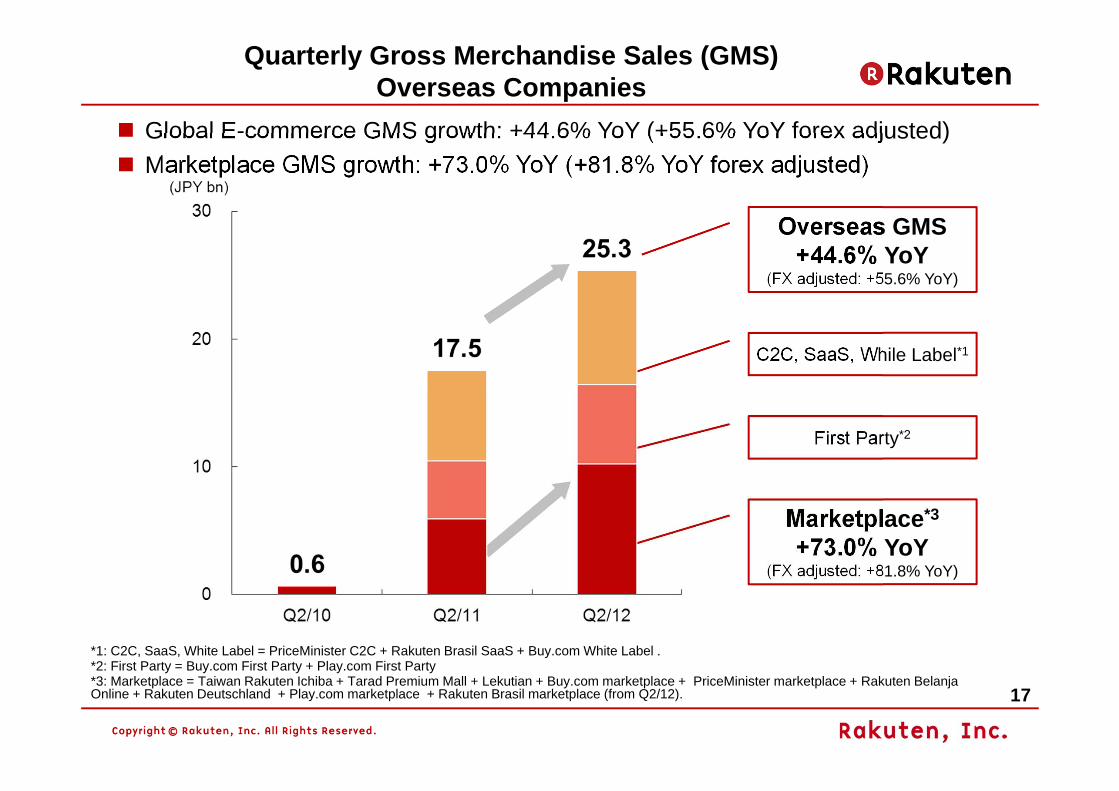
Quarterly Gross Merchandise Sales (GMS) Overseas Companies
Global E-commerce GMS growth: +44.6% YoY (+55.6% YoY forex adjusted)Marketplace GMS growth: +73.0% YoY (+81.8% YoY forex adjusted)
C2C, SaaS, While Label*1
First Party*2
Marketplace*3
+73.0% YoY(FX adjusted: +81.8% YoY)
Overseas GMS+44.6% YoY
(FX adjusted: +55.6% YoY)
*1: C2C, SaaS, White Label = PriceMinister C2C + Rakuten Brasil SaaS + Buy.com White Label . *2: First Party = Buy.com First Party + Play.com First Party *3: Marketplace = Taiwan Rakuten Ichiba + Tarad Premium Mall + Lekutian + Buy.com marketplace + PriceMinister marketplace + Rakuten Belanja Online + Rakuten Deutschland + Play.com marketplace + Rakuten Brasil marketplace (from Q2/12).
18
Internet Services4
19
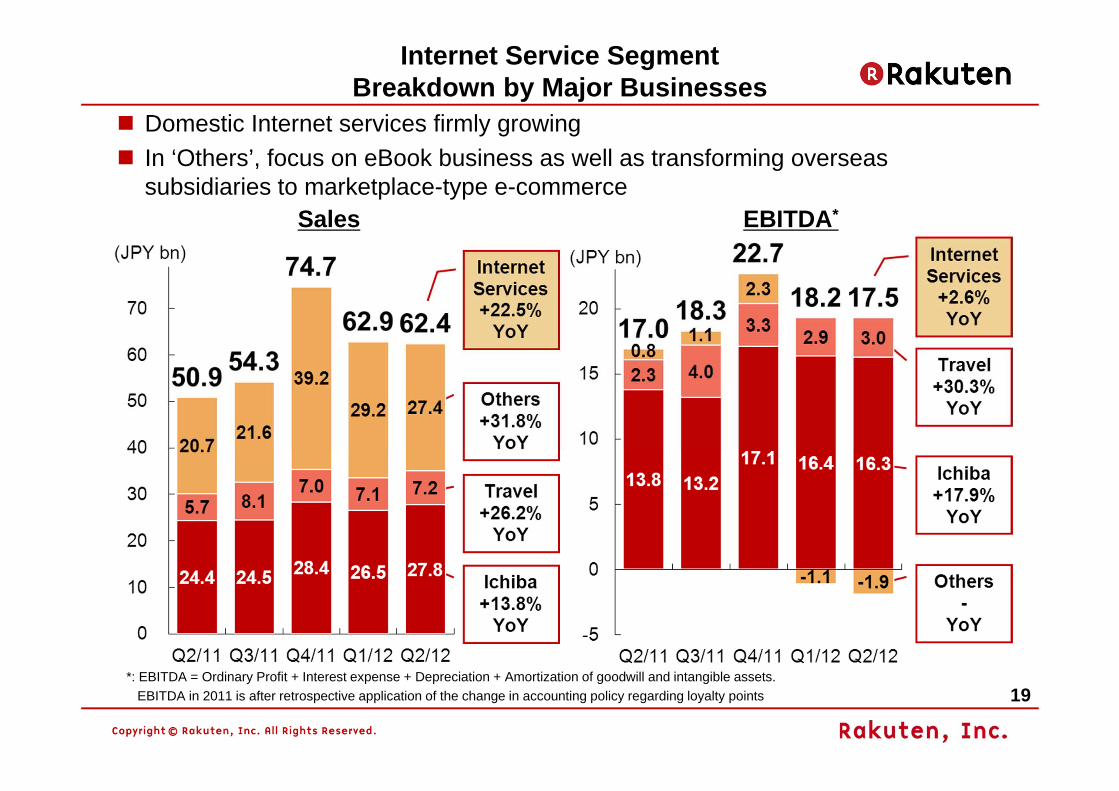
Internet Service SegmentBreakdown by Major Businesses
Domestic Internet services firmly growingIn ‘Others’, focus on eBook business as well as transforming overseas subsidiaries to marketplace-type e-commerce
*: EBITDA = Ordinary Profit + Interest expense + Depreciation + Amortization of goodwill and intangible assets.EBITDA in 2011 is after retrospective application of the change in accounting policy regarding loyalty points
Sales EBITDA*
20
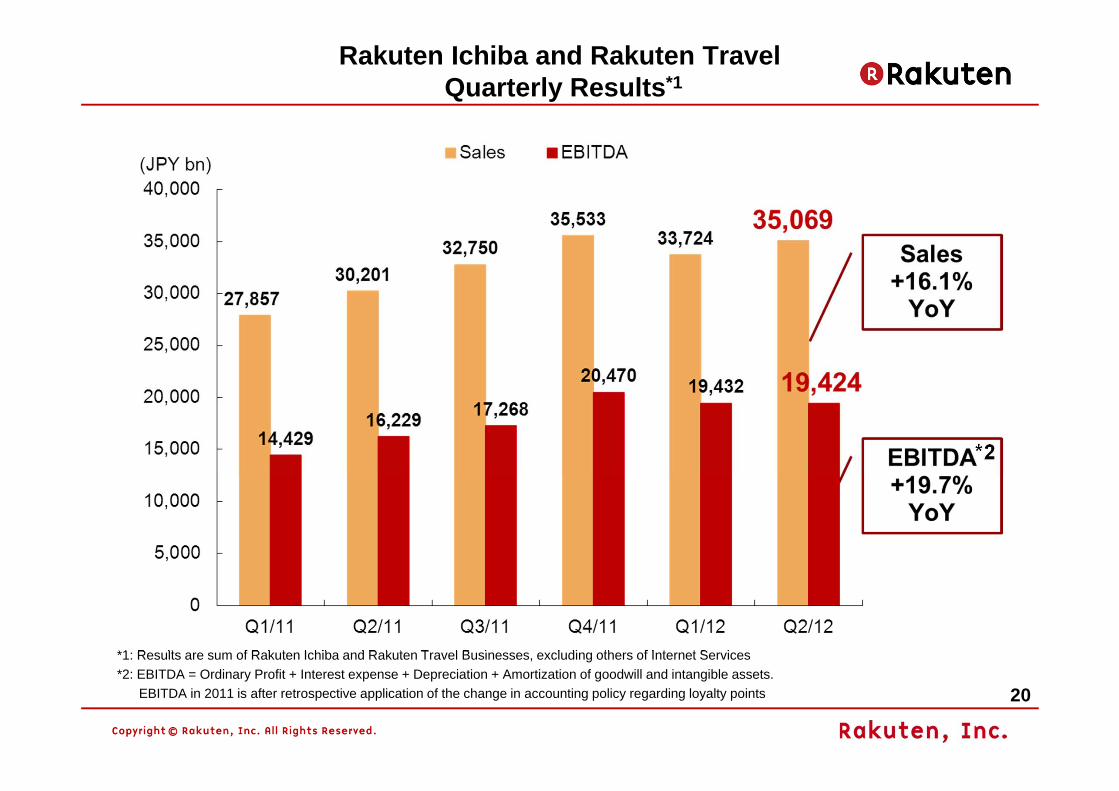
Rakuten Ichiba and Rakuten TravelQuarterly Results*1
*1: Results are sum of Rakuten Ichiba and Rakuten Travel Businesses, excluding others of Internet Services *2: EBITDA = Ordinary Profit + Interest expense + Depreciation + Amortization of goodwill and intangible assets.
EBITDA in 2011 is after retrospective application of the change in accounting policy regarding loyalty points
*2
21
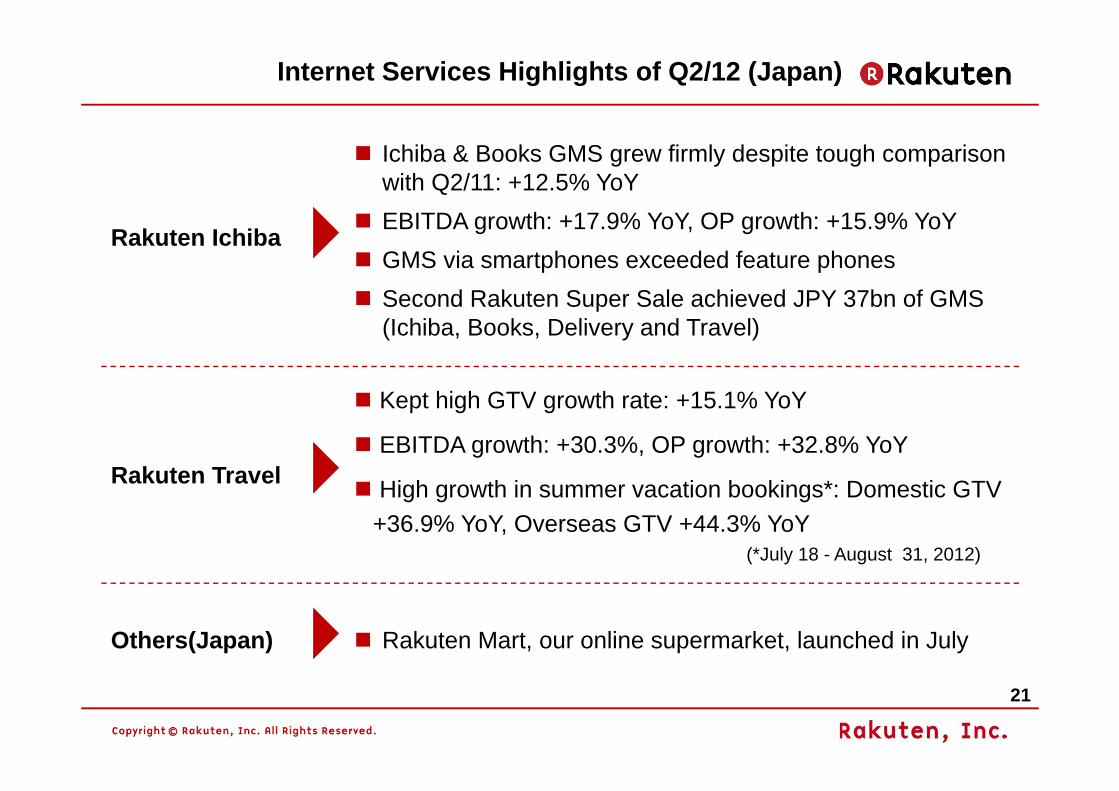
Rakuten Ichiba
Ichiba & Books GMS grew firmly despite tough comparison with Q2/11: +12.5% YoY EBITDA growth: +17.9% YoY, OP growth: +15.9% YoYGMS via smartphones exceeded feature phonesSecond Rakuten Super Sale achieved JPY 37bn of GMS (Ichiba, Books, Delivery and Travel)
Rakuten Travel
Kept high GTV growth rate: +15.1% YoY
EBITDA growth: +30.3%, OP growth: +32.8% YoY
High growth in summer vacation bookings*: Domestic GTV +36.9% YoY, Overseas GTV +44.3% YoY
(*July 18 - August 31, 2012)
Others(Japan) Rakuten Mart, our online supermarket, launched in July
Internet Services Highlights of Q2/12 (Japan)
22
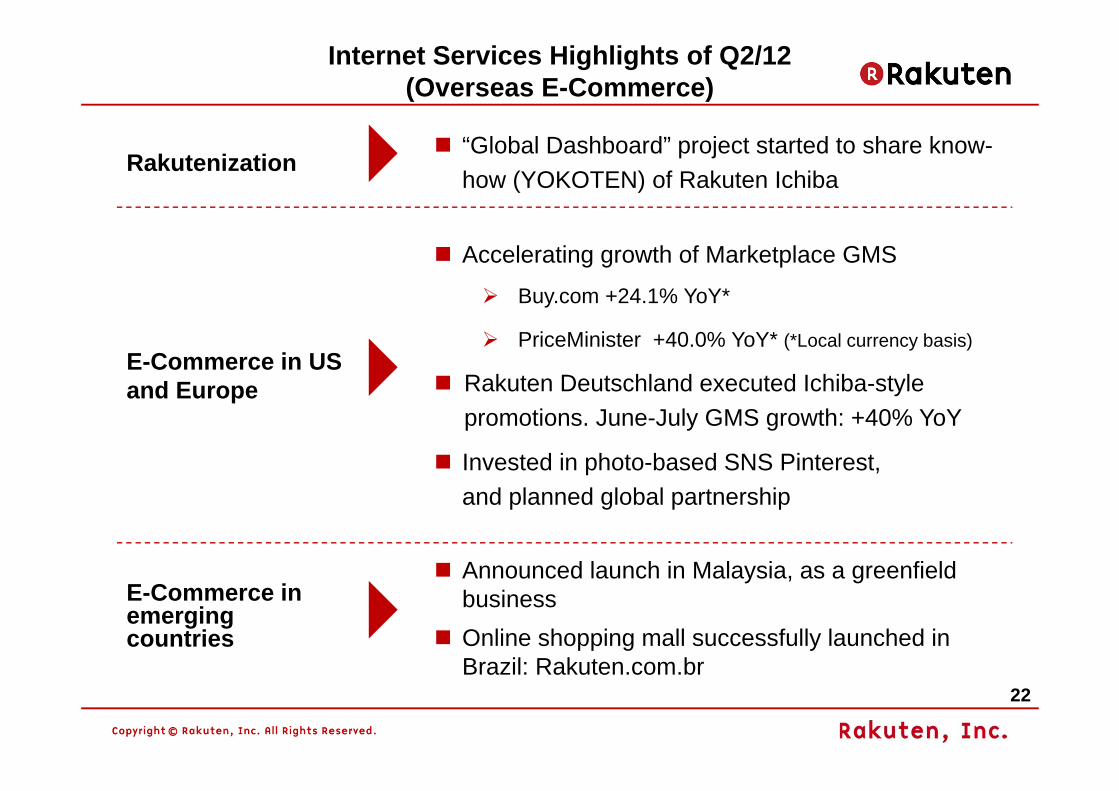
Internet Services Highlights of Q2/12 (Overseas E-Commerce)
Rakutenization“Global Dashboard” project started to share know-how (YOKOTEN) of Rakuten Ichiba
E-Commerce in US and Europe
Accelerating growth of Marketplace GMS
Buy.com +24.1% YoY*
PriceMinister +40.0% YoY* (*Local currency basis)
Rakuten Deutschland executed Ichiba-style promotions. June-July GMS growth: +40% YoY
Invested in photo-based SNS Pinterest, and planned global partnership
E-Commerce in emerging countries
Announced launch in Malaysia, as a greenfield businessOnline shopping mall successfully launched in Brazil: Rakuten.com.br
23
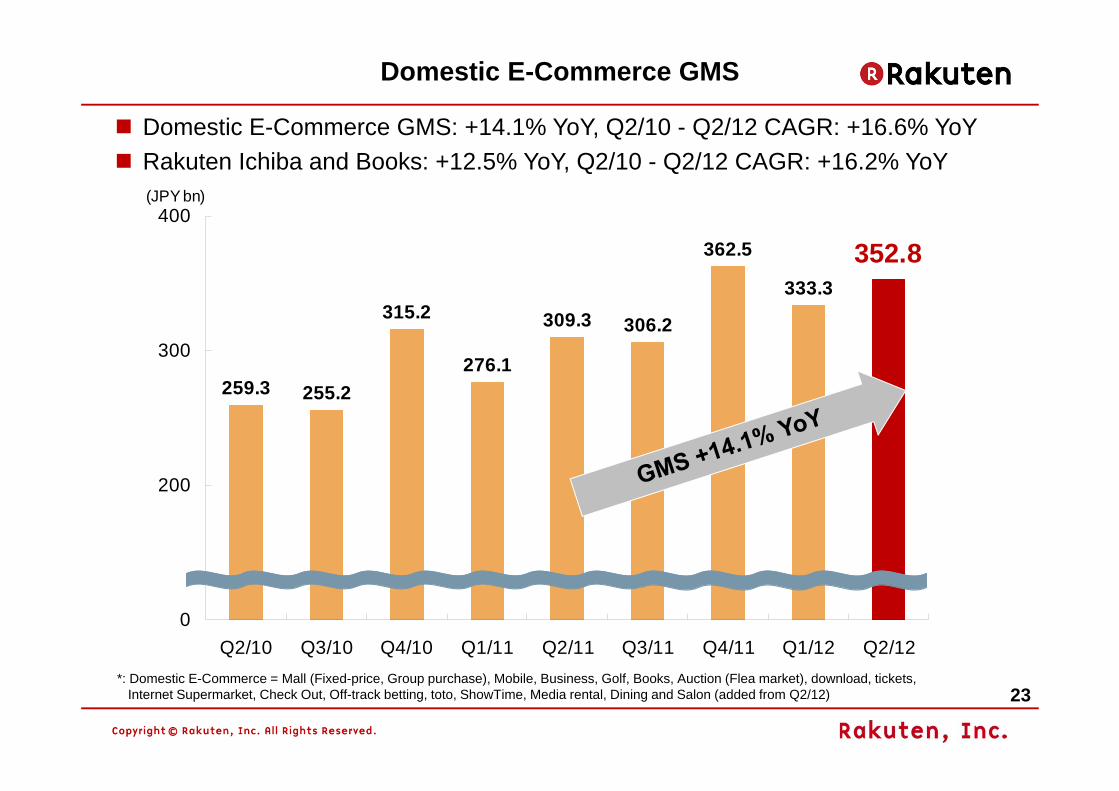
259.3 255.2
315.2
276.1
309.3 306.2
362.5
333.3352.8
0
200
300
400
Q2/10 Q3/10 Q4/10 Q1/11 Q2/11 Q3/11 Q4/11 Q1/12 Q2/12
(JPY bn)
*: Domestic E-Commerce = Mall (Fixed-price, Group purchase), Mobile, Business, Golf, Books, Auction (Flea market), download, tickets,Internet Supermarket, Check Out, Off-track betting, toto, ShowTime, Media rental, Dining and Salon (added from Q2/12)
Domestic E-Commerce GMS
Domestic E-Commerce GMS: +14.1% YoY, Q2/10 - Q2/12 CAGR: +16.6% YoY Rakuten Ichiba and Books: +12.5% YoY, Q2/10 - Q2/12 CAGR: +16.2% YoY
24
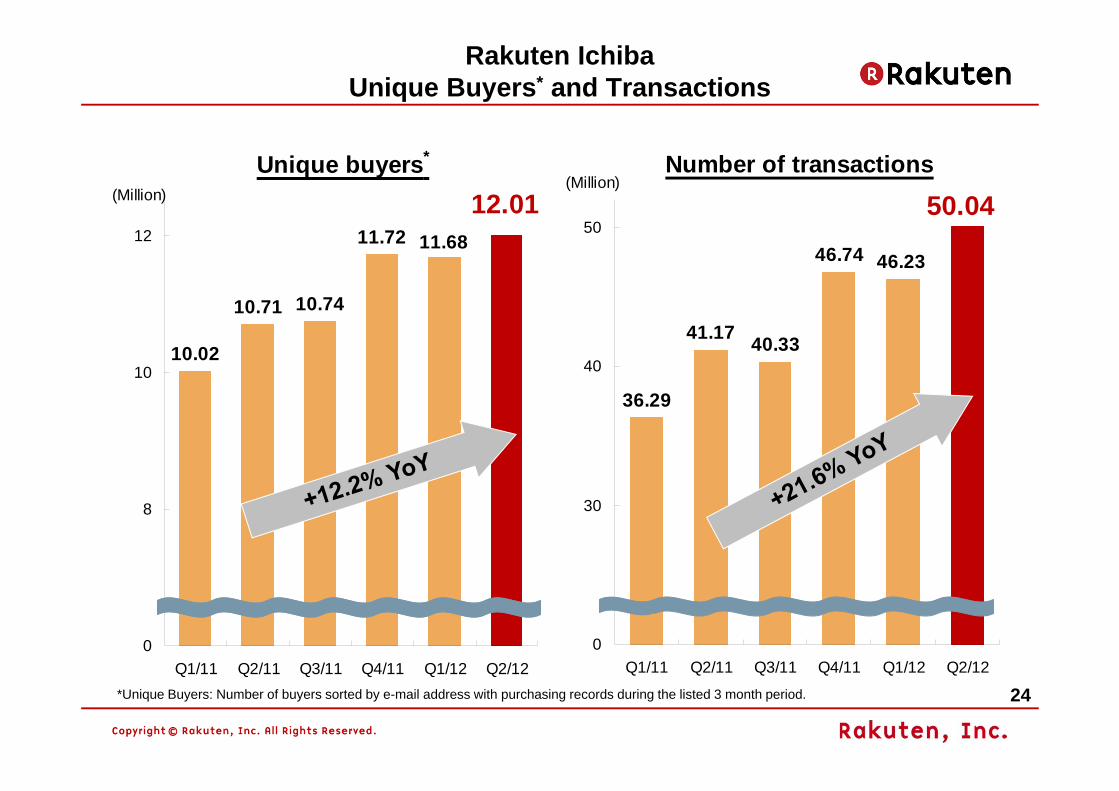
36.29
41.17 40.33
46.74 46.23
50.04
0
30
40
50
Q1/11 Q2/11 Q3/11 Q4/11 Q1/12 Q2/12
Number of transactions(Million)
10.02
10.71 10.74
11.72 11.68
12.01
0
8
10
12
Q1/11 Q2/11 Q3/11 Q4/11 Q1/12 Q2/12
(Million)
Unique buyers*
*Unique Buyers: Number of buyers sorted by e-mail address with purchasing records during the listed 3 month period.
Rakuten IchibaUnique Buyers* and Transactions
25
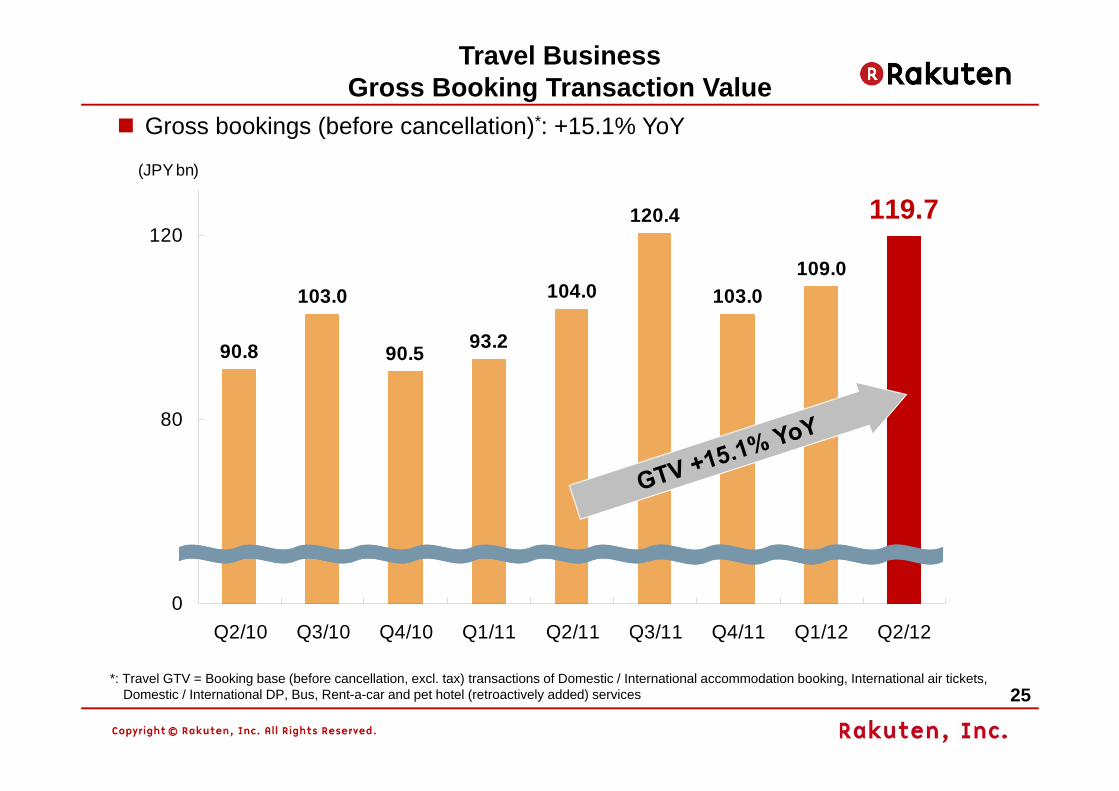
90.8
103.0
90.5 93.2
104.0
120.4
103.0109.0
119.7
0
80
120
Q2/10 Q3/10 Q4/10 Q1/11 Q2/11 Q3/11 Q4/11 Q1/12 Q2/12
(JPY bn)
*: Travel GTV = Booking base (before cancellation, excl. tax) transactions of Domestic / International accommodation booking, International air tickets, Domestic / International DP, Bus, Rent-a-car and pet hotel (retroactively added) services
Travel Business Gross Booking Transaction Value
Gross bookings (before cancellation)*: +15.1% YoY

26
Internet Finance5
27
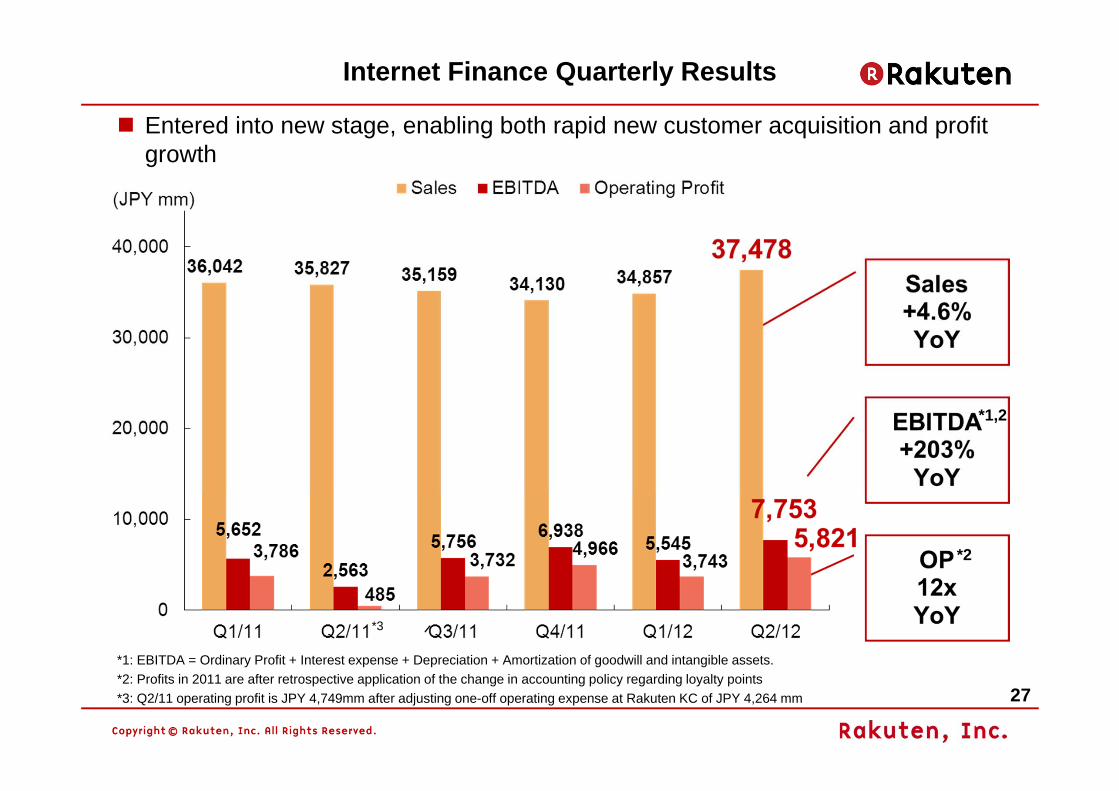
Internet Finance Quarterly Results
Entered into new stage, enabling both rapid new customer acquisition and profit growth
*1: EBITDA = Ordinary Profit + Interest expense + Depreciation + Amortization of goodwill and intangible assets.*2: Profits in 2011 are after retrospective application of the change in accounting policy regarding loyalty points*3: Q2/11 operating profit is JPY 4,749mm after adjusting one-off operating expense at Rakuten KC of JPY 4,264 mm
*2
*1,2
*3
28
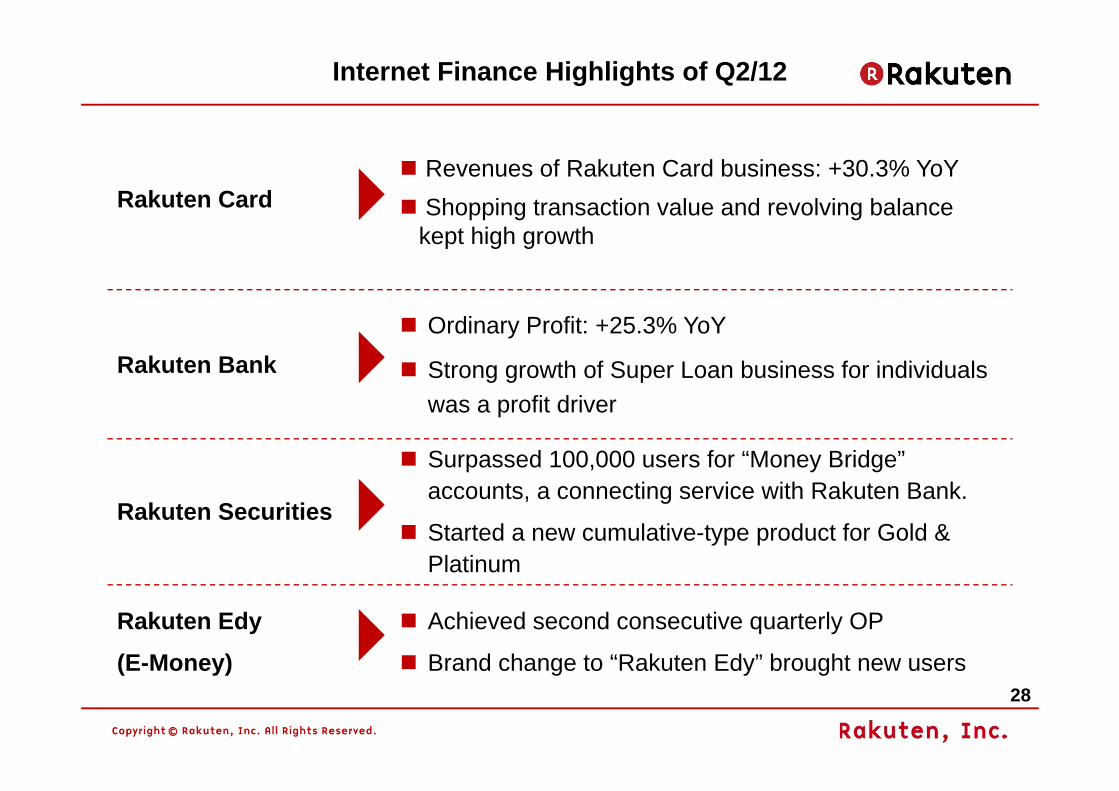
Internet Finance Highlights of Q2/12
Rakuten CardRevenues of Rakuten Card business: +30.3% YoY Shopping transaction value and revolving balance kept high growth
Rakuten BankOrdinary Profit: +25.3% YoY
Strong growth of Super Loan business for individuals was a profit driver
Rakuten Securities
Surpassed 100,000 users for “Money Bridge” accounts, a connecting service with Rakuten Bank.
Started a new cumulative-type product for Gold & Platinum
Rakuten Edy
(E-Money)
Achieved second consecutive quarterly OP
Brand change to “Rakuten Edy” brought new users
29
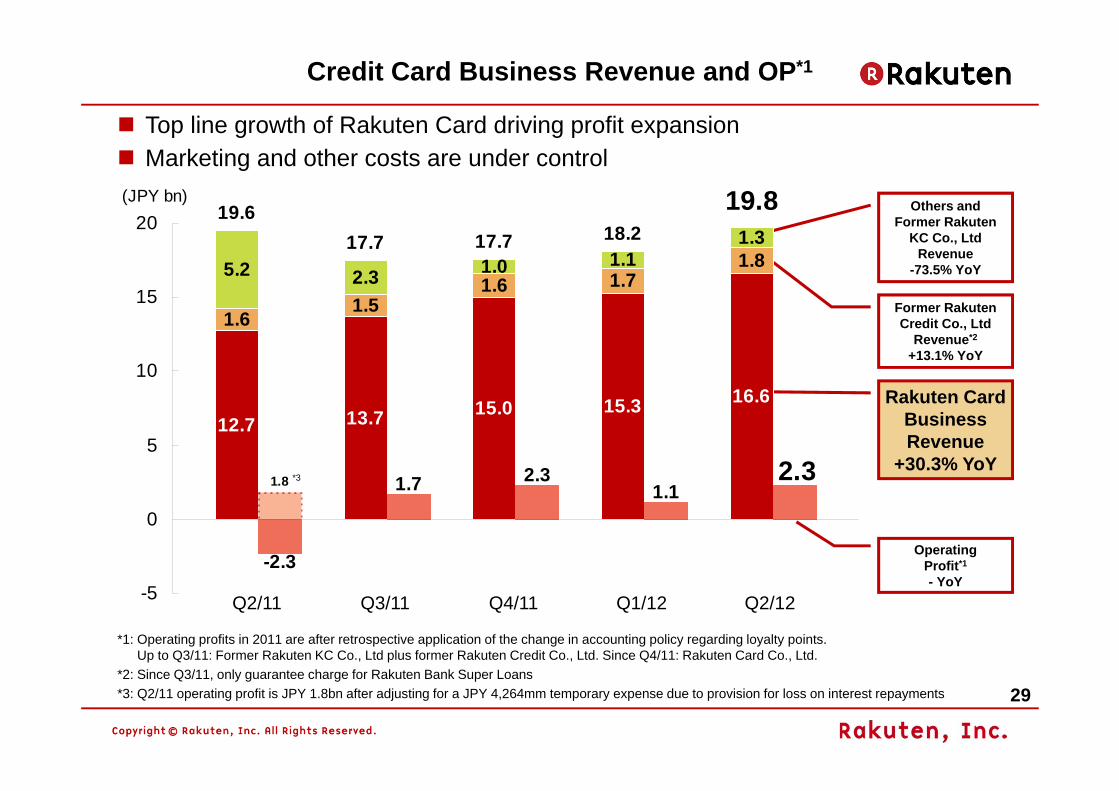
Rakuten CardBusinessRevenue
+30.3% YoY
Former Rakuten Credit Co., Ltd
Revenue*2
+13.1% YoY
Others andFormer Rakuten
KC Co., LtdRevenue
-73.5% YoY
OperatingProfit*1
- YoY
Credit Card Business Revenue and OP*1
Q2/11 Q3/11 Q4/11 Q1/12 Q2/12
*1: Operating profits in 2011 are after retrospective application of the change in accounting policy regarding loyalty points.Up to Q3/11: Former Rakuten KC Co., Ltd plus former Rakuten Credit Co., Ltd. Since Q4/11: Rakuten Card Co., Ltd.
*2: Since Q3/11, only guarantee charge for Rakuten Bank Super Loans*3: Q2/11 operating profit is JPY 1.8bn after adjusting for a JPY 4,264mm temporary expense due to provision for loss on interest repayments
*3
Top line growth of Rakuten Card driving profit expansionMarketing and other costs are under control
12.7 13.7 15.0 15.3 16.6
1.61.5
1.6 1.71.85.2 2.3 1.0 1.11.3
19.617.7 17.7 18.2
1.8 2.31.1
2.31.7
-2.3
19.8
-5
0
5
10
15
20(JPY bn)
30
279.4313.1
347.2385.5 395.2
432.7
0
50
100
150
200
250
300
350
400
450
500
Q1/11 Q2/11 Q3/11 Q4/11 Q1/12 Q2/12
(JPY bn)
Rakuten CardShopping Transaction Value
93.8101.3
110.5119.8
129.3139.4
0
20
40
60
80
100
120
140
160
Mar/11 Jun/11 Sep/11 Dec/11 Mar/12 Jun/12
(JPY bn)
Rakuten CardShopping Revolving Balance
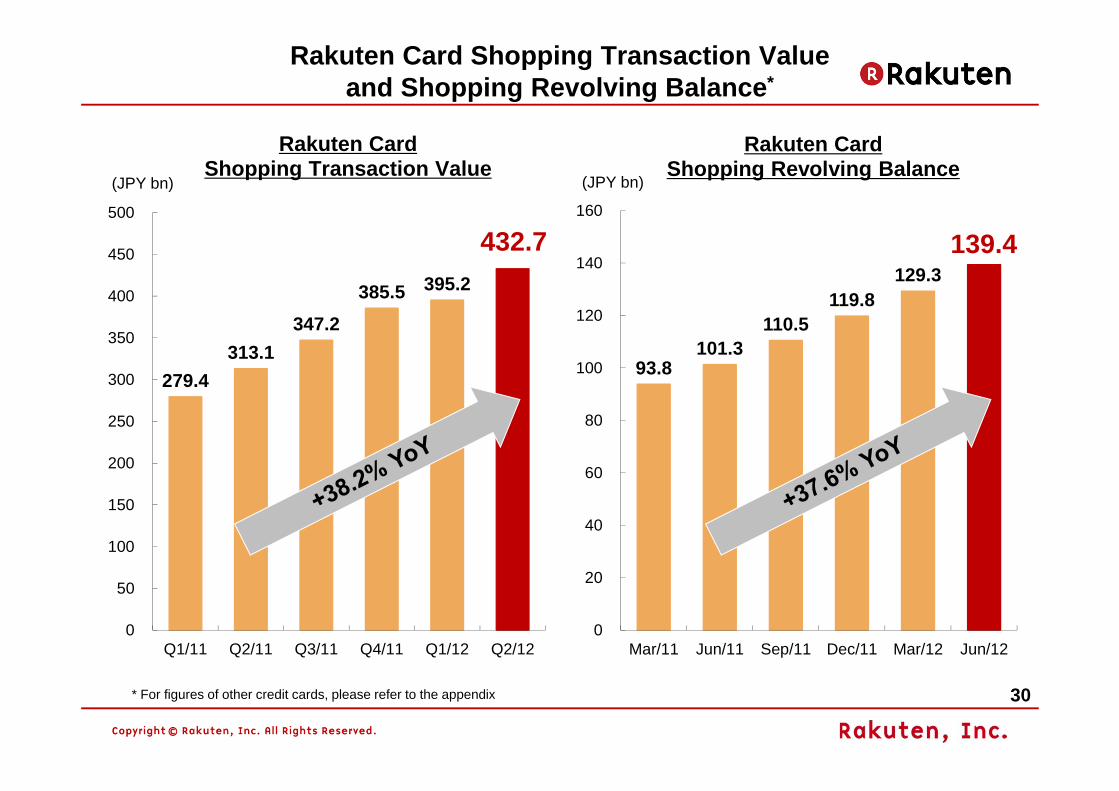
* For figures of other credit cards, please refer to the appendix
Rakuten Card Shopping Transaction Valueand Shopping Revolving Balance*
31
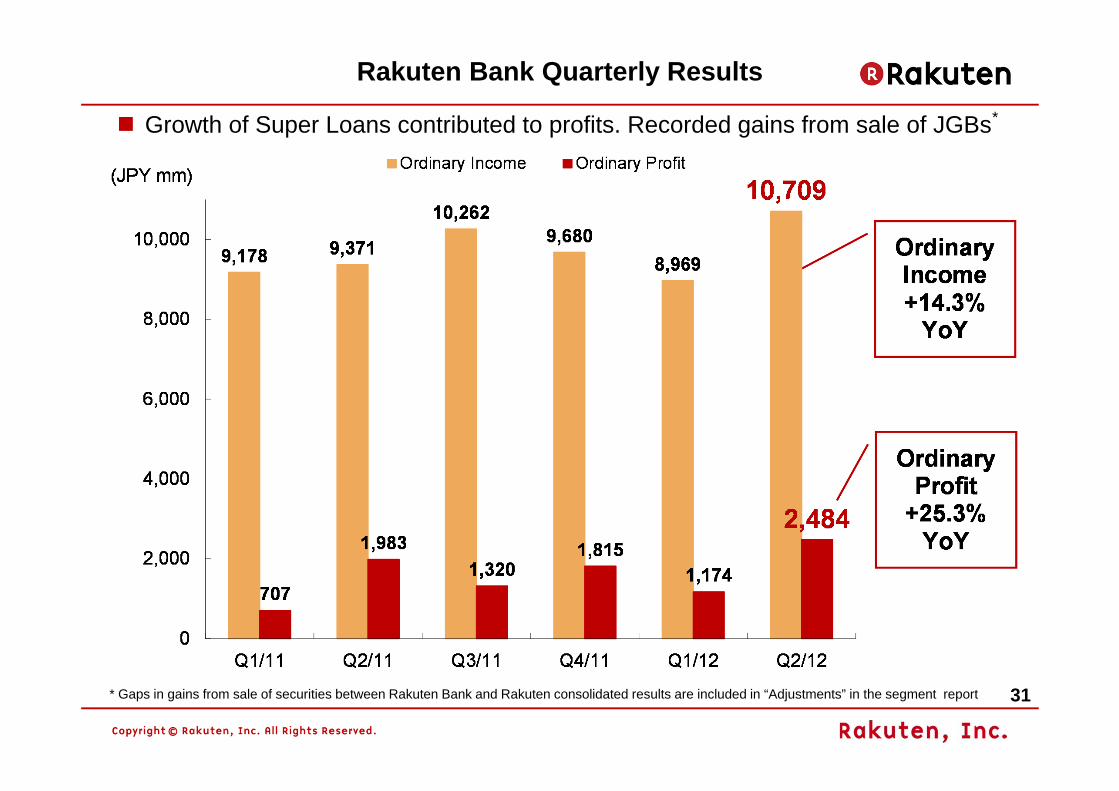
Rakuten Bank Quarterly Results
Growth of Super Loans contributed to profits. Recorded gains from sale of JGBs*
* Gaps in gains from sale of securities between Rakuten Bank and Rakuten consolidated results are included in “Adjustments” in the segment report
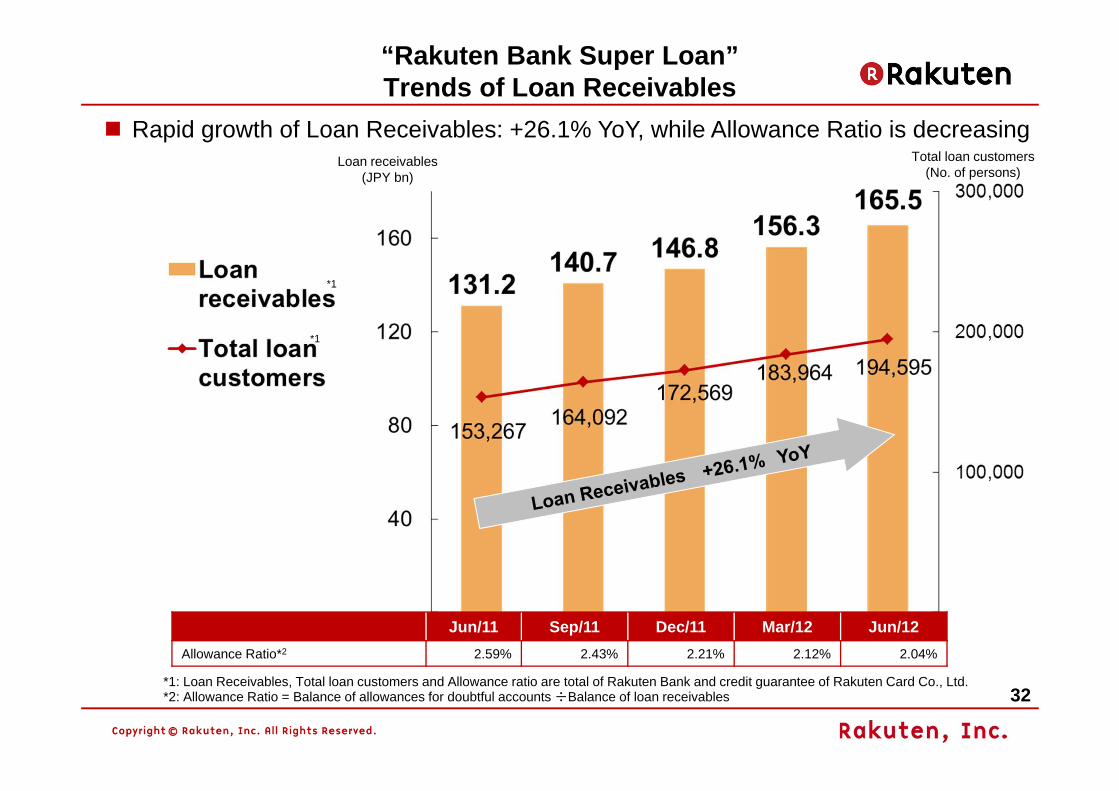
32*1: Loan Receivables, Total loan customers and Allowance ratio are total of Rakuten Bank and credit guarantee of Rakuten Card Co., Ltd.*2: Allowance Ratio = Balance of allowances for doubtful accounts ÷Balance of loan receivables
*1
Loan receivables(JPY bn)
Total loan customers(No. of persons)
*1
Jun/11 Sep/11 Dec/11 Mar/12 Jun/12Allowance Ratio*2 2.59% 2.43% 2.21% 2.12% 2.04%
Rapid growth of Loan Receivables: +26.1% YoY, while Allowance Ratio is decreasing
“Rakuten Bank Super Loan”Trends of Loan Receivables
33
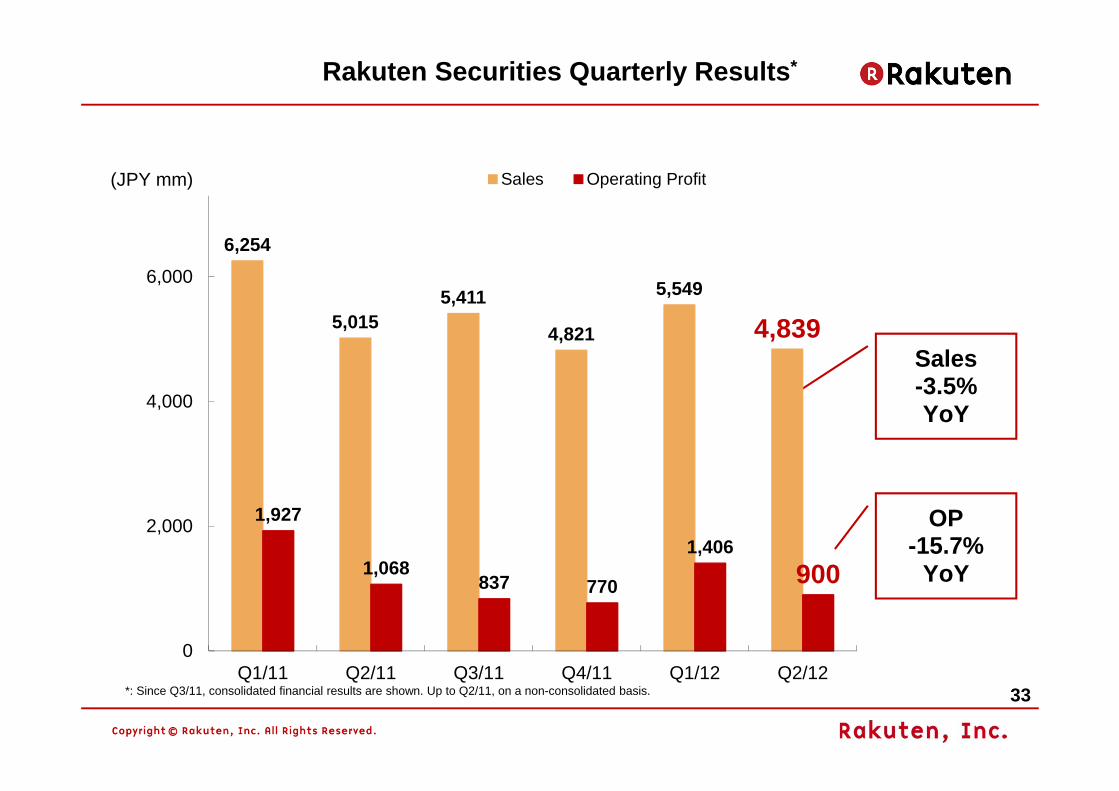
Rakuten Securities Quarterly Results*
*: Since Q3/11, consolidated financial results are shown. Up to Q2/11, on a non-consolidated basis.
Sales-3.5%YoY
OP-15.7%
YoY
6,254
5,0155,411
4,821
5,549
4,839
1,927
1,068837 770
1,406900
0
2,000
4,000
6,000
Q1/11 Q2/11 Q3/11 Q4/11 Q1/12 Q2/12
Sales Operating Profit(JPY mm)
34
0.0
10.0
20.0
30.0
40.0
50.0
60.0
70.0
0
20
40
60
80
100
120
Apr May Jun Jul Aug Sep Oct Nov Dec Jan Feb Mar Apr May Jun
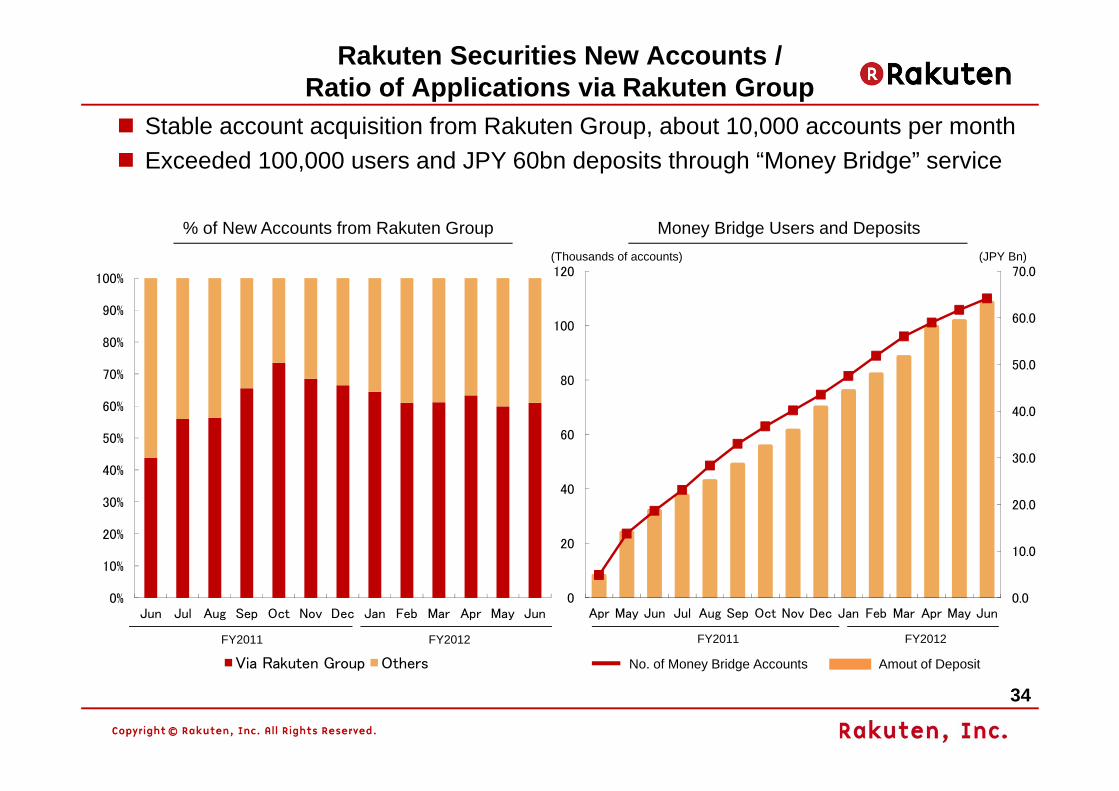
Rakuten Securities New Accounts /Ratio of Applications via Rakuten Group
% of New Accounts from Rakuten Group
Stable account acquisition from Rakuten Group, about 10,000 accounts per monthExceeded 100,000 users and JPY 60bn deposits through “Money Bridge” service
FY2011 FY2012
Money Bridge Users and Deposits
FY2011 FY2012
(Thousands of accounts) (JPY Bn)
No. of Money Bridge Accounts Amout of Deposit
0%
10%
20%
30%
40%
50%
60%
70%
80%
90%
100%
Jun Jul Aug Sep Oct Nov Dec Jan Feb Mar Apr May Jun
Via Rakuten Group Others
35
Others6
36
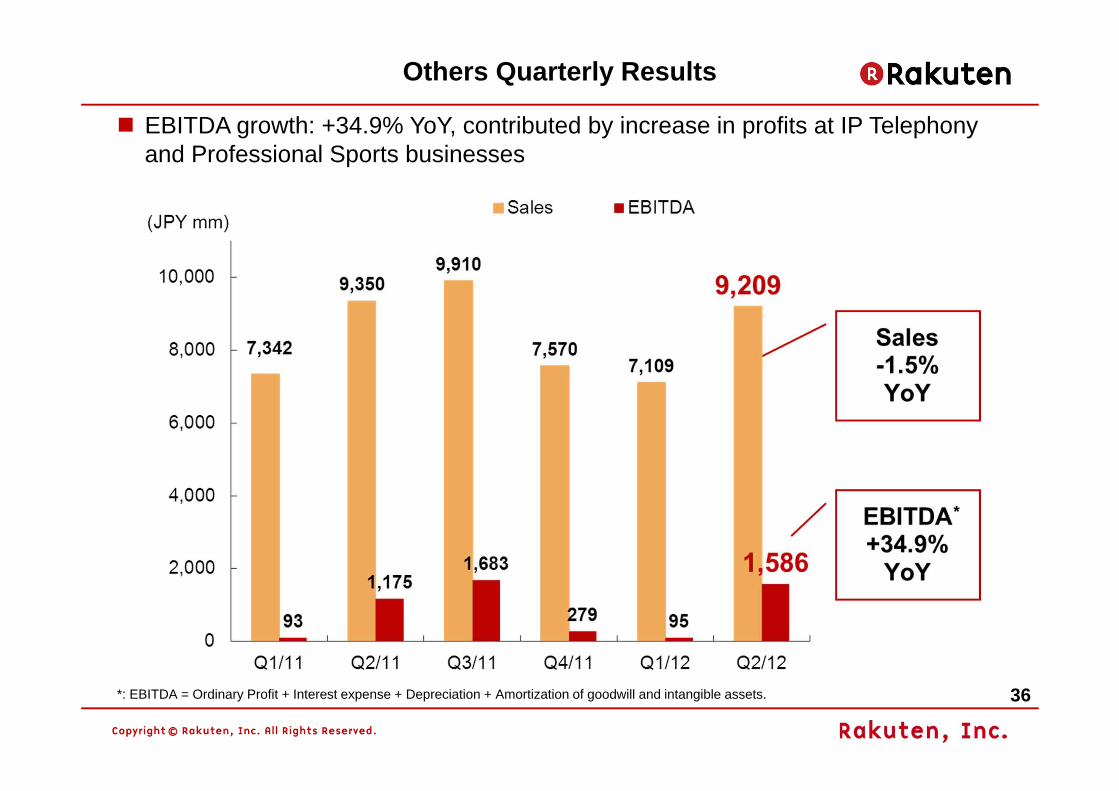
Others Quarterly Results
EBITDA growth: +34.9% YoY, contributed by increase in profits at IP Telephony and Professional Sports businesses
*: EBITDA = Ordinary Profit + Interest expense + Depreciation + Amortization of goodwill and intangible assets.
*
37
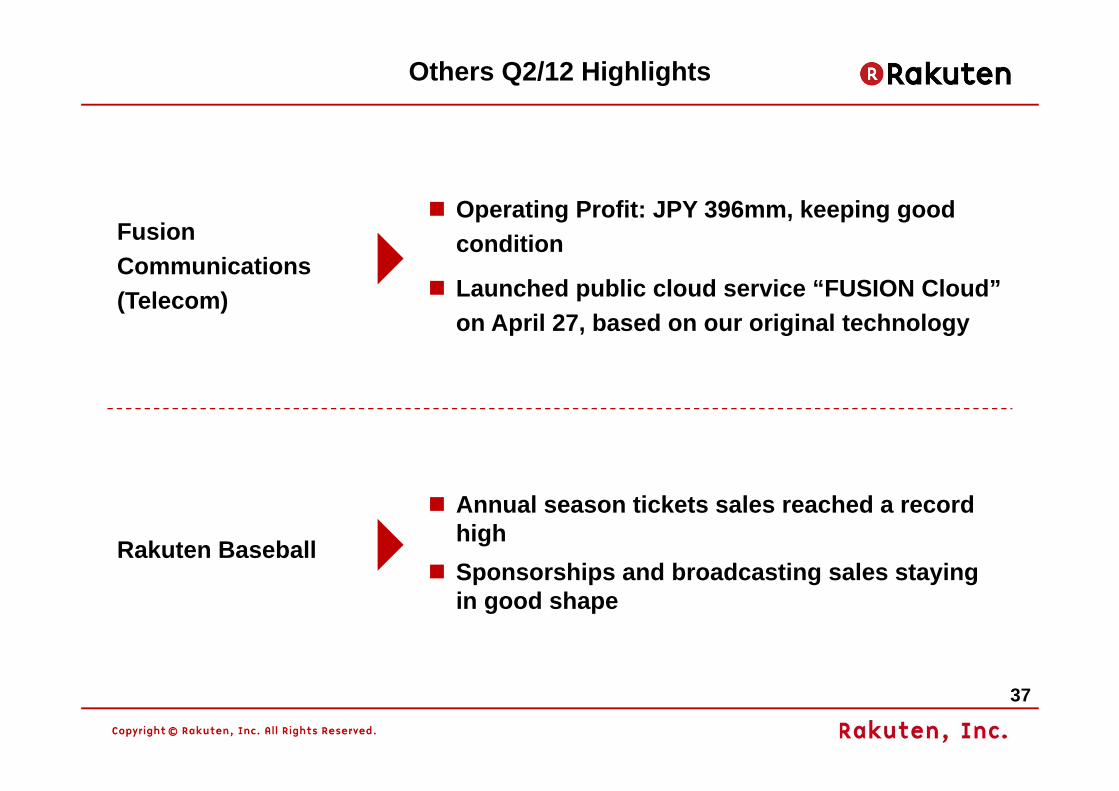
Others Q2/12 Highlights
Fusion Communications (Telecom)
Operating Profit: JPY 396mm, keeping good condition
Launched public cloud service “FUSION Cloud” on April 27, based on our original technology
Rakuten Baseball
Annual season tickets sales reached a record highSponsorships and broadcasting sales staying in good shape
38
⁃ Reference Information of Internet Services Segment andConsolidated Operating Expenses
⁃ Financial Condition⁃ Other Information
Appendix
39
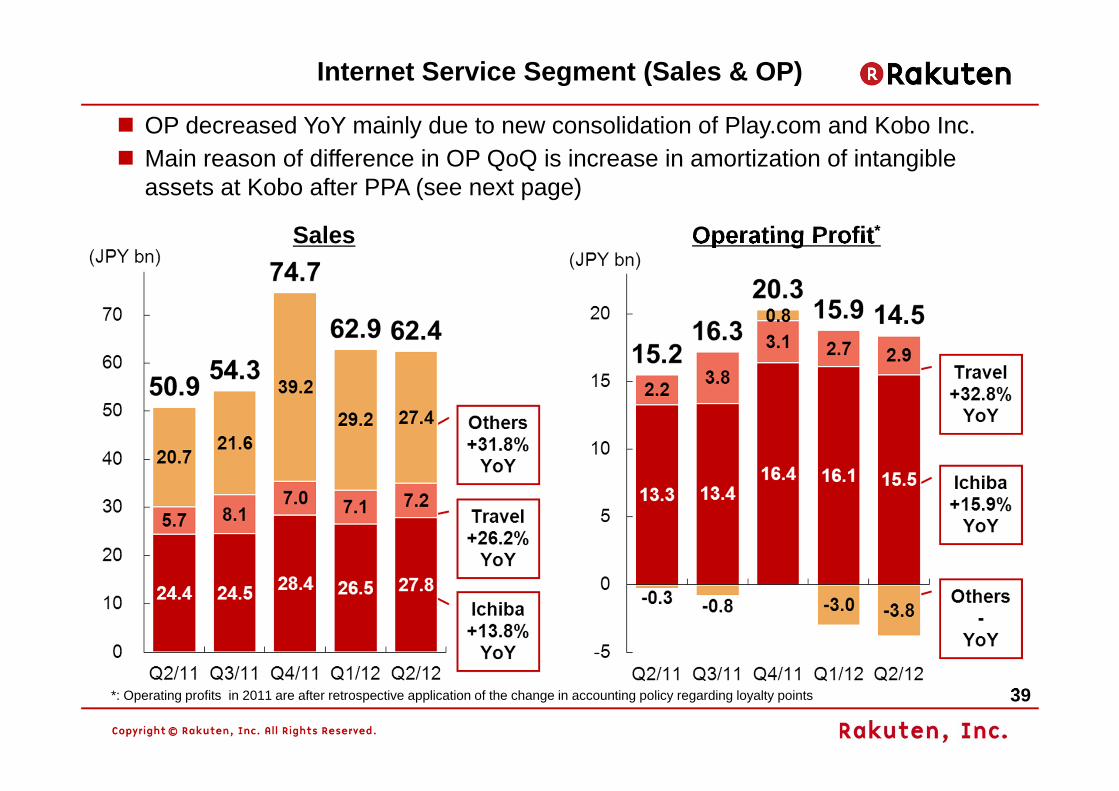
Internet Service Segment (Sales & OP)
OP decreased YoY mainly due to new consolidation of Play.com and Kobo Inc.Main reason of difference in OP QoQ is increase in amortization of intangible assets at Kobo after PPA (see next page)
Operating Profit*Sales
*: Operating profits in 2011 are after retrospective application of the change in accounting policy regarding loyalty points
40
At the acquisition of Kobo, before completion of asset evaluation process, Rakuten temporarily recognized the difference between acquisition price and book value as goodwill in Q1.
In accordance with standards of purchase price allocation, Rakuten, upon the advice of our auditors, identified value and recognized intangible assets replacing goodwill.
Compared to time periods for goodwill (20 years), amortization periods for intangible assets are generally shorter, which resulted in increase of non-cash amortization cost in Q2 compared to Q1.
While amortization of goodwill was booked in ‘Adjustments’ in Q1, amortization of intangible assets was booked within the ‘Internet Services’ segment in Q2.
Kobo PPA (Purchase Price Allocation)
41
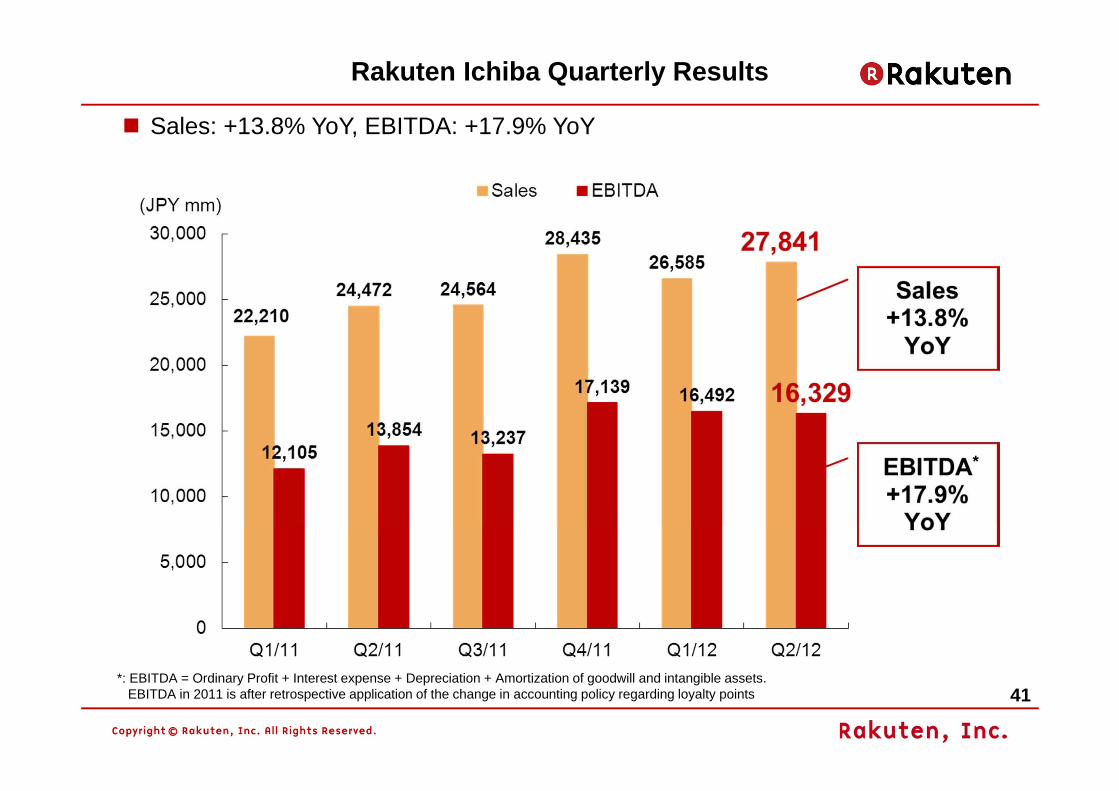
Rakuten Ichiba Quarterly Results
Sales: +13.8% YoY, EBITDA: +17.9% YoY
*
*: EBITDA = Ordinary Profit + Interest expense + Depreciation + Amortization of goodwill and intangible assets.EBITDA in 2011 is after retrospective application of the change in accounting policy regarding loyalty points
42
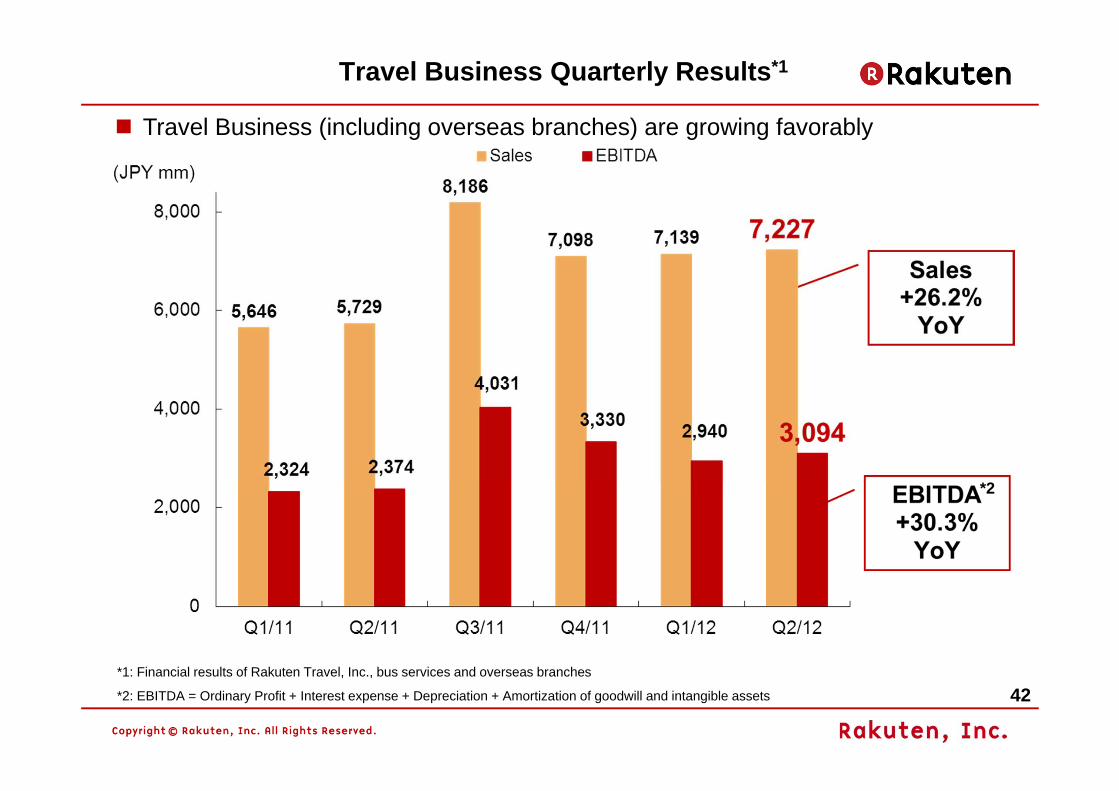
Travel Business Quarterly Results*1
*2
*1: Financial results of Rakuten Travel, Inc., bus services and overseas branches
*2: EBITDA = Ordinary Profit + Interest expense + Depreciation + Amortization of goodwill and intangible assets
Travel Business (including overseas branches) are growing favorably
43
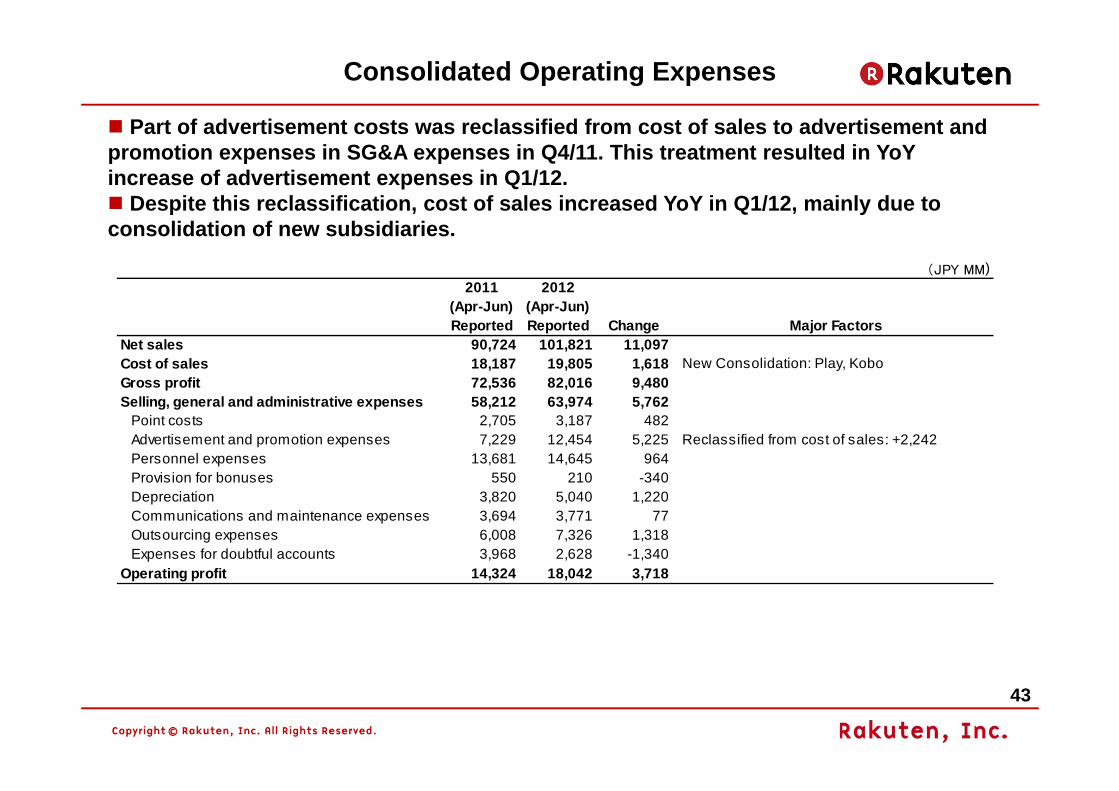
Consolidated Operating Expenses
Part of advertisement costs was reclassified from cost of sales to advertisement and promotion expenses in SG&A expenses in Q4/11. This treatment resulted in YoY increase of advertisement expenses in Q1/12.
Despite this reclassification, cost of sales increased YoY in Q1/12, mainly due to consolidation of new subsidiaries.
(JPY MM)2011 2012
(Apr-Jun) (Apr-Jun)Reported Reported Change Major Factors
Net sales 90,724 101,821 11,097Cost of sales 18,187 19,805 1,618 New Consolidation: Play, KoboGross profit 72,536 82,016 9,480Selling, general and administrative expenses 58,212 63,974 5,762
Point costs 2,705 3,187 482Advertisement and promotion expenses 7,229 12,454 5,225 Reclassified from cost of sales: +2,242Personnel expenses 13,681 14,645 964Provision for bonuses 550 210 -340Depreciation 3,820 5,040 1,220Communications and maintenance expenses 3,694 3,771 77Outsourcing expenses 6,008 7,326 1,318Expenses for doubtful accounts 3,968 2,628 -1,340
Operating profit 14,324 18,042 3,718
44
Financial Condition
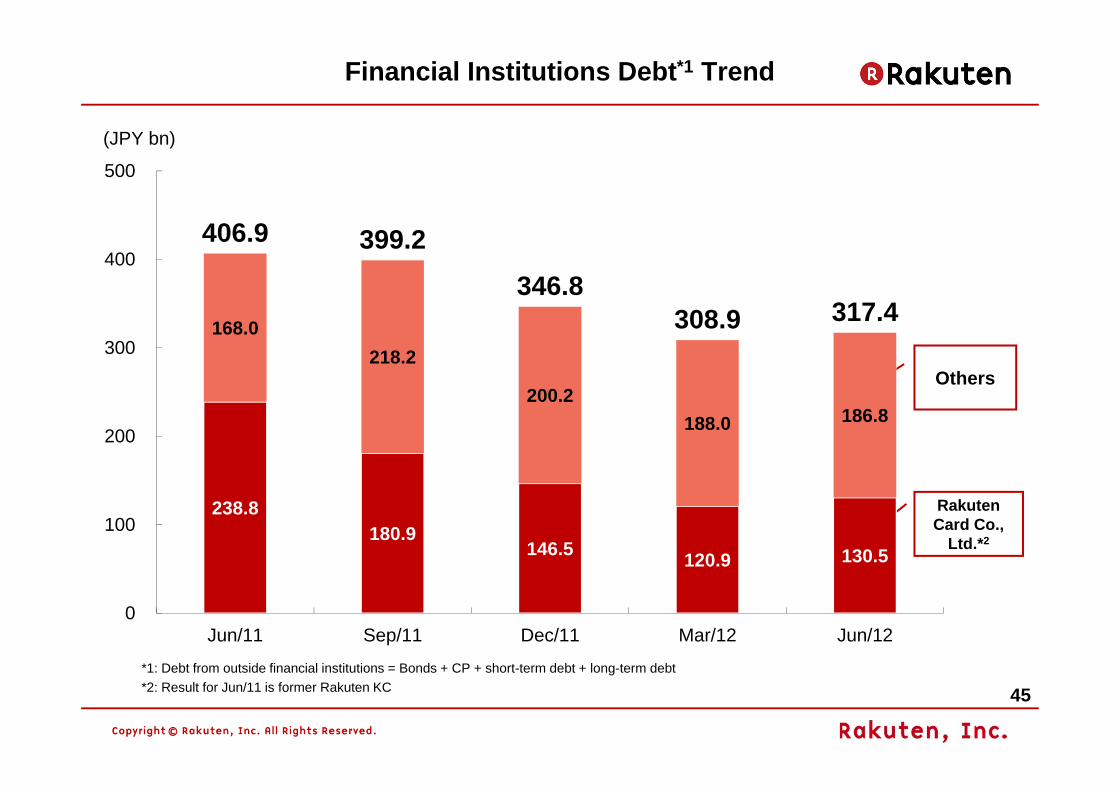
45*1: Debt from outside financial institutions = Bonds + CP + short-term debt + long-term debt*2: Result for Jun/11 is former Rakuten KC
RakutenCard Co.,
Ltd.*2
Others
Financial Institutions Debt*1 Trend
238.8180.9
146.5 120.9 130.5
168.0218.2
200.2188.0 186.8
406.9 399.2
346.8308.9 317.4
0
100
200
300
400
500
Jun/11 Sep/11 Dec/11 Mar/12 Jun/12
(JPY bn)
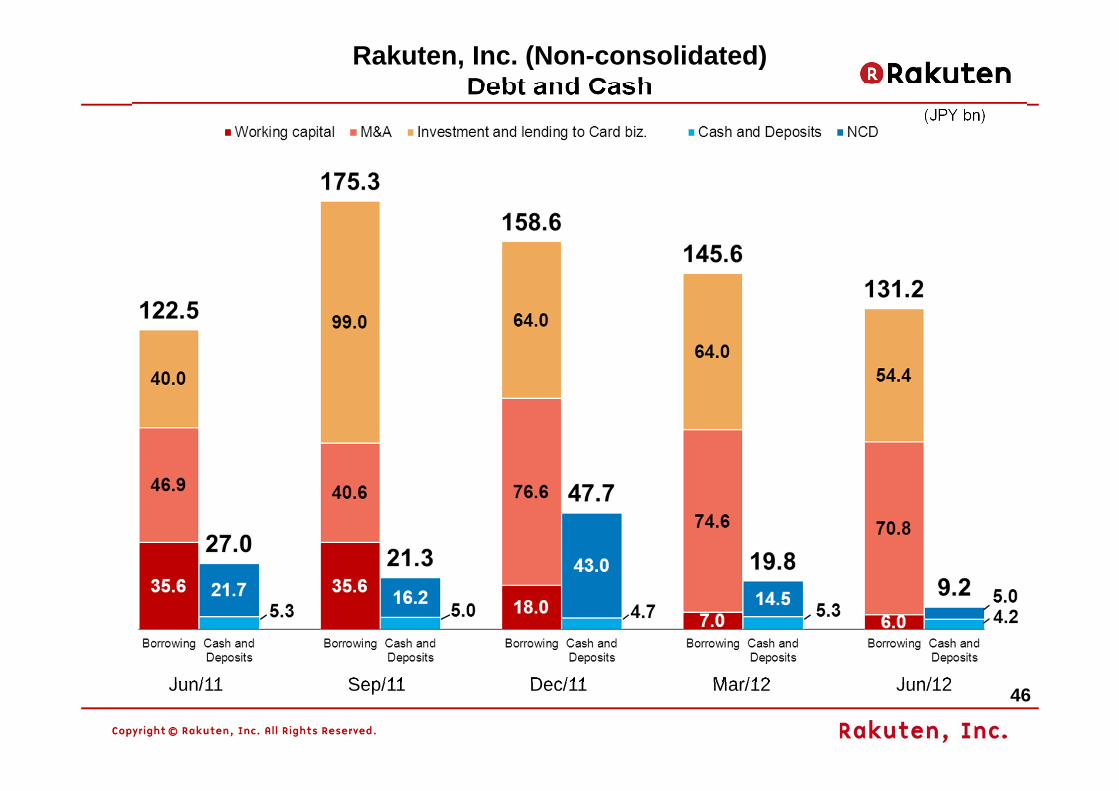
46Sep/11 Dec/11 Mar/12 Jun/12
(JPY bn)
Rakuten, Inc. (Non-consolidated) Debt and Cash
Jun/11
47
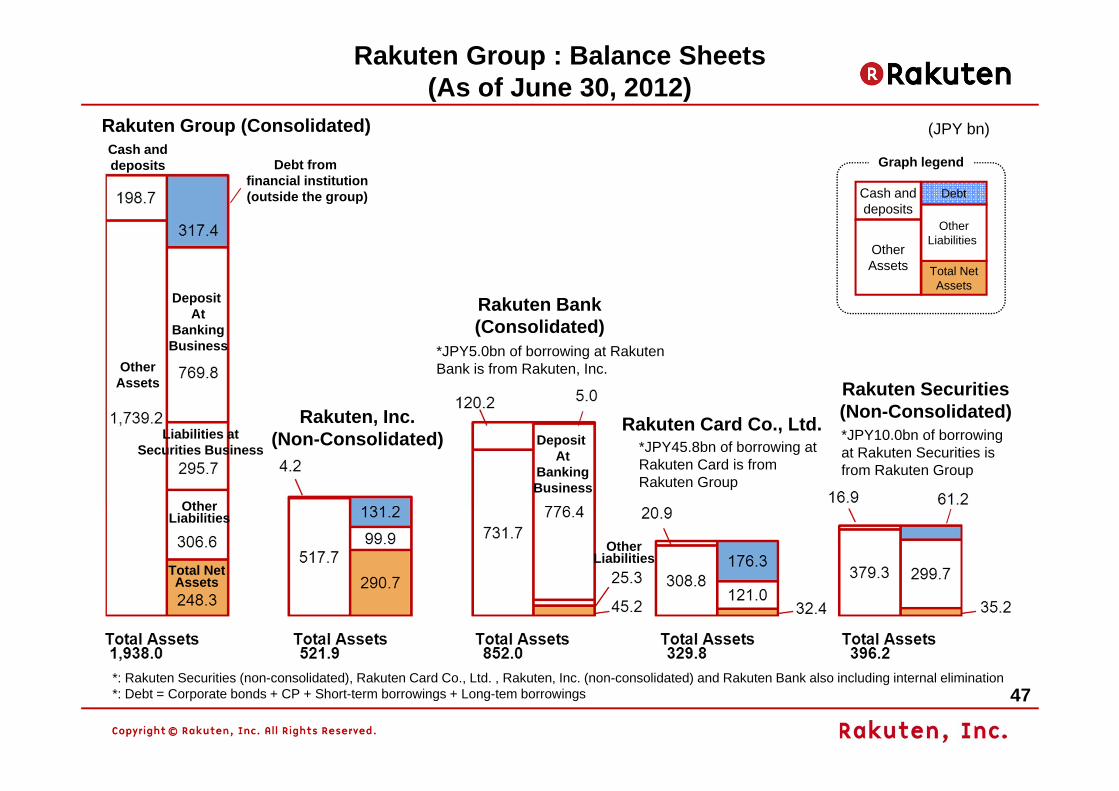
Rakuten Group (Consolidated)
*: Rakuten Securities (non-consolidated), Rakuten Card Co., Ltd. , Rakuten, Inc. (non-consolidated) and Rakuten Bank also including internal elimination*: Debt = Corporate bonds + CP + Short-term borrowings + Long-tem borrowings
Cash anddeposits
Total NetAssets
OtherAssets
OtherLiabilities
Debt
Graph legend
Rakuten Securities (Non-Consolidated)*JPY10.0bn of borrowing at Rakuten Securities is from Rakuten Group
Other Liabilities
Liabilities at Securities Business
Deposit At
BankingBusiness
Other Assets
Debt from financial institution(outside the group)
Cash and deposits
Total Net Assets
Rakuten Card Co., Ltd.
Rakuten Bank(Consolidated)
*JPY5.0bn of borrowing at Rakuten Bank is from Rakuten, Inc.
Rakuten, Inc.(Non-Consolidated)
(JPY bn)
Rakuten Group : Balance Sheets(As of June 30, 2012)
*JPY45.8bn of borrowing at Rakuten Card is from Rakuten Group
Deposit At
BankingBusiness
Other Liabilities
48
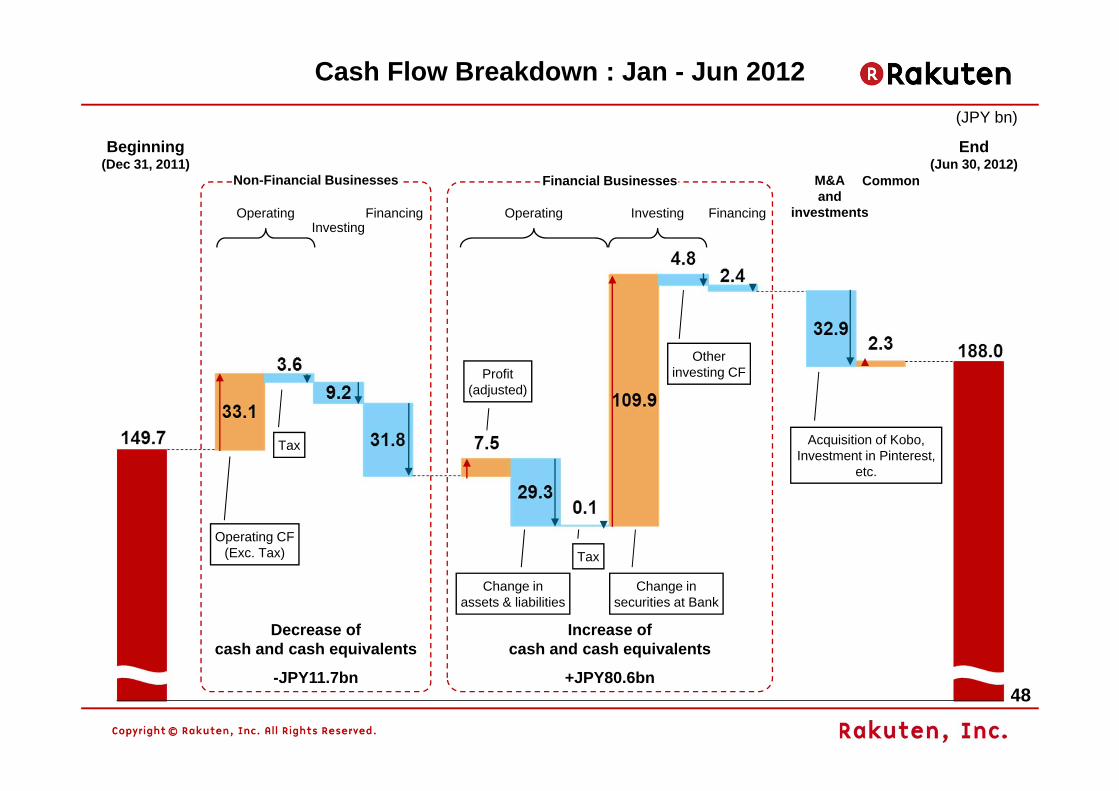
Cash Flow Breakdown : Jan - Jun 2012
Operating CF(Exc. Tax)
Tax
Change inassets & liabilities
Profit(adjusted)
Decrease of cash and cash equivalents
-JPY11.7bn
Increase of cash and cash equivalents
+JPY80.6bn
OperatingInvesting
FinancingOperating
Beginning(Dec 31, 2011)
End(Jun 30, 2012)
Non-Financial Businesses Financial Businesses
Tax
(JPY bn)
Investing Financing
M&Aand
investments
Common
Change insecurities at Bank
Otherinvesting CF
Acquisition of Kobo,Investment in Pinterest,
etc.
49
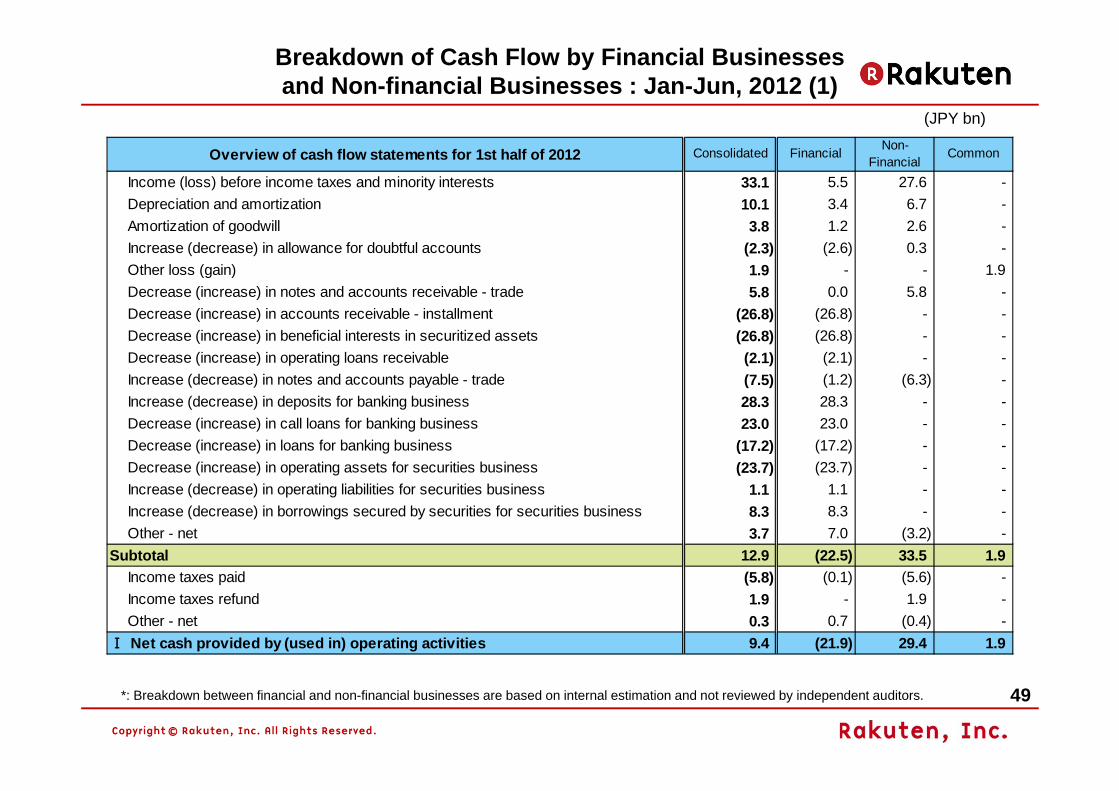
Breakdown of Cash Flow by Financial Businesses and Non-financial Businesses : Jan-Jun, 2012 (1)
(JPY bn)
*: Breakdown between financial and non-financial businesses are based on internal estimation and not reviewed by independent auditors.
Overview of cash flow statements for 1st half of 2012 Consolidated Financial Non-Financial
Common
Income (loss) before income taxes and minority interests 33.1 5.5 27.6 - Depreciation and amortization 10.1 3.4 6.7 - Amortization of goodwill 3.8 1.2 2.6 - Increase (decrease) in allowance for doubtful accounts (2.3) (2.6) 0.3 - Other loss (gain) 1.9 - - 1.9Decrease (increase) in notes and accounts receivable - trade 5.8 0.0 5.8 - Decrease (increase) in accounts receivable - installment (26.8) (26.8) - - Decrease (increase) in beneficial interests in securitized assets (26.8) (26.8) - - Decrease (increase) in operating loans receivable (2.1) (2.1) - - Increase (decrease) in notes and accounts payable - trade (7.5) (1.2) (6.3) - Increase (decrease) in deposits for banking business 28.3 28.3 - - Decrease (increase) in call loans for banking business 23.0 23.0 - - Decrease (increase) in loans for banking business (17.2) (17.2) - - Decrease (increase) in operating assets for securities business (23.7) (23.7) - - Increase (decrease) in operating liabilities for securities business 1.1 1.1 - - Increase (decrease) in borrowings secured by securities for securities business 8.3 8.3 - - Other - net 3.7 7.0 (3.2) -
Subtotal 12.9 (22.5) 33.5 1.9Income taxes paid (5.8) (0.1) (5.6) - Income taxes refund 1.9 - 1.9 - Other - net 0.3 0.7 (0.4) -
Ⅰ Net cash provided by (used in) operating activities 9.4 (21.9) 29.4 1.9
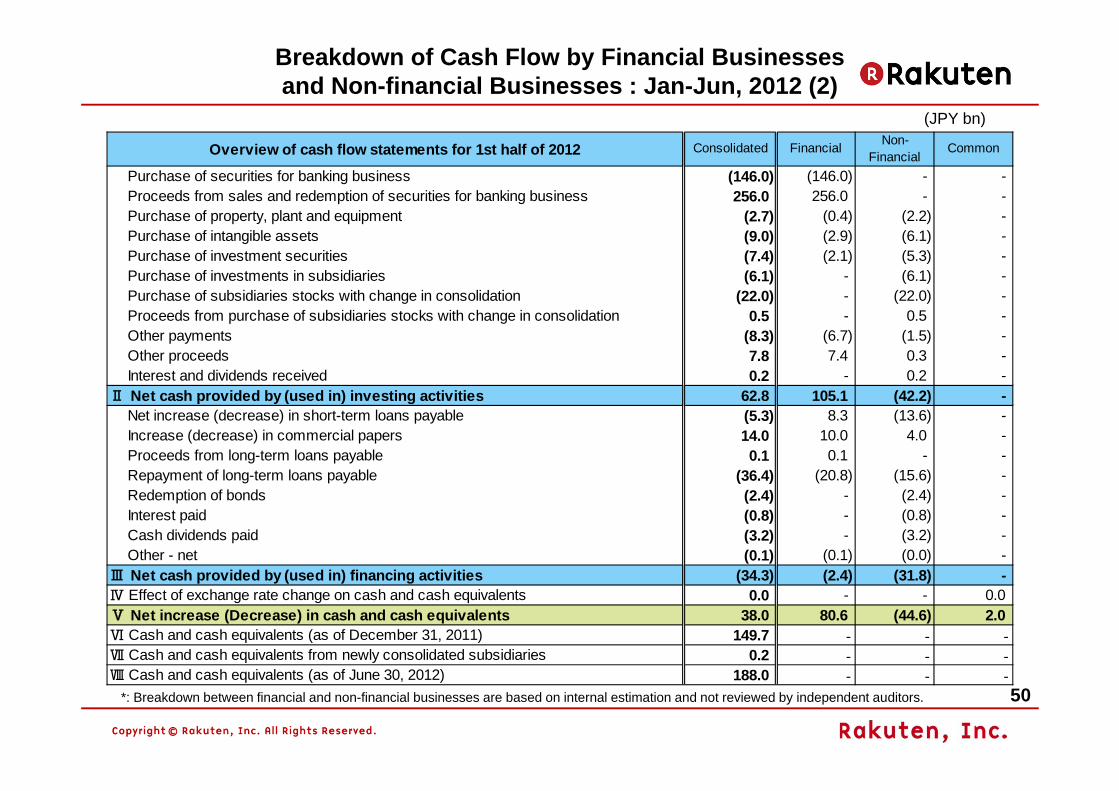
50*: Breakdown between financial and non-financial businesses are based on internal estimation and not reviewed by independent auditors.
(JPY bn)
Breakdown of Cash Flow by Financial Businesses and Non-financial Businesses : Jan-Jun, 2012 (2)
Overview of cash flow statements for 1st half of 2012 Consolidated Financial Non-Financial
Common
Purchase of securities for banking business (146.0) (146.0) - - Proceeds from sales and redemption of securities for banking business 256.0 256.0 - - Purchase of property, plant and equipment (2.7) (0.4) (2.2) - Purchase of intangible assets (9.0) (2.9) (6.1) - Purchase of investment securities (7.4) (2.1) (5.3) - Purchase of investments in subsidiaries (6.1) - (6.1) - Purchase of subsidiaries stocks with change in consolidation (22.0) - (22.0) - Proceeds from purchase of subsidiaries stocks with change in consolidation 0.5 - 0.5 - Other payments (8.3) (6.7) (1.5) - Other proceeds 7.8 7.4 0.3 - Interest and dividends received 0.2 - 0.2 -
Ⅱ Net cash provided by (used in) investing activities 62.8 105.1 (42.2) - Net increase (decrease) in short-term loans payable (5.3) 8.3 (13.6) - Increase (decrease) in commercial papers 14.0 10.0 4.0 - Proceeds from long-term loans payable 0.1 0.1 - - Repayment of long-term loans payable (36.4) (20.8) (15.6) - Redemption of bonds (2.4) - (2.4) - Interest paid (0.8) - (0.8) - Cash dividends paid (3.2) - (3.2) - Other - net (0.1) (0.1) (0.0) -
Ⅲ Net cash provided by (used in) financing activities (34.3) (2.4) (31.8) - Ⅳ Effect of exchange rate change on cash and cash equivalents 0.0 - - 0.0Ⅴ Net increase (Decrease) in cash and cash equivalents 38.0 80.6 (44.6) 2.0Ⅵ Cash and cash equivalents (as of December 31, 2011) 149.7 ‐ ‐ ‐
Ⅶ Cash and cash equivalents from newly consolidated subsidiaries 0.2 ‐ ‐ ‐
Ⅷ Cash and cash equivalents (as of June 30, 2012) 188.0 ‐ ‐ ‐
51
Other Information
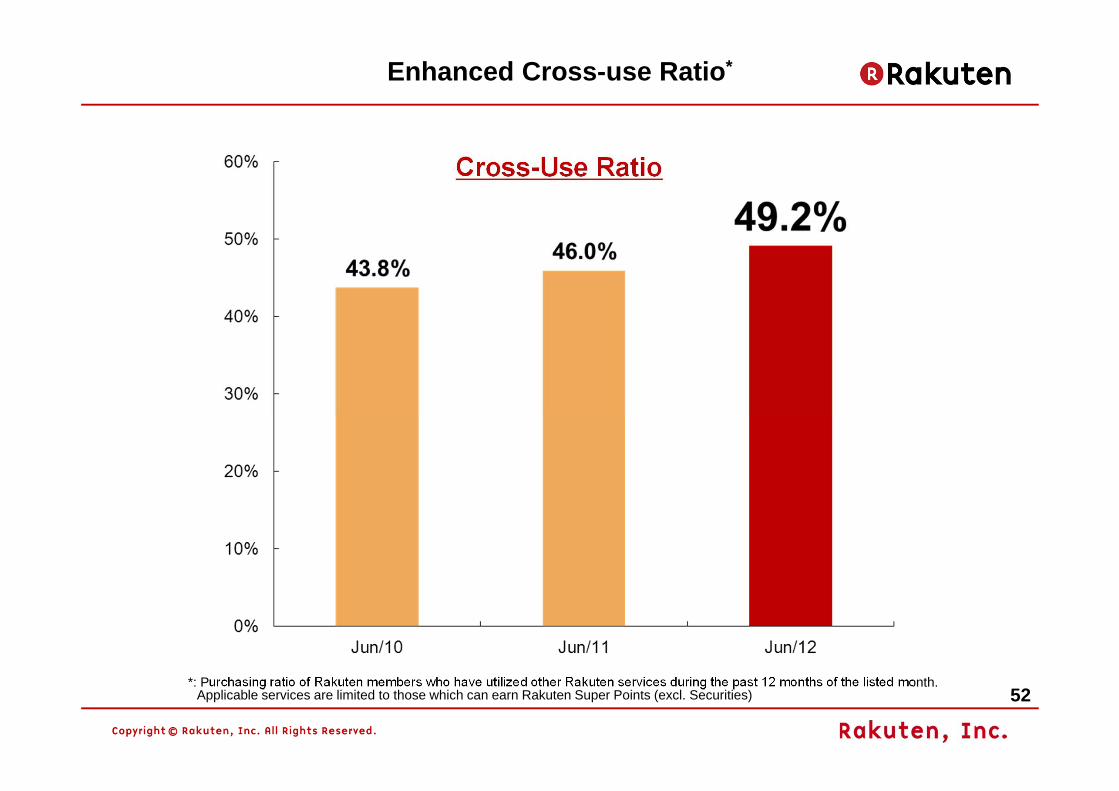
52*: Purchasing ratio of Rakuten members who have utilized other Rakuten services during the past 12 months of the listed month.
Applicable services are limited to those which can earn Rakuten Super Points (excl. Securities)
Cross-Use Ratio
Enhanced Cross-use Ratio*
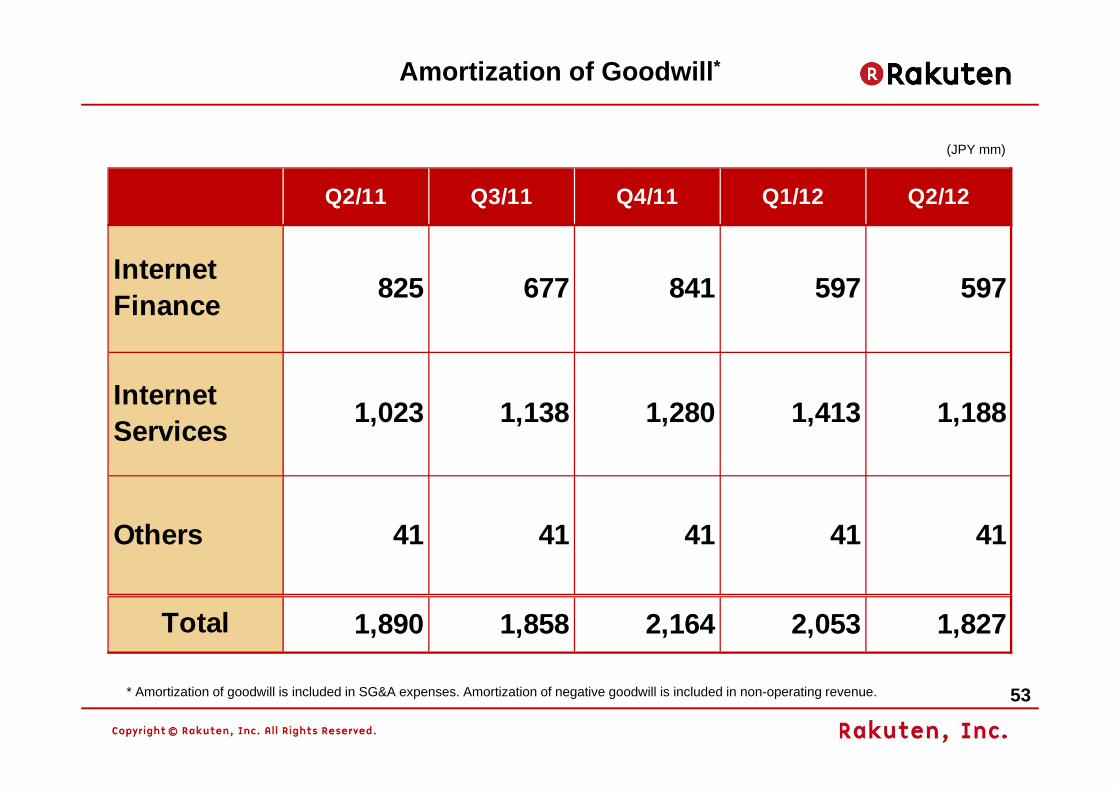
53* Amortization of goodwill is included in SG&A expenses. Amortization of negative goodwill is included in non-operating revenue.
(JPY mm)
Amortization of Goodwill*
Q2/11 Q3/11 Q4/11 Q1/12 Q2/12
1,890 1,858 2,164 2,053 1,827
597
1,188
41
597
1,413
41
841
1,280
41
1,023
41
825
Total
InternetFinance
InternetServices
Others
677
1,138
41
54
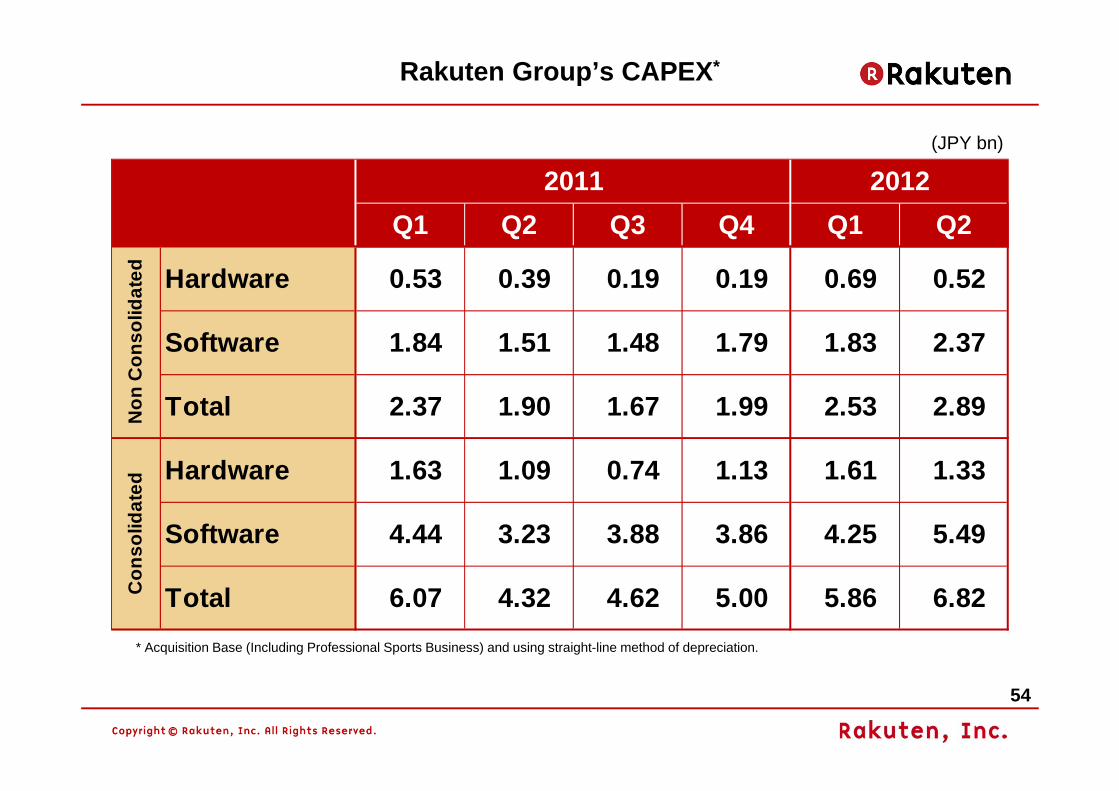
* Acquisition Base (Including Professional Sports Business) and using straight-line method of depreciation.
(JPY bn)
Rakuten Group’s CAPEX*
Q1 Q2 Q3 Q4 Q1 Q2
Hardware 0.53 0.39 0.19 0.19 0.69 0.52
Software 1.84 1.51 1.48 1.79 1.83 2.37
Total 2.37 1.90 1.67 1.99 2.53 2.89
Hardware 1.63 1.09 0.74 1.13 1.61 1.33
Software 4.44 3.23 3.88 3.86 4.25 5.49
Total 6.07 4.32 4.62 5.00 5.86 6.82
2011 2012
Non
Con
solid
ated
Con
solid
ated
55
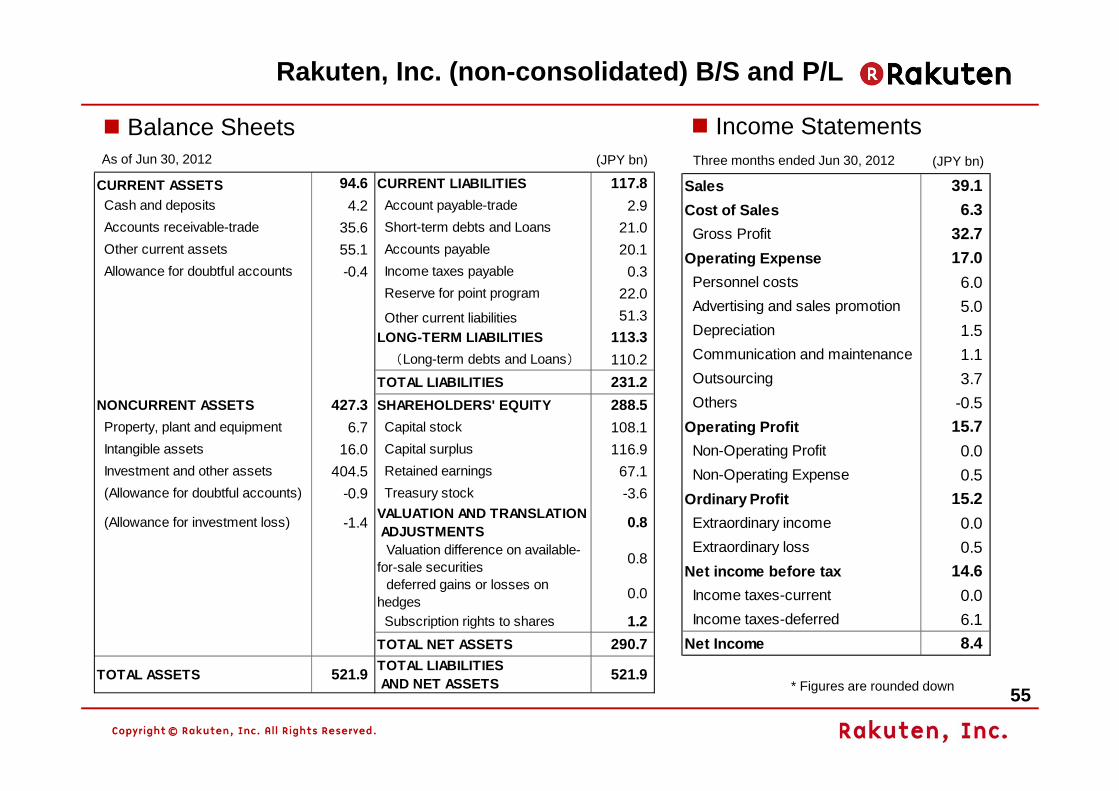
Rakuten, Inc. (non-consolidated) B/S and P/L
(JPY bn) (JPY bn)
* Figures are rounded down
Balance SheetsThree months ended Jun 30, 2012
Income StatementsAs of Jun 30, 2012
CURRENT ASSETS 94.6 CURRENT LIABILITIES 117.8 Cash and deposits 4.2 Account payable-trade 2.9 Accounts receivable-trade 35.6 Short-term debts and Loans 21.0 Other current assets 55.1 Accounts payable 20.1 Allowance for doubtful accounts -0.4 Income taxes payable 0.3
Reserve for point program 22.0 Other current liabilities 51.3LONG-TERM LIABILITIES 113.3 (Long-term debts and Loans) 110.2TOTAL LIABILITIES 231.2
NONCURRENT ASSETS 427.3 SHAREHOLDERS' EQUITY 288.5 Property, plant and equipment 6.7 Capital stock 108.1 Intangible assets 16.0 Capital surplus 116.9 Investment and other assets 404.5 Retained earnings 67.1 (Allowance for doubtful accounts) -0.9 Treasury stock -3.6
(Allowance for investment loss) -1.4 VALUATION AND TRANSLATION ADJUSTMENTS 0.8
Valuation difference on available-for-sale securities 0.8
deferred gains or losses onhedges 0.0
Subscription rights to shares 1.2TOTAL NET ASSETS 290.7
TOTAL ASSETS 521.9 TOTAL LIABILITIES AND NET ASSETS 521.9
Sales 39.1Cost of Sales 6.3 Gross Profit 32.7Operating Expense 17.0 Personnel costs 6.0 Advertising and sales promotion 5.0 Depreciation 1.5 Communication and maintenance 1.1 Outsourcing 3.7 Others -0.5Operating Profit 15.7 Non-Operating Profit 0.0 Non-Operating Expense 0.5Ordinary Profit 15.2 Extraordinary income 0.0 Extraordinary loss 0.5Net income before tax 14.6 Income taxes-current 0.0 Income taxes-deferred 6.1Net Income 8.4
56
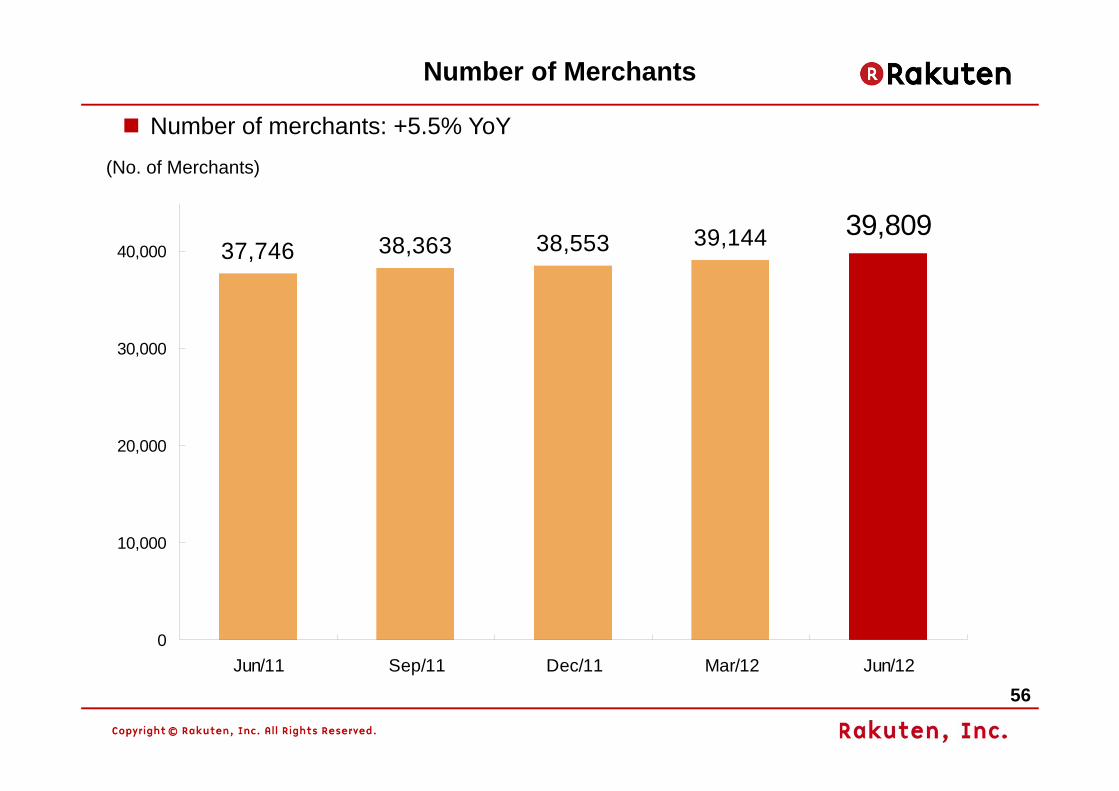
Number of merchants: +5.5% YoY(No. of Merchants)
Number of Merchants
37,746 38,363 38,553 39,144 39,809
0
10,000
20,000
30,000
40,000
Jun/11 Sep/11 Dec/11 Mar/12 Jun/12
57
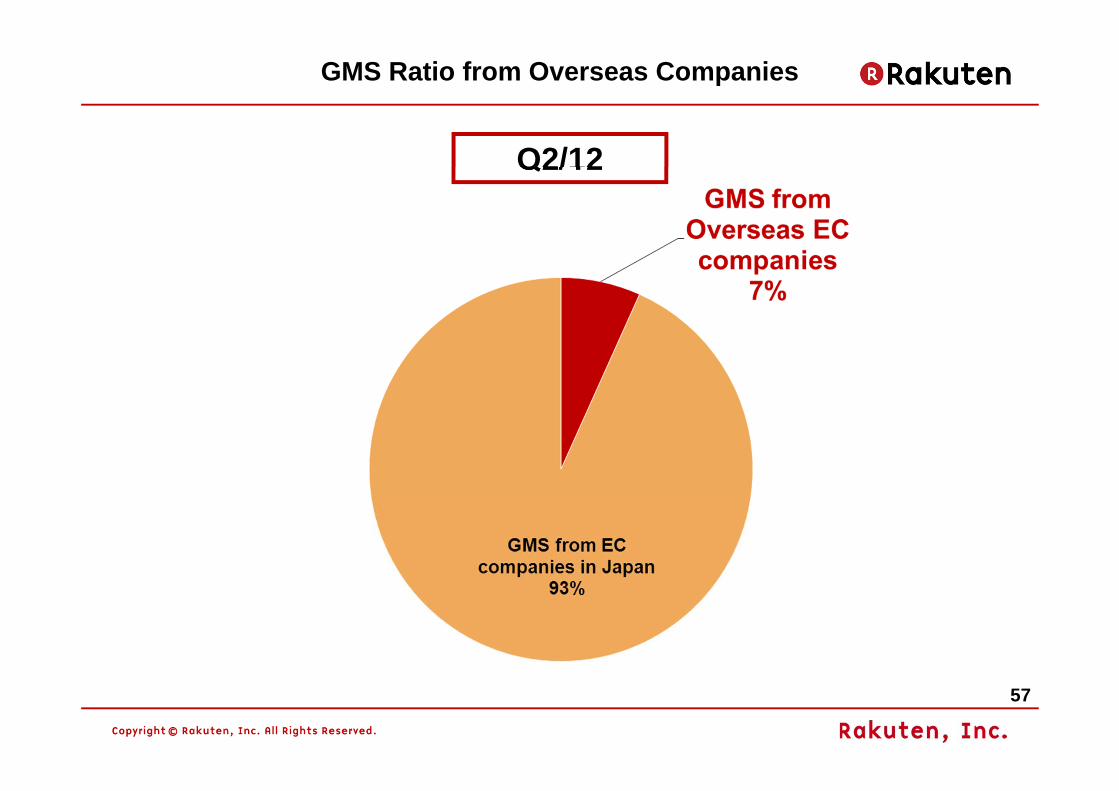
GMS Ratio from Overseas Companies
Q2/12
58
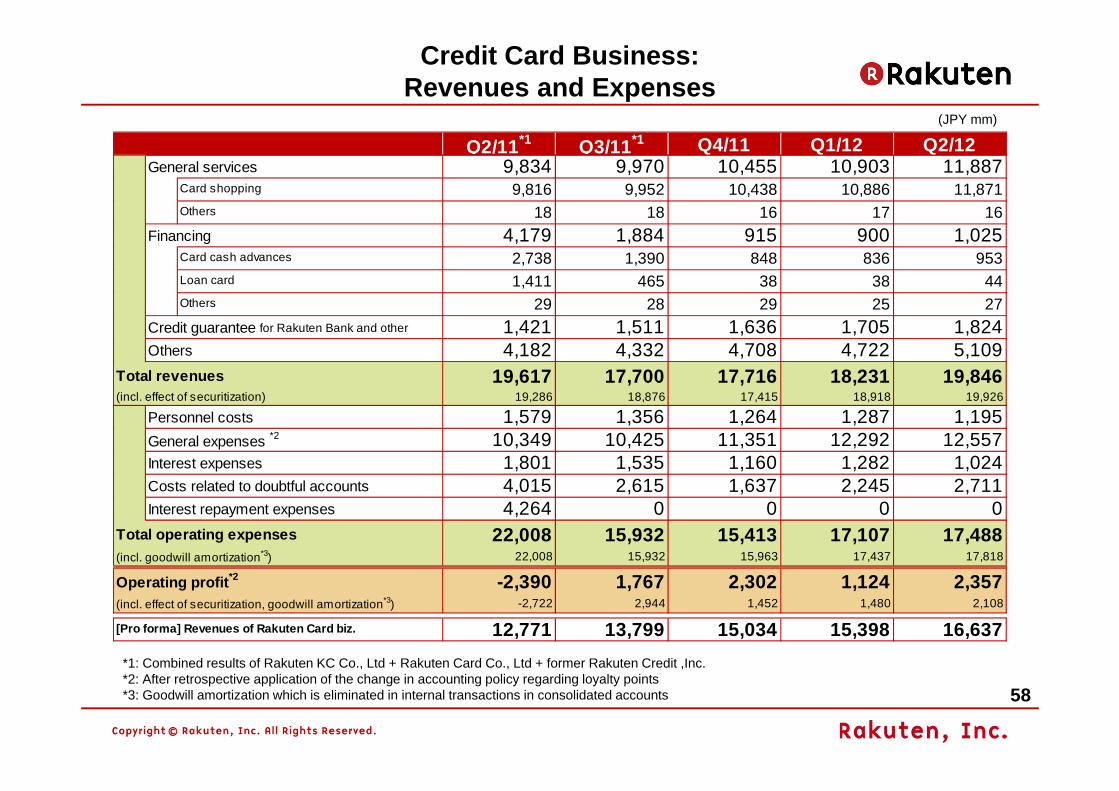
Credit Card Business:Revenues and Expenses
*1: Combined results of Rakuten KC Co., Ltd + Rakuten Card Co., Ltd + former Rakuten Credit ,Inc. *2: After retrospective application of the change in accounting policy regarding loyalty points*3: Goodwill amortization which is eliminated in internal transactions in consolidated accounts
(JPY mm)
Q2/11*1 Q3/11*1 Q4/11 Q1/12 Q2/12General services 9,834 9,970 10,455 10,903 11,887
Card shopping 9,816 9,952 10,438 10,886 11,871Others 18 18 16 17 16
Financing 4,179 1,884 915 900 1,025Card cash advances 2,738 1,390 848 836 953Loan card 1,411 465 38 38 44Others 29 28 29 25 27
Credit guarantee for Rakuten Bank and other 1,421 1,511 1,636 1,705 1,824Others 4,182 4,332 4,708 4,722 5,109
Total revenues 19,617 17,700 17,716 18,231 19,846(incl. effect of securitization) 19,286 18,876 17,415 18,918 19,926
Personnel costs 1,579 1,356 1,264 1,287 1,195General expenses *2 10,349 10,425 11,351 12,292 12,557Interest expenses 1,801 1,535 1,160 1,282 1,024Costs related to doubtful accounts 4,015 2,615 1,637 2,245 2,711Interest repayment expenses 4,264 0 0 0 0
Total operating expenses 22,008 15,932 15,413 17,107 17,488(incl. goodwill amortization*3) 22,008 15,932 15,963 17,437 17,818
Operating profit*2 -2,390 1,767 2,302 1,124 2,357(incl. effect of securitization, goodwill amortization*3) -2,722 2,944 1,452 1,480 2,108
[Pro forma] Revenues of Rakuten Card biz. 12,771 13,799 15,034 15,398 16,637
59
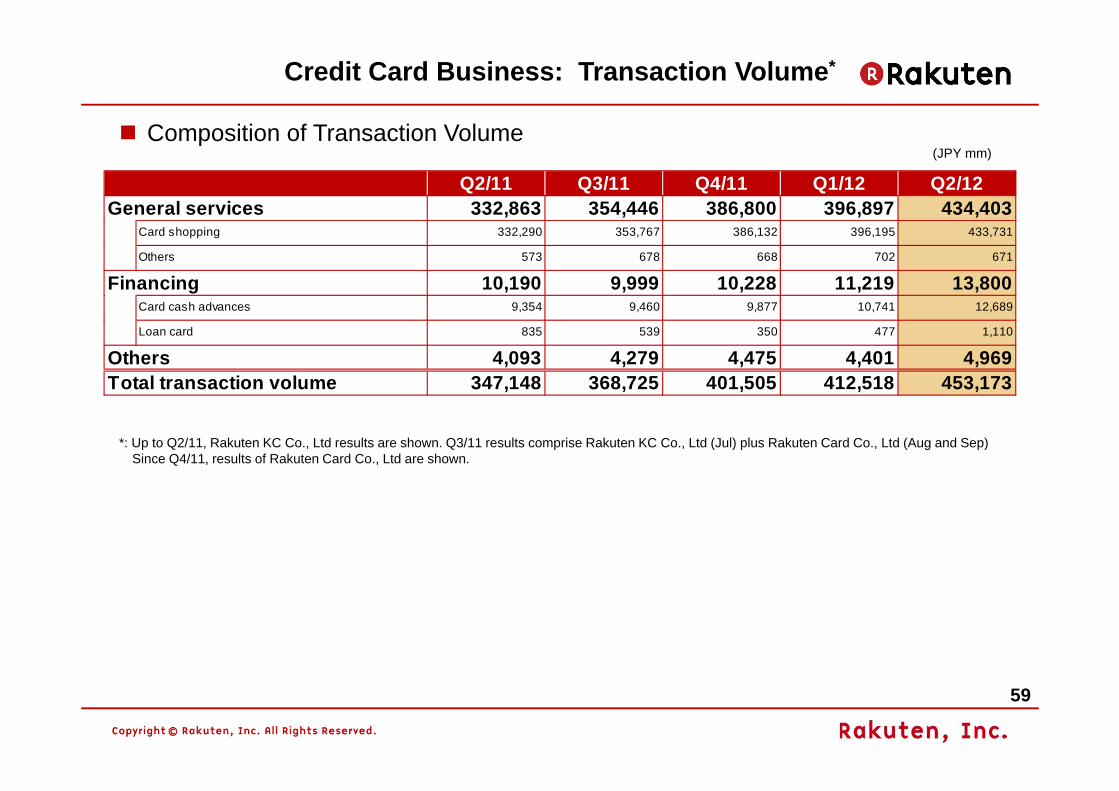
Credit Card Business: Transaction Volume*
Composition of Transaction Volume(JPY mm)
*: Up to Q2/11, Rakuten KC Co., Ltd results are shown. Q3/11 results comprise Rakuten KC Co., Ltd (Jul) plus Rakuten Card Co., Ltd (Aug and Sep)Since Q4/11, results of Rakuten Card Co., Ltd are shown.
Q2/11 Q3/11 Q4/11 Q1/12 Q2/12General services 332,863 354,446 386,800 396,897 434,403
Card shopping 332,290 353,767 386,132 396,195 433,731
Others 573 678 668 702 671
Financing 10,190 9,999 10,228 11,219 13,800Card cash advances 9,354 9,460 9,877 10,741 12,689
Loan card 835 539 350 477 1,110
Others 4,093 4,279 4,475 4,401 4,969Total transaction volume 347,148 368,725 401,505 412,518 453,173
60
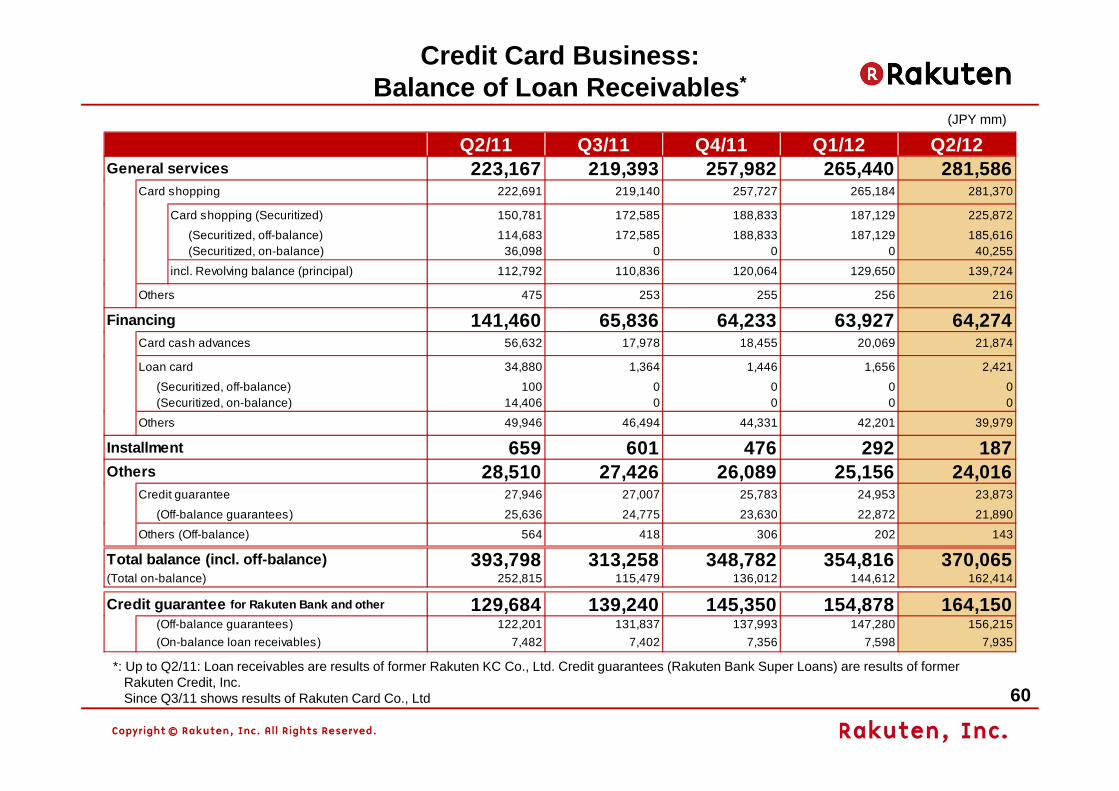
Credit Card Business:Balance of Loan Receivables*
(JPY mm)
*: Up to Q2/11: Loan receivables are results of former Rakuten KC Co., Ltd. Credit guarantees (Rakuten Bank Super Loans) are results of former Rakuten Credit, Inc. Since Q3/11 shows results of Rakuten Card Co., Ltd
Q2/11 Q3/11 Q4/11 Q1/12 Q2/12General services 223,167 219,393 257,982 265,440 281,586
Card shopping 222,691 219,140 257,727 265,184 281,370
Card shopping (Securitized) 150,781 172,585 188,833 187,129 225,872
(Securitized, off-balance) 114,683 172,585 188,833 187,129 185,616(Securitized, on-balance) 36,098 0 0 0 40,255
incl. Revolving balance (principal) 112,792 110,836 120,064 129,650 139,724
Others 475 253 255 256 216
Financing 141,460 65,836 64,233 63,927 64,274Card cash advances 56,632 17,978 18,455 20,069 21,874
Loan card 34,880 1,364 1,446 1,656 2,421
(Securitized, off-balance) 100 0 0 0 0(Securitized, on-balance) 14,406 0 0 0 0
Others 49,946 46,494 44,331 42,201 39,979
Installment 659 601 476 292 187Others 28,510 27,426 26,089 25,156 24,016
Credit guarantee 27,946 27,007 25,783 24,953 23,873
(Off-balance guarantees) 25,636 24,775 23,630 22,872 21,890
Others (Off-balance) 564 418 306 202 143
Total balance (incl. off-balance) 393,798 313,258 348,782 354,816 370,065(Total on-balance) 252,815 115,479 136,012 144,612 162,414
Credit guarantee for Rakuten Bank and other 129,684 139,240 145,350 154,878 164,150(Off-balance guarantees) 122,201 131,837 137,993 147,280 156,215(On-balance loan receivables) 7,482 7,402 7,356 7,598 7,935
61*2: Figures shown are the credit guarantee business of the Rakuten Card Co., Ltd (renamed from former Rakuten Credit, Inc.)*3: Includes an earthquake disaster reserve in the loan fund balance. Balance as of end June2012: JPY 336 mm
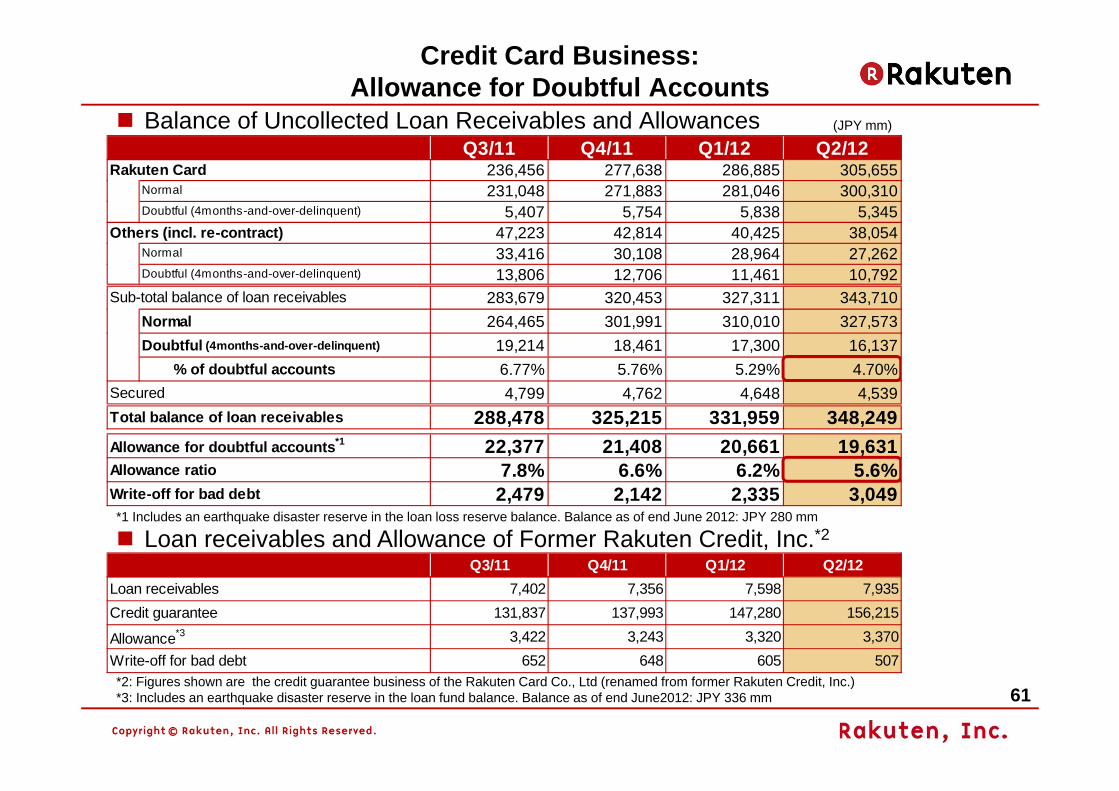
Credit Card Business: Allowance for Doubtful Accounts
Balance of Uncollected Loan Receivables and Allowances
Loan receivables and Allowance of Former Rakuten Credit, Inc.*2 *1 Includes an earthquake disaster reserve in the loan loss reserve balance. Balance as of end June 2012: JPY 280 mm
Q3/11 Q4/11 Q1/12 Q2/12Rakuten Card 236,456 277,638 286,885 305,655
Normal 231,048 271,883 281,046 300,310Doubtful (4months-and-over-delinquent) 5,407 5,754 5,838 5,345
Others (incl. re-contract) 47,223 42,814 40,425 38,054Normal 33,416 30,108 28,964 27,262Doubtful (4months-and-over-delinquent) 13,806 12,706 11,461 10,792
Sub-total balance of loan receivables 283,679 320,453 327,311 343,710Normal 264,465 301,991 310,010 327,573Doubtful (4months-and-over-delinquent) 19,214 18,461 17,300 16,137
% of doubtful accounts 6.77% 5.76% 5.29% 4.70%Secured 4,799 4,762 4,648 4,539Total balance of loan receivables 288,478 325,215 331,959 348,249Allowance for doubtful accounts*1 22,377 21,408 20,661 19,631Allowance ratio 7.8% 6.6% 6.2% 5.6%Write-off for bad debt 2,479 2,142 2,335 3,049
Q3/11 Q4/11 Q1/12 Q2/12Loan receivables 7,402 7,356 7,598 7,935Credit guarantee 131,837 137,993 147,280 156,215
Allowance*3 3,422 3,243 3,320 3,370Write-off for bad debt 652 648 605 507
(JPY mm)
62
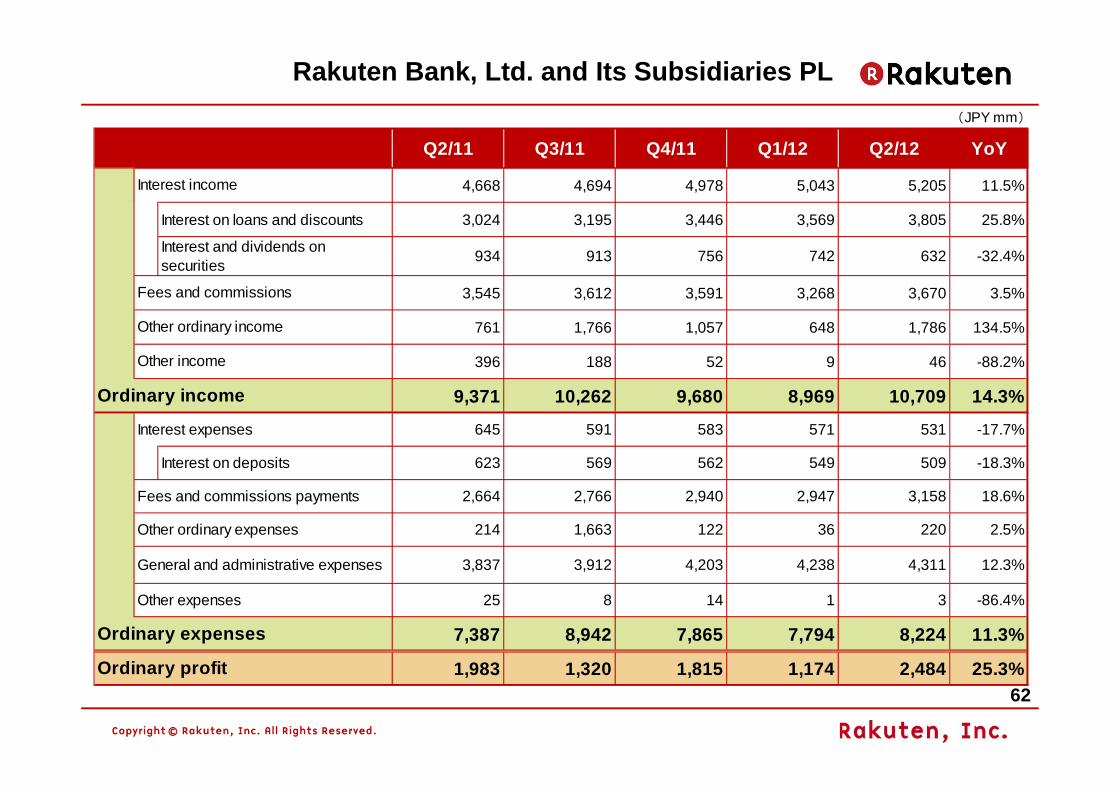
Rakuten Bank, Ltd. and Its Subsidiaries PL(JPY mm)
Q2/11 Q3/11 Q4/11 Q1/12 Q2/12 YoY
4,668 4,694 4,978 5,043 5,205 11.5%
Interest on loans and discounts 3,024 3,195 3,446 3,569 3,805 25.8%
Interest and dividends onsecurities 934 913 756 742 632 -32.4%
3,545 3,612 3,591 3,268 3,670 3.5%
761 1,766 1,057 648 1,786 134.5%
396 188 52 9 46 -88.2%
9,371 10,262 9,680 8,969 10,709 14.3%
645 591 583 571 531 -17.7%
Interest on deposits 623 569 562 549 509 -18.3%
2,664 2,766 2,940 2,947 3,158 18.6%
214 1,663 122 36 220 2.5%
3,837 3,912 4,203 4,238 4,311 12.3%
25 8 14 1 3 -86.4%
7,387 8,942 7,865 7,794 8,224 11.3%
1,983 1,320 1,815 1,174 2,484 25.3%
Other expenses
General and administrative expenses
Fees and commissions
Other ordinary income
Other income
Interest expenses
Fees and commissions payments
Other ordinary expenses
Ordinary expenses
Ordinary profit
Ordinary income
Interest income
63
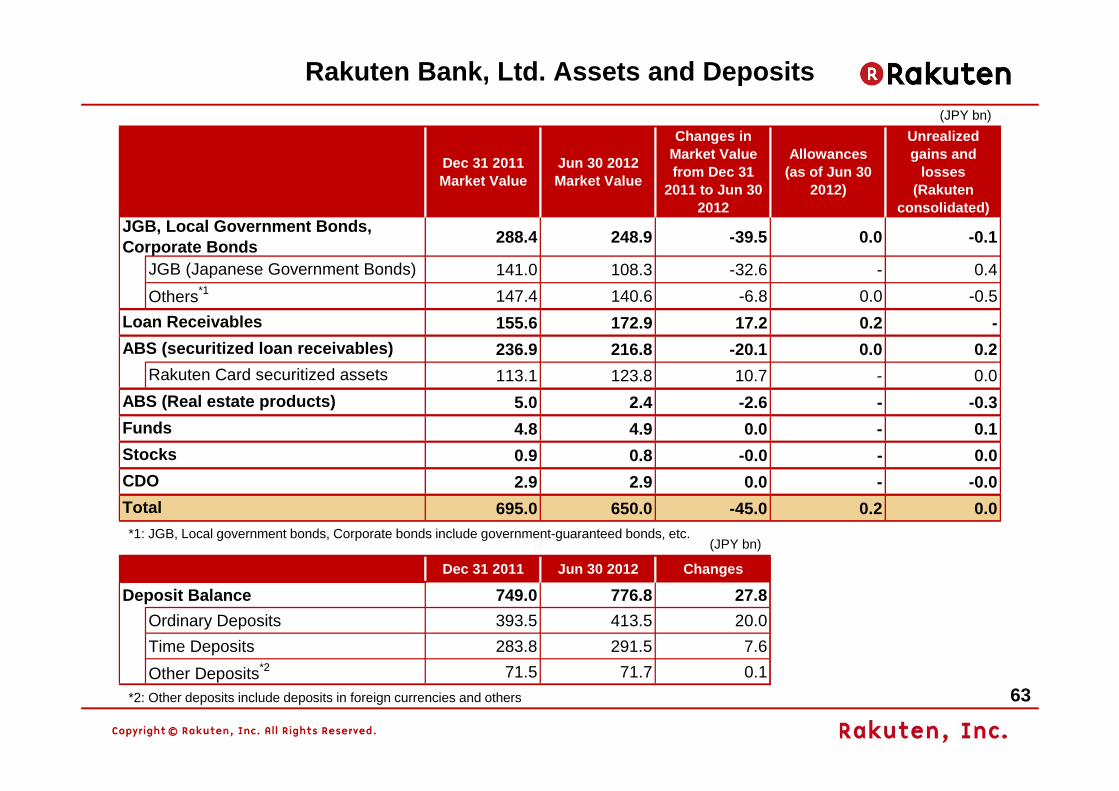
Rakuten Bank, Ltd. Assets and Deposits(JPY bn)
(JPY bn)*1: JGB, Local government bonds, Corporate bonds include government-guaranteed bonds, etc.
*2: Other deposits include deposits in foreign currencies and others
Dec 31 2011Market Value
Jun 30 2012Market Value
Changes inMarket Valuefrom Dec 31
2011 to Jun 302012
Allowances(as of Jun 30
2012)
Unrealizedgains and
losses(Rakuten
consolidated)
288.4 248.9 -39.5 0.0 -0.1
141.0 108.3 -32.6 - 0.4147.4 140.6 -6.8 0.0 -0.5155.6 172.9 17.2 0.2 -236.9 216.8 -20.1 0.0 0.2113.1 123.8 10.7 - 0.0
5.0 2.4 -2.6 - -0.34.8 4.9 0.0 - 0.10.9 0.8 -0.0 - 0.02.9 2.9 0.0 - -0.0
695.0 650.0 -45.0 0.2 0.0
JGB, Local Government Bonds,Corporate Bonds
JGB (Japanese Government Bonds)Others*1
Loan Receivables
Stocks
ABS (securitized loan receivables)
Funds
Rakuten Card securitized assetsABS (Real estate products)
CDOTotal
Dec 31 2011 Jun 30 2012 Changes
Deposit Balance 749.0 776.8 27.8Ordinary Deposits 393.5 413.5 20.0Time Deposits 283.8 291.5 7.6Other Deposits*2 71.5 71.7 0.1
64
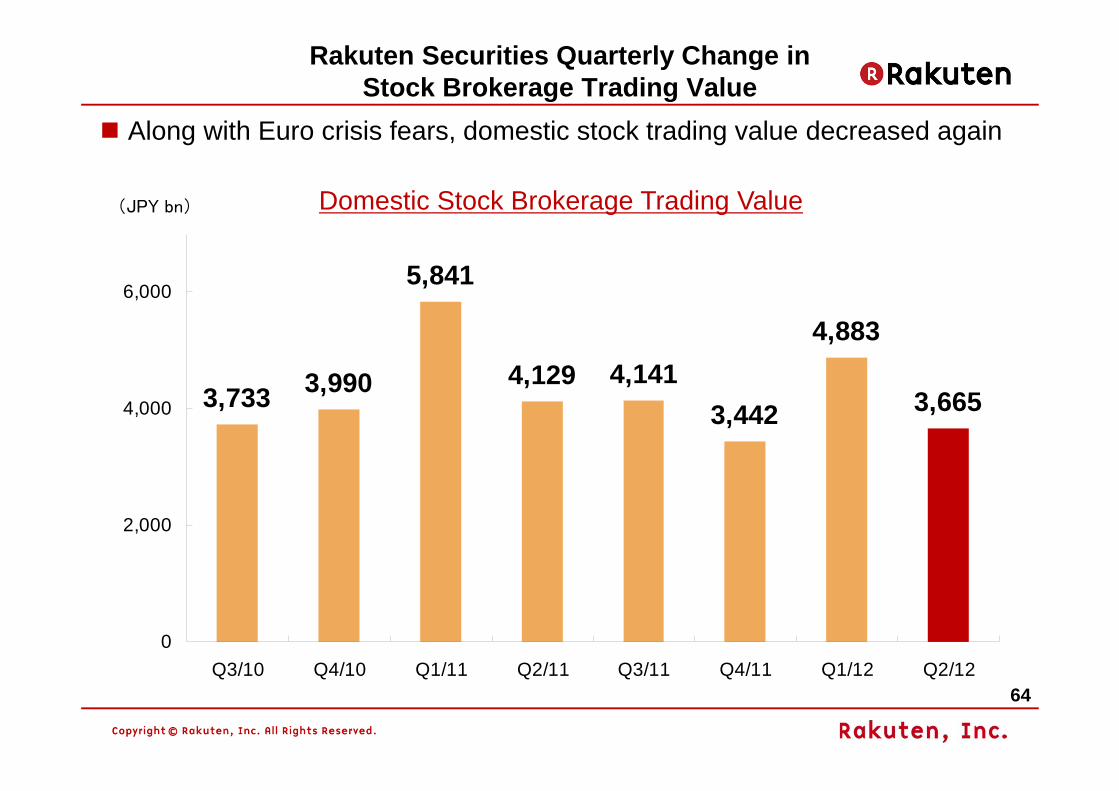
Rakuten Securities Quarterly Change inStock Brokerage Trading Value
(JPY bn)
Along with Euro crisis fears, domestic stock trading value decreased again
Domestic Stock Brokerage Trading Value
3,733 3,990
5,841
4,129 4,1413,442
4,883
3,665
0
2,000
4,000
6,000
Q3/10 Q4/10 Q1/11 Q2/11 Q3/11 Q4/11 Q1/12 Q2/12
65
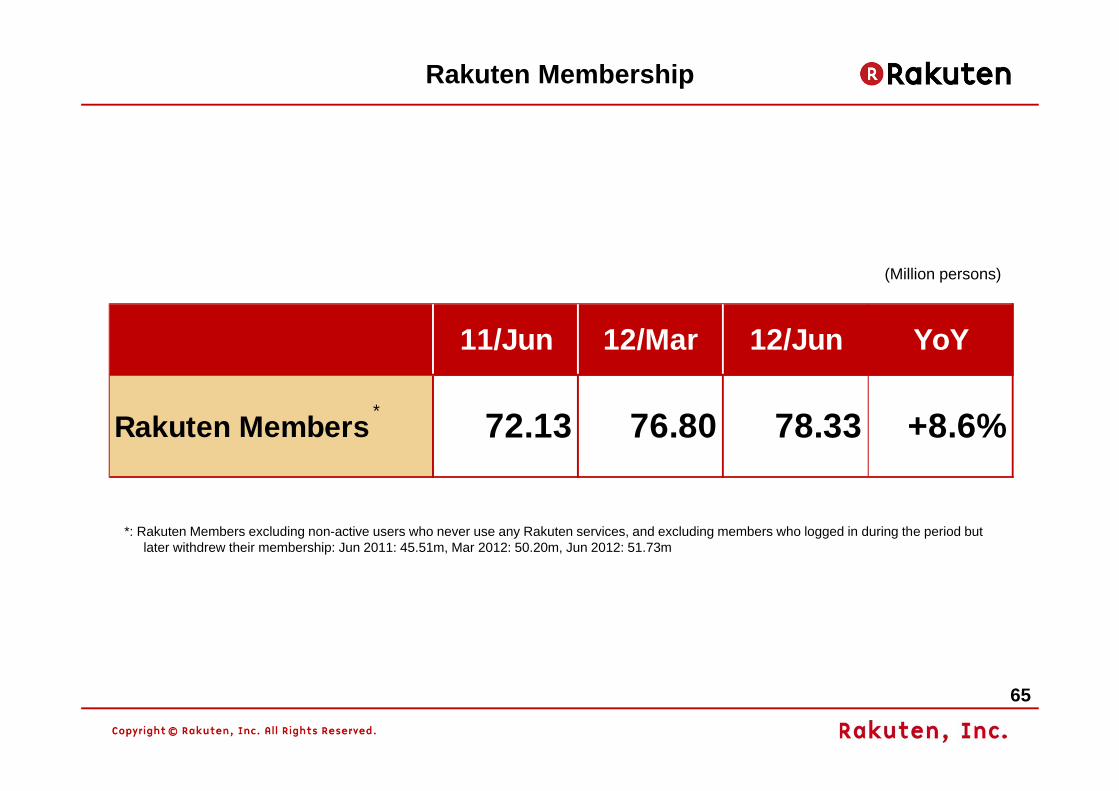
11/Jun 12/Mar 12/Jun YoY
Rakuten Members 72.13 76.80 78.33 +8.6%
*: Rakuten Members excluding non-active users who never use any Rakuten services, and excluding members who logged in during the period but later withdrew their membership: Jun 2011: 45.51m, Mar 2012: 50.20m, Jun 2012: 51.73m
Rakuten Membership
(Million persons)
*