fiscal deficit and its trends in india - ijbmiijbmi.org/papers/vol(5)11/h0511063075.pdfinternational...
TRANSCRIPT
International Journal of Business and Management Invention
ISSN (Online): 2319 – 8028, ISSN (Print): 2319 – 801X
www.ijbmi.org || Volume 5 Issue 11 || November. 2016 || PP—63-75
www.ijbmi.org 63 | Page
Fiscal Deficit and its Trends in India
Sonika Gupta1, Prof.Kalpana Singh
2
1Research Scholar, Banasthali University, Rajasthan, India
2Amity School of Economics, Amity University, Noida, UP, India
Abstract: Fiscal deficit measures the incremental amounts that governments are required to borrow in order to
finance their budget shortfalls. The concept has gained significance in recent times with the IMF imposing strict
restrictions and monitoring of the levels of fiscal deficit that economies can run if they have taken support or are
going to request support from the IMF. India too started to monitor Fiscal Deficit after it had to solicit support
from the IMF to resolve the balance of payment crisis of 1991.
This study traces the major changes in the India’s fiscal policy since 1980-81 through the country’s balance of
payments crisis of 1991, the post economic liberalisation and high growth period, the introduction of FRBM Act
in 2003, adjustment to the global financial crisis of 2008 and the recent post-crisis changes to return to a path
of fiscal consolidation
The study found that from 1980-81 to 2002-03 the periods of crisis led to the burgeoning of the deficit to
unsustainable levels and prompted the government to introduce and adopt economic reforms to ensure that the
deficit stood at more reasonable levels. However since 2003-04 the government has been more proactive and
has undertaken fiscal policy reforms to ensure a steady reduction in fiscal deficit as a percentage of GDP
leading to a more resilient economy.
Keywords: Fiscal Deficit, Revenue Deficit, Capital Expenditure.
I. Introduction
To designate the deficit budget of the Government the usage of the term fiscal deficit has become
very common. The term has been widely used to denote the financial strength of the economy and is actively
monitored by economists and analysts. The government also considers this as one of the most important statistic
and not only publishes this along with other budgetary numbers but also computes the expected fiscal deficit
when it presents its annual budget and moreover provides guidance on what the expected level of fiscal deficit
would be for the coming years.
To put simply, Fiscal deficit is an “economic phenomenon, where the Government's total expenditure
surpasses the revenue generated. It is the difference between the government's total receipts (excluding
borrowing) and total expenditure. Fiscal deficit presents a more comprehensive view of budgetary imbalances”
[1].
1.1 Introduction of Fiscal Deficit Concept in India
Until 1991-92, deciphering the fiscal deficit itself required some effort, if not research. The
Budget document of the Central Government also did not even report the fiscal deficit figure. What was
reported was the 'budgeted' or uncovered deficit, which was the "excess of total expenditure (both
revenue and capital) over total receipts (both revenue and capital). This gap is financed by the issue of
91-day Treasury Bills (including ad hoc Treasury Bills held by the RBI), and draw down of cash
balances", as stated in Explanatory Note to Budget at a Glance, 1996-97, p.16, as cited in [2].
The SukhamoyChakravarty Committee (1982-1985)presented a report on the “Review of the Working
of the Monetary System in India” and recommended that “the fiscal deficit rather than the uncovered deficit
more accurately represented the Government's draft on credit available in the economy.” Six years later,
fiscal deficit made its first appearance in the Economic Survey 1990-91, under the shadow of the impending
IMF structural adjustment programme in 1991, by the then Finance Minister, Dr.Manmohan Singh and later its
way into Central Government Budget documents ultimately in 1991-92. The Explanatory Note to the
Budget at a Glance in 1991-92 stated: "From this year the document shows, apart from revenue deficit
and overall budgetary deficit, the fiscal deficit also. Fiscal deficit is the difference between the rev enue
receipts (plus certain non-debt capital receipts) on the one hand and the total expenditure including loans,
net of repayments”[2].
1.2 Meaning & Definition of Fiscal Deficit
In layman terms, if the Government spends more than it earns we have a situation which is called fiscal
deficit. Fiscal deficit measures the indebtedness of the government and throws light on the extent to which the

Fiscal Deficit and its Trends in India
www.ijbmi.org 64 | Page
government exceeds its means. Thus it is the sum of budgetary deficit together with government‟s
market borrowings and liabilities undertaken.
To explain from a different perspective the government expenditure is financed partly from the receipts
and for the balance the government may be required to borrow or incur dis-savings. This portion of government
expenditure which is financed by borrowings and drawing down of cash balances is referred to as the fiscal
deficit.
The size of a country‟s fiscal deficit would depend upon the objectives that economy sets to achieve by
undertaking the deficit. Thus for a meaningful comparison country‟s fiscal deficit is usually communicated as a
percentage of its gross domestic product (GDP).
According to Dasgupta and De, 2011, as cited in[3], “The gross fiscal deficit (GFD) of government is
the excess of its total expenditure, current and capital, including loans net of recovery, over revenue receipts
(including external grants) and non-debt capital receipts.” The net fiscal deficit is the gross fiscal deficit reduced
by net lending by government.
1.3 Formula and Measurement of Fiscal Deficit
While we have seen the definition of Fiscal Deficit, let us now see its component wise break down. The same
can be better understood in terms of a mathematical equation, which is as follows;
Fiscal Deficit = Total Expenditure – Total Receipts other than Borrowings
By expanding the term Total Expenditure as Revenue Expenditure and Capital Expenditure and Total Receipts
as Revenue and Capital Receipts, we can rewrite the above formula as:
Fiscal Deficit = (Revenue Expenditure + Capital Expenditure) – (Revenue Receipts + Capital Receipts
other than borrowings)
Now by rearranging the terms:
Fiscal Deficit = (Revenue Expenditure - Revenue Receipts) + Capital Expenditure - (Recoveries of loans +
other Receipts)
1.4 Objectives of the Paper
To study and analyse the trends of central government‟s deficit in India in light of major economic events
between 1980-81 and 2015-16 covering the new economic policy of 1991, the FRBM Act of 2003 and financial
crisis of 2008.
1.5 Methodology
To study and analyse the trends of central government‟s deficit in India: fiscal deficit, primary deficit
and revenue deficit as percentage of GDP has been analysed by using time series data from 1980-81 to 2015-16.
For covering the trends across major economic events the study is divided in to three parts i.e. pre-liberalisation
(1980-81 to 1990-91), post liberalisation till FRBM Act (1990-91 to 2002-03) and post FRBM Act till date
(2003-04 to 2015-16).Further, to study the deficits the study also analyses the percentage share of components
of revenue receipt and revenue expenditure within the total revenue receipts and total revenue expenditure
II. Trends of Fiscal Deficit in India To understand the trends in a better way we have divided the trends into three parts: Era of Pre
Liberalisation (1980-81 to 1990-91), Post Liberalisation and till FRBM Act (1990-91 to 2002-03) and Post
FRBM Act, 2003 till 2015-16.
2.1Era of Pre-Liberalisation, 1980-81 to 1990-91
While India is considered a mixed economy, until 1990-91 the balance of the economic structure was
titled more towards socialism. The vision of the policy makers had that post-independence the country needed
significant expenditure into key long term industries and projects which the private sector may not undertake as
these initiatives had long gestation period. Also in order to be in control of economy the government policies
restricted the private sector in engaging into certain strategic sectors such as banking, civil aviation, mining etc.
As a result of a protectionist approach most of the capital expenditure was being funded by the
government sector and it‟s funding for these put a lot of burden on the government to continue incurring capital
expenditure and thereby running high level of fiscal deficit.

Fiscal Deficit and its Trends in India
www.ijbmi.org 65 | Page
Table 1& Figure 1 shows that from the period 1980-81 to 1990-91, the fiscal deficit of the Central
Government rose sharply from 5.55% of GDP in 1980-81 to 8.13% in 1986-87 and stood at 7.61% of GDP in
1990-91. This period witnessed rapid deterioration of the fiscal balances largely attributable to unchecked
growth of non-planned revenue expenditure particularly on interest payments and subsidies rose sharply during
1980s.
With respect to the revenue deficit, as the higher interest payments led revenue deficit as percentage of
GDP to increase from 1.36% in 1980-81 to 2.48% in 1987-88 to and to 3.17% in 1990-91.
Table 1 Deficits of the Central Government as Percentage of GDP(1980-81 to 1990-91) Years Gross Fiscal Deficit Revenue Deficit Gross Primary Deficit
1980-81 5.55 1.36 3.81
1981-82 4.93 0.22 3.11
1982-83 5.4 0.67 3.4
1983-84 5.69 1.11 3.6
1984-85 6.79 1.65 4.46
1985-86 7.55 2.03 4.96
1986-87 8.13 2.4 5.28
1987-88 7.34 2.48 4.29
1988-89 7.08 2.41 3.81
1989-90 7.1 2.37 3.56
1990-91 7.61 3.17 3.95
Source: Select Fiscal Indicators of the Central Government, (As percentage of GDP), Handbook of Statistics on
Indian Economy 2014-15, Reserve Bank of India [4].
Notes: 1. Data for 2014-15 are revised estimates and 2015-16 are budget estimates.
2. Negative (-) sign indicates surplus.
Figure 1
Source: Author‟s Compilation based on Table 1
During the period 1980-81 to 1990-91, the contribution of interest payments and subsidies as
percentage of the revenue expenditure rose from 18% and 14% in 1980-81 to 29% and 17% in 1990-91
respectively. For the same period, the contribution of defense and other revenue expenditure has declined from
23% and 45% in 1980-81 to 15% and 39% in 1990-91 respectively (Figure 2(a) & 2(b)).
Figure 2(a)
Source: Author‟s Calculation by using database from Table A-1 [5].

Fiscal Deficit and its Trends in India
www.ijbmi.org 66 | Page
Figure 2(b)
Source:Author‟s Calculation by using database from Table A-1 [5].
Fiscal deficit is also related to the revenue deficit through capital expenditure and capital receipts. With
government holding and taking the onus of building the capital intensive projects, the gap between the fiscal and
revenue deficit stood at 4.19 percentage points in 1980-81 and rose to 4.44 percentage points in 1990-91(Figure
1).
Since the major rise in the deficits during the decade beginning 1981 was on account of debt servicing,
the primary deficit did not go up significantly. As a percentage of the GDP primary deficit changed from 3.81%
in 1980-81 to 3.95% by 1990-91. In that period it spiked up to 5.28% in 1986-87 (Figure 1).
2.2 Post Liberalisation, 1990-91 till FRBM Act, 2002-03
By 1990-91 the Indian economy was quite weak, it was burdened with heavy debt rising interest costs
and deficits. India traditionally had a current account deficit with significant portion of the imports being that of
oil and petroleum products. The weak economic situation further worsened with the Gulf-war which led to rise
in oil prices coupled with drying up of credit lines and investors pulling out money. The country‟s foreign
exchange reserves had depleted significantly and the level of reserves was only sufficient to finance imports of
another three weeks[6]. India had to arrange for emergency funds from the IMF to avoid default on external
obligations. In response to the crisis the government headed by Prime Minister Narasimha Rao commenced on
the path of economic liberalisation whereby the economy was opened up to foreign investment and trade, the
private sector was encouraged and the system of quotas and licenses were dismantled. Fiscal policy was re-
oriented to cohere with these changes. In order to augment the receipts the government undertook to reform both
the direct and indirect taxes and for the first time the country embarked on the policy of disinvestment.
The measures proposed above to meet the crisis are often referred to as the New Economic Policy of
1991. These measures could broadly be classified under three heads viz. liberalisation, privatisation and
globalisation. Under liberalisation many industries were freed from the licensing requirement, the investment
limit in small scale industries was enhanced, free determination of interest rates by commercial banks and
abolition of restrictive trade practices. With privatisation, the government invited the private sector to own and
manage part of Public Sector Enterprises. And among the measures for globalisation included reducing tariffs,
partial convertibility of the currency and increasing limits of foreign investment in India.
In addition to the above, the government also brought in reform in the tax structure and reduce the non-
capital expenditure like subsidies. The reforms were calibrated to bring about revenue neutrality in the short
term and to enhance revenue productivity of the tax system in the medium and long term. The overall thrust was
to decrease the share of trade taxes in total tax revenue, increase the share of domestic consumption taxes by
transforming the domestic excises into a VAT, and increase the relative contribution of direct taxes. The share
of direct taxes as part of total revenue receipts rose from 15% in 1991-92 to 20% in 1996-97 and to 26% in
2000-01, correspondingly the share of indirect taxes fell from 61% in 1991-92 to 54% in 1996-97 and to 45% in
2000-01, the same is brought out in the following figures (Figure 3(a), 3(b) and 3(c)).

Fiscal Deficit and its Trends in India
www.ijbmi.org 67 | Page
Figure 3(a)
Source: Author‟s Calculation by using database from Table A-2[7].
Figure 3(b)
Source: Author‟s Calculation by using database from Table A-2[7].
Figure 3(c)
Source:Author‟s Calculation by using database from Table A-2[7].

Fiscal Deficit and its Trends in India
www.ijbmi.org 68 | Page
Correspondingly significant efforts were also made to reduce subsidies and cut down the non-capital
expenditure. However, given the large debt burden meant that the interest component would not reduce
significantly or at a rapid pace as desired. The proportion of interest to total revenue expenditure rose form 32%
in 1991-92 to 37% in 1996-97 and stood at 36% in 2000-01, over the same period share of subsidies fell from
15% in 1991-92 to 10% in 1996-97 and was maintained at 10% in 2000-01 (Figure 4(a), Figure 4(b) and 4(c)).
Figure 4(a)
Source: Author‟s Calculation by using database from Table A-1[5].
Figure 4(b)
Source: Author‟s Calculation by using database from Table A-1[5].
Figure 4(c)
Source:Author‟s Calculation by using database from Table A-1[5].

Fiscal Deficit and its Trends in India
www.ijbmi.org 69 | Page
The economic policy had fairly significant positive impacts on the revenue and primary deficits as well.
The new economic policy brought with itself a fresh approach, the government not only liberalised the licensing
it also began with the disinvestment of the public enterprises and it‟s holding. This had a twin effects; firstly, it
lead to lowering the capital expenditure and secondly, it increased the capital receipts. Thus post 1991 there was
steady decline in the primary deficit as percentage of GDP, it fell 3.95% in 1990-91 to 0.51% in 1996-97.
However the interest burden continued to mount and thus the difference between the fiscal and primary deficits
rose from 3.66 percentage points in 1990-91 to 4.19 percentage points in 1996-97 (Table 2 & Figure 5).
Table 2. Deficits of the Central Government as Percentage of GDP(1990-91 to 2002-03) Years Gross Fiscal Deficit Revenue Deficit Gross Primary Deficit
1990-91 7.61 3.17 3.95
1991-92 5.39 2.41 1.44
1992-93 5.19 2.4 1.17
1993-94 6.76 3.67 2.64
1994-95 5.52 2.97 1.3
1995-96 4.91 2.42 0.83
1996-97 4.7 2.3 0.51
1997-98 5.66 2.95 1.48
1998-99 6.29 3.71 1.97
1999-00 5.18 3.34 0.72
2000-01 5.46 3.91 0.9
2001-02 5.98 4.25 1.42
2002-03 5.72 4.25 1.08
Source:Select Fiscal Indicators of the Central Government, (As percentage of GDP), Handbook of Statistics on
Indian Economy 2014-15, Reserve Bank of India [4].
Notes: 1. Data for 2014-15 are revised estimates and 2015-16 are budget estimates.
2. Negative (-) sign indicates surplus.
Figure 5
Source: Author‟s Compilation based on Table 2
The revenue deficit also experienced a positive impact courtesy the revised tax structure and controlled
subsidy expenditure. As percentage of GDP the revenue deficit fell from 3.17% in 1990-91 to 2.3% in 1996-97.
Falling capital requirements and rising capital flows caused the gap between fiscal and revenue deficits to
narrow down, it reduced from 4.44 percentage points in 1990-91 to 2.4 percentage points in 1996-97.
As seen, from the high 7% in the latter end of 1980s the fiscal deficit measure reduced to 5.4% in 1991-
92 and the downward trend continued up to 1996-97 when the fiscal deficit stood at 4.7% of GDP. Since 1997-
98, fiscal deficit had again started increasing. It stood at 5.5% in 2000-01 (Table 2 & Figure 5).
The period from 1996-97 to 2002-03 was characterized by large rise in public debt involving large
interest payments year on year which led to the diversion of resources from investment to debt servicing.
Reviewing the Indian growth scenario World Bank Study, 2004 concludes “Interest payments
consumed less than 20% of total revenues in the pre-crisis period, compared with over 30% during the Ninth
Plan period (1997-2002). Revenue deficits doubled from less than 3% in the second half of the 1980s to 6%
during the Ninth Plan period and beyond representing deterioration in the fiscal stance with spending on social
and physical infrastructure crowded out by rising interest and other current payments.”
Fall out of the Asian crisis of 1996-97 which gridlocked cheaper money from external sources, the high
and rising fiscal deficits during the period from 1996-97 to 2002-03 which resulted inlarger government
borrowings from the market. The government incessantly tapped the markets for borrowings and this left very

Fiscal Deficit and its Trends in India
www.ijbmi.org 70 | Page
little funds available for the private sector investment. This is often referred to as the „crowing-out‟ effect and
was one of the major reasons for slowdown in economic growth.
Now the economy was literally strapped for fresh investment, on one hand the government vide its
economic policy had taken the stance of reducing the role of public sector and encourage private sector and on
the other hand the private sector was not able to access the resource pool as the government was utilising most
of resources for funding the revenue deficits. Moreover, given the high deficits the government could not afford
to undertake investments on its own. The focus at that time was to reduce the fiscal deficit and not increase it.
As the interest burden rose the primary deficit as percentage of GDP fell from 1.48% in 1997-98 to 1.08% in
2002-03. The revenue deficit over the same period rose from 2.95% in 1997-98 to 4.25% in 2002-03 (Table 2 &
Figure 5).
To summarize the fiscal deficit situation from 1980 to 2002; Indian economy faced with the problem of
large fiscal deficit and its monetization spilled over to external sector in the late 1980s and early 1990s. The
large borrowings of the government led to such a precarious situation that government was unable to pay even
for three weeks of imports resulting in economic crisis of 1991. Consequently, Economic reforms were
introduced in 1991 and fiscal consolidation emerged as one of the key areas of reforms. After a good starting the
early nineties, the fiscal consolidation faltered after 1997-98. The fiscal deficit started rising after 1997-98. The
Government introduced Fiscal Responsibility and Budget Management (FRBM) Act, 2003 to check the
deteriorating fiscal situations.
2.3 Post Fiscal Responsibility and Budget Management (FRBM) Act, 2003 till 2015-16
Fiscal Responsibility and Budget Management (FRBM) bill introduced in Parliament in December
2000 in order to restore fiscal discipline. The bill was referred to the Parliamentary Standing Committee on
Finance, which suggested some changes in the original draft. On the recommendation of the Standing
Committee, necessary amendments were made in the FRBM Bill April 2003 and after being passed by both the
Houses of Parliament, it received the assent of the President on August 26, 2003. The Fiscal Responsibility and
Budget Management (FRBM) Act, 2003, was brought into force on July 5, 2004.
FRBM Act gave a medium term target for balancing current revenues and expenditures and set overall
limits to the fiscal deficit at 3% of GDP to be achieved according to a phased deficit reduction roadmap. The
FRBM Act enhanced budgetary transparency by requiring the government to place before the Parliament on an
annual basis reports related to its economic assessments, taxation and expenditure strategy and three-year rolling
targets for the revenue and fiscal balance. It also required quarterly progress reviews to be placed in Parliament.
The Act aimed at reducing the gross fiscal deficit by 0.5% of GDP in each financial year beginning on
April 1, 2000. As a result of the efforts taken, fiscal deficit as a proportion of GDP started declining.
Table 3 Deficits of the Central Government as Percentage of GDP(2002-03 to 2015-16) Years Gross Fiscal Deficit Revenue Deficit Gross Primary Deficit
2002-03 5.72 4.25 1.08
2003-04 4.34 3.46 -0.03
2004-05 3.88 2.42 -0.04
2005-06 3.96 2.5 0.37
2006-07 3.32 1.87 -0.18
2007-08 2.54 1.05 -0.88
2008-09 5.99 4.5 2.57
2009-10 6.46 5.23 3.17
2010-11 4.79 3.24 1.79
2011-12 5.84 4.46 2.75
2012-13 4.91 3.65 1.77
2013-14 4.43 3.15 1.13
2014-15 4.09 2.89 0.81
2015-16 3.94 2.8 0.71
Source:Select Fiscal Indicators of the Central Government, (As percentage of GDP), Handbook of Statistics on
Indian Economy 2014-15, Reserve Bank of India [4].
Notes: 1. Data for 2014-15 are revised estimates and 2015-16 are budget estimates.
2. Negative (-) sign indicates surplus.

Fiscal Deficit and its Trends in India
www.ijbmi.org 71 | Page
Figure 6
Source: Author‟s Compilation based on Table 3
As Table 3 & Figure 6 depicted that during 2003-04, fiscal deficit was 4.34%, which declined to 3.32%
and 2.54% in 2006-07 and 2007-08 respectively. Consequently the revenue deficit also declined 3.46% in 2003-
04 to 1.05% in 2007-08. The primary deficit remained negative over the same period.
The sub-prime crisis that emanated from the United States (US) led to liquidity and solvency problems
all around the world. While India, like other developing countries, did not have direct exposure to the crisis, the
effects have been felt through credit, exports, and exchange rate channels. India‟s engagement with the global
economy has deepened since the 1990s, making it vulnerable to global financial and economic crisis.
Figure 7(a)
Source: Author‟s Calculation by using database from Table A-1[5].
Figure 7(b)
Source:Author‟s Calculation by using database from Table A-1[5].

Fiscal Deficit and its Trends in India
www.ijbmi.org 72 | Page
Figure 7(c)
Source:Author‟s Calculation by using database from Table A-1[5].
The fiscal consolidation objectives of bringing down the share of interest expense in the revenue
expenditure did achieve the desired results, with interest outlay as share of revenue expenditure reducing from
34% in 2003-04 to 29% in 2007-08 and further to 22% in 2010-11. The substantial decrease in 2010-11 is also
attributable to the rise in other revenue expenditure during the subprime crisis (Figure 7(a), Figure 7 (b)& Figure
7 (c)).
Between 2007 and 2009 the Central government had already scheduled to launch a few expansionary
schemes which would lead to increase in demand viz. rural farm loan waiver scheme, the expansion of social
security schemes under the National Rural Employment Guarantee Act (NREGA) and the implementation of
revised salaries and compensations for the central public servants as per the recommendations of the Sixth Pay
Commission and somewhat the General elections in 2008 also had a positive impact on boosting demand.
In addition to the above as the crisis unfolded, “the government activated a series of stimulus packages
central excise duty cut of 4 percent, ramping up additional plan expenditure of about Rs. 200 billion, further
state government borrowings for planned expenditure amounting to around Rs. 300 billion, interest subsidies for
export finance to support certain export oriented industries, a further 2% reduction of central excise duties and
service tax for export industries (that is a total 6% central excise reduction)”[3].
Figure 8(a)
Source:Author‟s Calculation by using database from Table A-2 [7].
Fiscal Deficit and its Trends in India
www.ijbmi.org 73 | Page
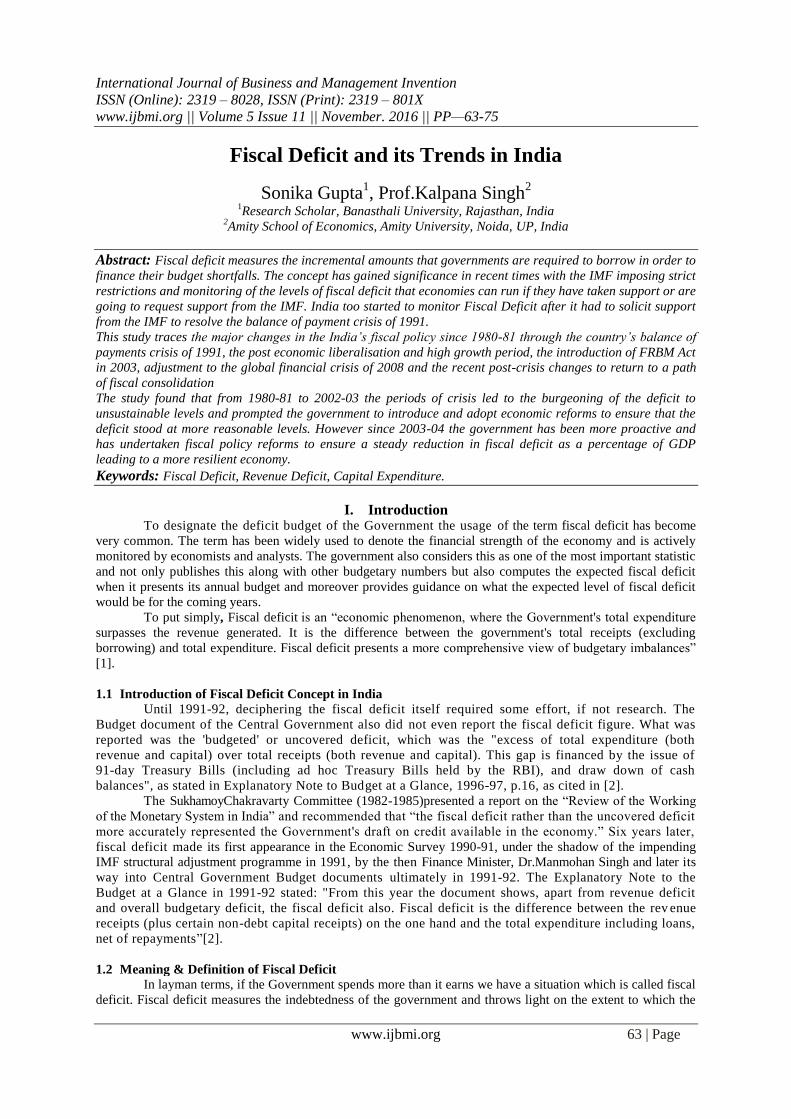
Figure 8(b)
Source:Author‟s Calculation by using database from Table A-2 [7].
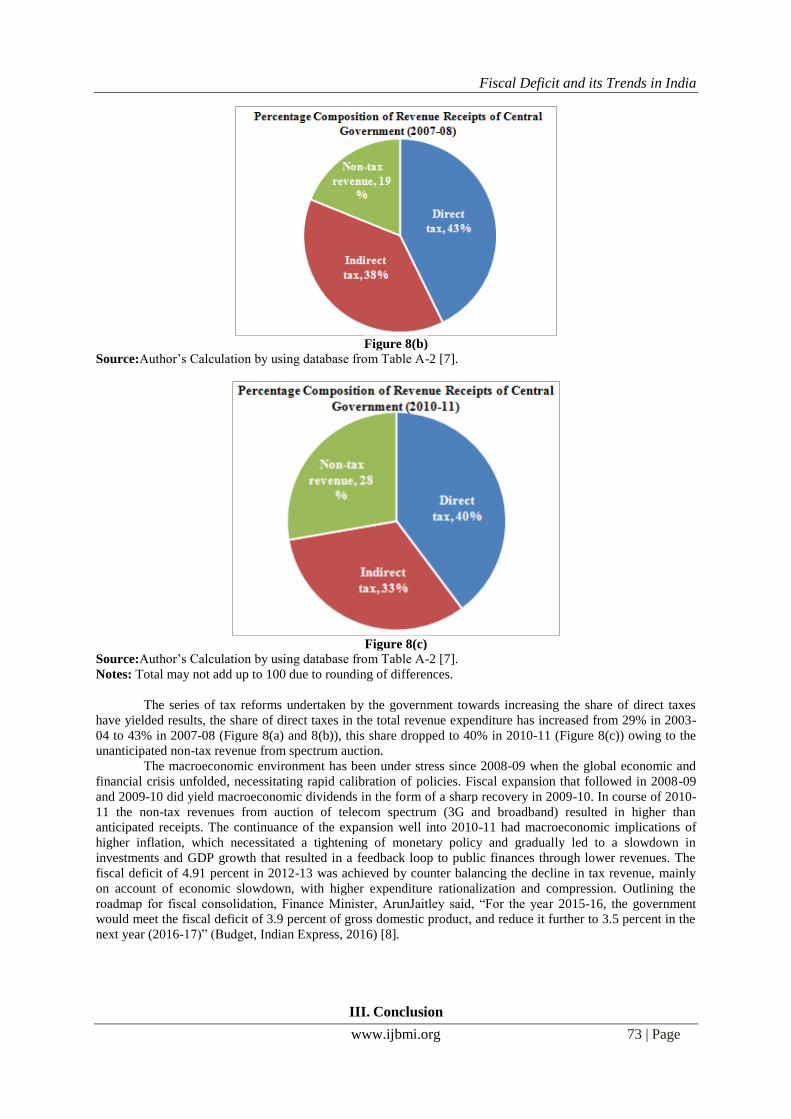
Figure 8(c)
Source:Author‟s Calculation by using database from Table A-2 [7].
Notes: Total may not add up to 100 due to rounding of differences.
The series of tax reforms undertaken by the government towards increasing the share of direct taxes
have yielded results, the share of direct taxes in the total revenue expenditure has increased from 29% in 2003-
04 to 43% in 2007-08 (Figure 8(a) and 8(b)), this share dropped to 40% in 2010-11 (Figure 8(c)) owing to the
unanticipated non-tax revenue from spectrum auction.
The macroeconomic environment has been under stress since 2008-09 when the global economic and
financial crisis unfolded, necessitating rapid calibration of policies. Fiscal expansion that followed in 2008-09
and 2009-10 did yield macroeconomic dividends in the form of a sharp recovery in 2009-10. In course of 2010-
11 the non-tax revenues from auction of telecom spectrum (3G and broadband) resulted in higher than
anticipated receipts. The continuance of the expansion well into 2010-11 had macroeconomic implications of
higher inflation, which necessitated a tightening of monetary policy and gradually led to a slowdown in
investments and GDP growth that resulted in a feedback loop to public finances through lower revenues. The
fiscal deficit of 4.91 percent in 2012-13 was achieved by counter balancing the decline in tax revenue, mainly
on account of economic slowdown, with higher expenditure rationalization and compression. Outlining the
roadmap for fiscal consolidation, Finance Minister, ArunJaitley said, “For the year 2015-16, the government
would meet the fiscal deficit of 3.9 percent of gross domestic product, and reduce it further to 3.5 percent in the
next year (2016-17)” (Budget, Indian Express, 2016) [8].
III. Conclusion

Fiscal Deficit and its Trends in India
www.ijbmi.org 74 | Page
In India the concept of fiscal deficit was first introduced in 1991 and was defined as the sum of revenue
deficit, capital expenditure less recovery of loans and other receipts. Since then fiscal deficit has been a closely
tracked parameter to measure the health of the Indian economy.
This study traced the major changes in the India‟s fiscal policy since 1980-81 through the country‟s
balance of payments crisis of 1991, the post economic liberalisation and high growth period, the introduction of
FRBM Act in 2003, adjustment to the global financial crisisof 2008 and the recent post-crisis changes to return
to a path of fiscal consolidation. The period to 1991 saw large fiscal deficit and its monetization spill over to the
external sector, pushed by the Gulf-war the balance of payments situation turned precarious and led to the
introduction of new economic policy. Post 1991 period had private sector share the burden of long term
development and contribute to capital receipts in the form of disinvestment. This coupled with tax reforms had
the fiscal deficit in control until 1996-97. Later, the Asian crisis of 1996-97 led it to move higher and fiscal
deficit reached unjustified levels by 2003. As a pragmatic solution to the problem FRBM Act of 2003 was
introduced which set out a phased reduction roadmap, this put the Indian economy on the right track however
was faced with a hiccup in the form of 2008 global credit crisis. India weathered the storm of the credit crisis
well and then resumed the task of lowering the fiscal deficit through tax reforms and fiscal consolidation. These
efforts bore fruits and have ensured fiscal deficit reach more comfortable levels.
Overall, during 1980-81 to 2002-03 it was seen that the periods of crisis led to the burgeoning of the
deficit to unsustainable levels and prompted the government to introduce and adopt economic reforms to ensure
that the deficit stood at more reasonable levels. However since 2003-04 the government has been more proactive
and has undertaken fiscal policy reforms to ensure asteadyreduction in fiscal deficit as a percentage of GDP
leading to a more resilient economy.
References [1] Fiscal Deficit. (2010, June). Economy Watch. Retrieved from http://www.economywatch.com/budget/india/fiscal-deficit.html
[2] Narayan, S. (2006). Documenting Reforms: Case Studies from India. New Delhi: Macmillan India Ltd. Retrieved from https://books.google.co.in
[3] De, S. (2012). Fiscal policy in India: Trends and Trajectory. Ministry of Finance, working paper no. 4751. Retrieved from
http://finmin.nic.in/workingpaper/FPI_trends_Trajectory.pdf [4] RBI (2015).Select Fiscal Indicators of the Central Government, (As percentage of GDP), Handbook of Statistics on Indian
Economy 2014-15, Reserve Bank of India. Retrieved fromhttps://www.rbi.org.in/
[5] RBI (2015). Major Heads of Expenditure of the Central Government, Handbook of Statistics on Indian Economy, 2014-15, Reserve Bank of India. Retrieved fromhttps://www.rbi.org.in/
[6] Karunagaran, A. (2011, September). Recent Global Crisis and the Demand for Gold by Central Banks: An Analytical Perspective.
Department of Economic and Policy Research (Working Paper No. 14). Retrieved from https://www.rbi.org.in/Scripts/PublicationsView.aspx?id=13843
[7] RBI (2015) Central Government Receipts -Major Components, Handbook of Statistics on Indian Economy, 2014-15, Reserve Bank
of India. Retrieved fromhttps://www.rbi.org.in/ [8] Budget 2016: Fiscal Deficit – Range Instead of Number. (2016). Indian Express. Retrieved from
http://indianexpress.com/article/india/india-news-india/budget-2016-fiscal-deficit-range-instead-of-number/
APPENDIX
Table A-1. Revenue Expenditure of Central Government (1980-81 to 2015-16)
(Rs. Billion) Year Revenue Defense
expenditure
Interest payments Subsidies Other Revenue
Receipts
Revenue
expenditure
1980-81 32.78 26.04 20.28 65.00 144.10
1981-82 38.44 31.95 19.41 64.28 154.08
1982-83 44.94 39.38 22.62 80.48 187.42
1983-84 51.89 47.95 29.02 93.65 222.51
1984-85 63.24 59.74 40.38 113.55 276.91
1985-86 70.21 75.12 47.96 145.95 339.24
1986-87 91.79 92.46 54.51 169.84 408.60
1987-88 88.61 112.51 59.80 200.82 461.74
1988-89 95.58 142.78 77.32 225.38 541.06
1989-90 101.94 177.57 104.74 257.85 642.10
1990-91 108.74 214.98 121.58 289.86 735.16
1991-92 114.42 265.96 122.53 320.01 822.92
1992-93 121.09 310.75 108.24 386.94 927.02
1993-94 149.78 367.41 116.05 448.45 1081.69
1994-95 164.26 440.60 118.54 497.72 1221.12
1995-96 188.41 500.45 126.66 583.09 1398.61
1996-97 209.97 594.78 154.99 629.59 1589.33
1997-98 261.74 656.37 185.40 699.84 1803.35
1998-99 298.61 778.82 235.93 851.25 2164.61
1999-00 352.16 902.49 244.87 991.26 2490.78
2000-01 372.38 993.14 268.38 1144.49 2778.39

Fiscal Deficit and its Trends in India
www.ijbmi.org 75 | Page
2001-02 380.59 1074.60 312.10 1247.39 3014.68
2002-03 407.09 1178.04 435.33 1366.67 3387.13
2003-04 432.03 1240.88 443.23 1504.60 3620.74
2004-05 438.62 1269.34 459.57 1675.76 3843.29
2005-06 482.11 1326.30 475.22 2110.13 4393.76
2006-07 516.82 1502.72 571.25 2555.30 5146.09
2007-08 542.19 1710.30 709.26 2982.58 5944.33
2008-09 733.05 1922.04 1297.08 3985.81 7937.98
2009-10 906.69 2130.93 1413.51 4666.96 9118.09
2010-11 920.61 2340.22 1734.20 5412.20 10407.23
2011-12 1030.11 2731.50 2179.41 5516.83 11457.85
2012-13 1112.77 3131.70 2570.79 5619.88 12435.14
2013-14 1243.74 3742.54 2546.32 6185.12 13717.72
2014-15 1404.05 4113.54 2666.92 6703.29 14887.80
2015-16 1521.39 4561.45 2438.11 6839.52 15360.47
Source: Major Heads of Expenditure of the Central Government, Handbook of Statistics on Indian Economy,
2014-15, Reserve Bank of India
Notes: Data for 2014-15 are Revised Estimates and data for 2015-16are Budget Estimates.
Table A-2. Revenue Receipts of Central Government
(Rs. Billion) Year Direct tax Indirect tax Non-tax revenue Revenue receipts
1980-81 18.93 74.65 30.15 123.73
1981-82 25.18 90.24 34.82 150.24
1982-83 27.23 102.94 44.17 174.34
1983-84 31.31 123.10 42.70 197.11
1984-85 33.75 142.76 58.15 234.66
1985-86 36.98 174.42 68.95 280.35
1986-87 40.23 202.96 87.64 330.83
1987-88 41.00 239.15 90.22 370.37
1988-89 60.21 277.30 98.40 435.91
1989-90 60.28 323.21 139.47 522.96
1990-91 69.03 360.75 119.76 549.54
1991-92 101.03 399.66 159.61 660.30
1992-93 120.75 419.69 200.84 741.28
1993-94 125.22 409.27 220.04 754.53
1994-95 184.09 490.45 236.29 910.83
1995-96 222.87 596.52 281.91 1101.30
1996-97 253.74 683.26 325.78 1262.79
1997-98 271.72 685.00 382.14 1338.86
1998-99 321.20 725.32 448.33 1494.85
1999-00 414.36 868.36 532.11 1814.82
2000-01 496.51 870.07 559.47 1926.05
2001-02 477.03 858.28 677.74 2013.06
2002-03 616.12 969.32 722.90 2308.34
2003-04 765.90 1103.92 768.31 2638.13
2004-05 959.44 1288.54 811.93 3059.91
2005-06 1206.92 1495.72 768.13 3470.77
2006-07 1697.38 1814.44 832.05 4343.87
2007-08 2315.74 2079.72 1023.17 5418.64
2008-09 2481.52 1951.69 969.40 5402.59
2009-10 2716.23 1849.13 1162.75 5728.11
2010-11 3135.01 2563.67 2186.02 7884.71
2011-12 3433.10 2864.54 1216.72 7514.37
2012-13 3965.85 3452.92 1373.54 8792.32
2013-14 4558.29 3600.25 1988.70 10147.24
2014-15 4992.53 4092.10 2178.32 11262.94
2015-16 4951.96 4246.46 2217.33 11415.75
Source: Central Government Receipts - Major Components, Handbook of Statistics on Indian Economy, 2014-
15, Reserve Bank of India
Notes: Data for 2014-15 are Revised Estimates and Data for 2015-16 are Budget Estimates.