firmsizeandthegainsfromacquisitions - g. william...
TRANSCRIPT

Journal of Financial Economics 73 (2004) 201–228
Firm size and the gains from acquisitions$
Sara B. Moellera, Frederik P. Schlingemannb, Ren!e M. Stulzc,*aCox School of Business, Southern Methodist University, Dallas, TX 75275, USA
bKatz Graduate School of Business, University of Pittsburgh, Pittsburgh, PA 15260, USAcDepartment of Finance, Fisher College of Business, The Ohio State University, 806 Fisher Hall,
2100 Neil Avenue, Columbus, OH 43210, USA
Received 12 February 2003; accepted 22 July 2003
Abstract
We examine a sample of 12,023 acquisitions by public firms from 1980 to 2001. The equally
weighted abnormal announcement return is 1.1%, but acquiring-firm shareholders lose $25.2
million on average upon announcement. This disparity suggests the existence of a size effect in
acquisition announcement returns. The announcement return for acquiring-firm shareholders
is roughly two percentage points higher for small acquirers irrespective of the form of
financing and whether the acquired firm is public or private. The size effect is robust to firm
and deal characteristics, and it is not reversed over time.
r 2004 Elsevier B.V. All rights reserved.
JEL classification: G31; G32; G34
Keywords: Acquisitions; Bidder; Size effect; Organizational form
1. Introduction
In this paper, we examine the gains to shareholders of firms that announceacquisitions of public firms, private firms, or subsidiaries of other firms. We considerthese different types of acquisitions together since corporations making such
ARTICLE IN PRESS
$We thank Evrim Akdogu, Harry DeAngelo, Hemang Desai, Eugene Fama, David Hirshleifer, Cliff
Holderness, Bengt Holmstrom, Jin-Lung (Jim) Hsieh, Paul Malatesta, Jeffry Netter, Bill Schwert, Mike
Stegemoller, Vish Viswanathan, Ralph Walkling, seminar participants at Boston College and the Federal
Reserve Bank of New York, and an anonymous referee for useful comments.
*Corresponding author. Tel.: +1-614-292-1970; fax: +1-614-292-2359.
E-mail address: [email protected] (R.M. Stulz).
0304-405X/$ - see front matter r 2004 Elsevier B.V. All rights reserved.
doi:10.1016/j.jfineco.2003.07.002

acquisitions could be acquiring similar assets.1 Typically, acquisitions are sizableinvestments for the firms that undertake them. We form a sample of all suchpurchases over $1 million by public firms from 1980 to 2001 recorded by theSecurities Data Corporation. After imposing some additional sampling criteria, weobtain a sample of 12,023 acquisitions. Such a comprehensive sample has not beenstudied before. The equally-weighted average announcement return for acquiring-firm shareholders in our sample is 1.1%, representing a gain of $5.61 per $100 spenton acquisitions. If the capital markets’ assessment is unbiased, this gain representsthe economic benefit of the acquisition for the shareholders of the acquiring firmtogether with the stock-price impact of other information released or inferred byinvestors when firms make acquisition announcements.The equally-weighted average announcement return implies that the wealth of
acquiring-firm shareholders increases when acquisitions are announced. Strikingly,however, the average dollar change in the wealth of acquiring-firm shareholderswhen acquisition announcements are made is negative. From 1980 to 2001, thesample firms spent roughly $3.4 trillion on acquisitions and the wealth of theshareholders of these firms fell by $303 billion dollars (in 2001 dollars), for a dollarabnormal return, defined in Malatesta (1983) as the abnormal return times the firm’sequity capitalization cumulated over the event window, of �$25.2 million peracquisition. The dollar abnormal return can differ in sign from the percentageabnormal return if the percentage abnormal return differs in sign for large and smallfirms. This is the case here. We define small firms in a given year to be firms whosecapitalization falls below the 25th percentile of NYSE firms that year. Acquisitionsby small firms are profitable for their shareholders, but these firms make smallacquisitions with small dollar gains. Large firms make large acquisitions that resultin large dollar losses. Acquisitions thus result in losses for shareholders in theaggregate because the losses incurred by large firms are much larger than the gainsrealized by small firms. Roughly, shareholders from small firms earn $9 billion fromthe acquisitions made during the period 1980-2001, whereas the shareholders fromlarge firms lose $312 billion. Though it is common to focus on equally-weightedreturns in event studies, it follows from these numbers that value-weighted returnslead to a different assessment of the profitability of acquisitions. The value-weightedreturn is �1.18%.After documenting that small firms are good acquirers and large firms are not, we
examine possible explanations for this size effect, defined as the difference betweenthe abnormal returns of small acquirers and large acquirers. First, roughly onequarter of the firms acquiring public firms are small whereas half of the firmsacquiring private firms are small. If acquiring private firms is more profitable thanacquiring public firms, this could explain the size effect. Fuller et al. (2002) show for
ARTICLE IN PRESS
1Kaplan and Weisbach (1992) have a sample of 282 large acquisitions. They find that almost 44% of the
acquisitions are subsequently divested. 216 of their acquisitions are acquisitions of public companies. The
acquired assets are then spun off in some cases and acquired by other companies in most cases. Hence, in
their sample, the same assets most likely are first organized as a public firm and then as a division. In this
paper, we use the term subsidiary acquisition to denote the acquisition of a subsidiary, division, or branch.
S.B. Moeller et al. / Journal of Financial Economics 73 (2004) 201–228202

a sample of firms that make five or more acquisitions in the 1990s that abnormalreturns are higher for firms acquiring private firms or subsidiaries than for firmsacquiring public firms. Second, small firms are more likely to pay for acquisitionswith cash than with equity. Travlos (1987) and others show that acquisitions ofpublic firms paid for with equity are accompanied by lower announcement returns.However, Chang (1998) and Fuller et al. (2002) show that acquisitions of privatefirms paid for with equity do not have lower announcement returns than privateacquisitions paid for with cash. Third, small and large acquirers have differentcharacteristics. The literature has shown that a number of acquiring-firm and dealcharacteristics are related to announcement returns for public-firm acquisitions. Forinstance, Lang et al. (1991) and Servaes (1991) show that high q bidders have higherannouncement abnormal returns for tender offer acquisitions and public-firmacquisitions, respectively, and Maloney et al. (1993) find that bidders with higherleverage have higher abnormal returns. We find that controlling for a wide variety ofacquiring-firm and deal characteristics does not alter the size effect. In all of ourregressions, the estimate of the size effect is positive and significantly different fromzero at the 1% probability level.A number of explanations have been offered for why the stock price of firms
announcing an acquisition can be negative. Roll (1986) hypothesizes that managersof bidding firms may suffer from hubris, so they overpay. Travlos (1987) points outthat firms with poor returns generally pay with equity, and Myers and Majluf (1984)show that firms that issue equity signal that the market overvalues their assets inplace (the equity signaling hypothesis). A related hypothesis, formalized byMcCardle and Viswanathan (1994) and Jovanovic and Braguinsky (2002), is thatfirms make acquisitions when they have exhausted their internal growthopportunities (the growth opportunities signaling hypothesis). Jensen (1986) arguesthat empire-building managements would rather make acquisitions than increasepayouts to shareholders (the free cash flow hypothesis). Recently, Dong et al. (2002)show that firms with higher valuations have worse announcement returns. This couldbe because highly valued acquirers communicate to the market that these highvaluations are not warranted by fundamentals, perhaps because they are under-taking efforts to acquire less overvalued assets with more overvalued equity (theovervaluation hypothesis).2 Finally, Mitchell et al. (2004) show that there is a pricepressure effect on the stock price of the bidder for acquisitions paid for with equitybecause of the activities of arbitrageurs (the arbitrageur hypothesis).For these hypotheses to explain the size effect for some or all types of acquisitions,
they have to be more pertinent for large firms than for small firms. This is notimplausible. Generally, the incentives of managers in small firms are better alignedwith those of shareholders than is the case in large firms. In particular, Demsetz andLehn (1985) find that managers in small firms typically have more firm ownershipthan managers in large firms. Managers of large firms might be more prone tohubris, perhaps because they are more important socially, have succeeded in growing
ARTICLE IN PRESS
2Shleifer and Vishny (2003) provide a model in which overvalued firms find it advantageous to acquire
less overvalued firms to lock in real assets, but they make no predictions about abnormal returns.
S.B. Moeller et al. / Journal of Financial Economics 73 (2004) 201–228 203

the firm, or simply face fewer obstacles in making acquisitions because their firm hasmore resources. A firm may be large because its equity is highly valued, so a largefirm is more likely to be overvalued. A firm that is further along in its lifecycle mightbe more likely to be large and to have exhausted its growth opportunities. Agencycosts of free cash flow occur when a firm no longer has growth opportunities, whichcould be more likely for large firms than for small firms. Finally, arbitrageurs areunlikely to use their resources for a merger when the acquirer is a small firm becauseit will be too difficult and costly to establish large short positions.We investigate whether these hypotheses are helpful in understanding the size
effect. We provide evidence that managers of large firms pay more for acquisitions.The premium paid increases with firm size after controlling for firm and dealcharacteristics. Large firms are also more likely to complete an offer. This isconsistent with hubris being more of a problem for large firms. We find that thecombined dollar return of the acquired and acquiring firms for acquisitions of publicfirms is positive and significant for small firms but significantly negative for largefirms. In other words, there are no dollar synergy gains for acquisitions by largefirms given how synergy gains are typically computed (following the methodproposed by Bradley et al. 1988), but there are dollar synergy gains for acquisitionsby small firms. Percentage synergy returns are positive for acquisitions by large firmsas well as by small firms, but they are significantly higher for acquisitions by smallfirms. Of course, the synergy gain estimate for acquisitions by large firms could bemade negative by the adverse information revealed about the acquirer through theacquisition announcement rather than by the adverse impact on shareholder wealthof the acquisition itself, although it is not clear why large acquirers reveal relativelymore adverse information than do small acquirers.We also provide evidence that is inconsistent with the overvaluation hypothesis. In
contrast to the market value of a firm’s equity, the book value of a firm’s assets isunlikely to be correlated with the overvaluation of the firm’s stock price.Consequently, if the size effect is due to the fact that large firms tend to beovervalued, it should disappear when we use the book value of the firm’s assets as asize measure. Nonetheless, we find that the size effect holds when we use the bookvalue of a firm’s assets instead of the firm’s market value of equity. Though theoutcome of the acquisitions by large firms is consistent with the existence of agencycosts of managerial discretion, there is little support for the free cash flow hypothesis.Finally, we investigate the hypothesis that the market makes systematic mistakes inevaluating acquisitions that it rectifies over time. In this case, acquisitions by smallfirms would be followed by negative abnormal returns and acquisitions by largefirms would be followed by positive abnormal returns. This explanation cannotaccount for the size effect. The market seems fairly efficient in incorporating theinformation conveyed by acquisition announcements in the stock price.The paper is organized as follows. In Section 2 we describe our sample and
document that abnormal returns for acquisition announcements are significantlypositive and negatively correlated with firm size. In Section 3, we demonstrate thatthe size effect is robust to firm and deal characteristics. In Section 4, we investigatepossible explanations for the size effect. We conclude in Section 5.
ARTICLE IN PRESSS.B. Moeller et al. / Journal of Financial Economics 73 (2004) 201–228204
2. Announcement returns for successful acquisitions
To estimate the shareholder gains from acquisitions, we consider acquisitionannouncements that are successful and result in a completed transaction. In Sections3 and 4, we include unsuccessful acquisition announcements to investigate whetherthis focus introduces a bias in our analysis and find that it does not. We first describeour sample and then estimate the gains to shareholders.
2.1. The sample
The sample of acquisitions comes from the Securities Data Company’s (SDC)U.S. Mergers and Acquisitions Database. We select domestic mergers andacquisitions with announcement dates between 1980 and 2001. We consider onlyacquisitions in which acquiring firms end up with all the shares of the acquired firmor subsidiary, and we require the acquiring firm to control less than 50% of theshares of the target firm before the announcement. We further require that (1) thetransaction is completed, (2) the deal value is greater than $1 million, (3) a public orprivate U.S. firm or a non-public subsidiary of a public or private firm are acquired,and (4) the acquirer is a public firm listed on the Center for Research in SecurityPrices (CRSP) and Compustat during the event window. Deal value is defined bySDC as the total value of consideration paid by the acquirer, excluding fees andexpenses. After collecting these acquisitions, we eliminate those in which the dealvalue relative to the market value of the acquirer is less than 1%. The market valueof the acquirer is defined as the sum of the market value of equity, long-term debt,debt in current liabilities, and the liquidating value of preferred stock. We alsorequire that the number of days between the announcement and completion dates isbetween zero and one thousand.Our requirements yield a sample of 12,023 successful offers. Slightly more than
half of the acquisitions are by large firms, which we define as those with a marketcapitalization above the 25th percentile of NYSE firms in the year in which theacquisition is announced. Table 1 shows the number of acquisitions by year. Thenumber of acquisitions does not increase monotonically through time: it falls in 1990and in recent years. The number of acquisitions in the 1990s is dramatically largerthan in the 1980s. In our tests, we will often use time dummies to take into accountthese changes. Interestingly, though there are normally fewer acquisitions by smallfirms than by large firms, this is not the case for most of the 1990s.
2.2. The gains to acquiring-firm shareholders
The most traditional way to evaluate bidder returns is to estimate abnormalpercentage returns with standard event study methods (following Brown andWarner, 1985). We estimate these abnormal returns over the three-day event window(�1, +1) using market model benchmark returns with the CRSP equally-weightedindex returns. The parameters for the market model are estimated over the (�205,�6) interval, and the p-values are estimated using the time-series and cross-sectional
ARTICLE IN PRESSS.B. Moeller et al. / Journal of Financial Economics 73 (2004) 201–228 205

variation of abnormal returns. We also calculate abnormal returns by subtractingthe value-weighted CRSP market return from the firm’s return. Our results are notsensitive to using either definition of abnormal returns.The equally-weighted abnormal return for our sample of successful offers is given
in the first row of Table 2. It is 1.10% and highly significant. The median abnormalreturn is 0.36% and is also significant. On average, therefore, shareholders ofacquiring companies benefit from acquisitions. This result is quite different from theresult obtained in samples restricted to acquisitions of public companies, sinceauthors studying such samples typically find that shareholders do not gain fromacquisitions; Andrade et al. (2001) report insignificant negative abnormal returnsfrom 1973 through 1998.The equally-weighted abnormal return gives the same weight to a company with a
capitalization of $100 million dollars and a company with a capitalization of $100billion dollars. Yet a given abnormal return has much more of an economic impact if
ARTICLE IN PRESS
Table 1
Sample distribution by announcement year and acquirer size
The sample contains all completed U.S. mergers and acquisitions between 1980 and 2001 listed on SDC
where the publicly traded acquiring firm gains control of a public, private, or subsidiary target whose
transaction value is at least $1 million and 1% of the acquirer’s market value. Small (large) acquirers have
a market capitalization equal to or less (greater) than the market capitalization of the 25th percentile of
NYSE firms in the same year.
Announcement Acquirer size
year Large Small All
1980 16 6 22
1981 83 30 113
1982 93 56 149
1983 111 103 214
1984 170 111 281
1985 125 32 157
1986 187 58 245
1987 173 43 216
1988 151 74 225
1989 166 138 304
1990 164 92 256
1991 156 148 304
1992 220 255 475
1993 277 356 633
1994 411 393 804
1995 394 502 896
1996 523 553 1,076
1997 689 828 1,517
1998 827 681 1,508
1999 649 466 1,115
2000 582 303 885
2001 353 275 628
All 6,520 5,503 12,023
S.B. Moeller et al. / Journal of Financial Economics 73 (2004) 201–228206
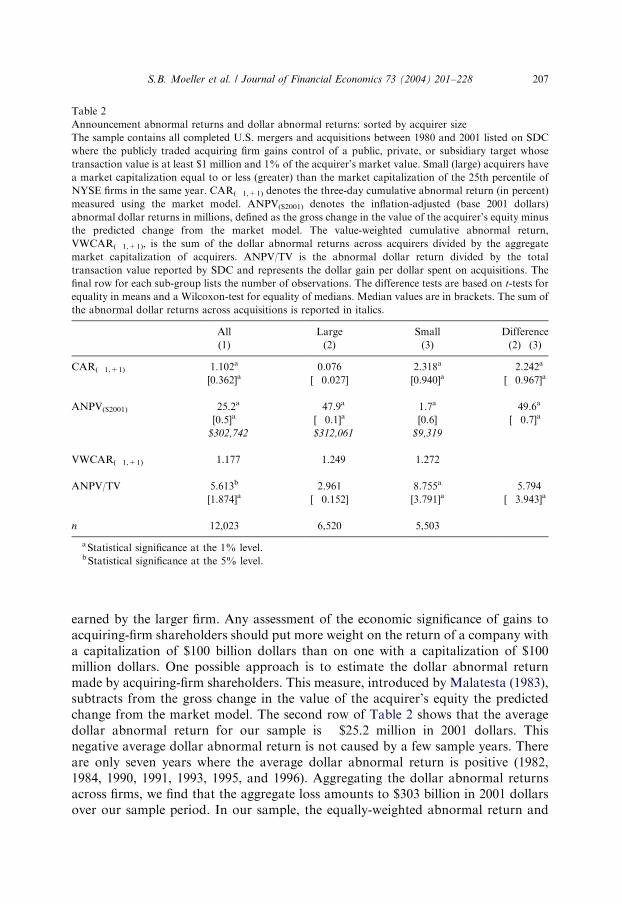
earned by the larger firm. Any assessment of the economic significance of gains toacquiring-firm shareholders should put more weight on the return of a company witha capitalization of $100 billion dollars than on one with a capitalization of $100million dollars. One possible approach is to estimate the dollar abnormal returnmade by acquiring-firm shareholders. This measure, introduced by Malatesta (1983),subtracts from the gross change in the value of the acquirer’s equity the predictedchange from the market model. The second row of Table 2 shows that the averagedollar abnormal return for our sample is �$25.2 million in 2001 dollars. Thisnegative average dollar abnormal return is not caused by a few sample years. Thereare only seven years where the average dollar abnormal return is positive (1982,1984, 1990, 1991, 1993, 1995, and 1996). Aggregating the dollar abnormal returnsacross firms, we find that the aggregate loss amounts to $303 billion in 2001 dollarsover our sample period. In our sample, the equally-weighted abnormal return and
ARTICLE IN PRESS
Table 2
Announcement abnormal returns and dollar abnormal returns: sorted by acquirer size
The sample contains all completed U.S. mergers and acquisitions between 1980 and 2001 listed on SDC
where the publicly traded acquiring firm gains control of a public, private, or subsidiary target whose
transaction value is at least $1 million and 1% of the acquirer’s market value. Small (large) acquirers have
a market capitalization equal to or less (greater) than the market capitalization of the 25th percentile of
NYSE firms in the same year. CAR(�1,+1) denotes the three-day cumulative abnormal return (in percent)
measured using the market model. ANPV($2001) denotes the inflation-adjusted (base 2001 dollars)
abnormal dollar returns in millions, defined as the gross change in the value of the acquirer’s equity minus
the predicted change from the market model. The value-weighted cumulative abnormal return,
VWCAR(�1,+1), is the sum of the dollar abnormal returns across acquirers divided by the aggregate
market capitalization of acquirers. ANPV/TV is the abnormal dollar return divided by the total
transaction value reported by SDC and represents the dollar gain per dollar spent on acquisitions. The
final row for each sub-group lists the number of observations. The difference tests are based on t-tests for
equality in means and a Wilcoxon-test for equality of medians. Median values are in brackets. The sum of
the abnormal dollar returns across acquisitions is reported in italics.
All Large Small Difference
(1) (2) (3) (2)�(3)
CAR(�1,+1) 1.102a 0.076 2.318a �2.242a
[0.362]a [�0.027] [0.940]a [�0.967]a
ANPV($2001) �25.2a �47.9a 1.7a �49.6a
[0.5]a [�0.1]a [0.6] [�0.7]a
�$302,742 �$312,061 $9,319
VWCAR(�1,+1) �1.177 �1.249 1.272
ANPV/TV 5.613b 2.961 8.755a �5.794[1.874]a [�0.152] [3.791]a [�3.943]a
n 12,023 6,520 5,503
aStatistical significance at the 1% level.bStatistical significance at the 5% level.
S.B. Moeller et al. / Journal of Financial Economics 73 (2004) 201–228 207

the equally-weighted dollar abnormal return have opposite signs. Such a situationcan arise when there is a size effect. If large firms and small firms have differentannouncement returns, a value-weighted average abnormal return should reflect theannouncement returns of large firms. The value-weighted average abnormal return ispresented in the third row. It corresponds simply to the sum of the dollar abnormalreturns across acquirers divided by the aggregate market capitalization of acquirers.As expected, the value-weighted average abnormal return is negative (�1.18%).The existence of a size effect in acquiring-firm abnormal returns can be established
by dividing the sample into small and large acquiring firms. Table 2 shows that largefirms have an insignificant equally weighted abnormal return of 0.08% and a value-weighted abnormal return of –1.25%. In contrast, small firms have an equallyweighted abnormal return of 2.32%, significantly higher than that of large firms, anda value-weighted abnormal return of 1.27%.A legitimate concern is that announcements might be more unexpected for small
firms than for large firms. As a result, the announcement returns of large firms wouldbe pulled towards zero compared to small firms. If this were the case, however, thesize effect would be even larger for the type of acquisitions where the abnormalreturn of large firms is negative.
3. Is the size effect explained by firm and deal characteristics?
We first show how firm and deal characteristics differ between large and smallacquirers. We then explore whether these differences explain why the abnormalreturns of large and small acquirers differ. To do that, we compare abnormal returnsfor similar deals across large and small acquirers and then use multivariateregressions.
3.1. The relation of acquiring-firm size to firm and deal characteristics
Table 3 shows deal and acquiring-firm characteristics for our sample. We reportthe information for the whole sample and for large and small firms. The dollar valueof acquisitions is much larger for large firms than small firms. This is not surprising,but what is surprising is that the acquisitions by small firms are larger relative to firmmarket value (defined as book value of assets minus book value of equity plusmarket value of equity) or relative to their market value of equity, than are theacquisitions by large firms. Asquith et al. (1983) show that bidder returns increase inthe ratio of the target’s equity capitalization to the bidder’s equity capitalization.This ratio is larger for small acquirers, so that we will have to investigate whetherthis characteristic helps explain the size effect. It also takes longer for large firms tocomplete an acquisition than for small firms. This may not be surprising sinceregulatory issues are typically more important for large firms.We expect competition for a target to decrease the return to the acquirer. We use
as a proxy for competition whether multiple firms make a public bid for the sametarget. With this proxy, competition is rare, but it is more frequent for large
ARTICLE IN PRESSS.B. Moeller et al. / Journal of Financial Economics 73 (2004) 201–228208

ARTICLE IN PRESS
Table 3
Summary statistics: sorted by acquirer size
The sample contains all completed U.S. mergers and acquisitions between 1980 and 2001 as listed by SDC
where the publicly traded acquiring firm gains control of a public, private, or subsidiary target whose
transaction value is at least $1 million and 1% of the acquirer’s market value. Small (large) acquirers have
a market capitalization equal to or less (greater) than the market capitalization of the 25th percentile of
NYSE firms in the same year. The transaction value ($ million) is the total value of consideration paid by
the acquirer, excluding fees and expenses. Relative size is the transaction value divided by the equity
market capitalization of the acquirer at the end of the fiscal year prior to the acquisition announcement.
Competed deals have at least one other bidder for the same target. The liquidity index for the
target is calculated as the value of all corporate control transactions for $1 million or more reported
by SDC for each year and two-digit SIC code divided by the total book value of assets of all Compustat
firms in the same two-digit SIC code and year. The number of days to completion is measured as the
number of calendar days between the announcement and effective dates. The cash (equity) in payment is
the percent cash (equity) payment of the transaction value. Pure cash (equity) deals are when
100% of the consideration is cash (equity). Acquisitions are defined as tender offers, hostile,
and competed deals as reported by SDC. Conglomerate deals involve targets with a two-digit SIC code
other than that of the bidder. The percent public, private, and subsidiary targets are the proportions in
each sample. In Panel B, Cash includes cash and marketable securities and debt is total assets minus the
book value of equity. The firm market value is total book assets minus the book value of equity plus
market capitalization. Tobin’s q is defined as the firm market value divided by the book value of assets.
Operating cash flow (OCF) is sales minus the cost of goods sold, sales and general administration, and
working capital change. Book-to-market is defined as in Fama and French (1993). Median values are in
brackets.
Large Small All
Panel A: Deal characteristics
Transaction value (TV) 450.10 29.70a 257.67
[75.70] [11.50]a [31.00]
TV/assets 0.1041 0.2811a 0.1851
[0.0412] [0.0955]a [0.0614]
Relative size 0.1928 0.5016a 0.3342
[0.0803] [0.1863]a [0.1185]
Competed deals 0.0183 0.0049a 0.0121
Days to completion 92.70 68.10a 81.45
[68.00] [35.00]a [52.00]
Liquidity index for target 0.1099 0.1039c 0.1072
[0.0450] [0.0480]a [0.0453]
Cash in payment (%) 51.25 57.17a 53.96
Equity in payment (%) 35.55 28.31a 32.23
Pure cash deals (%) 40.09 40.85 40.44
Pure equity deals (%) 28.45 20.04a 24.60
Hostile deals (%) 0.63 0.25a 00.46
S.B. Moeller et al. / Journal of Financial Economics 73 (2004) 201–228 209

acquirers than for small acquirers. However, our measure suffers from the fact thatwhile sometimes there are multiple potential acquirers, the competition among themtakes place privately. Boone and Mulherin (2002) show that, in the 1990s, anacquisition by one public bidder can follow a private auction in which many firmsparticipate. Here our measure of competition would indicate no competition, eventhough there might have been strong competition in the private auction. Another
ARTICLE IN PRESS
Table 3 (continued)
Large Small All
Tender-offers (%) 6.04 1.45a 03.94
Conglomerate deals (%) 40.54 43.65a 41.96
Public target (%) 30.08 12.38a 21.97
Private target (%) 38.19 56.21a 46.44
Subsidiary target (%) 31.73 31.42 31.59
Panel B: Acquirer characteristics
Cash/assets (book) 0.1445 0.1607a 0.1519
[0.0663] [0.0730]a [0.0684]
Assets (book) 4,618.6 214.6a 2,602.9
[959.5] [74.4]a [302.2]
Assets (market) 6,744.5 256.0a 3,774.7
[1,687.3] [130.7]a [530.4]
Equity (market) 3,072.6 92.2a 1708.5
[806.7] [72.8]a [263.2]
Debt/assets (book) 0.4667 0.4707 0.4686
[0.4620] [0.4452]b [0.4548]
Debt/assets (market) 0.2872 0.3333a 0.3092
[0.2650] [0.2925]a [0.2782]
Tobin’s q 2.5136 1.8629a 2.2158
[1.5402] [1.3515]a [1.4461]
OCF/assets (market) 0.1141 0.1464 0.1286
[0.0896] [0.0907] [0.0902]
Book-to-market 0.4805 0.6354a 0.5514
[0.4270] [0.5425]a [0.4757]
aStatistical significance between large and small at the 1% level.bStatistical significance between large and small at the 5% level.cStatistical significance between large and small at the 10% level.
S.B. Moeller et al. / Journal of Financial Economics 73 (2004) 201–228210

problem with our proxy for competition is that in a competitive market, a firm mightchoose to increase the premium offered to deter competition. Hence, we mightconclude that there is no competition when in fact potential competition stronglyimpacts the premium. An alternative proxy for competition is whether a particularacquisition takes place in an active mergers and acquisitions market. As a measure ofhow active the market for mergers and acquisitions is in an industry, we use(following Schlingemann et al., 2002) the value of all corporate control deals in aparticular year and two-digit SIC code divided by the book value of all assets in thecorresponding year and two-digit SIC code. We find the mean value for this liquidityindex to be marginally higher for large firms than for small firms, but the oppositeoccurs with medians.Earlier research shows that equity offers for the acquisition of public firms have
lower returns (e.g., Travlos, 1987). In contrast, equity offers for the acquisition ofprivate firms have higher abnormal returns (e.g., Chang, 1998; Fuller et al., 2002).Cash is used more frequently in acquisitions by small firms. Using the SDCdefinition of hostility, hostile offers have lower abnormal returns (see Schwert, 2000).Few offers are hostile in our sample, but small firms are half as likely to make ahostile offer. Similarly, small firms are much less likely to make tender offers thanlarge firms. Though not reported in Table 3, small firms are never white knights inour sample, while large firms sometimes are. Morck et al. (1990) show that acquirersof public firms have lower abnormal returns for diversifying acquisitions. We definea transaction as diversifying if the target and acquirer have different two-digit SICcodes (using the SIC codes reported by SDC). Small firms are more likely to makediversifying acquisitions than are large firms. Though we do not report thisinformation in Table 3, large firms that acquire public firms are more likely to useoptions in their offer, make an offer with a collar, have termination fees, and facelitigation in the acquisition process.Next we provide information on the organizational form of the assets acquired.
Zingales (1995) presents a model in which the acquirer of a private firm or asubsidiary faces a different bargaining situation than the acquirer of a public firm.With the acquisition of a public firm, the free-rider problem identified by Grossmanand Hart (1980) comes into play, so that the shareholders of public firms get a betterdeal when their firm is acquired than do the shareholders of private firms. However,the owners of private firms or subsidiaries might be more likely to be looking to sellthem, either to exit or to raise funds. In such cases, the acquirer might benefit fromproviding a liquidity service. Most of the existing empirical evidence on acquisitionsis on acquisitions of public firms. However, there is evidence that the abnormalreturn associated with the announcement of acquisitions of private firms andsubsidiaries is higher. Fuller et al. (2002) show this for a sample of repeat acquirers inthe 1990s and Chang (1998) shows this for a sample of firms acquiring private firmswith equity. In our sample, almost half of the acquisitions are private-firmacquisitions. Public-firm acquisitions represent less than one quarter of the sample.Large firms are more than twice as likely as small firms to acquire a public firm. Itcould therefore be that the size effect is explained by the fact that large firms aremore likely to acquire a public firm. In the following, it will therefore be important
ARTICLE IN PRESSS.B. Moeller et al. / Journal of Financial Economics 73 (2004) 201–228 211

for us to investigate whether the size effect holds irrespective of the organizationalform of the acquired firm. The probability that a subsidiary will be acquired isroughly the same for a small and a large firm.Panel B of Table 3 provides characteristics of the acquiring firm. Free cash flow
theory predicts that firms with empire-building managers and poor investmentopportunities prefer to invest the firm’s excess cash flow rather than pay it toshareholders. Such firms accumulate excess cash, so that firms with excess cash aremore likely to make poor acquisitions (see Harford, 1999). However, small firmshave a higher mean and median ratio of cash to total assets, which deepens thepuzzle of the size effect. Maloney et al. (1993) show that firms with higher leveragemake better acquisitions and small firms have higher leverage than large firms. Wealso estimate Tobin’s q using the market value of the firm’s assets divided by thebook value. As mentioned earlier, the existing evidence is that firms with higher q
values make better acquisitions. Small firms have lower q values than large firms, sothat differences in q cannot explain the size effect. Finally, we report the equity book-to-market (BM) ratio, computed as in Fama and French (1993). Dong et al. (2002)argue that firms with low BM ratios are more likely to be overvalued. Small firmshave higher BM ratios. There is no significant difference between the operating cashflows of large and small firms.
3.2. Abnormal returns, firm size, deal characteristics, and firm characteristics
We show in Table 4 how abnormal returns differ between large and small firmsdepending on the organizational form of the assets acquired and the form ofpayment. We report both abnormal returns and dollar abnormal returns for the rowswithout the size breakout to show that abnormal returns and dollar abnormalreturns can lead to different conclusions because of the size effect. When we comparesmall firms and large firms, we only report equally-weighted (and not dollar or value-weighted) abnormal returns to save space since we already take into account sizedifferences by splitting the sample.We find that acquisitions have positive abnormal returns irrespective of how they
are financed, but the dollar abnormal return is significantly negative when equity isused in payment. For each type of financing, there is a significant difference betweensmall and large firms that ranges from 1.478% for acquisitions paid with cash to2.986% for those paid with equity only. Strikingly, small firms have significantpositive abnormal returns in excess of 2% for each type of financing.In Panel B, we show that acquisitions of private firms have significantly positive
abnormal returns. The highest abnormal returns are for equity and mixed offers asone would expect from the results of Chang (1998) and Fuller et al. (2002). Turningto public targets in Panel C, the abnormal return is significantly negative for thewhole sample. Cash offers have an insignificant positive abnormal return, but theother acquisitions have a significant negative abnormal return. The only negativeabnormal return for small firms in Table 4 is when they acquire public targets withequity only. Large firms have a significant negative abnormal return for each form offinancing – even cash. Finally, we report results for acquisitions of subsidiaries. The
ARTICLE IN PRESSS.B. Moeller et al. / Journal of Financial Economics 73 (2004) 201–228212
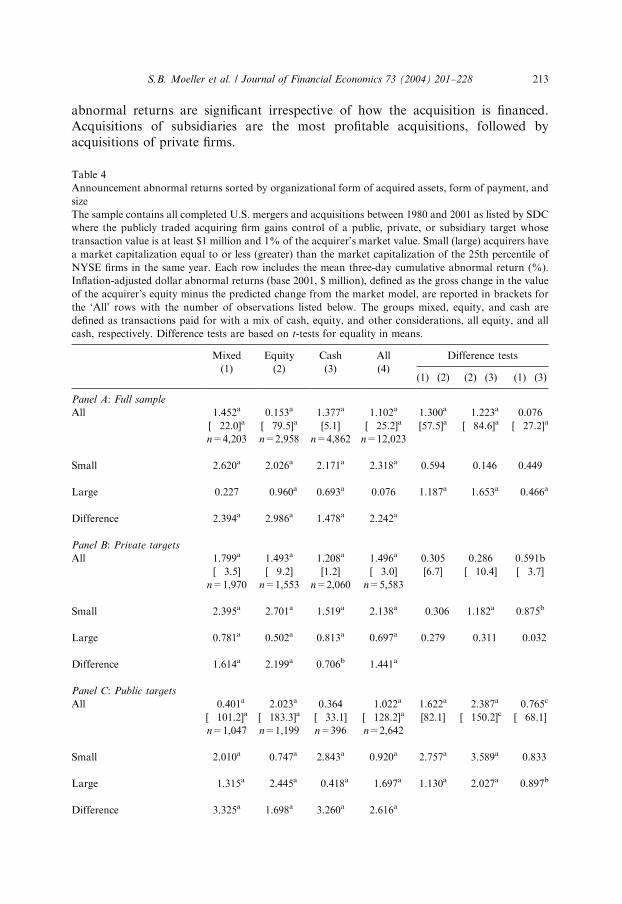
abnormal returns are significant irrespective of how the acquisition is financed.Acquisitions of subsidiaries are the most profitable acquisitions, followed byacquisitions of private firms.
ARTICLE IN PRESS
Table 4
Announcement abnormal returns sorted by organizational form of acquired assets, form of payment, and
size
The sample contains all completed U.S. mergers and acquisitions between 1980 and 2001 as listed by SDC
where the publicly traded acquiring firm gains control of a public, private, or subsidiary target whose
transaction value is at least $1 million and 1% of the acquirer’s market value. Small (large) acquirers have
a market capitalization equal to or less (greater) than the market capitalization of the 25th percentile of
NYSE firms in the same year. Each row includes the mean three-day cumulative abnormal return (%).
Inflation-adjusted dollar abnormal returns (base 2001, $ million), defined as the gross change in the value
of the acquirer’s equity minus the predicted change from the market model, are reported in brackets for
the ‘All’ rows with the number of observations listed below. The groups mixed, equity, and cash are
defined as transactions paid for with a mix of cash, equity, and other considerations, all equity, and all
cash, respectively. Difference tests are based on t-tests for equality in means.
Mixed Equity Cash All Difference tests
(1) (2) (3) (4)(1)�(2) (2)�(3) (1)�(3)
Panel A: Full sample
All 1.452a 0.153a 1.377a 1.102a 1.300a �1.223a 0.076
[�22.0]a [�79.5]a [5.1] [�25.2]a [57.5]a [�84.6]a [�27.2]a
n=4,203 n=2,958 n=4,862 n=12,023
Small 2.620a 2.026a 2.171a 2.318a 0.594 �0.146 0.449
Large 0.227 �0.960a 0.693a 0.076 1.187a �1.653a �0.466a
Difference 2.394a 2.986a 1.478a 2.242a
Panel B: Private targets
All 1.799a 1.493a 1.208a 1.496a 0.305 0.286 0.591b
[�3.5] [�9.2] [1.2] [�3.0] [6.7] [�10.4] [�3.7]n=1,970 n=1,553 n=2,060 n=5,583
Small 2.395a 2.701a 1.519a 2.138a �0.306 1.182a 0.875b
Large 0.781a 0.502a 0.813a 0.697a 0.279 �0.311 �0.032
Difference 1.614a 2.199a 0.706b 1.441a
Panel C: Public targets
All �0.401a �2.023a 0.364 �1.022a 1.622a �2.387a �0.765c
[�101.2]a [�183.3]a [�33.1] [�128.2]a [82.1] [�150.2]c [�68.1]n=1,047 n=1,199 n=396 n=2,642
Small 2.010a �0.747a 2.843a 0.920a 2.757a �3.589a �0.833
Large �1.315a �2.445a �0.418a �1.697a 1.130a �2.027a �0.897b
Difference 3.325a 1.698a 3.260a 2.616a
S.B. Moeller et al. / Journal of Financial Economics 73 (2004) 201–228 213

3.3. Does size proxy for acquiring-firm and deal characteristics?
The comparisons in Table 4 ignore that firms and deals differ in other dimensionsthan in the form of financing and the organizational form of assets. To take intoaccount other determinants of abnormal returns, we estimate a multiple regression.In Table 5, regression (1) uses all the acquisitions for which we have data,
regardless of the type of acquisition, and controls for acquiring-firm and dealcharacteristics. To capture the size effect, we use a dummy variable that equals one ifthe acquiring firm is small. Controlling for firm and deal characteristics, we find thatthe abnormal return of an acquisition is 1.59 percentage points higher if it involves asmall acquirer. Keeping everything else the same, firms that make acquisitions ofprivate firms and public firms have significantly lower abnormal returns than firmsthat make acquisitions of subsidiaries. Whether an acquisition is paid for with equityis not correlated with abnormal returns when the whole sample is used.Cash acquisitions have significantly lower abnormal returns. This is surprising in
light of the evidence for public acquisitions. The reason for this result is thatacquisitions of private firms financed with equity or with a mix of securities havehigher abnormal returns, while acquisitions of public firms in general have lowerabnormal returns. There are two plausible explanations for the higher abnormalreturns of all-equity and mixed offers. First, the ownership of the private firm beingacquired is normally highly concentrated, so that the owners of the firm can obtaininside information about the true value of the equity they receive as payment fortheir shares. This conveys favorable information about the true value of theacquirer’s shares as in the analysis of private placements of equity by Hertzel andSmith (1993). Second, the owners of the private firm become large shareholders ofthe acquirer, so that they have incentives to monitor the management of theacquiring firm as suggested by Chang (1998) and Fuller et al. (2002). In a regression
ARTICLE IN PRESS
Table 4 (continued)
Mixed Equity Cash All Difference tests
(1) (2) (3) (4)(1)�(2) (2)�(3) (1)�(3)
Panel D: Subsidiary targets
All 2.513a 2.721a 1.688a 2.002a �0.207 1.033c 0.825a
[15.4]a [�5.3] [14.8]c [13.9]a [20.7] [�20.1] [0.6]
n=1,186 n=206 n=2,406 n=3,798
Small 3.353a 5.394a 2.857a 3.190a �2.040 2.537b 0.497
Large 1.587a �0.058 0.854a 1.009a 1.645b �0.912 0.733a
Difference 1.767a 5.452c 2.003a 2.181a
aStatistical significance at the 1% level.bStatistical significance at the 5% level.cStatistical significance at the 10% level.
S.B. Moeller et al. / Journal of Financial Economics 73 (2004) 201–228214

ARTICLE IN PRESS
Table 5
Cross-sectional regression analysis of announcement abnormal returns
The sample contains all completed U.S. mergers and acquisitions between 1980 and 2001 as listed by SDC
where the publicly traded acquiring firm gains control of a public, private, or subsidiary target whose
transaction value is at least $1 million and 1% of the acquirer’s market value. The dependent variable is
the three-day cumulative abnormal return measured using the market model. Private, public, small,
conglomerates, tender-offer, hostile, competed, all equity, and all cash are dummy variables that take the
value one for acquisitions of private firms, of public firms, by firms whose capitalization is below the 25th
percentile of NYSE firms that year, of firms in another two-digit SIC code than the acquirer, if the
acquisition is a tender offer, if it is hostile according to SDC, if there is more than one bidder, if only equity
is used to pay for the acquisition, and if only cash is used, respectively. The transaction value ($ million) is
the total value of consideration paid by the acquirer, excluding fees and expenses. Relative size is the
transaction value divided by the equity market capitalization of the acquirer at the end of the fiscal year
prior to the acquisition announcement. The liquidity index for the target is calculated as the value of all
corporate control transactions for $1 million or more reported by SDC for each year and two-digit SIC
code divided by the total book value of assets of all Compustat firms in the same two-digit SIC code and
year. Tobin’s q is defined as the firm market value divided by the book value of assets. Operating cash flow
(OCF) is sales minus the cost of goods sold, sales and general administration, and working capital change.
Significance is based on White-adjusted standard errors with p-values reported below each coefficient.
Sample
All All All Small Large
(1) (2) (3) (4) (5)
Intercept 0.0150a 0.0503a 0.0465a 0.0316a 0.0184a
0.000 0.001 0.001 0.001 0.001
Private �0.0037c �0.0042c �0.0043b �0.0058 �0.00160.085 0.051 0.045 0.104 0.443
Public �0.0320a �0.0297a �0.0297a �0.0242a �0.0311a
0.000 0.001 0.001 0.002 0.001
Small 0.0159a
0.000
ln equity (market) �0.0051a
0.001
ln assets (book) �0.0050a
0.001
Conglomerate �0.0036c �0.0039b �0.0037b �0.0038 �0.0045b
0.051 0.033 0.042 0.236 0.016
Tender offer 0.0153a 0.0153a 0.0154a 0.0201 0.0147a
0.001 0.001 0.001 0.175 0.001
Hostile �0.0116 �0.0109 �0.0109 �0.0387 0.0052
0.195 0.221 0.222 0.129 0.553
Competed �0.0067 �0.0054 �0.0056 �0.0302c 0.0005
0.299 0.391 0.375 0.057 0.944
S.B. Moeller et al. / Journal of Financial Economics 73 (2004) 201–228 215
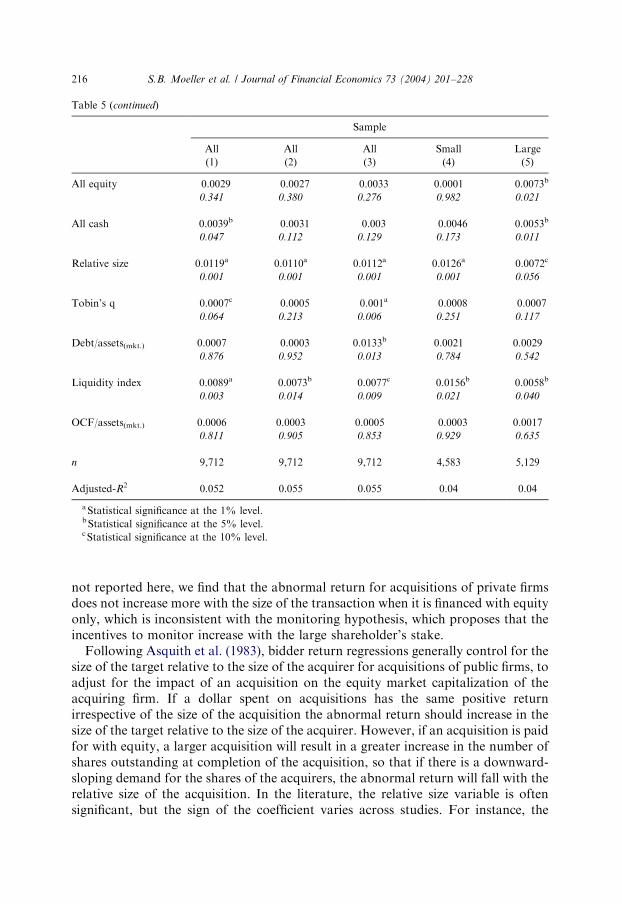
not reported here, we find that the abnormal return for acquisitions of private firmsdoes not increase more with the size of the transaction when it is financed with equityonly, which is inconsistent with the monitoring hypothesis, which proposes that theincentives to monitor increase with the large shareholder’s stake.Following Asquith et al. (1983), bidder return regressions generally control for the
size of the target relative to the size of the acquirer for acquisitions of public firms, toadjust for the impact of an acquisition on the equity market capitalization of theacquiring firm. If a dollar spent on acquisitions has the same positive returnirrespective of the size of the acquisition the abnormal return should increase in thesize of the target relative to the size of the acquirer. However, if an acquisition is paidfor with equity, a larger acquisition will result in a greater increase in the number ofshares outstanding at completion of the acquisition, so that if there is a downward-sloping demand for the shares of the acquirers, the abnormal return will fall with therelative size of the acquisition. In the literature, the relative size variable is oftensignificant, but the sign of the coefficient varies across studies. For instance, the
ARTICLE IN PRESS
Table 5 (continued)
Sample
All All All Small Large
(1) (2) (3) (4) (5)
All equity �0.0029 �0.0027 �0.0033 0.0001 �0.0073b
0.341 0.380 0.276 0.982 0.021
All cash �0.0039b �0.0031 �0.003 �0.0046 �0.0053b
0.047 0.112 0.129 0.173 0.011
Relative size 0.0119a 0.0110a 0.0112a 0.0126a �0.0072c
0.001 0.001 0.001 0.001 0.056
Tobin’s q �0.0007c �0.0005 �0.001a �0.0008 �0.00070.064 0.213 0.006 0.251 0.117
Debt/assets(mkt.) 0.0007 �0.0003 0.0133b 0.0021 0.0029
0.876 0.952 0.013 0.784 0.542
Liquidity index �0.0089a �0.0073b �0.0077c �0.0156b �0.0058b
0.003 0.014 0.009 0.021 0.040
OCF/assets(mkt.) 0.0006 0.0003 0.0005 �0.0003 0.0017
0.811 0.905 0.853 0.929 0.635
n 9,712 9,712 9,712 4,583 5,129
Adjusted-R2 0.052 0.055 0.055 0.04 0.04
aStatistical significance at the 1% level.bStatistical significance at the 5% level.cStatistical significance at the 10% level.
S.B. Moeller et al. / Journal of Financial Economics 73 (2004) 201–228216

relative size is positive in Asquith et al. (1983) but negative in Travlos (1987). Sincethe relative size variable falls as bidder size increases, all else equal, it follows thatbidder returns are negatively related to bidder size when the variable has a positivecoefficient.3 Regression (1) uses relative size, defined as the sum of all considerationpaid, excluding fees and costs, divided by the market value of equity of the acquireras an explanatory variable. This variable has a significant coefficient of 0.0119. Thesignificance of the coefficient on the size dummy variable does not depend onwhether we control for the value of the target relative to the value of the acquirer,but adding the relative size variable to the regression reduces the magnitude of thecoefficient on the size dummy variable from 0.199 (not reported) to 0.0159. In anycase, the size effect is not the same as the relative size effect.The coefficients of the other variables in regression (1) are similar to those of
earlier studies, with some exceptions. As in Morck et al. (1990), conglomerateacquisitions have lower abnormal returns. Acquiring-firm shareholders gain morewith tender offers. Almost all tender offers are acquisitions of public firms paid forwith cash. Consequently, an acquisition of a public firm paid for with cash through atender offer has a higher abnormal return than an acquisition of a public firm paidfor with equity in a merger. Our proxy for q has a negative significant coefficient,which is surprising since the earlier literature (see Lang et al. 1989; Servaes, 1991)shows a positive relation between abnormal returns and q, but the effect iseconomically trivial.4 As expected, acquisitions in industries with more mergers andacquisitions activity, i.e., industries with a high liquidity index, have lower abnormalreturns. Potential competition therefore lowers returns to acquiring-firm share-holders. Finally, the coefficient on leverage, defined as the firm’s total debt over thefirm’s market value, is insignificant, which is surprising in light of Maloney et al.(1993).In Table 4, we split the sample into large and small firms, but in a regression we
can use a continuous measure of size. In regression (2), we replace the size dummywith the logarithm of the market capitalization of the acquiring firm’s equity. Thiscoefficient is negative and significant, providing further evidence of the size effect.We estimate regression (1) for each type of organizational form of the acquired
firm and for each type of financing separately to make sure that the size effect ispervasive across types of acquisitions, and this is indeed the case (results notreported). The lowest estimate of the size effect, 1.25%, is for acquisitions of private
ARTICLE IN PRESS
3Schwert (2000) finds a positive coefficient on bidder size when examining cumulative abnormal returns
from day 63 before the announcement to day 126 after the announcement. His abnormal returns are
market model abnormal returns assuming an intercept of zero. The average bidder size in Schwert (2000) is
much higher than in our study. Using our sample until 1996, our abnormal returns, and Schwert’s (2000)
explanatory variables (using only SDC information for hostility), we find that the coefficient on bidder size
becomes positive, but insignificant, when we eliminate firms with assets below $250 million.4Earlier evidence by Servaes (1991) for acquisitions of public firms and by Lang et al. (1989) for tender
offers shows that high q bidders have higher abnormal returns. If we consider only large-firm acquisitions
and use a dummy variable for firms with q below the sample median (regressions not reported), the
dummy variable is significantly negative for cash acquisitions in the 1980s, which is consistent with the
earlier literature, but the dummy variable is not significant in the 1990s.
S.B. Moeller et al. / Journal of Financial Economics 73 (2004) 201–228 217

firms, and the highest estimate, 3.49%, is for acquisitions of public firms. Allestimates are significant at better than the 1% level. When we turn to acquisitions ofpublic firms or acquisitions financed with equity, the relative size variable becomesinsignificant. We also investigate whether the size effect is robust to controlling foryear and industry effects. After adding dummy variables for two-digit SIC code-based major industry classification for acquired firms or acquirers, as well as yeardummies, we find that the impact of size remains unaffected (regressions notreported in the table).As explained earlier, our sample uses only completed offers. At the time of the
acquisition, investors do not know whether the acquisition will succeed. The problemwith taking into account offers that do not succeed is that the data on uncompletedacquisitions are likely to be much better for acquisitions of public firms because suchoffers have to be made to public shareholders. Nevertheless, we estimate ourregressions using both completed and unsuccessful offers. Though we do not reportthese regressions, none of our conclusions concerning the size effect depend onwhether we use only successful acquisitions or also include unsuccessful acquisitions.
4. Why do large firms have lower announcement abnormal returns than small firms?
In this section, we explore whether the hypotheses advanced to explain thenegative abnormal returns associated with acquisitions are more pertinent foracquisitions by large firms. We first examine whether the overvaluation, equitysignaling, growth opportunities signaling, and free cash flow hypotheses can explainthe size effect. This would require these hypotheses to predict lower returns foracquisitions by large firms, but the hypotheses would not apply to acquisitions bysmall firms or at least would apply less to them. We then examine whether large firmsare more prone to overpay and to undertake offers with negative synergy. Finally,we investigate long-run returns following acquisitions by small and large firms.
4.1. Can overvaluation, signaling, or agency explain the size effect?
We saw in Table 3 that large firms have a higher Tobin’s q proxy and a lower BMratio than small firms. Dong et al. (2002) and others believe that these variablesproxy for overvaluation. Since by definition large firms have a high equitycapitalization, it could simply be that they are more likely to be overvalued. Whenthey announce the acquisition, they might signal something about their true value tothe market, especially when they use equity. The overvaluation hypothesis of Donget al. (2002) seems hard to disentangle from the equity signaling hypothesis and thegrowth opportunities signaling hypothesis.If size proxies for overvaluation, either because of market inefficiency as in Dong
et al. (2002) or because of private information as in the signaling hypotheses, equitymarket capitalization should explain more of the abnormal returns than will thebook value of assets. An increase in the stock price necessarily increases a firm’sequity market capitalization, but it does not necessarily increase the book value of a
ARTICLE IN PRESSS.B. Moeller et al. / Journal of Financial Economics 73 (2004) 201–228218

firm’s assets. To examine this hypothesis, we use the log of book value of firm assetsas our size measure in regression (3) in Table 5. We find that the coefficient on thebook value of assets is negative and significant and the adjusted R2 of regression (3)is essentially the same as the adjusted R2 of regression (2). This evidence is notsupportive of the hypothesis that size proxies for overvaluation.Another way to examine whether the overvaluation and signaling hypotheses
explain the size effect is to estimate regression (1) separately for small and largefirms. If these hypotheses are relevant for large firms but not small ones, regression(1) would have a size effect because it is misspecified, in that the variables thatinfluence bidder returns do so differentially for large and small firms. Regressions (4)and (5) in Table 5 estimate regression (1) separately for small and large firms. Onlyone variable has a significantly different impact on small and large firms: thecoefficient on the relative size of the acquisition. The relative size coefficient issignificantly positive for small firms and significantly negative for large firms. Thesignaling hypotheses do not predict this difference in the sign of the relative sizecoefficient. However, if large acquirers systematically overpay for acquisitions, anegative association between bidder gains and bidder size is expected. This suggeststhat the hubris hypothesis might be relevant for large firms but not small ones. Weinvestigate this possibility more directly for public offers below using premium datafor these offers. Finally, if acquisitions are positive net present value projects forsmall firms, larger acquisitions would lead to a higher net present value and hence alarger abnormal return if the net present value per dollar invested does not dependon the size of the acquisition. The opposite would be the case for large firms ifacquisitions are negative net present value project for these firms.Mitchell et al. (2004) provide evidence that arbitrageurs put pressure on the stock
price of the acquiring firm for all-equity offers for public firms. This is because theyestablish long positions in target stock and short positions in bidder stock. This pricepressure effect should be larger as the size of the acquisition relative to the marketcapitalization of the bidder increases. From our regressions, this is not the case forthe sample as a whole. However, when we estimate our regression for the sample ofoffers by large firms for public firms paid for with equity, we find a coefficient of�0.061, significant at the 1% level. In contrast, the coefficient on small firms isinsignificant and much closer to zero. This evidence is consistent with the hypothesisof Mitchell et al. (2004) applying to large but not small firms.We also examine, but do not report the estimated regressions, whether the size
effect is simply the result that young firms are small. It is not implausible that growthopportunities would be more important for young firms than older ones. However,when we add the age of the firm, measured as the number of years the firm’s stockreturns have been reported by CRSP, that variable is insignificant.
4.2. Do large firms overpay?
Roll’s hubris hypothesis predicts that managers are overconfident and overpay.When Malmendier and Tate (2002) measure overconfidence by the options amanager has left unexercised, they find evidence that overconfident managers make
ARTICLE IN PRESSS.B. Moeller et al. / Journal of Financial Economics 73 (2004) 201–228 219
more acquisitions and that abnormal returns are lower. There are good reasons tothink that managers of large firms might be more prone to overconfidence. Suchmanagers might have made the firm large or, if not, they might have to overcomemore obstacles to become CEOs than managers of small firms. Since we have dataon premiums for public offers, we can investigate whether large firms pay more.As reported by Officer (2003), the data on premiums have a number of problems.
SDC reports three pieces of information on premiums. First, they provide the valueof the different components of the offer (i.e., the aggregate value of cash, stock, andother securities offered by the bidder to the target shareholders). Second, theyprovide the initial offer price. Third, they list the terminal offer price. Unfortunately,the premium data are not available for all acquisitions of publicly traded firms.Further, while the components data are available for roughly three-quarters of oursample and the terminal offer price is available for a slightly larger number ofacquisitions, the initial offer price is not provided by SDC for more than half of oursample. Since we are interested in understanding the announcement abnormalreturns, the best approach is to use the components data, which are available at thetime of the announcement. The premium is then defined as the value of thecomponents divided by the market value of the target 50 days prior to theannouncement day. We follow Officer (2003) and truncate the premium so that ittakes values between zero and two. Alternatively, we follow Schwert (2000) anddefine the premium as the market model residual for the target firm cumulated overthe period starting 63 days prior to the announcement to 126 days after theannouncement day.The mean and median premiums are larger for acquisitions by large firms than for
those by small firms when we estimate the premium using the components data andusing the target market model residuals. The mean (median) premium foracquisitions by large firms is 68% (61%). In contrast, the mean (median) premiumfor acquisitions by small firms is 62% (52%). The difference in premiums betweenacquisitions by large and small firms is significant at the 5% level for the means andmedians. However, this result depends on how the premium is computed. Inparticular, if the premium is computed using the initial or terminal price, it does nothold. This may not be surprising because the sample using the initial price has fewersmall firms and the terminal price is affected by stock returns over the life of theoffer, which themselves might depend on firm size.There is ample evidence in the literature that firm and deal characteristics affect
the premium paid by the bidder (see, for recent papers, Officer, 2003; Schwert, 2000).It could therefore be that large firms pay more because they acquire targets or enterdeals that require a large premium rather than because they are large firms. InTable 6, regression (1) relates the components-based premium paid to firm and dealcharacteristics using similar specifications as in the recent literature. The variables weuse have the same impact on the premium as they do in other papers. Since we losealmost 600 acquisitions and end up with a sample that is biased towards large firms,we use the logarithm of equity market capitalization as our size measure so that wecan capture meaningful variation in firm size. There is a strong size effect in theregressions whether estimated using a dummy variable (not reported) or the natural
ARTICLE IN PRESSS.B. Moeller et al. / Journal of Financial Economics 73 (2004) 201–228220

ARTICLE IN PRESS
Table 6
Determinants of the bidder premium and the probability of success
The sample for this table contains all offers by U.S. firms to acquire publicly traded U.S. firms between
1980 and 2001 as listed by SDC where the publicly traded acquiring firm gains control of a public target
whose transaction value is at least $1 million and 1% of the acquirer’s market value. In model (1), the
dependent variable in an OLS regression is the premium, defined as the aggregate value of cash, stock, and
other securities offered by the bidder to the target shareholders divided by the market value of equity of
the target 50 days prior to the takeover announcement. Premium values that are less than zero or larger
than two are eliminated. In models (2) and (3) the dependent variable in a logistic regression is equal to one
if the bid is classified by SDC as successful and zero otherwise. The variable ln(Equity) is the natural
logarithm of the market value of equity. Toehold is a dummy variable equal to one if the acquirer holds at
least 5 percent of the target shares and zero otherwise. Conglomerates, tender offer, hostile, competed, and
all cash are dummy variables that take value one for acquisitions of firms in another two-digit SIC code
than the acquirer, if the acquisition is a tender-offer, if it is hostile according to SDC, if there is more than
one bidder, and if only cash is used, respectively. Significance is based on White-adjusted standard errors
for model (1) and quasi-ML robust standard errors for models (2) and (3) with p-values reported below
each coefficient. For models (2) and (3) the pseudo-R2 is reported and P(success) denotes the base case
predicted probability of success.
(1) (2) (3)
(OLS) (Logistic) (Logistic)
Intercept 0.8379a 1.7579b 1.9381a
0.000 0.012 0.005
Premium 0.1207 0.0874
0.525 0.638
All cash �0.1478a �0.586a �0.6401a
0.000 0.006 0.002
Toehold �0.1063 2.1977b
0.113 0.011
ln(Equity(bidder)) 0.0343a 0.4169a 0.401a
0.000 0.001 0.001
ln(Equity(target)) �0.0329a �0.1827b �0.1862b
0.001 0.020 0.017
Tender offer 0.1346a 1.7541a 1.8846a
0.000 0.001 0.001
Hostile 0.0326 �3.2637a �3.1851a
0.392 0.001 0.001
Conglomerate �0.0499b �0.5197a �0.462a
0.016 0.002 0.005
Tobin’s q(bidder) 0.0091 �0.0467c �0.0466c
0.103 0.077 0.076
Tobin’s q(target) �0.0117 0.0514 0.0469
0.195 0.481 0.510
S.B. Moeller et al. / Journal of Financial Economics 73 (2004) 201–228 221

logarithm of the acquirer’s equity market capitalization.5 The size effect holds inregressions in which the dependent variable is a premium computed using the initialprice, the terminal price, or the market model cumulated residuals.If large firms pay more, presumably they should have more success in making
acquisitions. Otherwise, it would mean that acquiring-firm size just proxies for firmor deal characteristics that affect the premium but are ignored in our premiumregression. Of the offers made by small firms, 13.67% are unsuccessful. In contrast,large firms fail 11.05% of the time. Again, however, firm and deal characteristicsaffect outcomes. We therefore estimate logistic regressions predicting the outcome ofthe deal in regressions (2) and (3) in Table 6. We use variables similar to those used inrecent studies (see e.g., Officer, 2003; Schwert 2000). We estimate one regressionwithout the toehold variable since presumably this variable is endogenouslydetermined and one regression with the toehold variable. The results are similar tothose obtained for the premiums. We find that large firms are significantly morelikely to succeed when they attempt to acquire a public company.The evidence on premiums and probability of success is consistent with hubris
being more of a factor for the managers of large firms. Could this explain the sizeeffect? We add the premium offered to the abnormal return regression for publicoffers. Doing so reduces the sample size. When we estimate regression (1) of Table 5on the reduced sample, the coefficient on the size dummy corresponds to anabnormal return difference between small and large firms of 2.63%. The differencebecomes 2.68% when we add the premium as an explanatory variable in theregression. When we estimate the regression separately for large and small firms, thecoefficient on the premium is significant and negative for large firms, butinsignificant and close to zero for small firms. Consequently, the greater premiumpaid by large firms decreases the average abnormal return of large firms. If a largepremium is more likely to reflect overpayment for large firms than for small firms, it
ARTICLE IN PRESS
Table 6 (continued)
(1) (2) (3)
(OLS) (Logistic) (Logistic)
Compete 0.0437 �1.6784a �1.7312a
0.250 0.001 0.001
P(success) 0.886 0.882
n 1,761 1,761 1,761
Adjusted-R2 [pseudo-R2] 0.039 0.292 0.284
aStatistical significance at the 1% level.bStatistical significance at the 5% level.cStatistical significance at the 10% level.
5Officer (2003) uses the natural logarithm of the acquirer’s equity market capitalization in his premium
regressions and reports a significant positive coefficient also.
S.B. Moeller et al. / Journal of Financial Economics 73 (2004) 201–228222

would explain why the coefficient on the premium is not significant for the sample asa whole but is significant for large firms.
4.3. Do small firm acquisitions have synergy gains?
Large firms pay more. If a firm pays too much, it just redistributes wealth from theshareholders of the acquiring firm to the shareholders of the acquired firm.Overpayment therefore does not affect the wealth of diversified shareholders.However, an acquisition that reduces the total value of the acquired and acquiringfirms makes diversified shareholders worse off. Alternatively, an acquisition that hasa synergy gain increases the combined value of the acquired and acquiring firms.Bradley et al. (1988) show that on average, acquisitions have a synergy gain for theirsample of tender offer acquisitions in the 1970s and 1980s. We examine here whetherthe synergy gains from acquisitions by small firms differ from the synergy gains fromacquisitions by large firms.We measure the impact of the acquisition announcement on the combined value of
the acquiring and acquired firm in percent and in dollars following the method ofBradley et al. (1988). We start by forming a time-series of portfolio returns in event-time for each sample transaction, where the portfolio is a value-weighted average ofthe target and bidder return accounting for a toehold if SDC reports one. Thepercentage gain over an event window, CARCi, is defined as the cumulativeabnormal return over the event window for the portfolio. Abnormal returns aredefined as market model residuals, with the parameters estimated over the(�205, �6) event window relative to the announcement day. The change in thecapitalization of the acquiring and acquired firms over an event window, $CARCi, isdefined as the combined value of the acquiring and acquired firms multiplied by theabnormal return.Table 7 reports the results for the percentage and dollar change in the combined
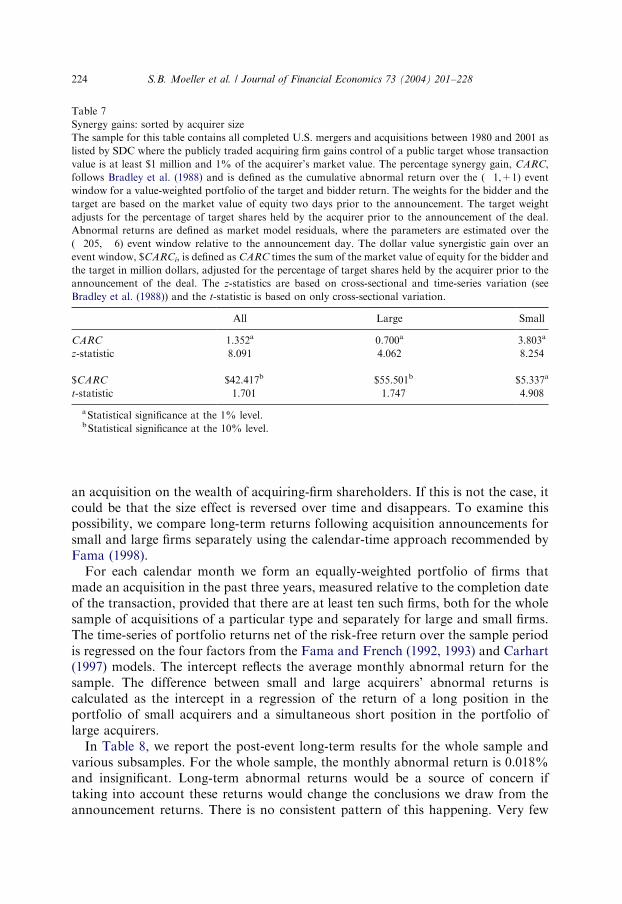
value of the acquiring and acquired firms. For the whole sample, the averagecumulative portfolio abnormal return is a significant 1.35%. The dollar abnormalreturn is a loss of $42.417 million with a t-statistic of �1.701. When we turn to thesample of large firms, we find a significant average abnormal return of 0.68%. Thedollar abnormal return represents a loss of $55.501 million with a t-statistic of�1.747. In contrast, the portfolio return for small firms is 3.80% with a z-statistic of8.254 and is significantly higher (p-value o 0.001) than for large firms. The dollarabnormal return is $5.337 million with a t-statistic of 4.908.The acquisition announcements of large firms are consistent with the existence of
negative synergies. In other words, the firm resulting from the merger is worth lessthan the constituent firms on their own. In contrast, announcements by small firmsexhibit positive synergies when using the percentage abnormal return measure.
4.4. Post-event stock price performance
So far, we have assumed that the market incorporates information in stock pricesefficiently, so that the announcement return is an unbiased estimate of the impact of
ARTICLE IN PRESSS.B. Moeller et al. / Journal of Financial Economics 73 (2004) 201–228 223
an acquisition on the wealth of acquiring-firm shareholders. If this is not the case, itcould be that the size effect is reversed over time and disappears. To examine thispossibility, we compare long-term returns following acquisition announcements forsmall and large firms separately using the calendar-time approach recommended byFama (1998).For each calendar month we form an equally-weighted portfolio of firms that
made an acquisition in the past three years, measured relative to the completion dateof the transaction, provided that there are at least ten such firms, both for the wholesample of acquisitions of a particular type and separately for large and small firms.The time-series of portfolio returns net of the risk-free return over the sample periodis regressed on the four factors from the Fama and French (1992, 1993) and Carhart(1997) models. The intercept reflects the average monthly abnormal return for thesample. The difference between small and large acquirers’ abnormal returns iscalculated as the intercept in a regression of the return of a long position in theportfolio of small acquirers and a simultaneous short position in the portfolio oflarge acquirers.In Table 8, we report the post-event long-term results for the whole sample and
various subsamples. For the whole sample, the monthly abnormal return is 0.018%and insignificant. Long-term abnormal returns would be a source of concern iftaking into account these returns would change the conclusions we draw from theannouncement returns. There is no consistent pattern of this happening. Very few
ARTICLE IN PRESS
Table 7
Synergy gains: sorted by acquirer size
The sample for this table contains all completed U.S. mergers and acquisitions between 1980 and 2001 as
listed by SDC where the publicly traded acquiring firm gains control of a public target whose transaction
value is at least $1 million and 1% of the acquirer’s market value. The percentage synergy gain, CARC,
follows Bradley et al. (1988) and is defined as the cumulative abnormal return over the (�1,+1) event
window for a value-weighted portfolio of the target and bidder return. The weights for the bidder and the
target are based on the market value of equity two days prior to the announcement. The target weight
adjusts for the percentage of target shares held by the acquirer prior to the announcement of the deal.
Abnormal returns are defined as market model residuals, where the parameters are estimated over the
(�205, �6) event window relative to the announcement day. The dollar value synergistic gain over an
event window, $CARCi, is defined as CARC times the sum of the market value of equity for the bidder and
the target in million dollars, adjusted for the percentage of target shares held by the acquirer prior to the
announcement of the deal. The z-statistics are based on cross-sectional and time-series variation (see
Bradley et al. (1988)) and the t-statistic is based on only cross-sectional variation.
All Large Small
CARC 1.352a 0.700a 3.803a
z-statistic 8.091 4.062 8.254
$CARC �$42.417b �$55.501b $5.337a
t-statistic �1.701 �1.747 4.908
aStatistical significance at the 1% level.bStatistical significance at the 10% level.
S.B. Moeller et al. / Journal of Financial Economics 73 (2004) 201–228224

ARTICLE IN PRESS
Table 8
Calendar-time post-event monthly abnormal returns
The sample for this table contains all completed U.S. mergers and acquisitions between 1980 and 2001 as
listed by SDC where the publicly traded acquiring firm gains control of a public, private, or subsidiary
target whose transaction value is at least $1 million and 1% of the acquirer’s market value. Each monthly
abnormal return is calculated using a time-series regression, where the dependent variable is the equally
weighted portfolio return in each calendar month of all bidders within each subgroup that have an event
during the 36 months prior to the measurement month. The independent variables are the Fama-French
(1993) and Carhart (1997) factors. At least ten firms per month per subgroup must exist to calculate a
portfolio return for that subgroup and month. The intercept of the time-series regression for each
subgroup is the monthly abnormal return (in percentage). The sample is divided into size (i.e., large,
small), organizational form (i.e., private, public, subsidiary), and the form of payment (i.e., mixed, equity,
cash). Difference denotes the intercept of the regression of the returns on a long position in the small and a
short position in the large firms. For each cell p-values are reported in italics.
Form Payment All Large Small Difference
Panel A: Whole sample
All All 0.018 0.076 �0.031 �0.1320.848 0.420 0.846 0.426
Panel B: Sorted by organizational form of acquired assets
Private All 0.029 0.273b �0.266 �0.588a
0.815 0.035 0.150 0.006
Public All 0.040 0.045 0.155 0.058
0.697 0.675 0.433 0.778
Subsidiary All 0.000 �0.021 0.092 0.084
0.999 0.844 0.589 0.641
Panel C: Sorted by form of payment
All Mix �0.004 �0.008 �0.002 �0.0280.741 0.944 0.991 0.886
All Equity 0.178 0.293c 0.016 �0.3490.209 0.060 0.948 0.205
All Cash 0.104 0.080 0.143 0.057
0.346 0.472 0.402 0.734
Panel D: Sorted by organizational form of acquired assets and form of payment
Private Mix �0.065 0.177 �0.257 �0.482c
0.659 0.251 0.234 0.059
Equity 0.287 0.539b �0.234 �0.763b
0.138 0.018 0.433 0.034
Cash 0.206 0.235 0.054 �0.1580.154 0.140 0.785 0.464
Public Mix �0.092 �0.092 0.032 0.027
0.447 0.452 0.905 0.924
Equity 0.189 0.152 0.820b 0.324
0.191 0.320 0.030 0.344
S.B. Moeller et al. / Journal of Financial Economics 73 (2004) 201–228 225

subsamples have significant long-term returns. Private-firm acquisitions by largefirms have positive long-term abnormal returns, while private-firm acquisitions bysmall firms have negative, yet insignificant, long-term abnormal returns. Thedifference between these abnormal returns is significant at the 1% percent level.Acquisitions of public firms paid for with cash have significant positive abnormalreturns.
5. Conclusion
We have shown that small firms fare significantly better than large firms when theymake an acquisition announcement. Overall, the abnormal return associated withacquisition announcements for small firms exceeds the abnormal return associatedwith acquisition announcements for large firms by 2.24 percentage points. Except foracquisitions of public firms paid for with equity, small firms gain significantly whenthey announce an acquisition. Large firms experience significant shareholderwealth losses when they announce acquisitions of public firms irrespective ofhow the acquisition is financed. We find that this size effect is robust. It holds(1) in the 1980s as well as in the 1990s, (2) across subsamples of acquisitionsconstructed based on the form of payment or the organizational form of the assetsacquired, and (3) in regressions that control for firm and deal characteristics.There is no evidence that the size effect is reversed over time. Large firms offerlarger acquisition premiums than small firms and enter acquisitions with negativedollar synergy gains. The evidence is therefore consistent with managerialhubris playing more of a role in the decisions of large firms. Further work istherefore required to investigate how the size effect relates to managerial incentivesand firm governance.
ARTICLE IN PRESS
Table 8 (continued)
Form Payment All Large Small Difference
Cash 0.396b 0.287c 0.764b 0.348
0.012 0.091 0.027 0.362
Subsidiary Mix 0.105 0.078 0.186 0.109
0.449 0.585 0.392 0.648
Equity 0.316 0.162 0.173 �0.0560.391 0.693 0.772 0.934
Cash 0.012 0.002 0.087 0.095
0.917 0.986 0.647 0.635
aStatistical significance at the 1% level.bStatistical significance at the 5% level.cStatistical significance at the 10% level.
S.B. Moeller et al. / Journal of Financial Economics 73 (2004) 201–228226

References
Andrade, G., Mitchell, M., Stafford, E., 2001. New evidence and perspectives on mergers. Journal of
Economic Perspectives 15, 103–120.
Asquith, P., Bruner, R., Mullins, D., 1983. The gains to bidding firms from merger. Journal of Financial
Economics 11, 121–139.
Boone, A.L., Mulherin, H.J., 2002. Corporate restructuring and corporate auction. Unpublished working
paper, Claremont College, Claremont, CA.
Bradley, M., Desai, A., Kim, E.H., 1988. Synergistic gains from corporate acquisitions and their division
between the stockholders of target and acquiring firms. Journal of Financial Economics 21, 3–40.
Brown, S.J., Warner, J.B., 1985. Using daily stock returns: the case of event studies. Journal of Financial
Economics 14, 3–31.
Carhart, M.M., 1997. On the persistence in mutual fund performance. Journal of Finance 52, 57–82.
Chang, S., 1998. Takeovers of privately held targets, method of payment, and bidder returns. Journal of
Finance 53, 773–784.
Demsetz, H., Lehn, K., 1985. The structure of corporate ownership: causes and consequences. Journal of
Political Economy, 1155-1177.
Dong, M., Hirshleifer, D., Richardson, S., Teoh, S.H., 2002. Does investor misevaluation drive the
takeover market? Unpublished working paper, The Ohio State University, Columbus, OH.
Fama, E.F., 1998. Market efficiency, long-term returns, and behavioral finance. Journal of Financial
Economics 49, 283–306.
Fama, E.F., French, K., 1992. The cross-section of expected stock returns. Journal of Finance 47,
427–465.
Fama, E.F., French, K., 1993. Common risk-factors in the returns on stocks and bonds. Journal of
Financial Economics 33, 3–56.
Fuller, K., Netter, J., Stegemoller, M., 2002. What do returns to acquiring firms tell us? Evidence from
firms that make many acquisitions. Journal of Finance 57, 1763–1794.
Grossman, S., Hart, O., 1980. Takeover bids, the free rider problem and the theory of the corporation. Bell
Journal of Economics 10, 20–32.
Harford, J., 1999. Corporate cash reserves and acquisitions. Journal of Finance 54 (6), 1969–1997.
Hertzel, M.G., Smith, R.L., 1993. Market discounts and shareholder gains for placing equity privately.
Journal of Finance 48, 459–485.
Jensen, M.C., 1986. Agency costs of free cash flow, corporate finance, and takeovers. American Economic
Review 76, 323–329.
Jovanovic, B., Braguinsky, S., 2002. Bidder discounts and target premia in takeovers. NBER Working
Paper x9009, NBER, Cambridge, MA.
Kaplan, S., Weisbach, M.S., 1992. The success of acquisitions: evidence from divestitures. Journal of
Finance 47 (1), 107–138.
Lang, L.H.P., Stulz, R.M., Walkling, R.A., 1989. Managerial performance, Tobin’s Q, and the gains from
successful tender offers. Journal of Financial Economics 24, 137–154.
Lang, L.H.P., Stulz, R.M., Walkling, R.A., 1991. A test of the free cash flow hypothesis: the case of bidder
returns. Journal of Financial Economics 29, 315–336.
Malatesta, P., 1983. The wealth effect of merger activity and the objective function of merging firms.
Journal of Financial Economics 11, 155–182.
Malmendier, U., Tate, G.A., 2002. Who makes acquisitions? CEO overconfidence and the market’s
reaction. Unpublished working paper, Harvard Business School, Cambridge, MA.
Maloney, M.T., McCormick, R.E., Mitchell, M.L., 1993. Managerial decision making and capital
structure. Journal of Business 66, 189–217.
McCardle, K.F., Viswanathan, S., 1994. The direct entry versus takeover decision and stock price
performance around takeovers. Journal of Business 67, 1–43.
Mitchell, M., Pulvino, T., Stafford, E., 2004. Price pressure around mergers. Journal of Finance 59, 31–63.
Morck, R., Shleifer, A., Vishny, R.W., 1990. Do managerial objectives drive bad acquisitions? Journal of
Finance 45, 31–48.
ARTICLE IN PRESSS.B. Moeller et al. / Journal of Financial Economics 73 (2004) 201–228 227

Myers, S.C., Majluf, N.S., 1984. Corporate financing and investment decisions when firms have
information that investors do not have. Journal of Financial Economics 13, 187–221.
Officer, M., 2003. Termination fees in mergers and acquisitions. Journal of Financial Economics. 69,
431–467.
Roll, R., 1986. The hubris hypothesis of corporate takeovers. Journal of Business 59, 197–216.
Schlingemann, F.P., Stulz, R.M., Walkling, R.A., 2002. Divestitures and the liquidity of the market for
corporate assets. Journal of Financial Economics 64, 117–144.
Schwert, G.W., 2000. Hostility in takeovers: in the eyes of the beholder? Journal of Finance 55, 2599–2640.
Servaes, H., 1991. Tobin’s q, agency costs, and corporate control: an empirical analysis of firm specific
parameters. Journal of Finance 46, 409–419.
Shleifer, A., Vishny, R.W., 2003. Stock market driven acquisitions. Journal of Financial Economics 70,
295–311.
Travlos, N.G., 1987. Corporate takeover bids, method of payment, and bidding firm’s stock returns.
Journal of Finance 52, 943–963.
Zingales, L., 1995. Insider ownership and the decision to go public. Review of Economic Studies 62,
425–448.
ARTICLE IN PRESSS.B. Moeller et al. / Journal of Financial Economics 73 (2004) 201–228228