finger inter-dependence: linking the kinetic and … hms linking kn... · finger inter-dependence:...
TRANSCRIPT
Author's personal copy
Finger inter-dependence: Linking the kineticand kinematic variables
Sun Wook Kim a, Jae Kun Shim b, Vladimir M. Zatsiorsky a,Mark L. Latash a,*
a Department of Kinesiology, The Pennsylvania State University, University Park, PA 16802, United Statesb Department of Kinesiology, The University of Maryland, College Park, MD, United States
Available online 5 February 2008
Abstract
We studied the dependence between voluntary motion of a finger and pressing forces produced bythe tips of other fingers of the hand. Participants moved one of the fingers (task finger) of the righthand trying to follow a cyclic, ramp-like flexion-extension template at different frequencies. Theother fingers (slave fingers) were restricted from moving; their flexion forces were recorded and ana-lyzed. Index finger motion caused the smallest force production by the slave fingers. Larger forceswere produced by the neighbors of the task finger; these forces showed strong modulation overthe range of motion of the task finger. The enslaved forces were higher during the flexion phaseof the movement cycle as compared to the extension phase. The index of enslaving expressed inN/rad was higher when the task finger moved through the more flexed postures. The dependenceof enslaving on both range and direction of task finger motion poses problems for methods of anal-ysis of finger coordination based on an assumption of universal matrices of finger interdependence.� 2007 Elsevier B.V. All rights reserved.
PsycINFO: 2330
Keywords: Finger; Force production; Enslaving; Kinetics; Kinematics
0167-9457/$ - see front matter � 2007 Elsevier B.V. All rights reserved.
doi:10.1016/j.humov.2007.08.005
* Corresponding author. Tel.: +1 814 863 5374; fax: +1 814 863 4424.E-mail address: [email protected] (M.L. Latash).
Available online at www.sciencedirect.com
Human Movement Science 27 (2008) 408–422
www.elsevier.com/locate/humov
Author's personal copy
1. Introduction
When a person tries to move a single finger of a hand or to press with a finger, other fingersof the hand move or generate force (Kilbreath & Gandevia, 1994; Kinoshita, Murase, &Bandou, 1996; Lang & Schieber, 2004; Li, Dun, Harkness, & Brininger, 2004; Li, Latash,& Zatsiorsky, 1998). This phenomenon has been referred to as enslaving (Li et al., 1998; Zat-siorsky, Li, & Latash, 2000) or lack of individuation (Lang & Schieber, 2003; Schieber &Santello, 2004). Enslaving has been discussed as a consequence of both peripheral and neuralfactors. In particular, the presence of multi-tendon, multi-digit muscles and of passive con-nective tissue links between adjacent fingers can be expected to contribute to enslaving (Kil-breath & Gandevia, 1994; Leijnse et al., 1993). In addition, projections of fingers in theprimary motor cortex show substantial overlaps (Schieber, 1999; Schieber & Hibbard,1993; Schieber & Santello, 2004) suggesting a neural contribution to enslaving. Besides,enslaving of a comparable magnitude has been documented in experiments when the partic-ipants produced flexion forces by pressing with their proximal phalanges (Latash, Li, Dan-ion, & Zatsiorsky, 2002). Primary agonists of this action are intrinsic hand muscles that aredigit specific. Hence, the finding supports the idea of a central neural origin of the enslaving.
Enslaving has been usually characterized using percentages of maximal forces producedby non-instructed fingers when one finger of the hand (the ‘‘task finger” or the ‘‘masterfinger”) was instructed to produce maximal force (maximal voluntary contraction,MVC) (Li et al., 1998; Zatsiorsky, Li, & Latash, 1998, 2000). In other studies enslavingwas quantified during submaximal force production by master fingers (Latash, Scholz,Danion, & Schoner, 2001, 2002; Scholz, Danion, Latash, & Schoner, 2002). These studieshave revealed, in particular, that unintended forces show nearly linear changes with theforce produced by the master finger. This finding has allowed using matrices of enslavingindices for analysis of finger coordination over a variety of tasks and force magnitudes(reviewed in Latash, Scholz, & Schoner, 2002, 2007). Enslaving matrices have also beenaddressed as finger interconnection matrices and used for computational modeling of fin-ger interaction over a variety of subject subpopulations and tasks (Gao, Li, Li, Latash, &Zatsiorsky, 2003; Zatsiorsky et al., 1998).
In some of the everyday actions, an object is grasped with only a subset of fingers, forexample in the precision grip with the thumb and one of the fingers or in the tripod grip,while other fingers are free to perform movements. In such actions, intended force produc-tion by the grasping digits may lead to unintended motion of other digits of the hand,while motion of free fingers may lead to changes in the grasping force. The main purposeof the current study has been to provide quantitative estimates of enslaving between thekinematic and kinetic variables. In particular, we have been interested in the followingquestions: Does motion of a finger in flexion and in extension bring about symmetricalchanges in forces produced by enslaved fingers? Are quantitative indices of enslaving sim-ilar over the range of flexion and extension motion of the instructed finger? To answerthese questions, we quantified the unintended force production by three fingers of the handduring the instructed flexion-extension cyclic movements of the fourth finger at differentfrequencies. Indices of enslaving were compared over different phase intervals within theflexion-extension cycle and across different movement frequencies (different movementspeeds). Answering these questions is important for modeling relations between the kine-matics and kinetics during hand action with possible implications to such areas as changesin hand function with age and neurological disorder, hand rehabilitation, and prosthetics.
S.W. Kim et al. / Human Movement Science 27 (2008) 408–422 409
Author's personal copy
2. Methods
2.1. Subjects
Ten healthy right-handed volunteers (five males and five females) participated in thisstudy. Their mean (±SD) anthropometric characteristics were: age 27.7 ± 5.5 years,weight 68.1 ± 13.1 kg, height 170 ± 8.2 cm, hand width 7.5 ± 0.9 cm, and hand length17.5 ± 1.2 cm. The hand length was measured between the middle fingertip and the distalcrease of the wrist with the hand extended, and the hand width was measured between thelateral aspect of the index and little finger metacarpophalangeal (MCP) joints. None of theparticipants had a history of neurological or peripheral disorders of the hand or profes-sional training that might affect the hand function such as playing musical instruments.All participants gave informed consent according to the procedures approved by the Officefor Research Protection of the Pennsylvania State University in compliance with the Hel-sinki Declaration.
2.2. Apparatus
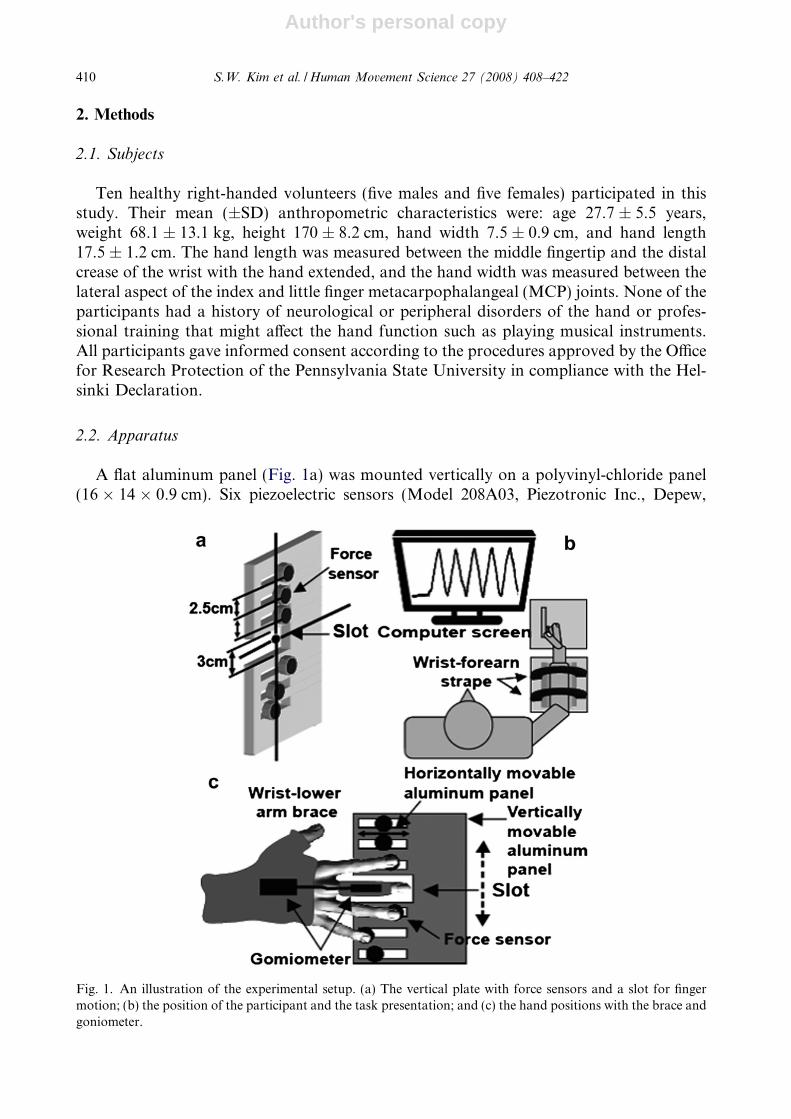
A flat aluminum panel (Fig. 1a) was mounted vertically on a polyvinyl-chloride panel(16 � 14 � 0.9 cm). Six piezoelectric sensors (Model 208A03, Piezotronic Inc., Depew,
Fig. 1. An illustration of the experimental setup. (a) The vertical plate with force sensors and a slot for fingermotion; (b) the position of the participant and the task presentation; and (c) the hand positions with the brace andgoniometer.
410 S.W. Kim et al. / Human Movement Science 27 (2008) 408–422
Author's personal copy
NY) were placed on the aluminum panel, oriented in the vertical direction with the dis-tance of 2.5 cm between the adjacent sensors. This distance was selected as comfortableand natural for the participants and compatible with the size of the force sensors. A slot(3 � 6 cm) was located between the 3-rd and 4-th sensors. The participant’s finger tipscould be comfortably placed on the sensors without making contact with each other.The aluminum panel with the sensors could be moved vertically in order to allow align-ment of the slot with different fingers such that three fingers of the hand were alwaysplaced on force sensors while the remaining finger could move through the slot. The sensorlocation could be adjusted in the horizontal direction to accommodate hands of differentsize. Cotton pads were attached on the upper surface of the sensors to increase friction andto prevent the effects of skin temperature on force measurement.
The participant’s lower arm was fixed in a forearm brace (Ebonite Inc, Daytona Beach,FL), and the wrist was locked in the hand brace (STAT, Powel, TN) both in flexion-exten-sion and ulnar-radial deviation. This prevented wrist joint rotation. Small customizedsplints (made of thin wooden sticks and Velcro straps) were used to restrict movementsat the interphalangeal joints of all the fingers; only MCP joint movement was allowed(See Procedure). A two-axis goniometer (SGw65, Biometrics Ltd., Ladysmith VA) wasused to record motion of the MCP joint of the finger positioned against the slot in theframe (the task finger).
A 1700 computer monitor was located about 0.8 m away from the participant; it wasused to display the tasks and provide visual feedback on the current MCP joint angleof the task finger. The signals from the goniometer were amplified using an amplifiermodel LS800 (Biometrics Ltd., Ladysmith, VA), while the signals from the force sensorswere amplified by AC/DC conditioners (M482M66, Piezotronics Inc., Depew, NY). Fur-ther, all the signals were digitized at 1000 Hz with a 16-bit A/D board (National instru-ments, Austin, TX). A Dell 450 MHz laptop computer and customized LabVIEW-based software (LabVIEW 6.1, National Instruments, Austin, TX) were used for data col-lection. MatLab programs (Mathworks, Natick, MA) were written for data processingand analyses.
2.3. Procedure
The participant sat on a chair facing the experimental setup. The wrist-forearm bracewas affixed to the testing table in front of the participant with a set of Velcro straps.The right upper arm was abducted approximately 45� in the frontal plane and flexed20� in the frontal plane; the elbow was at about 110� of flexion (Fig. 1b).
One rigid end of the goniometer was affixed onto the dorsal surface of the hand alongthe third metacarpal, using double-sided adhesive tape. The other end was attached at thelevel of the middle phalanx to the splint placed over the task finger. Before each trial, theparticipant was instructed to extend all the fingers with the thumb pointing upward. Thevertical position of the aluminum panel and the horizontal position of the sensors wereadjusted such that the task finger could move freely through the slot on the aluminumpanel while the non-task finger tips were placed on the sensors (Fig. 1c).
The participants were given a familiarization session to ensure that they were familiarwith the setup and able to perform the tasks. During the session they got a detaileddescription of the procedure and were allowed to perform a few trials (not recored). Dur-ing the experiment, the participant was instructed to perform cyclic flexion-extension
S.W. Kim et al. / Human Movement Science 27 (2008) 408–422 411
Author's personal copy
movements of the task finger through the slot. The MCP joint angle trajectory of the taskfinger was shown in real time on the screen, and the task was to match the MCP trajectorywith the ramp template shown on the same screen (Fig. 1b). The template consisted of asequence of straight lines leading from 0� (corresponding to the fully extended finger posi-tion) to 45� (flexion motion) and back from 45� to 0� (extension motion) over time-inter-vals that varied across trials. There were five 0�-to-45� lines and five 45�-to-0� lines, thelines alternated to form a cyclic task. We will use expressions ‘‘flexion segment” and‘‘extension segment” for the flexion and extension half-cycles of the movement.
Before each trial, all force signals were zeroed. Each trial started with the computer gen-erating a beep (get ready) and then a yellow cursor showing the current angular position ofthe MCP joint of the task finger started to move over the screen at a constant speed. Theparticipant was instructed to move the task finger and match the cursor line with the tem-plate as accurately as possible. The participants were instructed not to pay attention topossible force production by the other three fingers that rested on the sensors (non-taskfingers). This instruction was used to discourage participants from using extension effortsin non-task fingers (see also Li et al., 1998; Zatsiorsky et al., 1998, 2000).
There were four tasks corresponding to different task fingers, the index (I-Task), middle(M-Task), ring (R-Task), and little (L-Task) fingers, and seven durations of the flexion andextension segments forming the template, 3.0, 2.5, 2.0, 1.5, 1.0, 0.75, and 0.5 s. They cor-responded to movement periods of 6, 5, 4, 3, 2, 1.5, and 1 s. The duration of trials wasadjusted to include five successive complete cycles; it was 30, 25, 20, 15, 10, 7.5, and 5 s,respectively. Three complete cycles in the middle of the trial were always available andused for analysis to avoid possible effects of trial initiation and termination. Two trialswere performed for each condition with an 8-s interval between the trials. There were30-s intervals between conditions. The total of 56 trials were collected, two trials by fourtask fingers by seven periods. All participants were given two practice, warm-up trialsprior to each task. The tasks and periods were presented in a balanced order across theparticipants.
2.4. Data analysis
The force and angle data were digitally low-pass filtered with a second-order, zero-lagButterworth filter at 25 Hz.
The task finger trajectories and force profiles produced by the non-task fingers weremeasured over the three cycles in the middle of each trial. Individual flexion and extensionsegments of the three accepted cycles were aligned by the onsets of the corresponding seg-ment lines in the template (Fig. 2). Further, the data were averaged over ramp segmentsfor each task. The duration of each segment was further converted to 100% to allow com-parisons across different movement periods.
The root mean square deviation (RMS) of the angular joint trajectory from the tem-plate was used as an index of accuracy of the task performance. This index was computedseparately over the middle 80% of the flexion and extension segments to avoid possibleinconsistencies related to changes in the movement direction. RMS was computed overeach segment and then averaged over the six accepted segments.
The unintended force production by the non-task fingers during the movement of thetask finger (enslaving) was quantified using the following index:
412 S.W. Kim et al. / Human Movement Science 27 (2008) 408–422
Author's personal copy
Ei;j ¼DF i
Daj;
where DFi indicates a change in the force of a non-task finger i, and Daj is a change in theangular position of the task finger j (i,j = I – index, M – middle, R – ring, and L – little).Enslaving was quantified within three intervals of equal duration over the flexion andextension segments. The intervals covered the middle 80% of each segment duration. Theywill be referred to as FL1, FL2, and FL3 (for the flexion segment) and EX1, EX2, and EX3
(for the extension segment). The subscripts 1, 2, and 3 refer to the intervals 10–36%, 37–63%, and 64–90% of the corresponding segment duration. The enslaving indices (Ei,j) werealso quantified at the peak flexion position when finger flexion turned into extension(PEAK) as the ratio between the total force produced by an enslaved finger and movementamplitude of the task finger.
2.5. Statistics
The data are presented in the text as means and standard errors of the mean.ANOVAs with and without repeated-measures were run for the following characteris-
tics of performance: Accuracy of the task performance (RMS), non-task finger forces, andthe index of enslaving (E). For the RMS index, the factors were Direction (two levels: flex-ion and extension), Period (seven levels: 1, 1.5, 2, 3, 4, 5, and 6 s), and Task-Finger (fourlevels: Index, Middle, Ring, and Little). Analysis of non-task finger forces involved factorsFinger (typically three levels out of four: Index, Middle, Ring, and Little), Time-interval
(seven levels: FL1, FL2, FL3, PEAK, EX1, EX2, and EX3). Direction, and Period. Analysisof the index of enslaving E involved factors Direction, Finger, and Time-interval.
Appropriate pair-wise contrasts and post-hoc Tukey’s Honestly Significant Difference(HSD) tests were used for further analysis of significant effects of the ANOVAs. The levelof significance was set at p < 0.05.
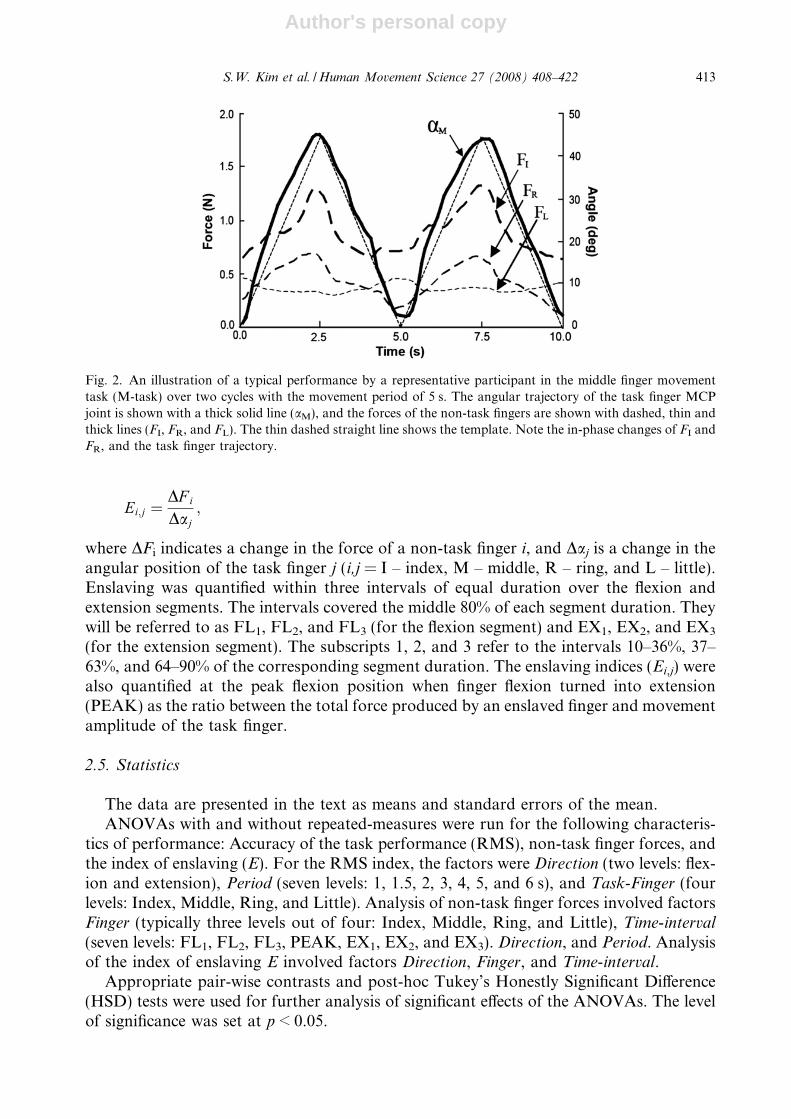
Fig. 2. An illustration of a typical performance by a representative participant in the middle finger movementtask (M-task) over two cycles with the movement period of 5 s. The angular trajectory of the task finger MCPjoint is shown with a thick solid line (aM), and the forces of the non-task fingers are shown with dashed, thin andthick lines (FI, FR, and FL). The thin dashed straight line shows the template. Note the in-phase changes of FI andFR, and the task finger trajectory.
S.W. Kim et al. / Human Movement Science 27 (2008) 408–422 413
Author's personal copy
3. Results
3.1. Movement and force patterns
Motion of the task finger led to force production by all the non-task fingers of the hand.Changes in the flexion force produced by the non-task fingers showed time profiles qual-itatively similar to the trajectory of the task finger. Fig. 2 shows time series of the kine-matic and kinetic variables in the M-Task performed by a representative participant.
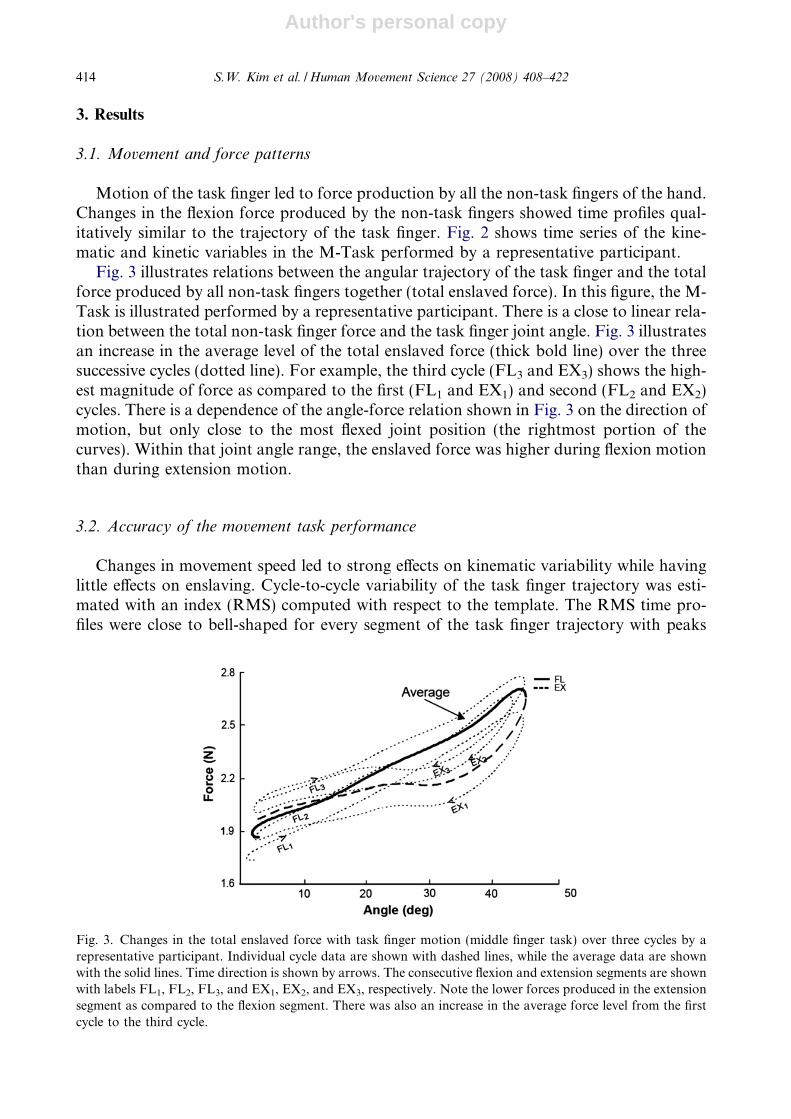
Fig. 3 illustrates relations between the angular trajectory of the task finger and the totalforce produced by all non-task fingers together (total enslaved force). In this figure, the M-Task is illustrated performed by a representative participant. There is a close to linear rela-tion between the total non-task finger force and the task finger joint angle. Fig. 3 illustratesan increase in the average level of the total enslaved force (thick bold line) over the threesuccessive cycles (dotted line). For example, the third cycle (FL3 and EX3) shows the high-est magnitude of force as compared to the first (FL1 and EX1) and second (FL2 and EX2)cycles. There is a dependence of the angle-force relation shown in Fig. 3 on the direction ofmotion, but only close to the most flexed joint position (the rightmost portion of thecurves). Within that joint angle range, the enslaved force was higher during flexion motionthan during extension motion.
3.2. Accuracy of the movement task performance
Changes in movement speed led to strong effects on kinematic variability while havinglittle effects on enslaving. Cycle-to-cycle variability of the task finger trajectory was esti-mated with an index (RMS) computed with respect to the template. The RMS time pro-files were close to bell-shaped for every segment of the task finger trajectory with peaks
Fig. 3. Changes in the total enslaved force with task finger motion (middle finger task) over three cycles by arepresentative participant. Individual cycle data are shown with dashed lines, while the average data are shownwith the solid lines. Time direction is shown by arrows. The consecutive flexion and extension segments are shownwith labels FL1, FL2, FL3, and EX1, EX2, and EX3, respectively. Note the lower forces produced in the extensionsegment as compared to the flexion segment. There was also an increase in the average force level from the firstcycle to the third cycle.
414 S.W. Kim et al. / Human Movement Science 27 (2008) 408–422
Author's personal copy
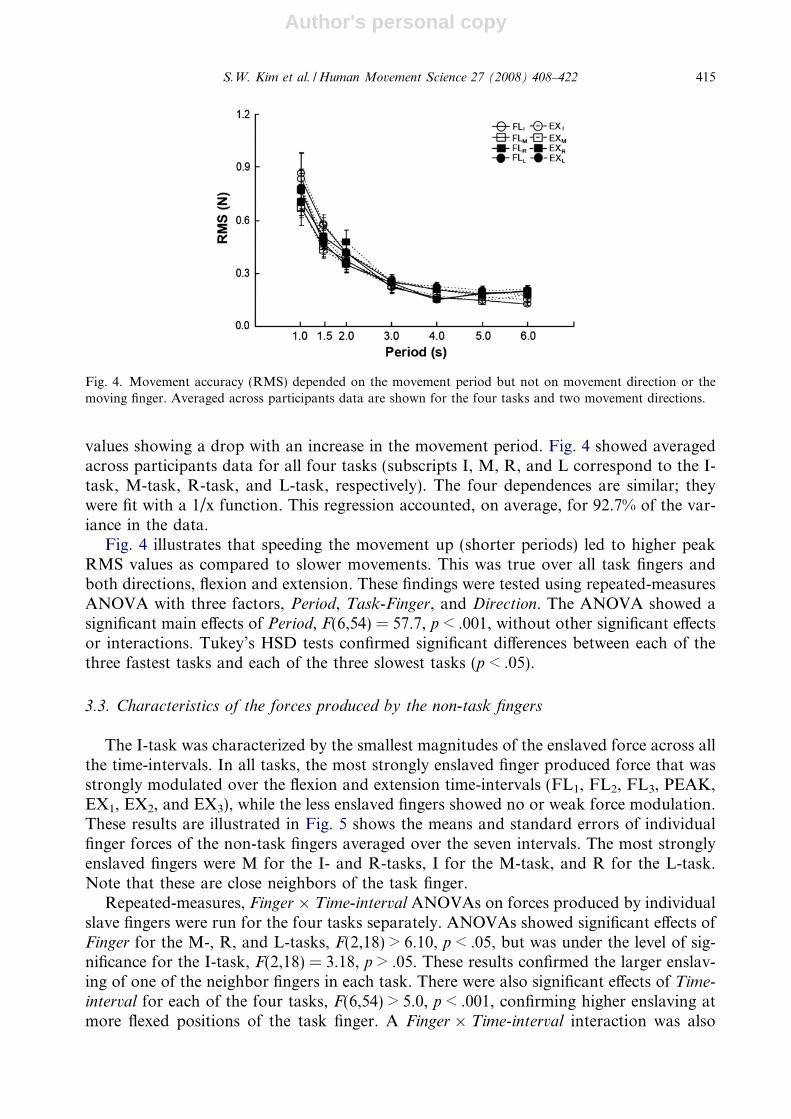
values showing a drop with an increase in the movement period. Fig. 4 showed averagedacross participants data for all four tasks (subscripts I, M, R, and L correspond to the I-task, M-task, R-task, and L-task, respectively). The four dependences are similar; theywere fit with a 1/x function. This regression accounted, on average, for 92.7% of the var-iance in the data.
Fig. 4 illustrates that speeding the movement up (shorter periods) led to higher peakRMS values as compared to slower movements. This was true over all task fingers andboth directions, flexion and extension. These findings were tested using repeated-measuresANOVA with three factors, Period, Task-Finger, and Direction. The ANOVA showed asignificant main effects of Period, F(6,54) = 57.7, p < .001, without other significant effectsor interactions. Tukey’s HSD tests confirmed significant differences between each of thethree fastest tasks and each of the three slowest tasks (p < .05).
3.3. Characteristics of the forces produced by the non-task fingers
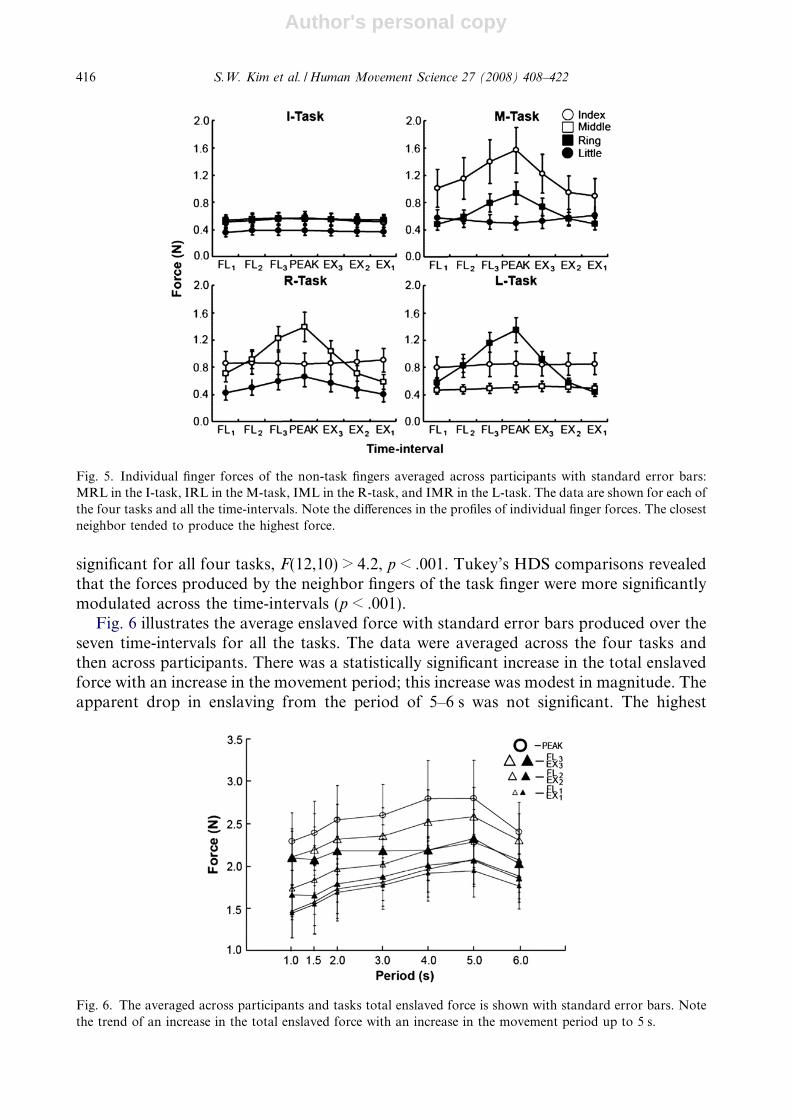
The I-task was characterized by the smallest magnitudes of the enslaved force across allthe time-intervals. In all tasks, the most strongly enslaved finger produced force that wasstrongly modulated over the flexion and extension time-intervals (FL1, FL2, FL3, PEAK,EX1, EX2, and EX3), while the less enslaved fingers showed no or weak force modulation.These results are illustrated in Fig. 5 shows the means and standard errors of individualfinger forces of the non-task fingers averaged over the seven intervals. The most stronglyenslaved fingers were M for the I- and R-tasks, I for the M-task, and R for the L-task.Note that these are close neighbors of the task finger.
Repeated-measures, Finger � Time-interval ANOVAs on forces produced by individualslave fingers were run for the four tasks separately. ANOVAs showed significant effects ofFinger for the M-, R, and L-tasks, F(2,18) > 6.10, p < .05, but was under the level of sig-nificance for the I-task, F(2,18) = 3.18, p > .05. These results confirmed the larger enslav-ing of one of the neighbor fingers in each task. There were also significant effects of Time-
interval for each of the four tasks, F(6,54) > 5.0, p < .001, confirming higher enslaving atmore flexed positions of the task finger. A Finger � Time-interval interaction was also
Fig. 4. Movement accuracy (RMS) depended on the movement period but not on movement direction or themoving finger. Averaged across participants data are shown for the four tasks and two movement directions.
S.W. Kim et al. / Human Movement Science 27 (2008) 408–422 415
Author's personal copy
significant for all four tasks, F(12,10) > 4.2, p < .001. Tukey’s HDS comparisons revealedthat the forces produced by the neighbor fingers of the task finger were more significantlymodulated across the time-intervals (p < .001).
Fig. 6 illustrates the average enslaved force with standard error bars produced over theseven time-intervals for all the tasks. The data were averaged across the four tasks andthen across participants. There was a statistically significant increase in the total enslavedforce with an increase in the movement period; this increase was modest in magnitude. Theapparent drop in enslaving from the period of 5–6 s was not significant. The highest
Fig. 5. Individual finger forces of the non-task fingers averaged across participants with standard error bars:MRL in the I-task, IRL in the M-task, IML in the R-task, and IMR in the L-task. The data are shown for each ofthe four tasks and all the time-intervals. Note the differences in the profiles of individual finger forces. The closestneighbor tended to produce the highest force.
Fig. 6. The averaged across participants and tasks total enslaved force is shown with standard error bars. Notethe trend of an increase in the total enslaved force with an increase in the movement period up to 5 s.
416 S.W. Kim et al. / Human Movement Science 27 (2008) 408–422
Author's personal copy
enslaved forces were observed at the most flexed task finger position (PEAK). There wasalso a trend for the enslaved forces to be higher during the flexion joint motion (FL) ascompared to the extension motion (EX).
These findings were tested using a three-way repeated-measure ANOVA with the fac-tors Period, Direction, and Time-interval. All three factors showed significant main effects,F(6,54) = 2.43, p < .05, F(1,9) = 19.85, p < .001, and F(2,18) = 17.0, p < .001, respectively.There were also significant two-way interactions Period � Direction, Period � Time-inter-
val, and Direction � Time-interval, F(6,54) = 6.7, p < .001, F(12,108) = 4.38, p < .001, andF(2,18) = 50.37, p < .001, respectively. Pair-wise Tukey’s comparisons confirmed higherenslaved forces for flexion movement as compared to extension movement, and higherenslaved forces at time-intervals corresponding to more flexed finger positions (FL3 andEX3) as compared to the other positions (FL2 and EX2; FL1 and EX1, p < .05 for allcomparisons).
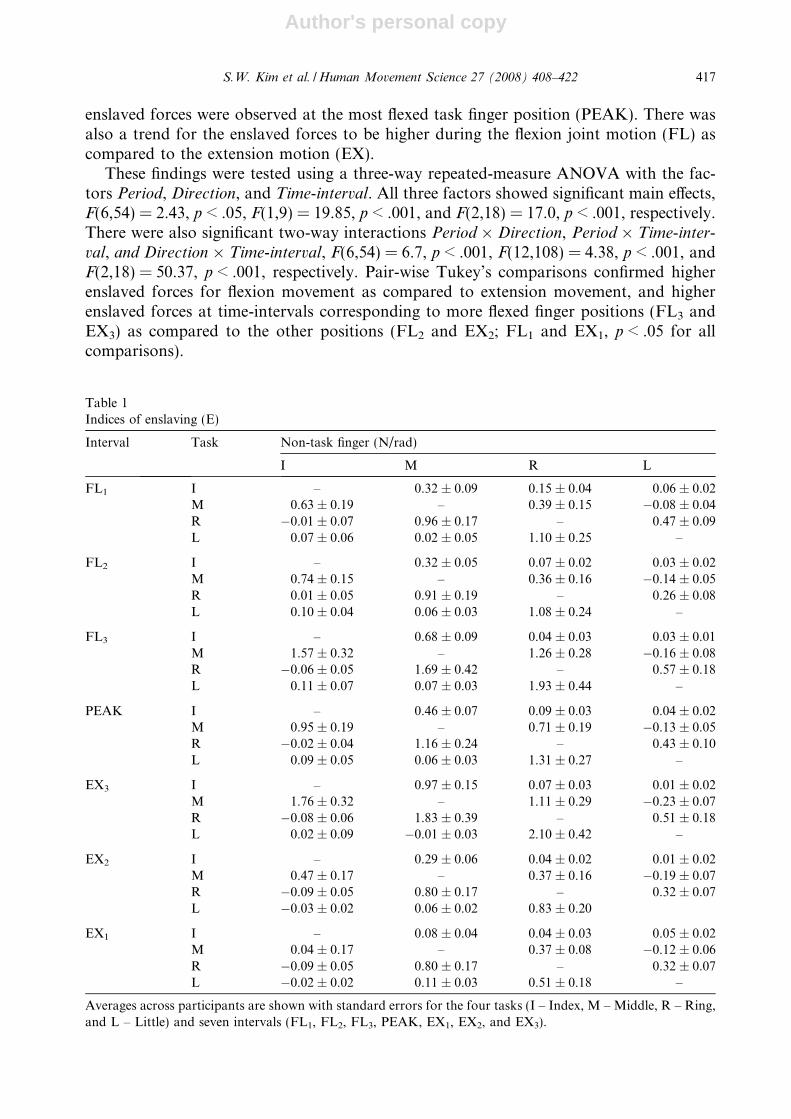
Table 1Indices of enslaving (E)
Interval Task Non-task finger (N/rad)
I M R L
FL1 I – 0.32 ± 0.09 0.15 ± 0.04 0.06 ± 0.02M 0.63 ± 0.19 – 0.39 ± 0.15 �0.08 ± 0.04R �0.01 ± 0.07 0.96 ± 0.17 – 0.47 ± 0.09L 0.07 ± 0.06 0.02 ± 0.05 1.10 ± 0.25 –
FL2 I – 0.32 ± 0.05 0.07 ± 0.02 0.03 ± 0.02M 0.74 ± 0.15 – 0.36 ± 0.16 �0.14 ± 0.05R 0.01 ± 0.05 0.91 ± 0.19 – 0.26 ± 0.08L 0.10 ± 0.04 0.06 ± 0.03 1.08 ± 0.24 –
FL3 I – 0.68 ± 0.09 0.04 ± 0.03 0.03 ± 0.01M 1.57 ± 0.32 – 1.26 ± 0.28 �0.16 ± 0.08R �0.06 ± 0.05 1.69 ± 0.42 – 0.57 ± 0.18L 0.11 ± 0.07 0.07 ± 0.03 1.93 ± 0.44 –
PEAK I – 0.46 ± 0.07 0.09 ± 0.03 0.04 ± 0.02M 0.95 ± 0.19 – 0.71 ± 0.19 �0.13 ± 0.05R �0.02 ± 0.04 1.16 ± 0.24 – 0.43 ± 0.10L 0.09 ± 0.05 0.06 ± 0.03 1.31 ± 0.27 –
EX3 I – 0.97 ± 0.15 0.07 ± 0.03 0.01 ± 0.02M 1.76 ± 0.32 – 1.11 ± 0.29 �0.23 ± 0.07R �0.08 ± 0.06 1.83 ± 0.39 – 0.51 ± 0.18L 0.02 ± 0.09 �0.01 ± 0.03 2.10 ± 0.42 –
EX2 I – 0.29 ± 0.06 0.04 ± 0.02 0.01 ± 0.02M 0.47 ± 0.17 – 0.37 ± 0.16 �0.19 ± 0.07R �0.09 ± 0.05 0.80 ± 0.17 – 0.32 ± 0.07L �0.03 ± 0.02 0.06 ± 0.02 0.83 ± 0.20
EX1 I – 0.08 ± 0.04 0.04 ± 0.03 0.05 ± 0.02M 0.04 ± 0.17 – 0.37 ± 0.08 �0.12 ± 0.06R �0.09 ± 0.05 0.80 ± 0.17 – 0.32 ± 0.07L �0.02 ± 0.02 0.11 ± 0.03 0.51 ± 0.18 –
Averages across participants are shown with standard errors for the four tasks (I – Index, M – Middle, R – Ring,and L – Little) and seven intervals (FL1, FL2, FL3, PEAK, EX1, EX2, and EX3).
S.W. Kim et al. / Human Movement Science 27 (2008) 408–422 417
Author's personal copy
3.4. Quantitative analysis of the enslaving
The average amount of enslaving across participants (E, in N/rad) is presented in Table1 for all fingers and across all tasks. The data are shown separately for the three intervalsduring the flexion motion, during the extension motion, and also at the most flexed posi-tion of the task finger (PEAK). Note that the E-index for the PEAK position was com-puted differently from other intervals and reflected ‘‘average enslaving” over the wholerange of motion. The I-task showed much weaker enslaving effects on other fingers overboth directions. For example, the average E for the M-, R-, and L-tasks was between 2and 3 times larger than for the I-task.
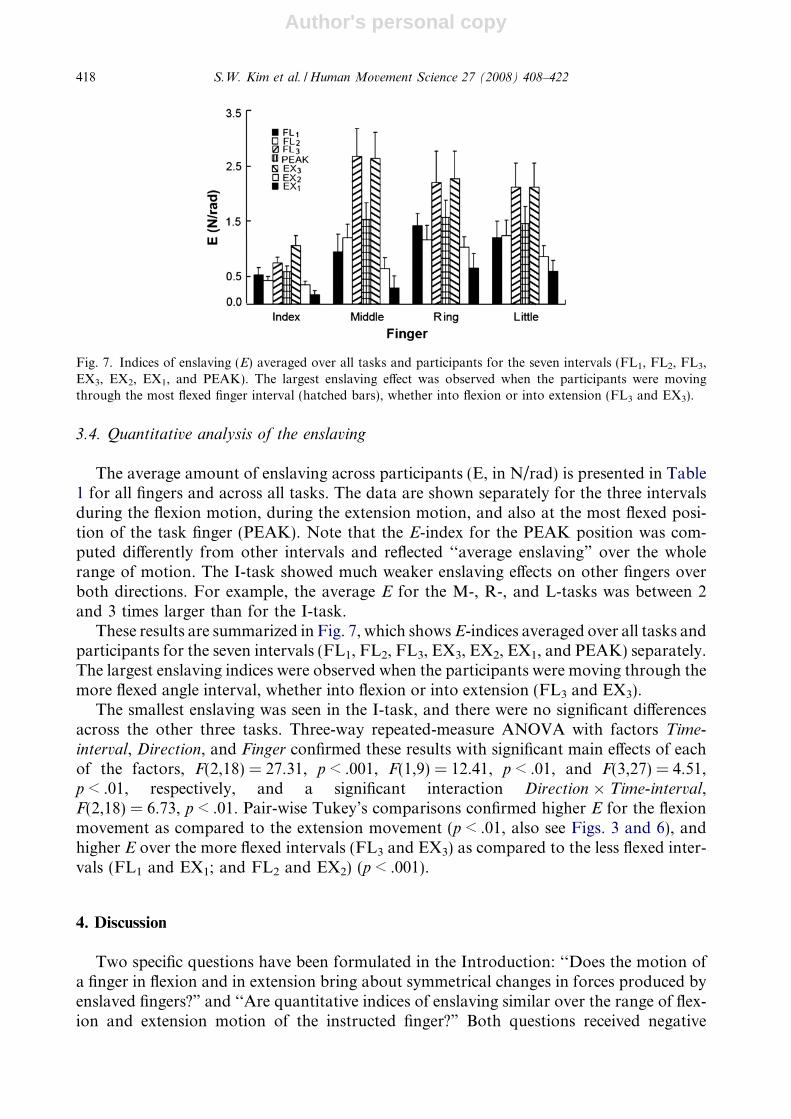
These results are summarized in Fig. 7, which shows E-indices averaged over all tasks andparticipants for the seven intervals (FL1, FL2, FL3, EX3, EX2, EX1, and PEAK) separately.The largest enslaving indices were observed when the participants were moving through themore flexed angle interval, whether into flexion or into extension (FL3 and EX3).
The smallest enslaving was seen in the I-task, and there were no significant differencesacross the other three tasks. Three-way repeated-measure ANOVA with factors Time-
interval, Direction, and Finger confirmed these results with significant main effects of eachof the factors, F(2,18) = 27.31, p < .001, F(1,9) = 12.41, p < .01, and F(3,27) = 4.51,p < .01, respectively, and a significant interaction Direction � Time-interval,F(2,18) = 6.73, p < .01. Pair-wise Tukey’s comparisons confirmed higher E for the flexionmovement as compared to the extension movement (p < .01, also see Figs. 3 and 6), andhigher E over the more flexed intervals (FL3 and EX3) as compared to the less flexed inter-vals (FL1 and EX1; and FL2 and EX2) (p < .001).
4. Discussion
Two specific questions have been formulated in the Introduction: ‘‘Does the motion ofa finger in flexion and in extension bring about symmetrical changes in forces produced byenslaved fingers?” and ‘‘Are quantitative indices of enslaving similar over the range of flex-ion and extension motion of the instructed finger?” Both questions received negative
Fig. 7. Indices of enslaving (E) averaged over all tasks and participants for the seven intervals (FL1, FL2, FL3,EX3, EX2, EX1, and PEAK). The largest enslaving effect was observed when the participants were movingthrough the most flexed finger interval (hatched bars), whether into flexion or into extension (FL3 and EX3).
418 S.W. Kim et al. / Human Movement Science 27 (2008) 408–422
Author's personal copy
answers in the experiments. In particular, enslaved forces were larger when the task fingermoved into flexion than when it moved into extension. These findings look opposite tothose reported recently in a study of isometric tasks in children (Shim et al., 2007). How-ever, note that the cited study by Shim and colleagues used maximal isometric force pro-duction into flexion and extension, while in our study the task finger never moved intoextension beyond the straight position (0�) and no maximal exertion was required.Another important finding is that the index of enslaving was not constant over the rangeof finger motion; it increased towards more flexed positions. These findings were con-firmed over a wide range of task finger speeds.
4.1. Central and peripheral mechanisms of finger inter-dependence
There have been arguments in favor of both peripheral and central (neural) origins ofthe lack of finger independence. The anatomical design of the extrinsic flexors and thepresence of passive connective tissue links between fingers have been invoked as peripheralfactors that potentially contribute to enslaving (Kilbreath & Gandevia, 1994; Leijnse et al.,1993). An important role of neural factors has been supported in experimental studies thatshowed substantial overlaps of finger projections in the primary motor cortex of primates(Schieber, 1991; Schieber & Hibbard, 1993), effects similar to enslaving observed in exper-iments with motor imagery (Li, Latash, & Zatsiorsky, 2004), studies of slow brain poten-tials (Slobounov, Johnston, Chiang, & Ray, 2002a, 2002b), and by neural networkmodeling works (Gao et al., 2003; Goodman, Latash, Li, & Zatsiorsky, 2003).
Some of the observations of our study are more compatible with a dominant role ofneural factors in enslaving. In particular, both muscle and connective tissues are knownto have viscoelastic properties. Such connections between the task finger and other fingers(Leijnse, 1997; Leijnse, Walbeehm, Sonneveld, Hovius, & Kauer, 1997) may be expected tolead to velocity-dependence of forces transmitted to the slave fingers. In our experiments,such dependence was not observed (Fig. 6). The indirect observation tentatively points atanother important factor that defines the magnitude of enslaving effects, likely a factor atthe level of neural signals to muscles and muscle compartments serving different fingers.
Data in Fig. 3 suggest a hysteresis-like effect. Such curves usually manifest viscousproperties of the system, which seem to contradict a conclusion drawn in the previous par-agraph that the system does not show viscous properties (see Zatsiorsky, 1997). However,this contradiction is seeming since Fig. 3 shows dependences between motion of one fingerand forces produced by the remaining fingers of the hand.
4.2. Differences among the fingers
In line with a number of earlier reports (Kinoshita et al., 1996; Lang & Schieber, 2004;Li et al., 1998; Zatsiorsky et al., 2000), action by the index finger was associated with thelowest indices of enslaving (Table 1 and Figs. 6 and 7). In addition, motion of this fingerwas associated with the smallest modulation of the enslaved force. This may be causallyrelated to the well documented better independent action of the index finger across a vari-ety of tasks (Hager-Ross & Schieber, 2000; Lang & Schieber, 2004; Reilly & Hammond,2000; Shinohara, Latash, & Zatsiorsky, 2003; Zatsiorsky et al., 2000).
The highest indices of enslaving were observed in the neighboring fingers corroboratingthe so-called proximity hypothesis (Zatsiorsky et al., 2000). According to this hypothesis,
S.W. Kim et al. / Human Movement Science 27 (2008) 408–422 419
Author's personal copy
the strongest lack of individuation is observed in immediate neighbors of a task finger. Wewould also like to note that in our experiments the immediate neighbors were much morelikely to show substantial modulation of the enslaved force over the range of motion of thetask finger.
Variations in the amount of enslaving across conditions apparently had no major effecton the ability of the participants to perform the explicit kinematic task accurately. At least,changes in the speed of movement were associated with substantial changes in the index ofkinematic accuracy (Fig. 4) while there were no comparable changes in enslaved forces(Fig. 6). In contrast, enslaving effects differed significantly across task fingers while theindex of kinematic variability did not (Figs. 4 and 5).
4.3. Implications for studies of multi-digit coordination
The results of this study have potential implication for studies of finger coordination. Inparticular, the phenomenon of enslaving has frequently been assumed to lead to positivecovariation among finger forces independently of the task. This assumption has beenbased on observations of close to linear changes in finger forces in one finger tasks duringboth maximal (Li et al., 1998) and submaximal force production (Latash et al., 2001). Thisassumption has led to analysis of finger coordination using a different set of variables, fin-ger modes that are assumed to be manipulated by the central nervous system indepen-dently of each other (Danion et al., 2003).
A number of studies used the method of uncontrolled manifold (UCM) analysis (Scholz& Schoner, 1999; reviewed in Latash et al., 2002) in the space of finger modes to discoverand quantify multi-finger synergies stabilizing such variables as the total force and thetotal moment of force (Scholz et al., 2002; Zhang, Zatsiorsky, & Latash, 2006). This anal-ysis assumes that the controller organizes in the space of finger modes subspaces (UCMs)corresponding to desired magnitudes of potentially important performance variables andthen allows relatively large variability across trials to these subspaces while restricting var-iability orthogonal to these subspaces.
Our current results cast doubt on the assumption that finger modes corresponding tolinear dependences among finger forces can indeed be used over a range of dynamic tasks,i.e., the tasks involving not only force production but also finger movements, since enslav-ing seems to be both range and direction of motion dependent. Interaction among the fin-gers seems to be much more complex and less linear (Goodman, Latash, & Zatsiorsky,2004) than it has been commonly assumed. In particular, some of the differences describedfor indices of multi-finger synergies during flexion force increase and decrease (Shim,Olafsdottir, Zatsiorsky, & Latash, 2005) as well as over different force ranges (Shim, Park,Zatsiorsky, & Latash, 2006) may be due to the differences in the enslaving effects demon-strated in the current study. Studies of multi-digit synergies involving fast movements andforce production should consider the complex relations between indices of finger inter-dependence and action characteristics.
Acknowledgement
This study was supported in part by NIH Grants AG-018751, AR-048563, and NS-35032.
420 S.W. Kim et al. / Human Movement Science 27 (2008) 408–422
Author's personal copy
References
Danion, F., Schoner, G., Latash, M. L., Li, S., Scholz, J. P., & Zatsiorsky, V. M. (2003). A force mode hypothesisfor finger interaction during multi-finger force production tasks. Biological Cybernetics, 88, 91–98.
Gao, F., Li, S., Li, Z. M., Latash, M. L., & Zatsiorsky, V. M. (2003). Matrix analyses of interaction amongfingers in static force production tasks. Biological Cybernetics, 89, 407–414.
Goodman, S. R., Latash, M. L., Li, S., & Zatsiorsky, V. M. (2003). Analysis of a network for finger interactionduring two-hand multi-finger force production tasks. Journal of Applied Biomechanics, 19, 295–309.
Goodman, S. R., Latash, M. L., & Zatsiorsky, V. M. (2004). Indices of non-linearity in finger force interaction.Biological Cybernetics, 90, 264–271.
Hager-Ross, C., & Schieber, M. H. (2000). Quantifying the independence of human finger movement:Comparisons of digits, hands, and movement frequencies. Journal of Neuroscience, 22, 8542–8550.
Kilbreath, S. L., & Gandevia, S. C. (1994). Limited independent flexion of the thumb and fingers in humansubjects. Journal of Physiology, 479, 487–497.
Kinoshita, H., Murase, T., & Bandou, T. (1996). Grip posture and forces during holding cylindrical objects withcircular grips. Ergonomics, 39, 1163–1176.
Lang, C. E., & Schieber, M. H. (2003). Reduced muscle selectivity during individuated finger movements inhumans after damage to the motor cortex or corticospinal tract. Jounal of Neurophysiology, 91, 1722–1733.
Lang, C. E., & Schieber, M. H. (2004). Human finger independence: limitations due to passive mechanicalcoupling versus active neuromuscular control. Jounal of Neurophysiology, 92, 2802–2810.
Latash, M. L., Li, S., Danion, F., & Zatsiorsky, V. M. (2002). Central mechanisms of finger interaction duringone- and two-hand force production at distal and proximal phalanges. Brain Research, 924, 198–208.
Latash, M. L., Scholz, J. F., Danion, F., & Schoner, G. (2001). Structure of motor variability in marginallyredundant multi-finger force production tasks. Experimental Brain Research, 141, 153–165.
Latash, M. L., Scholz, J. F., Danion, F., & Schoner, G. (2002). Finger coordination during discrete andoscillatory force production tasks. Experimental Brain Research, 146, 419–432.
Latash, M. L., Scholz, J. P., & Schoner, G. (2002). Motor control strategies revealed in the structure of motorvariability. Exercise and Sport Science Reviews, 30, 26–31.
Latash, M. L., Scholz, J. P., & Schoner, G. (2007). Toward a new theory of motor synergies. Motor Control, 11,275–307.
Leijnse, J. N. (1997). Measuring anatomic connections in the deep flexor of the musician’s hand: Theoreticalanalysis, clinical examples. Journal of Biomechanics, 30, 873–882.
Leijnse, J. N., Snijders, C. J., Bonte, J. E., Landsmeer, J. M., Kalker, J. J., van der Meulen, J. C., et al. (1993). Thehand of the musician: The kinematics of the bidigital finger system with anatomical restrictions. Journal of
Biomechanics, 10, 1169–1179.Leijnse, J. N., Walbeehm, E. T., Sonneveld, G. J., Hovius, S. E., & Kauer, J. M. (1997). Connections between the
tendons of the musculus flexor digitorum profundus involving the synovial sheaths in the carpal tunnel. Acta
Anatomica (Basel), 160, 112–122.Li, Z. M., Dun, S., Harkness, D. A., & Brininger, T. L. (2004). Motion enslaving among multiple fingers of
human hand. Motor Control, 8, 1–15.Li, Z. M., Latash, M. L., & Zatsiorsky, V. M. (1998). Force sharing among finger as a model of the redundancy
problem. Experimental Brain Research, 119, 276–286.Li, S., Latash, M. L., & Zatsiorsky, V. M. (2004). Effects of motor imagery on finger force responses to
transcranial magnetic stimulation. Cognitive Brain Research, 20, 273–280.Reilly, K. T., & Hammond, G. R. (2000). Independence of force production by digits of the human hand.
Neuroscience Letters, 290, 53–56.Schieber, M. H. (1991). Individuated finger movements of rhesus monkeys: A means of quantifying the
independence of the digits. Jounal of Neurophysiology, 65, 1381–1391.Schieber, M. H. (1999). Somatotopic gradients in the distributed organization of the human primary motor
cortex hand area: Evidence from small infarcts. Experimental Brain Research, 128, 139–148.Schieber, M. H., & Hibbard, L. S. (1993). How somatotopic is the motor cortex hand area? Science, 261, 489–492.Schieber, M. H., & Santello, M. (2004). Hand function: Peripheral and central constraints on performance.
Journal of Applied Physiology, 96, 2293–2300.Scholz, J. P., Danion, F., Latash, M. L., & Schoner, G. (2002). Understanding finger coordination through
analysis of the structure of force variability. Biological Cybernetics, 86, 29–39.
S.W. Kim et al. / Human Movement Science 27 (2008) 408–422 421
Author's personal copy
Scholz, J. P., & Schoner, G. (1999). The uncontrolled manifold concept: Identifying control variables for afunctional task. Experimental Brain Research, 126, 289–306.
Shim, J. K., Oliveira, M. A., Hsu, J., Huang, J., Park, J., & Clark, J. E. (2007). Hand digit control in children:Age-related changes in hand digit force interactions during maximum flexion and extension force productiontasks. Experimental Brain Research, 176, 374–386.
Shim, J. K., Olafsdottir, H., Zatsiorsky, V. M., & Latash, M. L. (2005). The emergence and disappearance ofmulti-digit synergies during force production tasks. Experimental Brain Research, 164, 260–270.
Shim, J. K., Park, J., Zatsiorsky, V. M., & Latash, M. L. (2006). Adjustments of prehension synergies in responseto self-triggered and experimenter-triggered load and torque perturbations. Experimental Brain Research, 175,641–653.
Shinohara, M., Latash, M. L., & Zatsiorsky, V. M. (2003). Age effects on force production by the intrinsic andextrinsic hand muscles and finger interaction during maximal contraction tasks. Journal of Applie Physiology,
95, 1361–1369.Slobounov, S., Johnston, J., Chiang, H., & Ray, W. J. (2002a). Motor-related cortical potentials accompanying
enslaving effect in single versus combination of fingers force production tasks. Clinical Neurophysiology, 113,1444–1453.
Slobounov, S., Johnston, J., Chiang, H., & Ray, W. J. (2002b). The role of submaximal force production in theenslaving phenomenon. Brain Research, 954, 212–219.
Zatsiorsky, V. M. (1997). On muscle and joint viscosity. Motor Control, 1, 299–309.Zatsiorsky, V. M., Li, Z. M., & Latash, M. L. (1998). Coordinated force production in multi-finger tasks: Finger
interaction and neural network modeling. Biological Cybernetics, 79, 139–150.Zatsiorsky, V. M., Li, Z. M., & Latash, M. L. (2000). Enslaving effects in multi-finger force production.
Experimental Brain Research, 131, 187–195.Zhang, W., Zatsiorsky, V. M., & Latash, M. L. (2006). Accurate production of time-varying patterns of the
moment of force in multi-finger tasks. Experimental Brain Research, 175, 68–82.
422 S.W. Kim et al. / Human Movement Science 27 (2008) 408–422