finding misplaced items in retail by clustering rfid...
TRANSCRIPT
Finding Misplaced Items in Retail by Clustering RFID Data
Leonardo Weiss Ferreira ChavesSAP Research CEC Karlsruhe
Vincenz-Prießnitz-Str. 176131 Karlsruhe, Germany
Erik Buchmann, Klemens BöhmUniversität Karlsruhe (TH)
Am Fasanengarten 576131 Karlsruhe, Germany
{buchmann|boehm}@ipd.uka.de
ABSTRACTIn retail, products are organized according to layout plans,so-called planograms. Compliance to planograms is impor-tant, since good product placement can significantly increasesales. Currently, retailers are about to implement RFIDinstallations consisting of smart shelves and RFID-taggeditems to support in-store logistics and processes. In princi-ple, they can also use these installations to implement plan-ogram compliance verification: Each antenna is supposedto detect all tagged items in one location of the planogram.But due to physical constraints, RFID tags can be identifiedby more than one RFID antenna. Thus, one cannot decideif an item carrying such a tag complies with the planogram.We propose a new method called RPCV which checks plan-ogram compliance on large databases of items. It is based onthe observation that the number of times an antenna iden-tifies each item of a certain product type roughly follows anormal distribution. RPCV represents each item as a two-dimensional vector containing the number of readings bothby the right antenna and by wrong ones according to theplanogram. It clusters this data, separately for each prod-uct type. A cluster then is a set of correctly placed itemsor of misplaced ones. RPCV produces one order of mag-nitude less wrong predictions than current state of the art,and it requires less data to yield good predictions. A studywith RFID-equipped goods and smart shelves shows thatour approach is effective in realistic scenarios.
Categories and Subject DescriptorsH.2.8 [Database Management]: Database Applications;H.3.3 [Information Search and Retrieval]: Clustering
General TermsAlgorithms, Experimentation, Performance, Reliability
KeywordsRFID, Planogram Compliance, Data Quality, Data Cleaning
Permission to make digital or hard copies of all or part of this work forpersonal or classroom use is granted without fee provided that copies arenot made or distributed for profit or commercial advantage and that copiesbear this notice and the full citation on the first page. To copy otherwise, torepublish, to post on servers or to redistribute to lists, requires prior specificpermission and/or a fee.EDBT 2010, March 22–26, 2010, Lausanne, Switzerland.Copyright 2010 ACM 978-1-60558-945-9/10/0003 ...$10.00
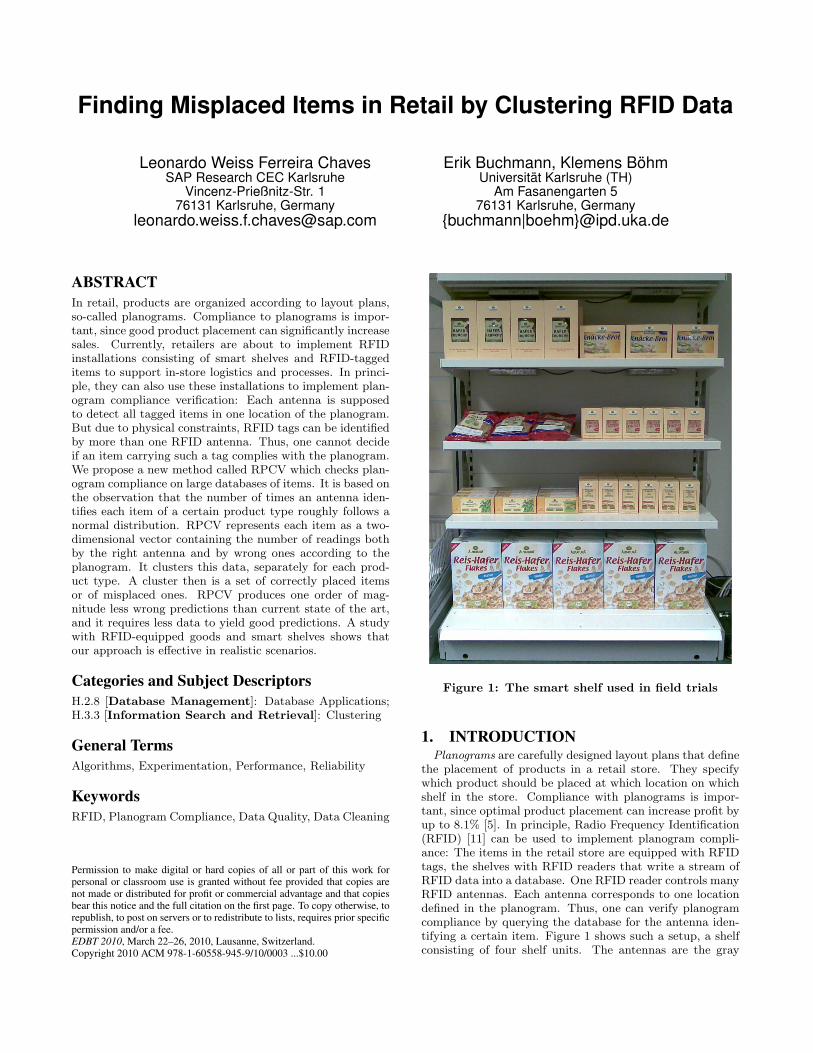
Figure 1: The smart shelf used in field trials
1. INTRODUCTIONPlanograms are carefully designed layout plans that define
the placement of products in a retail store. They specifywhich product should be placed at which location on whichshelf in the store. Compliance with planograms is impor-tant, since optimal product placement can increase profit byup to 8.1% [5]. In principle, Radio Frequency Identification(RFID) [11] can be used to implement planogram compli-ance: The items in the retail store are equipped with RFIDtags, the shelves with RFID readers that write a stream ofRFID data into a database. One RFID reader controls manyRFID antennas. Each antenna corresponds to one locationdefined in the planogram. Thus, one can verify planogramcompliance by querying the database for the antenna iden-tifying a certain item. Figure 1 shows such a setup, a shelfconsisting of four shelf units. The antennas are the gray

0
200
400
600
800
1000
1200
1400
1600
1800
Items of product types A to E
Num
ber o
f rea
ding
s in
one
day Readings by wrong RFID antenna
Readings by right RFID antenna
A B C D E
Figure 2: RFID data from field trials
boxes mounted on the bottom side of the shelf units. Eachshelf unit has two antennas, i.e., the planogram can differ-entiate between the right and the left side of each shelf unit.
To ensure that all RFID tags are identified, retailers typi-cally install many RFID antennas close to each other, result-ing in dense RFID deployments with many RFID antennasnear to each other. In such installations, RFID tags are fre-quently detected by more than one antenna. In this case,the system cannot decide where on a shelf a certain itemis located. Furthermore, an RFID reader does not knowthe reading field of an RFID antenna, i.e., the area whereit can detect RFID tags. This happens because objects inthe vicinity of the antenna can reflect or absorb magneticwaves. These waves might cancel each other out, creatingblind spots, or be superimposed and thus reach farther thanexpected [12]. This makes the integration of RFID data intobusiness processes difficult, because reliable data is a prereq-uisite for many processes, like data mining of customer datato improve planograms, etc.
In this paper, we present the RFID Planogram Com-pliance Verification (RPCV) algorithm to check planogramcompliance on large databases of RFID data. Our algorithmis motivated by the outcomes of field trials at a large Germanretailer. Figure 2 shows data of five product types collectedduring these field trials, which is representative. Each barrepresents one item. Because the planogram of this fieldtrial (not shown here) specifies a different number of itemsto be displayed on the shelf for each product type, the fig-ure shows different numbers of items/bars for each producttype. Subsequently, we refer to the antenna that should beidentifying an item according to the planogram as the rightantenna, to the other ones, e.g., antennas from neighboringlocations, as wrong antennas. The dark gray bars show thenumber of times the right RFID antenna identifies an item.The corresponding light gray bar shows the stacked numberof times an item was identified by wrong RFID antennas.For our approach, it is now important that a normal dis-tribution describes quite accurately the number of times anantenna identifies each item of a certain product type. I.e.,if x is ’the number of times the antenna identified an item’,and f(x) is ’the number of items identified x times’, thenf(x) ∼ N(µ, σ2). We have observed this effect in the fieldtrials. It occurs because items of the same product type
have roughly the same physical characteristics. We refer tothe distribution of readings by the right antenna and theone by wrong antennas as the reading pattern of the producttype. The data shows why it is difficult to decide which lo-cation an item is placed on: Although none of the items wasmisplaced or moved during the particular trial where we col-lected this data, each item was identified by wrong antennasat least once. Various items were identified more often bythe wrong antennas than by the right antenna (Product A).Furthermore, the number of times an item is identified dur-ing a certain time interval varies a lot (e.g., Product D),because RFID antennas usually have “blind spots” whereRFID tags cannot be easily identified. Thus, it is difficultto implement planogram compliance using RFID. Currentsolutions [15, 25] rely on filters, e.g., they assign each itemto the antenna that has identified it more often. However,as Product A shows, these approaches may produce manywrong predictions with databases of real RFID readings.
RPCV defines a sliding window over the continuous datastreams of the RFID reader, i.e., it considers the items iden-tified in a given time interval. For each item, our methodcounts the numbers of readings in the sliding window. RPCVrepresents each item as a two-dimensional vector, where thefirst dimension is the count of the readings by the right an-tenna. The other dimension is the number of readings bywrong antennas. It then clusters this data, separately foreach product type. The clusters will correspond to correctlyplaced items or to misplaced ones.
In general, the reading patterns of different product typeswill be different. This is because several parameters influ-ence the reading pattern, e.g., the total number of items readby an RFID antenna and the proportion of misplaced items.In order to analyze our algorithm, we have carried out an ex-tensive evaluation with a real installation (i.e., RFID-taggeditems, smart shelves). To comply with the state of the artregarding user experiments/experiments with customer in-teractions, we let persons not involved in the design of ouralgorithm carry out the interactions. Our evaluation showsthat RPCV is fast, scales up to large databases of items andRFID readings, returns one order of magnitude less wrongpredictions and requires less data than current state of theart to produce good predictions.
Summing up, this paper makes the following contribu-tions:
• We describe typical problems when implementing plan-ogram compliance in retail, and we show how theseproblems can in principle be solved using RFID.
• We propose a new method called RPCV to determine ifitems identified by more than one RFID antenna com-ply with the planogram. RPCV transforms the dataso that one can apply a clustering algorithm to decideon the location of RFID tags. To our knowledge, weare first to look at this problem as a case for clustering.
• Having implemented RPCV as a Java extension of aMaxDB database, we evaluate it by experiments withan RFID installation. Furthermore, we validate RPCVagainst various worst-case scenarios and perform scal-ability tests with artificial data sets of up to 10,000,000RFID readings to confirm the efficiency of our method.
Paper outline: The next section describes our retail sce-nario and says how RFID can optimize planogram compli-

ance. Section 3 covers related work, and Section 4 presentsour approach. We evaluate it in Section 5.
2. APPLICATION SCENARIOIn this section we describe the setting for planogram com-
pliance in retail, which we use to motivate our work andto evaluate our method. With RFID-equipped items andsmart shelves that track the items present in real time, a re-tailer can run applications like planogram compliance, i.e.,ensuring that the placement of items in a retail store followsa specific layout plan. The potential is huge, since fast andaccurate planogram compliance can increase profit by up to8.1% [5]. E.g., applying such an increase to Walmart wouldyield 1.1 billion US$ more profit.Planograms: A planogram specifies the location of prod-ucts on a shelf unit. For each product type, it states theminimum number of items needed, e.g., ’The first row hasto be filled.’ It also specifies the arrangement of brands oneach shelf, e.g., first all items of Brand A, then the onesof Brand B, as well as the arrangement of products, e.g.,first Product 1 of Brand A, then the next one of this brandetc. In this paper, we restrict our attention to planogramsspecifying the number of items of a certain type per loca-tion. Planograms are important, because they improve thevisual effect and the space productivity. They also opti-mize shelf space usage and reduce out-of-stocks. Attractivelayouts increase impulse purchases, e.g., by placing comple-mentary products like pasta and tomato sauce next to eachother. Furthermore, customers tend to only buy items thatare placed on the expected location, e.g., a customer wouldprobably not buy a single package of pasta placed in-betweencleaning materials.Planogram Compliance: Planogram compliance is dif-ficult to ensure. This is because planograms are complexand change frequently, because of new marketing campaignsor because of seasonal products. Frequently changing plan-ograms make non-compliance difficult to detect. Anotherreason why this detection may be difficult are shelf unitsfilled with items of other product types. For example, if 6items have to be replenished, but 10 items are packaged inone box, a clerk might be inclined to put the remaining 4items just anywhere on the shelf.RFID Characteristics: RFID can be used to check plan-ogram compliance. One RFID reader controls many RFIDantennas (1:n relationship), i.e., the reader knows which an-tennas are identifying which items. We can check if a smartshelf holds the right items and if they are correctly placed onthe shelf. However, in dense RFID deployments with manyRFID antennas near to each other, many RFID antennascan identify the same item, and they frequently do. Thisoccurs because of physical interference. In other words, theproblem is a general one, and future RFID technology willnot be able to avoid this effect. Thus, a system cannot de-cide on the location of such tags. Note that, from a datamanagement perspective, there is no difference if an itemis identified by antennas from the same RFID reader, orby antennas from different readers. In the context of plan-ogram compliance, the following characteristics of RFID areimportant:
C1: Varying number of readings Because of physical in-terference, and because of items being sold and replen-ished, there is a broad variation in the number of times
Antenna
Antenna
Antenna
Antenna
RFID Reader 1
Database
RPCVERP
Antenna
Antenna
Antenna
Antenna
RFID Reader n
…Figure 3: Sketch of components in our scenario
items are identified within a certain time interval [26].
C2: Unpredictable reading field Because of physical ef-fects like absorption and reflection, we cannot predictthe reading field of an RFID antenna, i.e., the areawhere an antenna can identify RFID tags.
C3: Distinctive reading patterns The set of items of aproduct type follows a certain distribution. A normaldistribution describes the number of readings of itemsof a certain type by the right RFID antenna well. Thesame holds for the number of readings by wrong an-tennas (cf. Figure 2).
C4: Large data volume RFID applications in retail arecharacterized by large numbers of items. This resultsin huge databases and might challenge the runtimeperformance of an estimator.
Planogram Compliance with RFID: We study the fol-lowing general scenario:
• A retailer sells many items of different product types.All items are tagged with unique RFID labels.
• All shelves in the store are equipped with RFID read-ers, e.g., smart shelves [9]. Each RFID antenna is as-signed to one location in the planogram, cf. Figure 3.
• Clerks replenish the shelves if they go empty, and theyre-arrange items when planogram compliance is notgiven, or when the planogram changes.
Architecture of RPCV: Figure 3 is an overview of thecomponents described in this scenario. RPCV is imple-mented as a database extension. I.e., one can query whichitems comply with the planogram in SQL using a database

procedure that implements RPCV. This makes integrationinto business applications easy, since one can adapt existingdatabase queries to support RPCV without difficulty. Ex-amples of business applications which might interact withRPCV are Enterprise Resource Planning (ERP) systems andMerchandise Information Systems (MIS).
3. RELATED WORKWhile planogram compliance is well known to promote
sales [1, 5], there is relatively little research on planogramcompliance in smart shelves. Decker et al. [9] seem to befirst using RFID for planogram compliance. In order toidentify the correct location of an RFID tag on the shelf,their approach requires multiple RFID antennas per item,i.e., each smart shelf has many more antennas than items.Since there are millions of items in large retail stores, theapproach is infeasible from an economic perspective. Thedatabase community has developed a number of approachesto predict the location of RFID tags identified by more thanone RFID antenna, which we will discuss in the following.Rule-based filters: Solutions from this category proposefiltering data inside of a sliding window based on rules [2,3, 7, 8, 13, 15, 20, 25], which can be directly applied to anRFID data stream or after the RFID data has been per-sisted. Examples of rules used are assigning the item to thefirst antenna which has identified it [2, 20], to the last an-tenna [25], i.e., assuming the most recent data is correct,and assigning the item to the antenna with the most read-ings [13, 15]. In the following, we call these methods FIRST,LAST and MOST, respectively. The methods are fast, butthey can generate many wrong predictions, e.g., if we appliedthe method MOST to the data of Product A in Figure 2,three of the five items would be incorrectly classified as be-ing misplaced, because wrong antennas identify these itemsmore often than the right antenna. Since several commercialsolutions implement such rules, e.g., IBM [20], SAP [7], andSiemens [2, 25], we will compare their accuracy and theirperformance to our method in Section 5.Probabilistic filters: Methods based on probabilistic fil-tering are proposed in [14, 17, 18, 29]. These methods as-sign a certain probability of an RFID reading being correctto each reading, depending on predefined constraints and onstatistical data. Examples of predefined constraints are thatan item cannot be located on two shelves at the same time,and each shelf only stores a certain number of items. Sta-tistical data consists of the probabilities of certain events,which are devised from history data or from samples gath-ered manually, like the probability that RFID fields of twoRFID antennas overlap. However, such data is often specificto the position of the shelves in the store and to the itemsplaced in each shelf. This is because objects in the vicinityof the RFID reader might reflect or absorb magnetic waves,and because items of different product types and shelveswith different layouts have different physical characteristics.Since RFID installations might be very large, and layoutsof shelves in retail change very frequently, it is often notpractical to take samples to compute such statistical data.Thus, it is difficult to indeed deploy such methods in retailscenarios. Note that such methods could profit from RPCV,since our method could provide new statistical data as in-put. It could provide the probability that a specific item ismisplaced or correctly placed, based on the reading patternof its product type.
Particle filters: [21, 22, 27] use particle filters to infer thelocation of RFID tags. Particle filters represent a probabilitydistribution of events through generated samples (particles).The samples are updated over time and are used to computeestimations. Such methods yield good results when RFIDtags (or RFID readers) are in movement. This is becausesamples are updated when an RFID tag moves past severalRFID antennas. In the retail scenario, duplicate readingsare not caused by moving items, but by overlapping RFIDreading fields. An item that is frequently identified by awrong RFID antenna nearby would generate many particlesat the wrong location. The particle filter would yield badresults.Other methods: [23, 24] have studied algorithms opti-mized for RFID tags in movement. Different algorithms arepresented that assign an RFID tag to a certain location afterit has been identified many times or by more than one RFIDantenna along the supply chain. Again, we think that thesemethods do not apply to our scenario. [6] proposes attach-ing several RFID tags to each item in different orientations.In such a setup, there is a very high probability that at leastone RFID tag does not lie inside a ”blind spot”. Therefore,the variation in the number of readings (cf. Characteris-tic C1) might be small. But this does not help verifyingplanogram compliance, since an item with many RFID tagswill be identified by the same number of antennas or evenmore than an item with only one tag.
Summing up, only the methods FIRST, LAST and MOSTcan be directly used to verify planogram compliance. There-fore, we will compare RPCV to these methods in Section 5.
4. RPCV ALGORITHMWe now present RPCV, a method to determine which
RFID tags identified by more than one RFID antenna com-ply with the planogram. RPCV is fast, scalable, and itreturns one order of magnitude less wrong predictions thanrelated work. Furthermore, it requires less data than cur-rent state of the art to produce good predictions, i.e., thesize of the sliding window needed until a certain accuracy isreached is small.
RPCV is motivated by the following observation from thefield trials: The number of times an antenna identifies theitems of a certain product type roughly follows a normaldistribution (cf. RFID characteristic C3). In a nutshell,RPCV works as follows: It first counts the number of read-ings per RFID antenna for each item. As observed in thefield trials, RFID readers identify item sets at different rates(cf. RFID characteristic C1), thus the number of readingsper item may vary broadly. To reduce this variation, RPCVapplies a low-pass filter. After that, it applies a clusteringalgorithm to all items of a certain product type. Each itemis represented by a vector consisting of the number of read-ings by the right RFID antenna and the number of readingsby wrong antennas. RPCV then decides for each cluster ifit is misplaced.
Note that RPCV can be easily extended to support prod-uct types placed on more than one location, e.g., by model-ing them as different logical product types, or by consideringa set of right antennas instead of just one.
4.1 RPCV Algorithm in DetailTo describe RPCV in more detail, we mention that it re-
quires two data structures:

• RfidReads: a multiset with tuples (i, ant) of itemsi and the RFID antennas ant identifying these itemswithin a pre-determined time interval (sliding window).
• Planogram: a map whose keys are product types t,and the value corresponding to t is the RFID antennaant that should be identifying items of type t.
The sliding window determines the body of RFID dataavailable to RPCV. The scenario determines the size of thesliding window, i.e., by means of the time intervals a retailerrearranges misplaced items, and how often the RFID readersare polled. We analyze the effect of the sliding window onthe quality and on the runtime of RPCV in Section 5.
1: input RfidReads, P lanogram2: MisplacedItems = {}3: for all (productType t ∈ Planogram.getKeys()) do4: P = {}5: ant = Planogram.get(t)6: for all (item i in RfidReads) do7: if (item i is of type t) then8: readsR = |{(i, a) ∈ RfidReads : a = ant}|9: readsW = |{(i, a) ∈ RfidReads : a 6= ant}|
10: P = P ∪ {(i, readsR, readsW )}11: end if12: end for13: P ∗ = all pairs (readsR, readsW ) in P14: P ∗ = lowpassF ilter(P ∗)15: {P1, P2} = Cluster(P ∗, 2)16: for all (cluster Pj) do17: if avg(Pj .readsW ) > avg(Pj .readsR) then18: insert the elements of P corresponding to the vec-
tors contained in Pj into MisplacedItems19: end if20: end for21: end for22: output MisplacedItems
Algorithm 1: RPCV Algorithm
Algorithm 1 describes RPCV. It iterates through all prod-uct types (Line 3). First, it determines the RFID antennaant that should be identifying each product type accordingto Planogram (Line 5). For each item, RPCV counts thenumber of readings by the right antenna (readsR) and thenumber of readings by other (wrong) antennas (readsW )and adds this two-dimensional vector to a set P correspond-ing to type t (Lines 6-10). In Line 13, RPCV removes at-tribute i from P , since it is not used for clustering. RPCVthen applies a low-pass filter to reduce the variation of theremaining values readsR and readsW (Line 14). Now itapplies a clustering algorithm to the values readsR andreadsW of each item, to create two clusters P1 and P2 foreach product type (Line 15). We will explain later why thenumber of clusters to be identified is two. The first argu-ment of function Cluster in Line 15 is the set of vectors to beclustered, the second argument is the number of clusters tobe returned. Then RPCV decides if a cluster represents mis-placed items. It does so by checking if on average the clusterwas identified more often by wrong antennas (Lines 16-20).After RPCV has iterated through all product types, it re-turns the set of misplaced items. The choice of the clusteringalgorithm and the low-pass filter are explained in the follow-ing subsections.
1 3 4
Antenna A Antenna B
2
y
5
x
6
Figure 4: Example scenario
Example 1 introduces a simple scenario for planogramcompliance. We will use this scenario in subsequent ex-amples to illustrate RPCV and to illustrate the clusteringalgorithm and the low-pass filter.
Example 1: Figure 4 shows two RFID antennas and itemsof two different product types, located in a 2D-space. Theproduct types are represented as circles and squares. Thegray area in the figure shows the reading field of Antenna A.We now want to decide if the Items 1 to 6, which are ofproduct type circle, comply with the planogram. Supposethat the planogram requires these items to be placed underAntenna B. Item 1 is identified very often by Antenna A.Item 2 is identified often both by Antennas A and B, andItems 3 to 6 are identified very often by Antenna B.
4.2 Clustering: Expectation MaximizationItems of the same product type have similar physical char-
acteristics, i.e., they tend to affect the magnetic waves of theRFID reader in a similar way. Thus, items of the same typemight be read at wrong locations in the shelf with a similarprobability. RPCV takes advantage of this by incorporat-ing a clustering algorithm. It is applied to the value pairsreadsR and readsW of each item.
In a set of preliminary experiments, we have evaluated dif-ferent clustering algorithms [28]. We have integrated theseclustering algorithms into RPCV and have counted the num-ber of false predictions with the data from the field trials.Our results were as follows: density based clustering (11%wrong predictions), farthest first traversal algorithm (10%wrong predictions), k-means (9% wrong predictions), andExpectation Maximization (1% wrong predictions). In otherwords, the Expectation Maximization (EM) algorithm [10]provides the best results for our use-case.
1: input tuples {(x, y)}, number of clusters k2: {P1..., Pk} = initClusters({(x, y)}, k)3: {θ1..., θk} = initDistributions({P1, ...Pk})4: while (clusters change) ∧ (# of iterations < limit) do5: for all (cluster Pj) do6: Ej = estimateExpectedV alues(Pj , θj) // E-Step7: θj = estimateParameters(Pj , Ej) // M-Step8: Pj = updateCluster(Pj , θj)9: end for
10: end while11: output {P1, ..., Pk}
Algorithm 2: EM Algorithm
In the next section we experiment with setups where RPCVworks well, and setups where it does not. To understand theexperiments well, one should know how the EM algorithm

0
2
4
6
0 5 10 15 20 25 30
Number of readings by (right) Antenna B
Num
ber o
f occ
urre
nces Distribution of readings
Distrib. of correctly placed clusterDistribution of misplaced cluster
Figure 5: Distribution of raw readings
works. This is why we list it in Algorithm 2. The EM algo-rithm tries to fit k probability distributions to each dimen-sion of the input data. The result will be k clusters, andone probability distribution in each dimension describes acluster. Thus, since RPCV has two-dimensional input data,two probability distributions will represent one cluster. Thealgorithm starts with an initial set of clusters on the two-dimensional data {(x, y)} (Line 2), which is gained by run-ning a few iterations of the k-means algorithm. The EMalgorithm estimates the parameters of the distributions ofthe initial clusters (Line 3) and improves them iteratively(Lines 4-10). It iterates until the clusters do not changeany more, or until a limit of 100 iterations is reached. 100iterations are in line with best practices described in liter-ature [28]. For each cluster and in each iteration, it firstcomputes the expected values of the log likelihood with re-spect to the current distributions (Expectation-Step, Line 6)and then updates the parameters of the distributions usingthe expected values computed in the E-step (Maximization-Step, Line 7). At the end, the algorithm outputs k clusters.As the probability distribution we use the normal one. Itcorrectly models the RFID data, and it can be computedfast, since a closed form of the estimators exists [10]. Exam-ple 2 illustrates how RPCV uses the clustering algorithm.
Example 2: In this example, which continues Example 1,we look at the readings by Antenna B. Within the slidingwindow, Antenna B identifies each item with the followingfrequency: Item 1: 0 times, Item 2: 9 times, Items 3 to5: 16 times, Item 6: 25 times. First, RPCV will groupthese items by the number of readings, shown in Figure 5.The bars show the number of occurrences of each numberof readings. The figure also shows the two normal dis-tributions that the EM algorithm fits to the data. Eachcurve represents one cluster. RPCV decides if a clusterrepresents misplaced items by checking if on average theitems in the cluster were identified more often by wrongantennas. Each bar is assigned to the most likely normaldistribution, i.e., to the curve with the highest value at thex-position of the bar. The bars with the frequencies 0 and9 belong to one cluster, which turns out to be a cluster ofmisplaced items. The other two bars belong to the othercluster, which turns out to be a cluster of correctly placeditems.
Internally, the EM algorithm uses probabilities to expressthe membership of items in clusters. In our scenario, this
fuzzy boundary yields better results than fixed member-ships: During the iterations of the clustering algorithm,there is a higher chance that the assignment of items toa certain cluster changes, thus reducing the chance of theclustering algorithm getting stuck at local optima. For in-stance, consider Figure 5 in Example 2: The item which wasidentified 9 times has a high likelihood of belonging to themisplaced cluster and a low likelihood of belonging to theother one.
As mentioned, we configure the EM algorithm to find twoclusters, because there are two kinds of items we want toseparate: correctly placed and misplaced items. We haveexperimented with different numbers of clusters, and twoclusters have lead to the best results. Looking at the rawRFID readings, there are items that are definitely correctlyplaced or misplaced, and there are items whose actual loca-tion is difficult to predict, e.g., because two antennas identifythe item very often. With more than two clusters, each ofthese items might form its own cluster. Then we cannotdecide on the location of these ”difficult” items. With twoclusters, we likely force the EM algorithm to assign suchitems either to the cluster of correctly placed items or to theone of misplaced items. Note that, in general, both clusterscan represent correctly placed or misplaced items, e.g., ifnone of the items in the cluster or all of them are misplaced.To cope with such situations, RPCV decides if a cluster rep-resents misplaced items by checking if on average the clusterwas identified more often by wrong antennas.
4.3 Low-Pass FilterEven though the number of times an antenna identifies
the items of a certain product type roughly follows a nor-mal distribution, the absolute numbers of RFID readings ofindividual items might differ a lot. This occurs due to blindspots, due to customers buying items, and due to items be-ing replenished (cf. RFID characteristic C1). This poses aproblem to clustering algorithms: As we have observed inthe field trials, there are items that are identified only oncein a certain time period, while others are identified hundredsof times.
To overcome this problem, RPCV applies a low-pass fil-ter to the RFID data. Low-pass filters let numbers withsmall values pass through, and they reduce the value of largenumbers. A low-pass filter for our scenario must fulfill thefollowing requirements: (1) It must significantly reduce thevariation of the numbers of readings, and (2) it must sup-port a large number of items (cf. Characteristic C4). Be-cause of (2), only simple filters are applicable in our scenario.Many mathematical functions can be computed quickly andfulfill Requirement (1). As a first step, we have identifiedsuch functions, e.g., roots, logarithms, and sigmoid func-tions. Next, in another set of preliminary experiments, wehave evaluated these functions with different parameters andhave applied them to the data from the field trials, in com-bination with the clustering algorithm. We did obtain thebest results using the square root as a filter, since it has pro-duced the smallest number of false predictions. The squareroot will reduce large values by much, i.e., from items witha large number of readings. Further, it imposes little changeon small values, thus reducing the variation of the numberof readings. We show function lowpassF ilter in Equation 1.
lowpassF ilter({(x, y)}) = {(√x,√y)} (1)

0
2
4
6
8
10
0 1 2 3 4 5 6
Square root of # of readings by Antenna B
Num
ber o
f occ
urre
nces
Distribution of readings
Distrib. of correctly placed cluster
Distribution of misplaced cluster
Figure 6: Distribution of filtered readings
Example 3 illustrates the low-pass filter. It shows the im-pact of the filter on the clusters determined by the EM al-gorithm.
Example 3: In Figure 5 there is a big difference betweenthe number of readings for each item, and the bars havea similar distance to each other in the x-direction. TheEM algorithm has problems correctly classifying such data,and the column at frequency 9 (Item 2) is incorrectly as-signed to the cluster of misplaced items. Figure 6 showsthe results when we apply a low-pass filter to the numberof readings. Now the data is distributed over a smaller in-terval, and large values lie closer to each other. The EMalgorithm classifies the filtered data correctly.
5. EVALUATIONIn this section we evaluate RPCV. We want to (1) provide
an intuition of how RPCV works, (2) show that the accuracyof RPCV is better than the one of related work, (3) showthat RPCV requires less data to produce good predictions,(4) identify scenarios where RPCV does not function well,and (5) show that RPCV is fast when predicting with alarge number of items and a large number of RFID readings.We compare RPCV with the methods FIRST, LAST andMOST, since they are the only methods from related workthat can be directly used to verify planogram compliance.These methods assign each item to the first RFID antennaidentifying an item, to the last one, and to the one with themost readings, respectively.
We have implemented our method as an extension of SQLin the SAP MaxDB database management system. We ranall experiments on a desktop PC (Windows, 2GB RAM,2GHz dual core CPU, 1 SATA hard disk). We used the de-fault configuration of MaxDB [4] and Java (version 1.6.0 12)for the performance experiments.
5.1 Experimental SetupWe evaluate our approach with the scenario described in
Section 2. We have used real-world data obtained from thesmart shelf shown in Figure 1, and we also experiment with
synthetic data.
Real-World DataWe have equipped a retail shelf with two RFID readers (In-termec IF5). The shelf comes from a large German retailerand is identical to the one used in their stores. Its dimen-sions are 166cm x 110cm x 65cm. The shelf consists of fourshelf units, and each shelf unit contains two RFID anten-nas, c.f. Figure 1. The shelf contains items belonging to5 different product types. For this experimental setup, weidentify the product type whose location prediction is mostdifficult. This is the product type with the worst readingpattern, i.e., the right RFID antennas cannot always iden-tify items of this product type, and antennas from nearbylocations often generate readings of these items.
On average, a retailer has between 8 and 13 items of eachproduct type on one shelf [19]. For our experiments, wechoose a challenging scenario with many more items thanaverage. We used 30 items of the product type with theworst reading patterns, and we did experiments in threekinds of scenarios that occur in a retail store:
1. Static scenario: We arrange the items on the shelf indifferent ways, with misplaced items ranging between0% and 50%. After the items were rearranged, we startrecording the RFID data.
2. Sales scenario: We arrange the items on the shelfin the same fashion as in the static scenario. After westarted recording the RFID data, different items whichwere not misplaced are removed from the shelf one byone.
3. Replenishment scenario: The experimental setupis the same as in the sales scenario, but after all itemswere removed, the shelf is replenished with new items.
In the static scenario there are no customer interactionslike sales or replenishment. To ensure that we do not biasthe customer interactions in the other two scenarios, we haveasked a person unfamiliar with RPCV to remove and re-plenish items. This is in line with state-of-the-art user ex-periments, i.e., the individuals who have designed the ex-periment must not be part of it. The two scenarios withcustomer interactions are challenging: In the sales scenario,some items identified by the right antenna will have a largevariation in the number of readings. In the replenishmentscenario, all correctly placed items are replaced.
We poll the RFID readers three times per minute for 10minutes. One polling corresponds to one RFID reading cy-cle. Thus, our sliding window consists of 30 reading cycles.Our smart shelf produced 34,851 RFID readings. In total,we have predicted the location of items 299 times.
Synthetic DataWe also experiment with synthetic data. This allows usto independently vary each parameter that might influenceRPCV, to repeat tests more often, and to test extreme pa-rameter values.
There are many uncertain parameters influencing the num-ber of RFID readings, and we cannot determine the num-ber of readings analytically. Therefore we generate differentRFID reading patterns by means of a simulation. Our sim-ulation is based on Monte Carlo Methods [16], and it works

0
10
20
30
40
50
60
0 10 20 30 40 50 60
Number of readings by right antenna
Num
ber o
f rea
ding
s by
wro
ng a
nten
nas Actually Misplaced Items
Correctly Placed Items
Figure 7: Replenishment scenario, 25% misplaced
as follows: We simulate a reading by each antenna in a timeinterval, and we do so repeatedly: For each time interval, wedecide with a fixed probability p if the right antenna identi-fies an item, and with a fixed probability q if a nearby an-tenna does so. If an antenna identifies an item, we determinethe number of times the item was identified by drawing anumber from a normal distribution N(µ = 0.50;σ2 = 0.25),multiplying it with 100 and converting it to an integer. Thissimulation is fast, and it creates data very similar to the datafrom the experiments with the smart shelf.
Based on observations from the real-world data, we sim-ulate three kinds of RFID reading patterns: (1) correctlyplaced items that are frequently identified by the right an-tenna and rarely by wrong antennas, (2) correctly placeditems that are frequently identified by the right and bywrong antennas, and (3) misplaced items that are frequentlyidentified by wrong antennas and rarely by the right an-tenna. Note that our simulation draws the number of read-ings from a probability distribution, therefore reading pat-tern (2) will also contain correctly placed items which areidentified more often by wrong antennas than by the rightone.
5.2 Evaluation with Real-World Data
IntuitionIn order to provide an intuition regarding RPCV, we haveconducted an experiment with real data where 25% of allitems are misplaced. Figure 7 shows the results. The x-axisshows the number of RFID readings by the right RFID an-tenna, and the y-axis the number of RFID readings by wrongRFID antennas. The dark gray circles represent items cor-rectly placed, and light gray circles represent actually mis-placed items. The size of the circles represents the numberof items at that position in the figure, e.g., the light gray cir-cle most to the right represents one item, and the light graycircle most to the left represents two items. Items above thediagonal were identified more often by wrong antennas thanby the right one. For instance, the light gray circle that ismost to the right represents one item that was identified 24times by the right antenna and 36 times by wrong ones.
Table 1: AccuracyMethod Precision Recall F1 scoreRPCV 98.2% 96.4% 97.3%MOST 63.4% 100.0% 77.8%FIRST 56.0% 100.0% 71.8%LAST 38.5% 92.9% 54.5%
The items identified by the right antenna show a smallnumber of RFID readings, on average around 12 readings,because of constantly changing items resulting from salesand replenishment. The misplaced items are identified veryoften, since they are not sold. On average they are identifiedaround 44 times at their actual location.
RPCV identifies one cluster of misplaced items. Items inthis cluster have an average of around 44 readings by wrongantennas, and around 8 readings by the right antenna. Fur-ther, RPCV identifies one cluster of correctly placed itemsthat show less than one reading by wrong antennas on av-erage, and around 12 readings by the right antenna.
In this experiment, the data is clearly segregated, andRPCV produces no wrong prediction. MOST in turn hasdifficulties in this experiment: 8 correctly placed items wereidentified equally or more often by wrong antennas. Thus,MOST results in 8 wrong predictions. The methods FIRSTand LAST will produce 8 and 3 wrong predictions, respec-tively.
Accuracy with Real-World DataIn this set of experiments we compare the accuracy of RPCVto the one of related work on the data gathered with ourreal-world installation.
We measure accuracy with the commonly used measuresprecision, recall and the F1 score. They are calculated us-ing the number of true positives (TP), false positives (FP)and false negatives (FN). True positives are misplaced itemspredicted as such, false positives are correctly placed itemswith incorrect prediction, and false negatives are misplaceditems, but the prediction is that the placement is correct.Precision is defined as TP
TP+FP, recall is defined as TP
TP+FN.
The F1 score is defined as 2·precision·recallprecision+recall
.Table 1 lists the accuracies. From 299 predictions, RPCV
was wrong in only 3 cases. We will further examine thesewrong predictions in the next set of experiments. This re-sults in an F1 score of 97%. The next best related work– method MOST – produces 32 wrong predictions, i.e., anF1 score of 78%. Thus, our method produces one order ofmagnitude less wrong predictions than other approaches.
Incorrect Predictions with Real-World DataNow we want to identify the situations when RPCV doesnot perform well with real-world data. Figure 8 shows oneexperiment from the static scenario, where 50% of the itemsare misplaced. Predictions with data from this experimentare difficult, since three correctly placed items (shown intwo circles) were frequently identified by wrong antennas.Therefore, in the figure these two items are very close to theitems actually misplaced. When applying our algorithm, onecorrectly placed item is predicted to be misplaced (false pos-itive). In the figure, a dashed rectangle encloses this item.MOST, by the way, will produce two false positives as wellin this specific setting. Figure 9 shows an experiment from

0
5
10
15
20
25
30
0 5 10 15 20 25 30
Number of readings by right antenna
Num
ber o
f rea
ding
s by
wro
ng a
nten
nas Actually Misplaced Items
Correctly Placed Items
Figure 8: Static scenario, 50% misplaced
the sales scenario, where 50% of the items are misplaced.In this experiment, RPCV produces two false negatives. Adashed rectangle encloses both items in the figure. MOSTwill produce two false positives in this setting.
The wrong predictions in both scenarios have to do withthe way the EM algorithm works. It tries to fit two nor-mal distributions to each dimension of the input data, andone distribution of each dimension will represent one cluster.We illustrate this with the distribution of readings by wrongantennas, shown in Figure 10. The x-axis shows the num-ber of readings by wrong antennas, and the y-axis shows therespective number of occurrences. The bars show the distri-bution of readings of the RFID data, i.e., the bar most tothe right is equivalent to the biggest circle on the top left ofFigure 9. Each curve shows the normal distribution for onecluster. RPCV obtains these curves by fitting two normaldistributions to the data in the figure. The EM algorithmassigns each item with a certain number of readings to themost likely normal distribution, i.e., each bar is assignedto the curve with the highest value directly above the bar.Note that the curves are skewed because RPCV fits themto the square root of the data, because of the low-pass fil-ter. A dashed rectangle encloses the two wrong predictionsfrom Figure 9. The normal distribution of the cluster ofmisplaced items has a higher mean value of the number ofreadings by wrong antennas than the other normal distri-bution. It has a very high mean value and a very smallstandard deviation. The two wrong predictions do not lieunder this curve. The EM algorithm chooses the distribu-tions with the highest likelihood, and this results in wrongpredictions.
We only encountered this kind of problem in the exper-iments described in this section. Furthermore, we did notfind a correlation between this problem and the position ofthe item on the shelf. In other words, this effect seems tooccur very rarely. Nevertheless, we plan to explore the issuefurther in future work, e.g., by combining the results of theEM algorithm with clustering algorithms that do not showthis behavior.
0
5
10
15
20
25
30
0 5 10 15 20 25 30
Number of readings by right antenna
Num
ber o
f rea
ding
s by
wro
ng a
nten
nas Actually Misplaced Items
Correctly Placed Items
Figure 9: Sales scenario, 50% misplaced
0
2
4
6
8
10
0 5 10 15 20 25 30
Number of readings by wrong antennas
Num
ber o
f occ
urre
nces
Distribution of readings
Distrib. of correctly placed cluster
Distribution of misplaced cluster
Figure 10: Distribution of readings by wrong an-tenna
5.3 Evaluation with Synthetic DataWe now want to study the influence of the various param-
eters of RPCV. We do so by means of simulations. They letus vary parameters independently, repeat tests more often,and test extreme parameter values. In particular, we varythe number of RFID readings, the total number of items,the number of items for each kind of reading pattern, andthe probabilities of items being identified by the right RFIDantenna and by wrong ones.
Size of Sliding WindowIn this set of experiments, we want to analyze the effect ofthe size of the sliding window on the accuracies of RPCV andof related work. We set the parameters of our simulation tomimic characteristics of the real-world data, as studied be-fore. We simulate the static scenario with 30 items, withhalf of the items correctly placed and identified very oftenby the right antenna, one fourth of the items correctly placed

50%
60%
70%
80%
90%
100%
0 20 40 60 80 100
Size of sliding window with RFID data
F 1 sc
ore
RPCV MOST LAST FIRST
Figure 11: F1 scores for different sizes of the slidingwindow
and identified very often by the right and by wrong anten-nas, and with one fourth of the items being misplaced andidentified very often by wrong antennas. We compute pre-dictions after the first RFID reading cycle, after the secondone etc. until reaching 100 cycles. We compare the values ofthe F1 scores.
We expect the F1 score to be constant with methodsFIRST and LAST, since we are simulating a static scenario.The F1 score of RPCV and of MOST should stabilize, be-cause the share of readings by each antenna should becomemore stable as more RFID data is gathered.
We show the average results of 1,000 experiments in Fig-ure 11. As expected, the F1 score of FIRST and LAST isconstant. The F1 score of RPCV and of MOST increasesslightly with the size of the sliding window. The F1 scoreswith a sliding window of 30 are identical to the ones of ourreal-world experiments. They are similar to the F1 scoresshown in Table 1. The dotted area in the figure plots thestandard deviation of RPCV. After 18 reading cycles, theaverage result of our method plus the standard deviationis still better than the second best method. The standarddeviations of the other methods are not plotted for betterreadability. The standard deviation of MOST is nearly con-stant at 7 percentage points. The one of FIRST is constantaround 11 percentage points, the one of LAST is constantat around 6 percentage points.
These experiments show that RPCV produces good re-sults with a small sliding window, and that the predictionaccuracy, i.e., the F1 score, quickly reaches 100%. Thus, ourmethod is applicable in scenarios that need to track plan-ogram compliance in small time intervals.
Total Number of Items PresentWe now want to find out how the total number of itemspresent influences our prediction, and if there is a minimumnumber of RFID items that has to be present for RPCV towork.
Our simulations have the same parameters as before. Re-call that a retailer has between 8 and 13 items of each prod-uct type on a shelf on average. We vary the total number of
0%
3%
6%
9%
12%
15%
0 200 400 600 800 1000
Total number of items
Ave
rage
stan
dard
dev
iato
n of
F1
scor
e
RPCV MOST LAST FIRST
Figure 12: Standard deviation vs. number of items
items present between 4 and 1,000. A shelf in retail holdsless than 1,000 items – this number is a worst case. For eachnumber of items we run 1,000 tests for each sliding windowsize from 1 to 100 reading cycles.
We expect the average results of RPCV to be independentfrom the total number of items, and we expect the standarddeviation to increase as the total number of items decreases,since RPCV will have less data to carry out its predictions.
Our expectation holds: The average results of RPCV donot vary with the total number of items. To analyze thestandard deviation, we calculate the average deviation of alltests for each total number of items. The results are shownin Figure 12. The average standard deviation lies around15% with 4 items, and it decreases as the total number ofitems increases. The average standard deviation of RPCVis lower than the ones of the related approaches. Since theaverage results of RPCV do not vary with the total numberof items, it is applicable for product types with very fewitems.
Worst-Case: Proportion of Misplaced Items and Prob-abilities of Items Being IdentifiedIn this set of experiments we vary the number of items foreach kind of reading pattern while keeping the total numberof items constant (100). Further, we vary the probabilities ofitems being identified by each RFID antenna independently,i.e., we vary the values of p and q between 0 and 1. Wewant to find the setting which is most challenging for ouralgorithm.
When varying the number of items for each reading pat-tern we found the worst results when the number of itemsidentified frequently by the right antenna and by wrong onesis very high. The overall probabilities of items being iden-tified have little impact on the average quality of RPCV,but they will increase the standard deviation. Reducing theoverall probabilities will result in less data, similarly to ex-periments with a smaller sliding window.
Next, we vary the probabilities from different RFID an-tennas independently, i.e., p and q. We found that the mainfactor influencing RPCV is the difference between the proba-bilities of items being identified by each antenna. The results
0 20 40 60 80 100
0%
50%
100%
0%10%20%30%40%50%60%70%80%90%
100%F 1
scor
e
Number of difficult items / Probability q of wrong reading
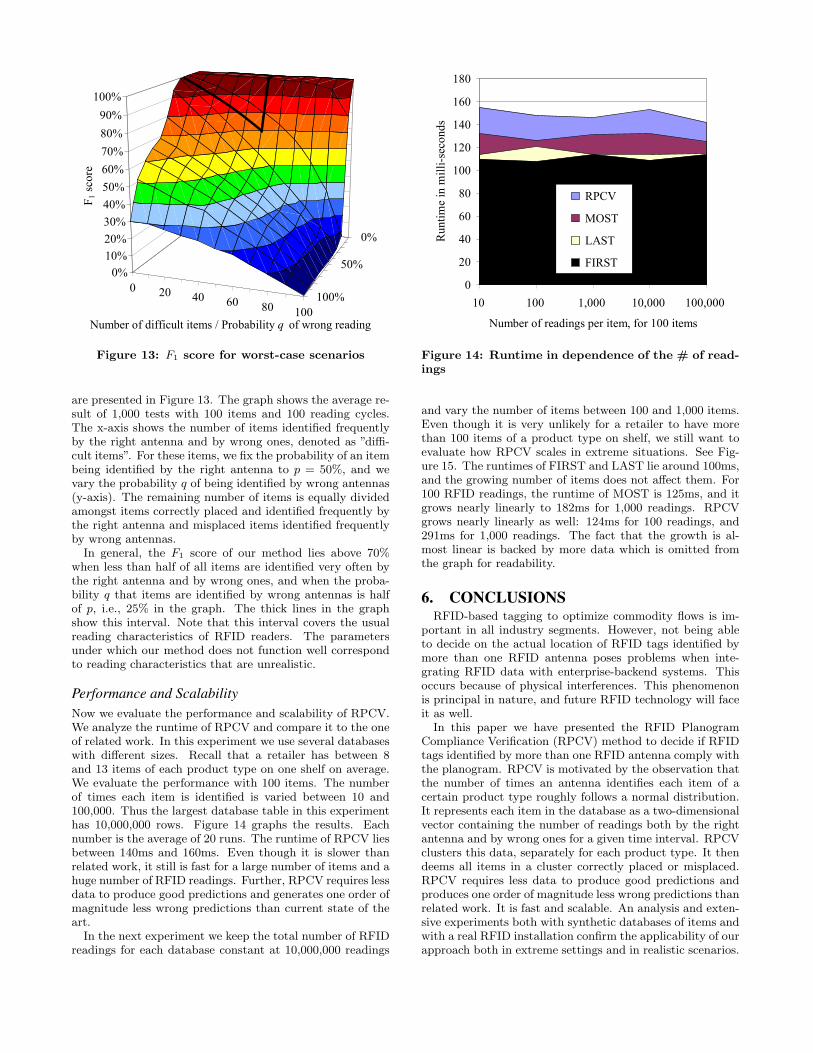
Figure 13: F1 score for worst-case scenarios
are presented in Figure 13. The graph shows the average re-sult of 1,000 tests with 100 items and 100 reading cycles.The x-axis shows the number of items identified frequentlyby the right antenna and by wrong ones, denoted as ”diffi-cult items”. For these items, we fix the probability of an itembeing identified by the right antenna to p = 50%, and wevary the probability q of being identified by wrong antennas(y-axis). The remaining number of items is equally dividedamongst items correctly placed and identified frequently bythe right antenna and misplaced items identified frequentlyby wrong antennas.
In general, the F1 score of our method lies above 70%when less than half of all items are identified very often bythe right antenna and by wrong ones, and when the proba-bility q that items are identified by wrong antennas is halfof p, i.e., 25% in the graph. The thick lines in the graphshow this interval. Note that this interval covers the usualreading characteristics of RFID readers. The parametersunder which our method does not function well correspondto reading characteristics that are unrealistic.
Performance and ScalabilityNow we evaluate the performance and scalability of RPCV.We analyze the runtime of RPCV and compare it to the oneof related work. In this experiment we use several databaseswith different sizes. Recall that a retailer has between 8and 13 items of each product type on one shelf on average.We evaluate the performance with 100 items. The numberof times each item is identified is varied between 10 and100,000. Thus the largest database table in this experimenthas 10,000,000 rows. Figure 14 graphs the results. Eachnumber is the average of 20 runs. The runtime of RPCV liesbetween 140ms and 160ms. Even though it is slower thanrelated work, it still is fast for a large number of items and ahuge number of RFID readings. Further, RPCV requires lessdata to produce good predictions and generates one order ofmagnitude less wrong predictions than current state of theart.
In the next experiment we keep the total number of RFIDreadings for each database constant at 10,000,000 readings
0
20
40
60
80
100
120
140
160
180
10 100 1,000 10,000 100,000
Number of readings per item, for 100 items
Run
time
in m
illi-s
econ
ds
RPCV
MOST
LAST
FIRST
Figure 14: Runtime in dependence of the # of read-ings
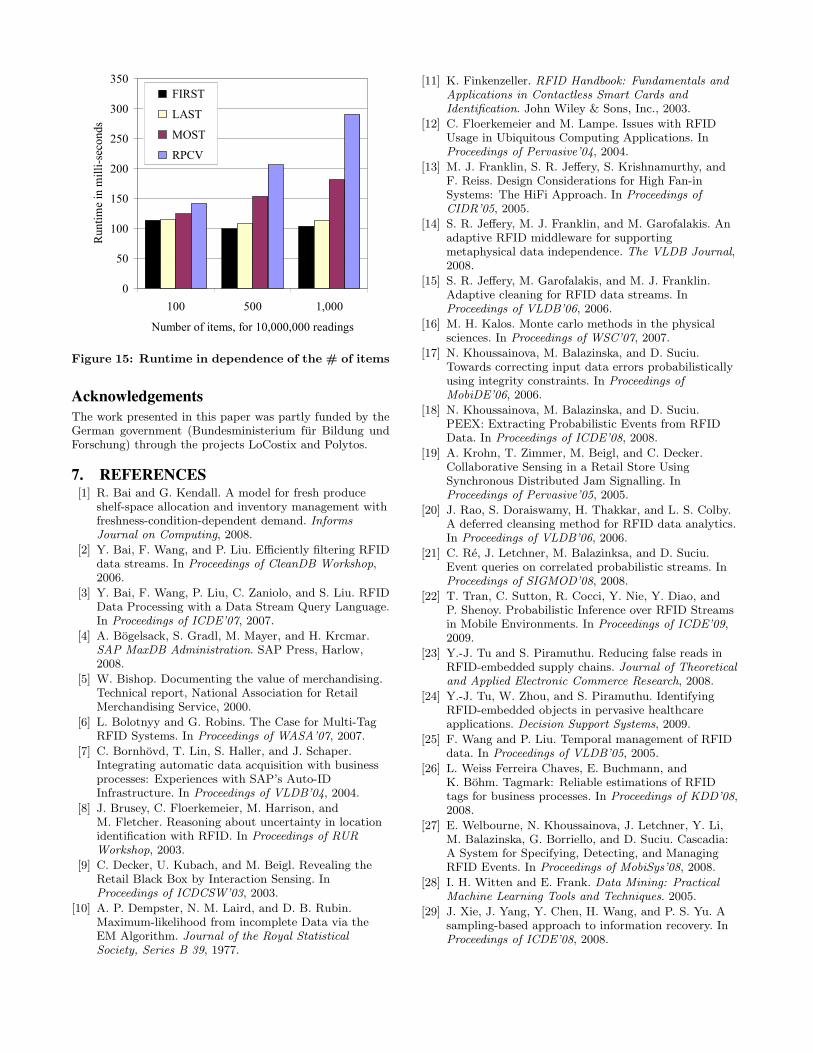
and vary the number of items between 100 and 1,000 items.Even though it is very unlikely for a retailer to have morethan 100 items of a product type on shelf, we still want toevaluate how RPCV scales in extreme situations. See Fig-ure 15. The runtimes of FIRST and LAST lie around 100ms,and the growing number of items does not affect them. For100 RFID readings, the runtime of MOST is 125ms, and itgrows nearly linearly to 182ms for 1,000 readings. RPCVgrows nearly linearly as well: 124ms for 100 readings, and291ms for 1,000 readings. The fact that the growth is al-most linear is backed by more data which is omitted fromthe graph for readability.
6. CONCLUSIONSRFID-based tagging to optimize commodity flows is im-
portant in all industry segments. However, not being ableto decide on the actual location of RFID tags identified bymore than one RFID antenna poses problems when inte-grating RFID data with enterprise-backend systems. Thisoccurs because of physical interferences. This phenomenonis principal in nature, and future RFID technology will faceit as well.
In this paper we have presented the RFID PlanogramCompliance Verification (RPCV) method to decide if RFIDtags identified by more than one RFID antenna comply withthe planogram. RPCV is motivated by the observation thatthe number of times an antenna identifies each item of acertain product type roughly follows a normal distribution.It represents each item in the database as a two-dimensionalvector containing the number of readings both by the rightantenna and by wrong ones for a given time interval. RPCVclusters this data, separately for each product type. It thendeems all items in a cluster correctly placed or misplaced.RPCV requires less data to produce good predictions andproduces one order of magnitude less wrong predictions thanrelated work. It is fast and scalable. An analysis and exten-sive experiments both with synthetic databases of items andwith a real RFID installation confirm the applicability of ourapproach both in extreme settings and in realistic scenarios.
0
50
100
150
200
250
300
350
100 500 1,000
Number of items, for 10,000,000 readings
Run
time
in m
illi-s
econ
ds FIRST
LAST
MOST
RPCV
Figure 15: Runtime in dependence of the # of items
AcknowledgementsThe work presented in this paper was partly funded by theGerman government (Bundesministerium fur Bildung undForschung) through the projects LoCostix and Polytos.
7. REFERENCES[1] R. Bai and G. Kendall. A model for fresh produce
shelf-space allocation and inventory management withfreshness-condition-dependent demand. InformsJournal on Computing, 2008.
[2] Y. Bai, F. Wang, and P. Liu. Efficiently filtering RFIDdata streams. In Proceedings of CleanDB Workshop,2006.
[3] Y. Bai, F. Wang, P. Liu, C. Zaniolo, and S. Liu. RFIDData Processing with a Data Stream Query Language.In Proceedings of ICDE’07, 2007.
[4] A. Bogelsack, S. Gradl, M. Mayer, and H. Krcmar.SAP MaxDB Administration. SAP Press, Harlow,2008.
[5] W. Bishop. Documenting the value of merchandising.Technical report, National Association for RetailMerchandising Service, 2000.
[6] L. Bolotnyy and G. Robins. The Case for Multi-TagRFID Systems. In Proceedings of WASA’07, 2007.
[7] C. Bornhovd, T. Lin, S. Haller, and J. Schaper.Integrating automatic data acquisition with businessprocesses: Experiences with SAP’s Auto-IDInfrastructure. In Proceedings of VLDB’04, 2004.
[8] J. Brusey, C. Floerkemeier, M. Harrison, andM. Fletcher. Reasoning about uncertainty in locationidentification with RFID. In Proceedings of RURWorkshop, 2003.
[9] C. Decker, U. Kubach, and M. Beigl. Revealing theRetail Black Box by Interaction Sensing. InProceedings of ICDCSW’03, 2003.
[10] A. P. Dempster, N. M. Laird, and D. B. Rubin.Maximum-likelihood from incomplete Data via theEM Algorithm. Journal of the Royal StatisticalSociety, Series B 39, 1977.
[11] K. Finkenzeller. RFID Handbook: Fundamentals andApplications in Contactless Smart Cards andIdentification. John Wiley & Sons, Inc., 2003.
[12] C. Floerkemeier and M. Lampe. Issues with RFIDUsage in Ubiquitous Computing Applications. InProceedings of Pervasive’04, 2004.
[13] M. J. Franklin, S. R. Jeffery, S. Krishnamurthy, andF. Reiss. Design Considerations for High Fan-inSystems: The HiFi Approach. In Proceedings ofCIDR’05, 2005.
[14] S. R. Jeffery, M. J. Franklin, and M. Garofalakis. Anadaptive RFID middleware for supportingmetaphysical data independence. The VLDB Journal,2008.
[15] S. R. Jeffery, M. Garofalakis, and M. J. Franklin.Adaptive cleaning for RFID data streams. InProceedings of VLDB’06, 2006.
[16] M. H. Kalos. Monte carlo methods in the physicalsciences. In Proceedings of WSC’07, 2007.
[17] N. Khoussainova, M. Balazinska, and D. Suciu.Towards correcting input data errors probabilisticallyusing integrity constraints. In Proceedings ofMobiDE’06, 2006.
[18] N. Khoussainova, M. Balazinska, and D. Suciu.PEEX: Extracting Probabilistic Events from RFIDData. In Proceedings of ICDE’08, 2008.
[19] A. Krohn, T. Zimmer, M. Beigl, and C. Decker.Collaborative Sensing in a Retail Store UsingSynchronous Distributed Jam Signalling. InProceedings of Pervasive’05, 2005.
[20] J. Rao, S. Doraiswamy, H. Thakkar, and L. S. Colby.A deferred cleansing method for RFID data analytics.In Proceedings of VLDB’06, 2006.
[21] C. Re, J. Letchner, M. Balazinksa, and D. Suciu.Event queries on correlated probabilistic streams. InProceedings of SIGMOD’08, 2008.
[22] T. Tran, C. Sutton, R. Cocci, Y. Nie, Y. Diao, andP. Shenoy. Probabilistic Inference over RFID Streamsin Mobile Environments. In Proceedings of ICDE’09,2009.
[23] Y.-J. Tu and S. Piramuthu. Reducing false reads inRFID-embedded supply chains. Journal of Theoreticaland Applied Electronic Commerce Research, 2008.
[24] Y.-J. Tu, W. Zhou, and S. Piramuthu. IdentifyingRFID-embedded objects in pervasive healthcareapplications. Decision Support Systems, 2009.
[25] F. Wang and P. Liu. Temporal management of RFIDdata. In Proceedings of VLDB’05, 2005.
[26] L. Weiss Ferreira Chaves, E. Buchmann, andK. Bohm. Tagmark: Reliable estimations of RFIDtags for business processes. In Proceedings of KDD’08,2008.
[27] E. Welbourne, N. Khoussainova, J. Letchner, Y. Li,M. Balazinska, G. Borriello, and D. Suciu. Cascadia:A System for Specifying, Detecting, and ManagingRFID Events. In Proceedings of MobiSys’08, 2008.
[28] I. H. Witten and E. Frank. Data Mining: PracticalMachine Learning Tools and Techniques. 2005.
[29] J. Xie, J. Yang, Y. Chen, H. Wang, and P. S. Yu. Asampling-based approach to information recovery. InProceedings of ICDE’08, 2008.