financial statements and analysis - wordpress.com · chapter 2 financial statements and analysis 41...
TRANSCRIPT
2
40
Financial Statementsand Analysis
Why This Chapter Matters to YouIn Your Professional Life
Accounting: You need to understand the stockholders’ report andpreparation of the four key financial statements; how firms consolidateinternational financial statements; and how to calculate and interpretfinancial ratios for decision making.
Information systems: You need to understand what data are includedin the firm’s financial statements to design systems that will supply suchdata to those who prepare the statements and to those in the firm whouse the data for ratio calculations.
Management: You need to understand what parties are interested inthe stockholders’ report and why; how the financial statements will beanalyzed by those both inside and outside the firm to assess variousaspects of performance; the caution that should be exercised in usingfinancial ratio analysis; and how the financial statements affect thevalue of the firm.
Marketing: You need to understand the effects your decisions will haveon the financial statements, particularly the income statement and thestatement of cash flows, and how analysis of ratios, especially thoseinvolving sales figures, will affect the firm’s decisions about levels ofinventory, credit policies, and pricing decisions.
Operations: You need to understand how the costs of operations arereflected in the firm’s financial statements and how analysis of ratios,particularly those involving assets, cost of goods sold, or inventory, may affect requests for new equipment or facilities.
In Your Personal Life
A routine step in personal financial planning is to prepare and analyzepersonal financial statements, so that you can monitor progress towardyour financial goals. Also, you need to understand and analyze corpo-rate financial statements to build and monitor your investment portfolio.
Learning Goals
Review the contents of thestockholders’ report and theprocedures for consolidatinginternational financial statements.
Understand who uses financial ratios,and how.
Use ratios to analyze a firm’s liquidityand activity.
Discuss the relationship betweendebt and financial leverage and theratios used to analyze a firm’s debt.
Use ratios to analyze a firm’sprofitability and its market value.
Use a summary of financial ratiosand the DuPont system of analysis to perform a complete ratio analysis.
LG6
LG5
LG4
LG3
LG2
LG1
M02_GITM4126_05_SE_C02.QXD 12/14/07 9:21 AM Page 40
2008935814
Principles of Managerial Finance, Brief Fifth Edition, by Lawrence J. Gitman. Copyright © 2009 by Lawrence J. Gitman.Published by Prentice Hall, a division of Pearson Education, Inc.
CHAPTER 2 Financial Statements and Analysis 41
All companies gather financial data about their operations and report this information in
financial statements for interested parties. These statements are widely standardized,
and so we can use the data in them to make comparisons between firms and over time.
Analysis of certain items of financial data can identify areas where the firm excels and, also,
areas of opportunity for improvement. This chapter reviews the content of financial state-
ments and explains categories of financial ratios and their use.
2.1 The Stockholders’ Report
Every corporation has many and varied uses for the standardized records andreports of its financial activities. Periodically, reports must be prepared for regu-lators, creditors (lenders), owners, and management. The guidelines used to pre-pare and maintain financial records and reports are known as generally acceptedaccounting principles (GAAP). These accounting practices and procedures are authorized by the accounting profession’s rule-setting body, the FinancialAccounting Standards Board (FASB).
In addition, the Sarbanes-Oxley Act of 2002, enacted in an effort to elimi-nate the many disclosure and conflict of interest problems of corporations,established the Public Company Accounting Oversight Board (PCAOB), a not-for-profit corporation that oversees auditors of public corporations. The PCAOBis charged with protecting the interes ts of investors and furthering the publicinterest in the preparation of informative, fair, and independent audit reports.The expectation is that it will instill confidence in investors with regard to theaccuracy of the audited financial statements of public companies.
Publicly owned corporations with more than $5 million in assets and 500 ormore stockholders1 are required by the Securities and Exchange Commission(SEC)—the federal regulatory body that governs the sale and listing of securi-ties—to provide their stockholders with an annual stockholders’ report. Thestockholders’ report summarizes and documents the firm’s financial activitiesduring the past year. It begins with a letter to the stockholders from the firm’spresident and/or chairman of the board.
The Letter to Stockholders
The letter to stockholders is the primary communication from management. Itdescribes the events that are considered to have had the greatest effect on the firm during the year. It also generally discusses management philosophy, corpo-rate governance issues, strategies, and actions, as well as plans for the comingyear. Links at this book’s website (www.prenhall.com/gitman) will take you tosome representative letters to stockholders.
LG1
1. Although the Securities and Exchange Commission (SEC) does not have an official definition of publicly owned,these financial measures mark the cutoff point it uses to require informational reporting, regardless of whether thefirm publicly sells its securities. Firms that do not meet these requirements are commonly called “closely owned” firms.
generally acceptedaccounting principles (GAAP)The practice and procedure guidelines used to prepareand maintain financial recordsand reports; authorized by the Financial AccountingStandards Board (FASB).
Financial AccountingStandards Board (FASB)The accounting profession’srule-setting body, whichauthorizes generally acceptedaccounting principles (GAAP).
Public Company AccountingOversight Board (PCAOB)A not-for-profit corporationestablished by the Sarbanes-Oxley Act of 2002 to protectthe interests of investors andfurther the public interest inthe preparation of informative,fair, and independent auditreports.
Securities and ExchangeCommission (SEC)The federal regulatory bodythat governs the sale andlisting of securities.
stockholders’ reportAnnual report that publiclyowned corporations mustprovide to stockholders; it summarizes and documentsthe firm’s finan-cial activities during the past year.
letter to stockholdersTypically, the first element of the annual stockholders’report and the primarycommunication frommanagement.
M02_GITM4126_05_SE_C02.QXD 12/14/07 9:21 AM Page 41
2008
9358
14
Principles of Managerial Finance, Brief Fifth Edition, by Lawrence J. Gitman. Copyright © 2009 by Lawrence J. Gitman.Published by Prentice Hall, a division of Pearson Education, Inc.
The Four Key Financial Statements
The four key financial statements required by the SEC for reporting to share-holders are (1) the income statement, (2) the balance sheet, (3) the statement ofstockholders’ equity, and (4) the statement of cash flows.2 The financial state-ments from the 2009 stockholders’ report of Bartlett Company, a manufacturerof metal fasteners, are presented and briefly discussed. Most likely, you havestudied these four financial statements in an accounting course, so the purpose oflooking at them here is to refresh your memory of the basics, rather than providean exhaustive review.
Income Statement
The income statement provides a financial summary of the firm’s operating resultsduring a specified period. Most common are income statements covering a 1-yearperiod ending at a specified date, ordinarily December 31 of the calendar year.Many large firms, however, operate on a 12-month financial cycle, or fiscal year,that ends at a time other than December 31. In addition, monthly income state-ments are typically prepared for use by management, and quarterly statementsmust be made available to the stockholders of publicly owned corporations.
Table 2.1 presents Bartlett Company’s income statements for the years endedDecember 31, 2009 and 2008. The 2009 statement begins with sales revenue—thetotal dollar amount of sales during the period—from which the cost of goods sold is deducted. The resulting gross profits of $986,000 represent the amountremaining to satisfy operating, financial, and tax costs. Next, operating expenses,which include selling expense, general and administrative expense, lease expense,and depreciation expense, are deducted from gross profits.3 The resulting oper-ating profits of $418,000 represent the profits earned from producing and sellingproducts; this amount does not consider financial and tax costs. (Operating profitis often called earnings before interest and taxes, or EBIT.) Next, the financialcost—interest expense—is subtracted from operating profits to find net profits (orearnings) before taxes. After subtracting $93,000 in 2009 interest, BartlettCompany had $325,000 of net profits before taxes.
Next, taxes are calculated at the appropriate tax rates and deducted to deter-mine net profits (or earnings) after taxes. Bartlett Company’s net profits aftertaxes for 2009 were $231,000. Any preferred stock dividends must be subtractedfrom net profits after taxes to arrive at earnings available for common stock-holders. This is the amount earned by the firm on behalf of the common stock-holders during the period.
Dividing earnings available for common stockholders by the number of sharesof common stock outstanding results in earnings per share (EPS). EPS representthe number of dollars earned during the period on behalf of each outstanding
42 PART ONE Introduction to Managerial Finance
2. Whereas these statement titles are consistently used throughout this text, it is important to recognize that in prac-tice, companies frequently use different titles. For example, General Electric uses “Statement of Earnings” ratherthan “Income Statement” and “Statement of Financial Position” rather than “Balance Sheet.” Both Sprint Nexteland Qualcomm use “Statement of Operations” rather than “Income Statement.”
3. Depreciation expense can be, and frequently is, included in manufacturing costs—cost of goods sold—to calculategross profits. Depreciation is shown as an expense in this text to isolate its effect on cash flows.
income statementProvides a financial summaryof the firm’s operating resultsduring a specified period.
Hint Some firms, such asretailers and agricultural firms,end their fiscal year at the endof their operating cycle ratherthan at the end of the calendaryear—for example, retailers at the end of January andagricultural firms at the end of September.
M02_GITM4126_05_SE_C02.QXD 12/14/07 9:21 AM Page 42
2008935814
Principles of Managerial Finance, Brief Fifth Edition, by Lawrence J. Gitman. Copyright © 2009 by Lawrence J. Gitman.Published by Prentice Hall, a division of Pearson Education, Inc.
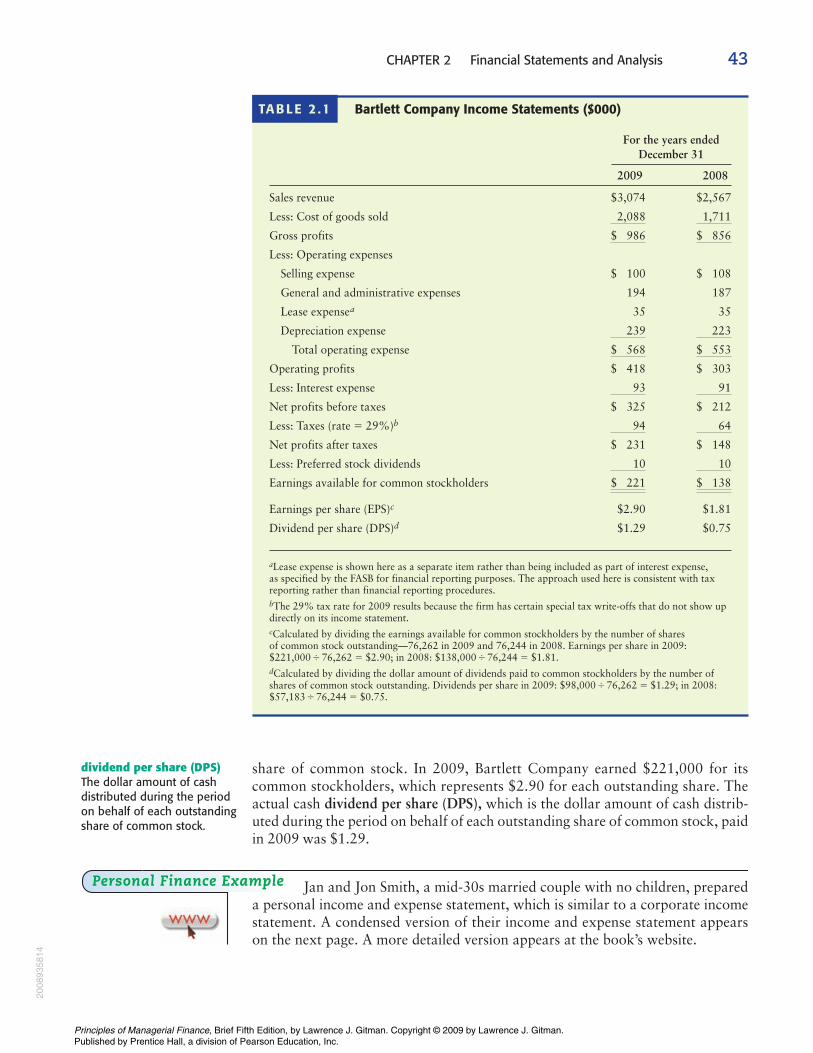
share of common stock. In 2009, Bartlett Company earned $221,000 for itscommon stockholders, which represents $2.90 for each outstanding share. Theactual cash dividend per share (DPS), which is the dollar amount of cash distrib-uted during the period on behalf of each outstanding share of common stock, paidin 2009 was $1.29.
Jan and Jon Smith, a mid-30s married couple with no children, prepareda personal income and expense statement, which is similar to a corporate incomestatement. A condensed version of their income and expense statement appearson the next page. A more detailed version appears at the book’s website.
Personal Finance Example
CHAPTER 2 Financial Statements and Analysis 43
Bartlett Company Income Statements ($000)
For the years endedDecember 31
2009 2008
Sales revenue $3,074 $2,567
Less: Cost of goods sold
Gross profits
Less: Operating expenses
Selling expense $ 100 $ 108
General and administrative expenses 194 187
Lease expensea 35 35
Depreciation expense
Total operating expense
Operating profits $ 418 $ 303
Less: Interest expense
Net profits before taxes $ 325 $ 212
Less: Taxes (rate � 29%)b
Net profits after taxes $ 231 $ 148
Less: Preferred stock dividends
Earnings available for common stockholders
Earnings per share (EPS)c $2.90 $1.81
Dividend per share (DPS)d $1.29 $0.75
aLease expense is shown here as a separate item rather than being included as part of interest expense, as specified by the FASB for financial reporting purposes. The approach used here is consistent with taxreporting rather than financial reporting procedures.bThe 29% tax rate for 2009 results because the firm has certain special tax write-offs that do not show updirectly on its income statement.cCalculated by dividing the earnings available for common stockholders by the number of shares of common stock outstanding—76,262 in 2009 and 76,244 in 2008. Earnings per share in 2009:$221,000�76,262 � $2.90; in 2008: $138,000�76,244 � $1.81.dCalculated by dividing the dollar amount of dividends paid to common stockholders by the number ofshares of common stock outstanding. Dividends per share in 2009: $98,000�76,262 � $1.29; in 2008:$57,183�76,244 � $0.75.
$ 138$ 221
1010
6494
9193
$ 553$ 568
223239
$ 856$ 986
1,7112,088
TAB LE 2 .1
dividend per share (DPS)The dollar amount of cashdistributed during the periodon behalf of each outstandingshare of common stock.
M02_GITM4126_05_SE_C02.QXD 12/14/07 9:21 AM Page 43
2008
9358
14
Principles of Managerial Finance, Brief Fifth Edition, by Lawrence J. Gitman. Copyright © 2009 by Lawrence J. Gitman.Published by Prentice Hall, a division of Pearson Education, Inc.
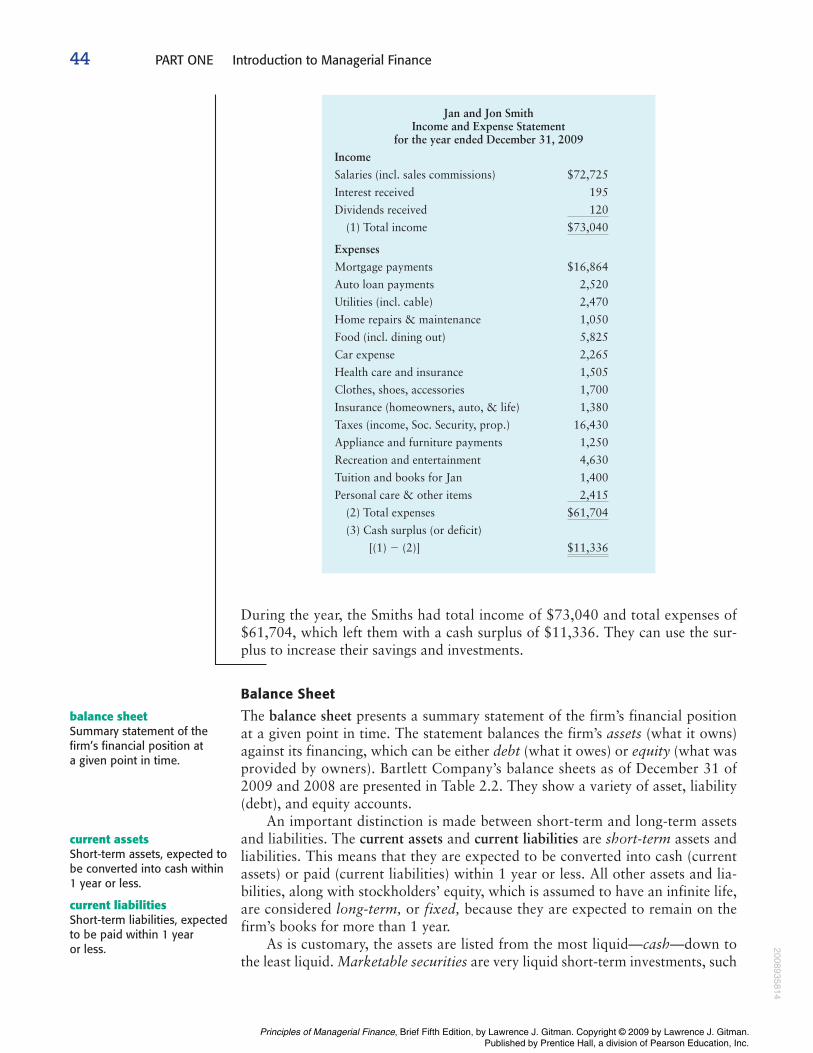
During the year, the Smiths had total income of $73,040 and total expenses of$61,704, which left them with a cash surplus of $11,336. They can use the sur-plus to increase their savings and investments.
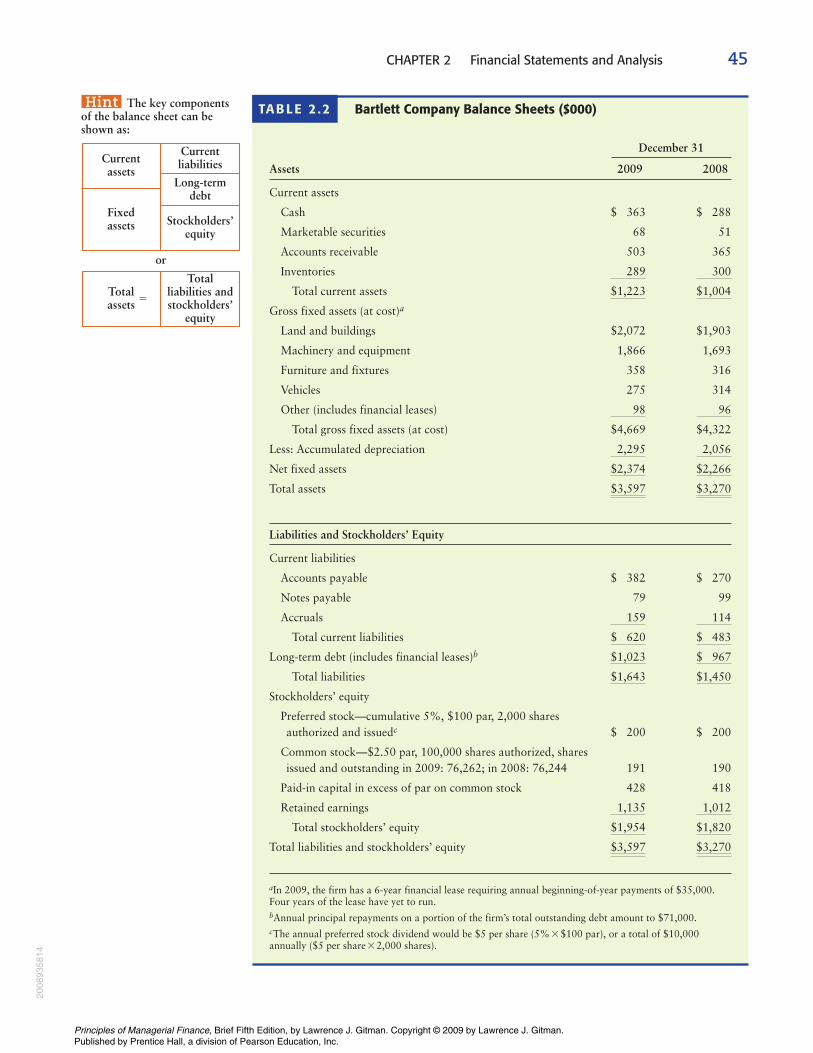
Balance Sheet
The balance sheet presents a summary statement of the firm’s financial positionat a given point in time. The statement balances the firm’s assets (what it owns)against its financing, which can be either debt (what it owes) or equity (what wasprovided by owners). Bartlett Company’s balance sheets as of December 31 of2009 and 2008 are presented in Table 2.2. They show a variety of asset, liability(debt), and equity accounts.
An important distinction is made between short-term and long-term assetsand liabilities. The current assets and current liabilities are short-term assets andliabilities. This means that they are expected to be converted into cash (currentassets) or paid (current liabilities) within 1 year or less. All other assets and lia-bilities, along with stockholders’ equity, which is assumed to have an infinite life,are considered long-term, or fixed, because they are expected to remain on thefirm’s books for more than 1 year.
As is customary, the assets are listed from the most liquid—cash—down tothe least liquid. Marketable securities are very liquid short-term investments, such
44 PART ONE Introduction to Managerial Finance
Jan and Jon Smith Income and Expense Statement
for the year ended December 31, 2009
Income
Salaries (incl. sales commissions) $72,725
Interest received 195
Dividends received
(1) Total income
Expenses
Mortgage payments $16,864
Auto loan payments 2,520
Utilities (incl. cable) 2,470
Home repairs & maintenance 1,050
Food (incl. dining out) 5,825
Car expense 2,265
Health care and insurance 1,505
Clothes, shoes, accessories 1,700
Insurance (homeowners, auto, & life) 1,380
Taxes (income, Soc. Security, prop.) 16,430
Appliance and furniture payments 1,250
Recreation and entertainment 4,630
Tuition and books for Jan 1,400
Personal care & other items
(2) Total expenses
(3) Cash surplus (or deficit)
[(1) � (2)] $11,336
$61,704
2,415
$73,040
120
balance sheetSummary statement of thefirm’s financial position at a given point in time.
current assetsShort-term assets, expected tobe converted into cash within1 year or less.
current liabilitiesShort-term liabilities, expectedto be paid within 1 year or less.
M02_GITM4126_05_SE_C02.QXD 12/14/07 9:21 AM Page 44
2008935814
Principles of Managerial Finance, Brief Fifth Edition, by Lawrence J. Gitman. Copyright © 2009 by Lawrence J. Gitman.Published by Prentice Hall, a division of Pearson Education, Inc.
CHAPTER 2 Financial Statements and Analysis 45
Bartlett Company Balance Sheets ($000)
December 31
Assets 2009 2008
Current assets
Cash $ 363 $ 288
Marketable securities 68 51
Accounts receivable 503 365
Inventories
Total current assets
Gross fixed assets (at cost)a
Land and buildings $2,072 $1,903
Machinery and equipment 1,866 1,693
Furniture and fixtures 358 316
Vehicles 275 314
Other (includes financial leases)
Total gross fixed assets (at cost) $4,669 $4,322
Less: Accumulated depreciation
Net fixed assets
Total assets
Liabilities and Stockholders’ Equity
Current liabilities
Accounts payable $ 382 $ 270
Notes payable 79 99
Accruals
Total current liabilities
Long-term debt (includes financial leases)b
Total liabilities
Stockholders’ equity
Preferred stock—cumulative 5%, $100 par, 2,000 sharesauthorized and issuedc $ 200 $ 200
Common stock—$2.50 par, 100,000 shares authorized, sharesissued and outstanding in 2009: 76,262; in 2008: 76,244 191 190
Paid-in capital in excess of par on common stock 428 418
Retained earnings
Total stockholders’ equity
Total liabilities and stockholders’ equity
aIn 2009, the firm has a 6-year financial lease requiring annual beginning-of-year payments of $35,000.Four years of the lease have yet to run.bAnnual principal repayments on a portion of the firm’s total outstanding debt amount to $71,000.cThe annual preferred stock dividend would be $5 per share (5%�$100 par), or a total of $10,000annually ($5 per share�2,000 shares).
$3,270$3,597
$1,820$1,954
1,0121,135
$1,450$1,643
$ 967$1,023
$ 483$ 620
114159
$3,270$3,597
$2,266$2,374
2,0562,295
9698
$1,004$1,223
300289
TAB LE 2 .2Hint The key componentsof the balance sheet can beshown as:
Currentassets
Fixedassets
Currentliabilities
Long-termdebt
Stockholders’equity
Totalassets �
Total liabilities andstockholders’
equity
or
M02_GITM4126_05_SE_C02.QXD 12/14/07 9:21 AM Page 45
2008
9358
14
Principles of Managerial Finance, Brief Fifth Edition, by Lawrence J. Gitman. Copyright © 2009 by Lawrence J. Gitman.Published by Prentice Hall, a division of Pearson Education, Inc.
as U.S. Treasury bills or certificates of deposit, held by the firm. Because they arehighly liquid, marketable securities are viewed as a form of cash (“near cash”).Accounts receivable represent the total monies owed the firm by its customers oncredit sales made to them. Inventories include raw materials, work in process(partially finished goods), and finished goods held by the firm. The entry forgross fixed assets is the original cost of all fixed (long-term) assets owned by thefirm.4 Net fixed assets represent the difference between gross fixed assets andaccumulated depreciation—the total expense recorded for the depreciation offixed assets. (The net value of fixed assets is called their book value.)
Like assets, the liabilities and equity accounts are listed from short-term tolong-term. Current liabilities include accounts payable, amounts owed for creditpurchases by the firm; notes payable, outstanding short-term loans, typicallyfrom commercial banks; and accruals, amounts owed for services for which a billmay not or will not be received. (Examples of accruals include taxes due the gov-ernment and wages due employees.) Long-term debt represents debt for whichpayment is not due in the current year. Stockholders’ equity represents theowners’ claims on the firm. The preferred stock entry shows the historical pro-ceeds from the sale of preferred stock ($200,000 for Bartlett Company).
Next, the amount paid by the original purchasers of common stock is shownby two entries: common stock and paid-in capital in excess of par on commonstock. The common stock entry is the par value of common stock. Paid-in capitalin excess of par represents the amount of proceeds in excess of the par valuereceived from the original sale of common stock. The sum of the common stockand paid-in capital accounts divided by the number of shares outstanding repre-sents the original price per share received by the firm on a single issue of commonstock. Bartlett Company therefore received about $8.12 per share [($191,000 par�$428,000 paid-in capital in excess of par)�76,262 shares] from the sale of itscommon stock.
Finally, retained earnings represent the cumulative total of all earnings, net ofdividends, that have been retained and reinvested in the firm since its inception. Itis important to recognize that retained earnings are not cash but rather have beenutilized to finance the firm’s assets.
Bartlett Company’s balance sheets in Table 2.2 show that the firm’s totalassets increased from $3,270,000 in 2008 to $3,597,000 in 2009. The $327,000increase was due primarily to the $219,000 increase in current assets. The assetincrease, in turn, appears to have been financed primarily by an increase of$193,000 in total liabilities. Better insight into these changes can be derived fromthe statement of cash flows, which we will discuss shortly.
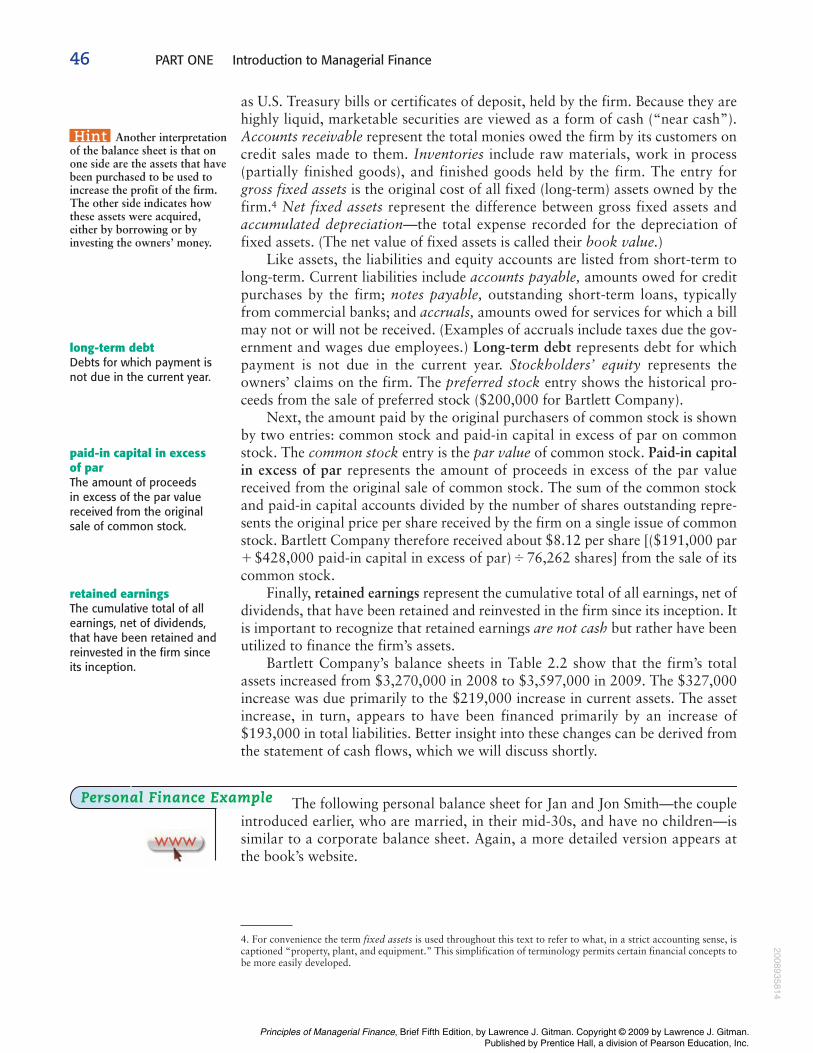
The following personal balance sheet for Jan and Jon Smith—the coupleintroduced earlier, who are married, in their mid-30s, and have no children—issimilar to a corporate balance sheet. Again, a more detailed version appears atthe book’s website.
Personal Finance Example
46 PART ONE Introduction to Managerial Finance
4. For convenience the term fixed assets is used throughout this text to refer to what, in a strict accounting sense, iscaptioned “property, plant, and equipment.” This simplification of terminology permits certain financial concepts tobe more easily developed.
long-term debtDebts for which payment isnot due in the current year.
paid-in capital in excess of parThe amount of proceeds in excess of the par valuereceived from the original sale of common stock.
Hint Another interpretationof the balance sheet is that onone side are the assets that havebeen purchased to be used toincrease the profit of the firm.The other side indicates howthese assets were acquired,either by borrowing or byinvesting the owners’ money.
retained earningsThe cumulative total of allearnings, net of dividends,that have been retained andreinvested in the firm since its inception.
M02_GITM4126_05_SE_C02.QXD 12/14/07 9:21 AM Page 46
2008935814
Principles of Managerial Finance, Brief Fifth Edition, by Lawrence J. Gitman. Copyright © 2009 by Lawrence J. Gitman.Published by Prentice Hall, a division of Pearson Education, Inc.
CHAPTER 2 Financial Statements and Analysis 47
Jan and Jon Smith Balance Sheet
December 31, 2009
Assets Liabilities and Net Worth
Cash on hand $ 90 Credit card balances $ 665
Checking accounts 575 Utility bills 120
Savings accounts 760 Medical bills 75
Money market funds Other current liab.
Total liquid assets Total cur. liab.
Stocks & bonds $ 2,250 Real estate mortg. $ 92,000
Mutual funds 1,500 Auto loans 4,250
Retirement funds, IRA Education loan 3,800
Total investments Personal loan 4,000
Real estate $120,000 Furniture loan
Cars 14,000 Tot. L-T liab.
Household furnishings 3,700 Tot. liab.
Jewelry & artwork Net worth (N/W)
Total personal prop. Tot. liab.
Total assets & N/W $147,175$147,175
$139,200
$ 41,4201,500
$105,755
$104,850
800
$ 5,750
2,000
$ 905$ 2,225
45800
The Smiths have total assets of $147,175 and total liabilities of $105,755.Personal net worth (N/W) is a “plug figure”—the difference between total assetsand total liabilities—which in the case of Jan and Jon Smith is $41,420.
Statement of Retained Earnings
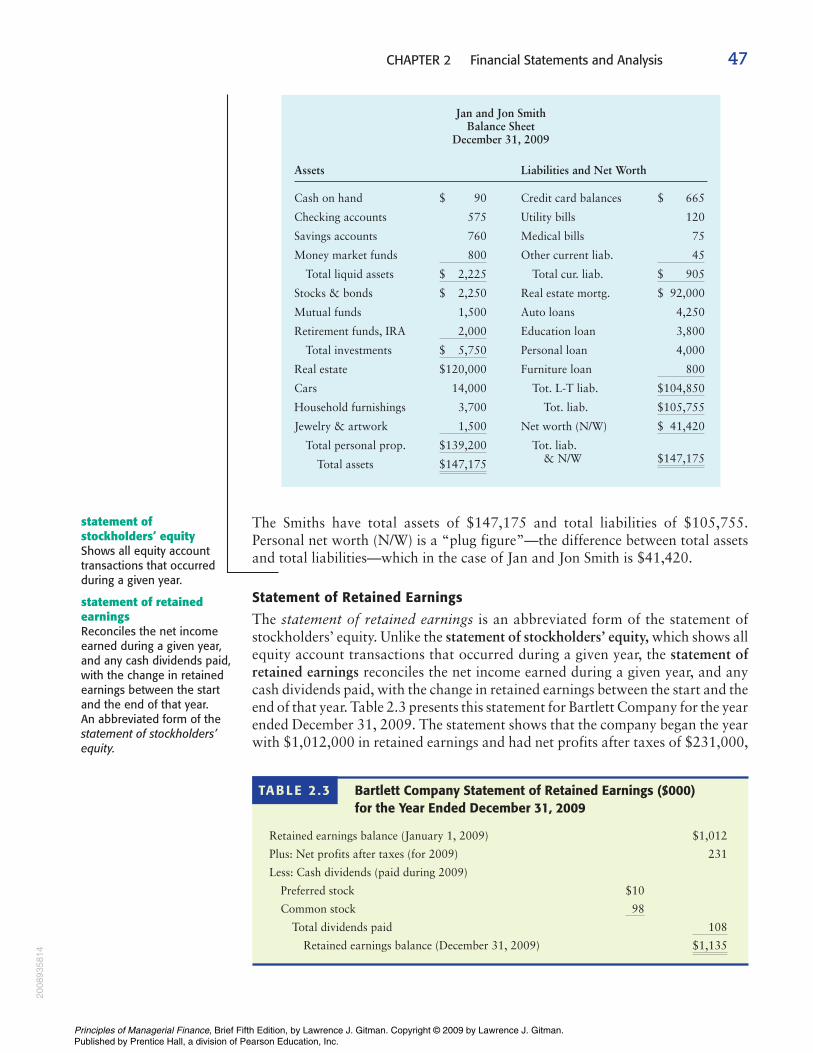
The statement of retained earnings is an abbreviated form of the statement ofstockholders’ equity. Unlike the statement of stockholders’ equity, which shows allequity account transactions that occurred during a given year, the statement ofretained earnings reconciles the net income earned during a given year, and anycash dividends paid, with the change in retained earnings between the start and theend of that year. Table 2.3 presents this statement for Bartlett Company for the yearended December 31, 2009. The statement shows that the company began the yearwith $1,012,000 in retained earnings and had net profits after taxes of $231,000,
Bartlett Company Statement of Retained Earnings ($000) for the Year Ended December 31, 2009
Retained earnings balance (January 1, 2009) $1,012
Plus: Net profits after taxes (for 2009) 231
Less: Cash dividends (paid during 2009)
Preferred stock $10
Common stock
Total dividends paid
Retained earnings balance (December 31, 2009) $1,135
108
98
TAB LE 2 .3
statement of stockholders’ equityShows all equity accounttransactions that occurredduring a given year.
statement of retainedearningsReconciles the net incomeearned during a given year,and any cash dividends paid,with the change in retainedearnings between the startand the end of that year. An abbreviated form of thestatement of stockholders’equity.
M02_GITM4126_05_SE_C02.QXD 12/14/07 9:21 AM Page 47
2008
9358
14
Principles of Managerial Finance, Brief Fifth Edition, by Lawrence J. Gitman. Copyright © 2009 by Lawrence J. Gitman.Published by Prentice Hall, a division of Pearson Education, Inc.
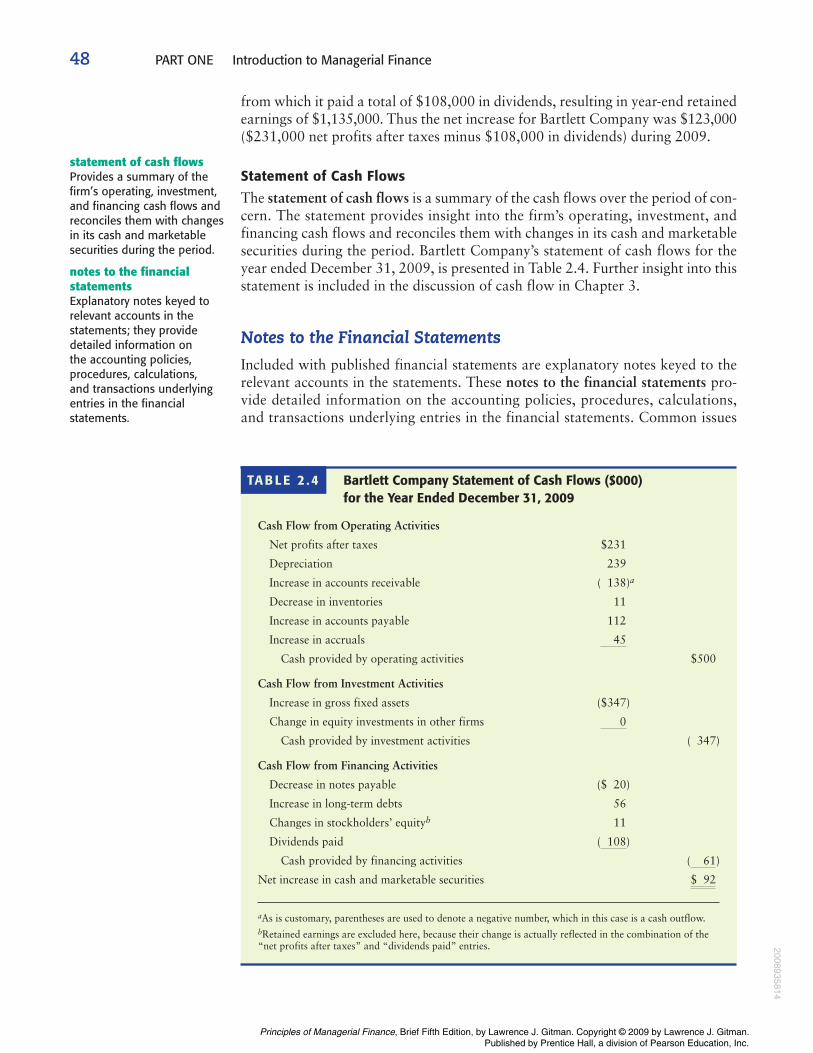
from which it paid a total of $108,000 in dividends, resulting in year-end retainedearnings of $1,135,000. Thus the net increase for Bartlett Company was $123,000($231,000 net profits after taxes minus $108,000 in dividends) during 2009.
Statement of Cash Flows
The statement of cash flows is a summary of the cash flows over the period of con-cern. The statement provides insight into the firm’s operating, investment, andfinancing cash flows and reconciles them with changes in its cash and marketablesecurities during the period. Bartlett Company’s statement of cash flows for theyear ended December 31, 2009, is presented in Table 2.4. Further insight into thisstatement is included in the discussion of cash flow in Chapter 3.
Notes to the Financial Statements
Included with published financial statements are explanatory notes keyed to therelevant accounts in the statements. These notes to the financial statements pro-vide detailed information on the accounting policies, procedures, calculations,and transactions underlying entries in the financial statements. Common issues
48 PART ONE Introduction to Managerial Finance
statement of cash flowsProvides a summary of thefirm’s operating, investment,and financing cash flows andreconciles them with changesin its cash and marketablesecurities during the period.
notes to the financialstatementsExplanatory notes keyed torelevant accounts in thestatements; they providedetailed information on the accounting policies,procedures, calculations, and transactions underlyingentries in the financialstatements.
Bartlett Company Statement of Cash Flows ($000) for the Year Ended December 31, 2009
Cash Flow from Operating Activities
Net profits after taxes $231
Depreciation 239
Increase in accounts receivable ( 138)a
Decrease in inventories 11
Increase in accounts payable 112
Increase in accruals
Cash provided by operating activities $500
Cash Flow from Investment Activities
Increase in gross fixed assets ($347)
Change in equity investments in other firms
Cash provided by investment activities ( 347)
Cash Flow from Financing Activities
Decrease in notes payable ($ 20)
Increase in long-term debts 56
Changes in stockholders’ equityb 11
Dividends paid ( )
Cash provided by financing activities ( )
Net increase in cash and marketable securities
aAs is customary, parentheses are used to denote a negative number, which in this case is a cash outflow.bRetained earnings are excluded here, because their change is actually reflected in the combination of the“net profits after taxes” and “dividends paid” entries.
$ 92
61
108
0
45
TABLE 2 .4
M02_GITM4126_05_SE_C02.QXD 12/14/07 9:21 AM Page 48
2008935814
Principles of Managerial Finance, Brief Fifth Edition, by Lawrence J. Gitman. Copyright © 2009 by Lawrence J. Gitman.Published by Prentice Hall, a division of Pearson Education, Inc.
addressed by these notes include revenue recognition, income taxes, breakdownsof fixed asset accounts, debt and lease terms, and contingencies. Since passage ofSarbanes-Oxley, notes to the financial statements have also included some detailsabout compliance with that law. The Focus on Practice box above discussesissues relating to SOX compliance. Professional securities analysts use the data inthe statements and notes to develop estimates of the value of securities that thefirm issues, and these estimates influence the actions of investors and thereforethe firm’s share value.
Consolidating International Financial Statements
So far, we’ve discussed financial statements involving only one currency, the U.S.dollar. The issue of how to consolidate a company’s foreign and domestic finan-cial statements has bedeviled the accounting profession for many years. Thecurrent policy is described in Financial Accounting Standards Board (FASB)Standard No. 52, which mandates that U.S.-based companies translate their
CHAPTER 2 Financial Statements and Analysis 49
Is It Time to Change SOX?
In 2000 and 2001, accountingirregularities at a number of largecorporations forced Congress to take action, passing theSarbanes-Oxley Act of 2002(SOX). However, not everyone ispleased with the law. Many com-panies complain that compliancewith the Sarbanes-Oxley corpo-rate reporting regulations requirethem to spend much time andmoney. Large corporations, forexample, spent an average of$3.8 million in 2005 to complywith the law. The most onerousaspect of SOX appears to beSection 404, which requirescompanies to first review theirown systems for ensuring accu-rate financial reports and thenhave them tested by outsideauditors.
Several high-ranking govern-ment officials have weighed inon the debate. In a speech tothe Economic Club in November2006, U.S. Treasury SecretaryHenry Paulson acknowledged theimpact of the accounting provi-
sions, especially on small busi-nesses. Rather than passing anew law to amend the act, hesaid, Section 404 should beimplemented in a more efficientand cost-effective manner. Also, Securities and ExchangeCommission (SEC) ChairmanChristopher Cox wrote a letter tothe Public Company AccountingOversight Board (the auditingindustry’s overseer) urging thatthe rule be adapted to compa-nies based on company size.
Supporters of SOX claim that the law and related reformshave produced more reliablecorporate financial statements,which investors rely on whendeciding whether to buy or sellshares. According to Duncan W.Richardson, chief equity invest-ment officer at Eaton VanceManagement and overseer of$80 billion in stock holdings,even the act’s much-disparagedrequirements for testing internalfinancial controls could drivegains in corporate productivity
and profits. Thompson Financial’sEarnings Purity Index, whichtracks earnings adjusted forunusual charges and write-offs—techniques used to make earn-ings look better—reports thatimprovements have been shownin each of the past 4 years.
The jury is still out onwhether Sarbanes-Oxley will bechanged to alleviate the burdenon U.S. corporations. However,consider this: On the day SOXwas signed into law, the marketvalue of the Wilshire 5000, a proxy for all public companiesin the United States, stood at$10.5 trillion. By April 2007, thevalue of the Wilshire 5000 was$14.5 trillion. While the marketsfactor in many events, the pas-sage of SOX has not had a signif-icantly negative impact, as somemight argue.
■ In addition to investors, who elsemight be benefiting directly from theimplementation of the Sarbanes-Oxley Act?
IN P
RA
CT
ICE
Focus on Practice
Financial AccountingStandards Board (FASB)Standard No. 52Mandates that U.S.-basedcompanies translate theirforeign-currency-denominatedassets and liabilities intodollars, for consolida-tion with the parent company’s financialstatements. This is done by using the current rate(translation) method.
M02_GITM4126_05_SE_C02.QXD 12/14/07 9:21 AM Page 49
2008
9358
14
Principles of Managerial Finance, Brief Fifth Edition, by Lawrence J. Gitman. Copyright © 2009 by Lawrence J. Gitman.Published by Prentice Hall, a division of Pearson Education, Inc.
foreign-currency-denominated assets and liabilities into dollars, for consolidationwith the parent company’s financial statements. This is done by using a techniquecalled the current rate (translation) method, under which all of a U.S. parentcompany’s foreign-currency-denominated assets and liabilities are converted intodollar values using the exchange rate prevailing at the fiscal year ending date (thecurrent rate). Income statement items are treated similarly. Equity accounts, onthe other hand, are translated into dollars by using the exchange rate that pre-vailed when the parent’s equity investment was made (the historical rate).Retained earnings are adjusted to reflect each year’s operating profits or losses.For an example that demonstrates consolidation of international financial state-ments, go to the book’s website.
REVIEW QUESTIONS
2–1 What roles do GAAP, the FASB, and the PCAOB play in the financialreporting activities of public companies?
2–2 Describe the purpose of each of the four major financial statements.2–3 Why are the notes to the financial statements important to professional
securities analysts?2–4 How is the current rate (translation) method used to consolidate a firm’s
foreign and domestic financial statements?
2.2 Using Financial Ratios
The information contained in the four basic financial statements is of major sig-nificance to a variety of interested parties who regularly need to have relativemeasures of the company’s performance. Relative is the key word here, becausethe analysis of financial statements is based on the use of ratios or relative values.Ratio analysis involves methods of calculating and interpreting financial ratios toanalyze and monitor the firm’s performance. The basic inputs to ratio analysisare the firm’s income statement and balance sheet.
Interested Parties
Ratio analysis of a firm’s financial statements is of interest to shareholders, cred-itors, and the firm’s own management. Both current and prospective shareholdersare interested in the firm’s current and future level of risk and return, whichdirectly affect share price. The firm’s creditors are interested primarily in theshort-term liquidity of the company and its ability to make interest and principalpayments. A secondary concern of creditors is the firm’s profitability; they wantassurance that the business is healthy. Management, like stockholders, is con-cerned with all aspects of the firm’s financial situation, and it attempts to producefinancial ratios that will be considered favorable by both owners and creditors. Inaddition, management uses ratios to monitor the firm’s performance from periodto period.
LG2
50 PART ONE Introduction to Managerial Finance
current rate (translation)methodTechnique used by U.S.-basedcompanies to translate theirforeign-currency-denominatedassets and liabilities intodollars, for consolidationwith the parent company’sfinancial statements,using the year-end (current)exchange rate.
ratio analysisInvolves methods ofcalculating and interpretingfinancial ratios to analyze and monitor the firm’sperformance.
Hint Management shouldbe the most interested partyof this group. Managers notonly have to worry about thefinancial situation of the firm,but they are also criticallyinterested in what the otherparties think about the firm.
M02_GITM4126_05_SE_C02.QXD 12/14/07 9:21 AM Page 50
2008935814
Principles of Managerial Finance, Brief Fifth Edition, by Lawrence J. Gitman. Copyright © 2009 by Lawrence J. Gitman.Published by Prentice Hall, a division of Pearson Education, Inc.
CHAPTER 2 Financial Statements and Analysis 51
Types of Ratio Comparisons
Ratio analysis is not merely the calculation of a given ratio. More important isthe interpretation of the ratio value. A meaningful basis for comparison is neededto answer such questions as “Is it too high or too low?” and “Is it good or bad?”Two types of ratio comparisons can be made: cross-sectional and time-series.
Cross-Sectional Analysis
Cross-sectional analysis involves the comparison of different firms’ financialratios at the same point in time. Analysts are often interested in how well a firmhas performed in relation to other firms in its industry. Frequently, a firm willcompare its ratio values to those of a key competitor or group of competitors thatit wishes to emulate. This type of cross-sectional analysis, called benchmarking,has become very popular.
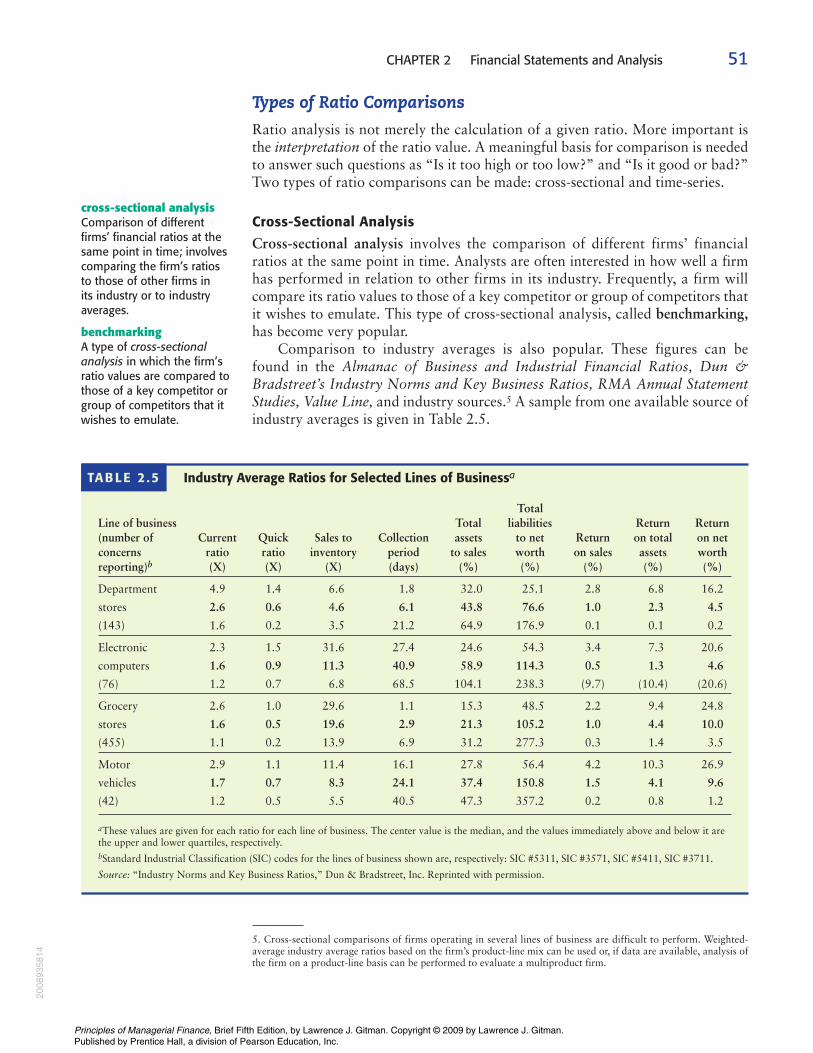
Comparison to industry averages is also popular. These figures can be found in the Almanac of Business and Industrial Financial Ratios, Dun &Bradstreet’s Industry Norms and Key Business Ratios, RMA Annual StatementStudies, Value Line, and industry sources.5 A sample from one available source ofindustry averages is given in Table 2.5.
5. Cross-sectional comparisons of firms operating in several lines of business are difficult to perform. Weighted-average industry average ratios based on the firm’s product-line mix can be used or, if data are available, analysis ofthe firm on a product-line basis can be performed to evaluate a multiproduct firm.
cross-sectional analysisComparison of different firms’ financial ratios at thesame point in time; involvescomparing the firm’s ratios to those of other firms in its industry or to industryaverages.
benchmarkingA type of cross-sectionalanalysis in which the firm’sratio values are compared tothose of a key competitor orgroup of competitors that itwishes to emulate.
Industry Average Ratios for Selected Lines of Businessa
TotalLine of business Total liabilities Return Return (number of Current Quick Sales to Collection assets to net Return on total on netconcerns ratio ratio inventory period to sales worth on sales assets worth reporting)b (X) (X) (X) (days) (%) (%) (%) (%) (%)
Department 4.9 1.4 6.6 1.8 32.0 25.1 2.8 6.8 16.2
stores 2.6 0.6 4.6 6.1 43.8 76.6 1.0 2.3 4.5
(143) 1.6 0.2 3.5 21.2 64.9 176.9 0.1 0.1 0.2
Electronic 2.3 1.5 31.6 27.4 24.6 54.3 3.4 7.3 20.6
computers 1.6 0.9 11.3 40.9 58.9 114.3 0.5 1.3 4.6
(76) 1.2 0.7 6.8 68.5 104.1 238.3 (9.7) (10.4) (20.6)
Grocery 2.6 1.0 29.6 1.1 15.3 48.5 2.2 9.4 24.8
stores 1.6 0.5 19.6 2.9 21.3 105.2 1.0 4.4 10.0
(455) 1.1 0.2 13.9 6.9 31.2 277.3 0.3 1.4 3.5
Motor 2.9 1.1 11.4 16.1 27.8 56.4 4.2 10.3 26.9
vehicles 1.7 0.7 8.3 24.1 37.4 150.8 1.5 4.1 9.6
(42) 1.2 0.5 5.5 40.5 47.3 357.2 0.2 0.8 1.2
aThese values are given for each ratio for each line of business. The center value is the median, and the values immediately above and below it arethe upper and lower quartiles, respectively.bStandard Industrial Classification (SIC) codes for the lines of business shown are, respectively: SIC #5311, SIC #3571, SIC #5411, SIC #3711.
Source: “Industry Norms and Key Business Ratios,” Dun & Bradstreet, Inc. Reprinted with permission.
TAB LE 2 .5
M02_GITM4126_05_SE_C02.QXD 12/14/07 9:21 AM Page 51
2008
9358
14
Principles of Managerial Finance, Brief Fifth Edition, by Lawrence J. Gitman. Copyright © 2009 by Lawrence J. Gitman.Published by Prentice Hall, a division of Pearson Education, Inc.
Many people mistakenly believe that as long as the firm being analyzed has avalue “better than” the industry average, it can be viewed favorably. However,this “better than average” viewpoint can be misleading. Quite often a ratio valuethat is far better than the norm can indicate problems that, on more carefulanalysis, may be more severe than had the ratio been worse than the industryaverage. It is therefore important to investigate significant deviations to eitherside of the industry standard.
In early 2010, Mary Boyle, the chief financial analyst at Caldwell Manufacturing,a producer of heat exchangers, gathered data on the firm’s financial performanceduring 2009, the year just ended. She calculated a variety of ratios and obtainedindustry averages. She was especially interested in inventory turnover, whichreflects the speed with which the firm moves its inventory from raw materialsthrough production into finished goods and to the customer as a completed sale.Generally, higher values of this ratio are preferred, because they indicate aquicker turnover of inventory. Caldwell Manufacturing’s calculated inventoryturnover for 2009 and the industry average inventory turnover were as follows:
Mary’s initial reaction to these data was that the firm had managed its inven-tory significantly better than the average firm in the industry. The turnover wasnearly 53% faster than the industry average. Upon reflection, however, she real-ized that a very high inventory turnover could also mean very low levels of inven-tory. The consequence of low inventory could be excessive stockouts (insufficientinventory). Discussions with people in the manufacturing and marketing depart-ments did, in fact, uncover such a problem: Inventories during the year wereextremely low, the result of numerous production delays that hindered the firm’sability to meet demand and resulted in lost sales. A ratio that initially appeared toreflect extremely efficient inventory management was actually the symptom of amajor problem.
Time-Series Analysis
Time-series analysis evaluates performance over time. Comparison of current topast performance, using ratios, enables analysts to assess the firm’s progress.Developing trends can be seen by using multiyear comparisons. Any significantyear-to-year changes may be symptomatic of a major problem.
Combined Analysis
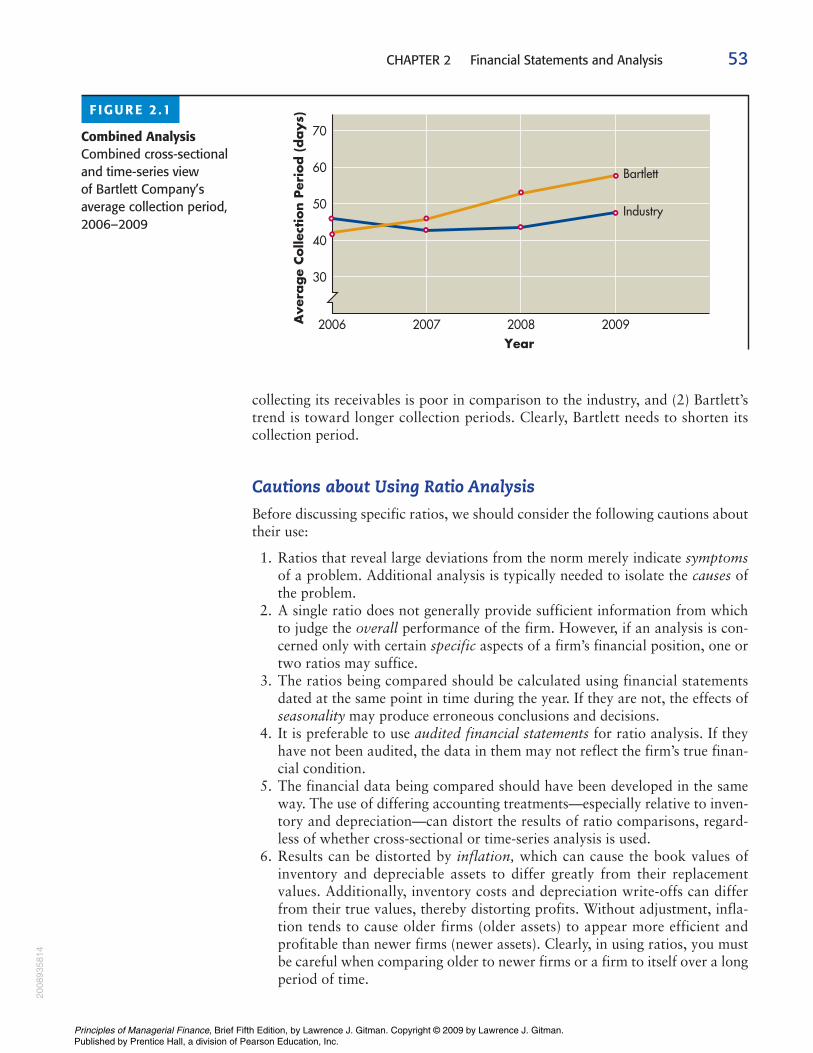
The most informative approach to ratio analysis combines cross-sectional andtime-series analyses. A combined view makes it possible to assess the trend in thebehavior of the ratio in relation to the trend for the industry. Figure 2.1 depictsthis type of approach using the average collection period ratio of BartlettCompany, over the years 2006–2009. This ratio reflects the average amount oftime (in days) it takes the firm to collect bills, and lower values of this ratio gen-erally are preferred. The figure quickly discloses that (1) Bartlett’s effectiveness in
Inventory turnover, 2009
Caldwell Manufacturing 14.8
Industry average 9.7
Example
52 PART ONE Introduction to Managerial Finance
time-series analysisEvaluation of the firm’sfinancial performance overtime using financial ratioanalysis.
Hint Industry averages are not particularly useful for analyzing firms withmultiproduct lines. In the case of multiproduct firms, it is difficult to select theappropriate benchmarkindustry.
M02_GITM4126_05_SE_C02.QXD 12/14/07 9:21 AM Page 52
2008935814
Principles of Managerial Finance, Brief Fifth Edition, by Lawrence J. Gitman. Copyright © 2009 by Lawrence J. Gitman.Published by Prentice Hall, a division of Pearson Education, Inc.
CHAPTER 2 Financial Statements and Analysis 53
collecting its receivables is poor in comparison to the industry, and (2) Bartlett’strend is toward longer collection periods. Clearly, Bartlett needs to shorten itscollection period.
Cautions about Using Ratio Analysis
Before discussing specific ratios, we should consider the following cautions abouttheir use:
1. Ratios that reveal large deviations from the norm merely indicate symptomsof a problem. Additional analysis is typically needed to isolate the causes ofthe problem.
2. A single ratio does not generally provide sufficient information from whichto judge the overall performance of the firm. However, if an analysis is con-cerned only with certain specific aspects of a firm’s financial position, one ortwo ratios may suffice.
3. The ratios being compared should be calculated using financial statementsdated at the same point in time during the year. If they are not, the effects ofseasonality may produce erroneous conclusions and decisions.
4. It is preferable to use audited financial statements for ratio analysis. If theyhave not been audited, the data in them may not reflect the firm’s true finan-cial condition.
5. The financial data being compared should have been developed in the sameway. The use of differing accounting treatments—especially relative to inven-tory and depreciation—can distort the results of ratio comparisons, regard-less of whether cross-sectional or time-series analysis is used.
6. Results can be distorted by inflation, which can cause the book values ofinventory and depreciable assets to differ greatly from their replacementvalues. Additionally, inventory costs and depreciation write-offs can differfrom their true values, thereby distorting profits. Without adjustment, infla-tion tends to cause older firms (older assets) to appear more efficient andprofitable than newer firms (newer assets). Clearly, in using ratios, you mustbe careful when comparing older to newer firms or a firm to itself over a longperiod of time.
Ave
rage
Colle
ctio
n P
erio
d (
days)
70
60
50
40
30
2006 2007 2008 2009
Industry
Bartlett
Year
F IGURE 2 .1
Combined AnalysisCombined cross-sectionaland time-series view of Bartlett Company’saverage collection period,2006–2009
M02_GITM4126_05_SE_C02.QXD 12/14/07 9:21 AM Page 53
2008
9358
14
Principles of Managerial Finance, Brief Fifth Edition, by Lawrence J. Gitman. Copyright © 2009 by Lawrence J. Gitman.Published by Prentice Hall, a division of Pearson Education, Inc.
Categories of Financial Ratios
Financial ratios can be divided for convenience into five basic categories: liq-uidity, activity, debt, profitability, and market ratios. Liquidity, activity, and debtratios primarily measure risk. Profitability ratios measure return. Market ratioscapture both risk and return.
As a rule, the inputs necessary for an effective financial analysis include, at aminimum, the income statement and the balance sheet. We will use the 2009 and2008 income statements and balance sheets for Bartlett Company, presented ear-lier in Tables 2.1 and 2.2, to demonstrate ratio calculations. Note, however, thatthe ratios presented in the remainder of this chapter can be applied to almost anycompany. Of course, many companies in different industries use ratios that focuson aspects peculiar to their industry.
REVIEW QUESTIONS
2–5 With regard to financial ratio analysis, how do the viewpoints held by thefirm’s present and prospective shareholders, creditors, and managementdiffer?
2–6 What is the difference between cross-sectional and time-series ratioanalysis? What is benchmarking?
2–7 What types of deviations from the norm should the analyst pay primaryattention to when performing cross-sectional ratio analysis? Why?
2–8 Why is it preferable to compare ratios calculated using financial state-ments that are dated at the same point in time during the year?
2.3 Liquidity Ratios
The liquidity of a firm is measured by its ability to satisfy its short-term obliga-tions as they come due. Liquidity refers to the solvency of the firm’s overall finan-cial position—the ease with which it can pay its bills. Because a commonprecursor to financial distress and bankruptcy is low or declining liquidity, theseratios can provide early signs of cash flow problems and impending businessfailure. The two basic measures of liquidity are the current ratio and the quick(acid-test) ratio.
Current Ratio
The current ratio, one of the most commonly cited financial ratios, measures thefirm’s ability to meet its short-term obligations. It is expressed as follows:
The current ratio for Bartlett Company in 2009 is
$1,223,000$620,000
5 1.97
Current ratio 5Current assets
Current liabilities
LG3
54 PART ONE Introduction to Managerial Finance
liquidityA firm’s ability to satisfy itsshort-term obligations as theycome due.
current ratioA measure of liquiditycalculated by dividing thefirm’s current assets by itscurrent liabilities.
M02_GITM4126_05_SE_C02.QXD 12/14/07 9:21 AM Page 54
2008935814
Principles of Managerial Finance, Brief Fifth Edition, by Lawrence J. Gitman. Copyright © 2009 by Lawrence J. Gitman.Published by Prentice Hall, a division of Pearson Education, Inc.
CHAPTER 2 Financial Statements and Analysis 55
Generally, the higher the current ratio, the more liquid the firm is consideredto be. A current ratio of 2.0 is occasionally cited as acceptable, but a value’sacceptability depends on the industry in which the firm operates. For example, acurrent ratio of 1.0 would be considered acceptable for a public utility but mightbe unacceptable for a manufacturing firm. The more predictable a firm’s cashflows, the lower the acceptable current ratio. Because Bartlett Company is in abusiness with a relatively predictable annual cash flow, its current ratio of 1.97should be quite acceptable.
Individuals, like corporations, can use financial ratios to analyze andmonitor their performance. Typically personal finance ratios are calculated usingthe personal income and expense statement and personal balance sheet for theperiod of concern. Here we use these statements, presented in the preceding per-sonal finance examples, to demonstrate calculation of Jan and Jon Smith’s liq-uidity ratio for calendar year 2009.
The personal liquidity ratio is calculated by dividing total liquid assets bytotal current debt. It indicates the percent of annual debt obligations that an indi-vidual can meet using current liquid assets. The Smiths’ total liquid assets were$2,225. Their total current debts are $21,539 (total current liabilities of $905�mortgage payments of $16,864�auto loan payments of $2,520�appliance andfurniture payments of $1,250). Substituting these values into the ratio formula,we get:
Liquidity ratio � � � 0.1033, or 10.3%
That ratio indicates that the Smiths can cover only about 10 percent of theirexisting 1-year debt obligations with their current liquid assets. Clearly, theSmiths plan to meet these debt obligations from their income, but this ratio sug-gests that their liquid funds do not provide a large cushion. One of their goalsshould probably be to build up a larger fund of liquid assets to meet unexpectedexpenses.
Quick (Acid-Test) Ratio
The quick (acid-test) ratio is similar to the current ratio except that it excludesinventory, which is generally the least liquid current asset. The generally low liquid-ity of inventory results from two primary factors: (1) many types of inventorycannot be easily sold because they are partially completed items, special-purposeitems, and the like; and (2) inventory is typically sold on credit, which means thatit becomes an account receivable before being converted into cash. The quickratio is calculated as follows:6
Quick ratio 5Current assets 2 Inventory
Current liabilities
$2,225$21,539
Total liquid assets
Total current debts
Personal Finance Example
6. Sometimes the quick ratio is defined as (cash �marketable securities�accounts receivable) �current liabilities. If a firm were to show as current assets items other than cash, marketable securities, accounts receivable, and inven-tories, its quick ratio might vary, depending on the method of calculation.
quick (acid-test) ratioA measure of liquiditycalculated by dividing thefirm’s current assets minusinventory by its currentliabilities.
M02_GITM4126_05_SE_C02.QXD 12/14/07 9:21 AM Page 55
2008
9358
14
Principles of Managerial Finance, Brief Fifth Edition, by Lawrence J. Gitman. Copyright © 2009 by Lawrence J. Gitman.Published by Prentice Hall, a division of Pearson Education, Inc.
The quick ratio for Bartlett Company in 2009 is
A quick ratio of 1.0 or greater is occasionally recommended, but as with thecurrent ratio, what value is acceptable depends largely on the industry. The quickratio provides a better measure of overall liquidity only when a firm’s inventorycannot be easily converted into cash. If inventory is liquid, the current ratio is apreferred measure of overall liquidity.
REVIEW QUESTION
2–9 Under what circumstances would the current ratio be the preferredmeasure of overall firm liquidity? Under what circumstances would thequick ratio be preferred?
2.4 Activity Ratios
Activity ratios measure the speed with which various accounts are converted intosales or cash—inflows or outflows. With regard to current accounts, measures ofliquidity are generally inadequate because differences in the composition of afirm’s current assets and current liabilities can significantly affect its “true”liquidity. It is therefore important to look beyond measures of overall liquidityand to assess the activity (liquidity) of specific current accounts. A number ofratios are available for measuring the activity of the most important currentaccounts, which include inventory, accounts receivable, and accounts payable.7The efficiency with which total assets are used can also be assessed.
Inventory Turnover
Inventory turnover commonly measures the activity, or liquidity, of a firm’sinventory. It is calculated as follows:
Inventory turnover 5Cost of goods sold
Inventory
LG3
$1,223,000 2 $289,000$620,000
5$934,000$620,000
5 1.51
56 PART ONE Introduction to Managerial Finance
7. For convenience, the activity ratios involving these current accounts assume that their end-of-period values aregood approximations of the average account balance during the period—typically 1 year. Technically, when themonth-end balances of inventory, accounts receivable, or accounts payable vary during the year, the average bal-ance, calculated by summing the 12 month-end account balances and dividing the total by 12, should be usedinstead of the year-end value. If month-end balances are unavailable, the average can be approximated by dividingthe sum of the beginning-of-year and end-of-year balances by 2. These approaches ensure a ratio that on the averagebetter reflects the firm’s circumstances. Because the data needed to find averages are generally unavailable to theexternal analyst, year-end values are frequently used to calculate activity ratios for current accounts.
inventory turnoverMeasures the activity, orliquidity, of a firm’s inventory.
activity ratiosMeasure the speed withwhich various accounts areconverted into sales or cash—inflows or outflows.
M02_GITM4126_05_SE_C02.QXD 12/14/07 9:21 AM Page 56
2008935814
Principles of Managerial Finance, Brief Fifth Edition, by Lawrence J. Gitman. Copyright © 2009 by Lawrence J. Gitman.Published by Prentice Hall, a division of Pearson Education, Inc.
CHAPTER 2 Financial Statements and Analysis 57
Applying this relationship to Bartlett Company in 2009 yields
The resulting turnover is meaningful only when it is compared with that of otherfirms in the same industry or to the firm’s past inventory turnover. An inventoryturnover of 20.0 would not be unusual for a grocery store, whereas a commoninventory turnover for an aircraft manufacturer is 4.0.
Inventory turnover can be easily converted into an average age of inventoryby dividing it into 365—the assumed number of days in a year.8 For BartlettCompany, the average age of inventory in 2009 is 50.7 days (365 � 7.2). Thisvalue can also be viewed as the average number of days’ sales in inventory.
Average Collection Period
The average collection period, or average age of accounts receivable, is useful inevaluating credit and collection policies.9 It is arrived at by dividing the averagedaily sales10 into the accounts receivable balance:
The average collection period for Bartlett Company in 2009 is
On the average, it takes the firm 59.7 days to collect an account receivable.The average collection period is meaningful only in relation to the firm’s
credit terms. If Bartlett Company extends 30-day credit terms to customers, anaverage collection period of 59.7 days may indicate a poorly managed credit orcollection department, or both. It is also possible that the lengthened collectionperiod resulted from an intentional relaxation of credit-term enforcement inresponse to competitive pressures. If the firm had extended 60-day credit terms,the 59.7-day average collection period would be quite acceptable. Clearly, addi-tional information is needed to evaluate the effectiveness of the firm’s credit andcollection policies.
$503,000$3,074,000
365
5$503,000$8,422
5 59.7 days
5Accounts receivable
Annual sales365
Average collection period 5Accounts receivable
Average sales per day
Inventory turnover 5$2,088,000$289,000
5 7.2
8. Unless otherwise specified, a 365-day year is used throughout this textbook. This assumption makes the calcula-tions more realistic than would use of a 360-day year consisting of twelve 30-day months.
9. The average collection period is sometimes called the days’ sales outstanding (DSO). A discussion of the evalua-tion and establishment of credit and collection policies is presented in Chapter 13.
10. The formula as presented assumes, for simplicity, that all sales are made on a credit basis. If this is not the case,average credit sales per day should be substituted for average sales per day.
average age of inventoryAverage number of days’ sales in inventory.
average collection periodThe average amount of timeneeded to collect accountsreceivable.
M02_GITM4126_05_SE_C02.QXD 12/14/07 9:21 AM Page 57
2008
9358
14
Principles of Managerial Finance, Brief Fifth Edition, by Lawrence J. Gitman. Copyright © 2009 by Lawrence J. Gitman.Published by Prentice Hall, a division of Pearson Education, Inc.
Average Payment Period
The average payment period, or average age of accounts payable, is calculated inthe same manner as the average collection period:
The difficulty in calculating this ratio stems from the need to find annual pur-chases,11 a value not available in published financial statements. Ordinarily, pur-chases are estimated as a given percentage of cost of goods sold. If we assumethat Bartlett Company’s purchases equaled 70 percent of its cost of goods sold in2009, its average payment period is
This figure is meaningful only in relation to the average credit terms extended tothe firm. If Bartlett Company’s suppliers have extended, on average, 30-daycredit terms, an analyst would give Bartlett a low credit rating. Prospectivelenders and suppliers of trade credit are most interested in the average paymentperiod because it provides insight into the firm’s bill-paying patterns.
Total Asset Turnover
The total asset turnover indicates the efficiency with which the firm uses its assetsto generate sales. Total asset turnover is calculated as follows:
The value of Bartlett Company’s total asset turnover in 2009 is
This means the company turns over its assets 0.85 times per year.Generally, the higher a firm’s total asset turnover, the more efficiently its assets
have been used. This measure is probably of greatest interest to management,because it indicates whether the firm’s operations have been financially efficient.
$3,074,000$3,597,000
5 0.85
Total asset turnover 5Sales
Total assets
$382,0000.70 3 $2,088,000
365
5$382,000$4,004
5 95.4 days
5Accounts payableAnnual purchases
365
Average payment period 5Accounts payable
Average purchases per day
58 PART ONE Introduction to Managerial Finance
total asset turnoverIndicates the efficiency withwhich the firm uses its assetsto generate sales.
Hint The higher the cost of the new assets, the larger the denominator and thus thesmaller the ratio. Therefore,because of inflation and the use of historical costs, firmswith newer assets will tend tohave lower turnovers thanthose with older assets.
11. Technically, annual credit purchases—rather than annual purchases—should be used in calculating this ratio.For simplicity, this refinement is ignored here.
average payment periodThe average amount of timeneeded to pay accountspayable.
M02_GITM4126_05_SE_C02.QXD 12/14/07 9:21 AM Page 58
2008935814
Principles of Managerial Finance, Brief Fifth Edition, by Lawrence J. Gitman. Copyright © 2009 by Lawrence J. Gitman.Published by Prentice Hall, a division of Pearson Education, Inc.
CHAPTER 2 Financial Statements and Analysis 59
REVIEW QUESTION
2–10 To assess the firm’s average collection period and average payment periodratios, what additional information is needed, and why?
2.5 Debt Ratios
The debt position of a firm indicates the amount of other people’s money beingused to generate profits. In general, the financial analyst is most concerned withlong-term debts, because these commit the firm to a stream of contractual pay-ments over the long run. The more debt a firm has, the greater its risk of beingunable to meet its contractual debt payments. Because creditors’ claims must besatisfied before the earnings can be distributed to shareholders, current andprospective shareholders pay close attention to the firm’s ability to repay debts.Lenders are also concerned about the firm’s indebtedness.
In general, the more debt a firm uses in relation to its total assets, the greaterits financial leverage. Financial leverage is the magnification of risk and returnthrough the use of fixed-cost financing, such as debt and preferred stock. Themore fixed-cost debt a firm uses, the greater will be its expected risk and return.
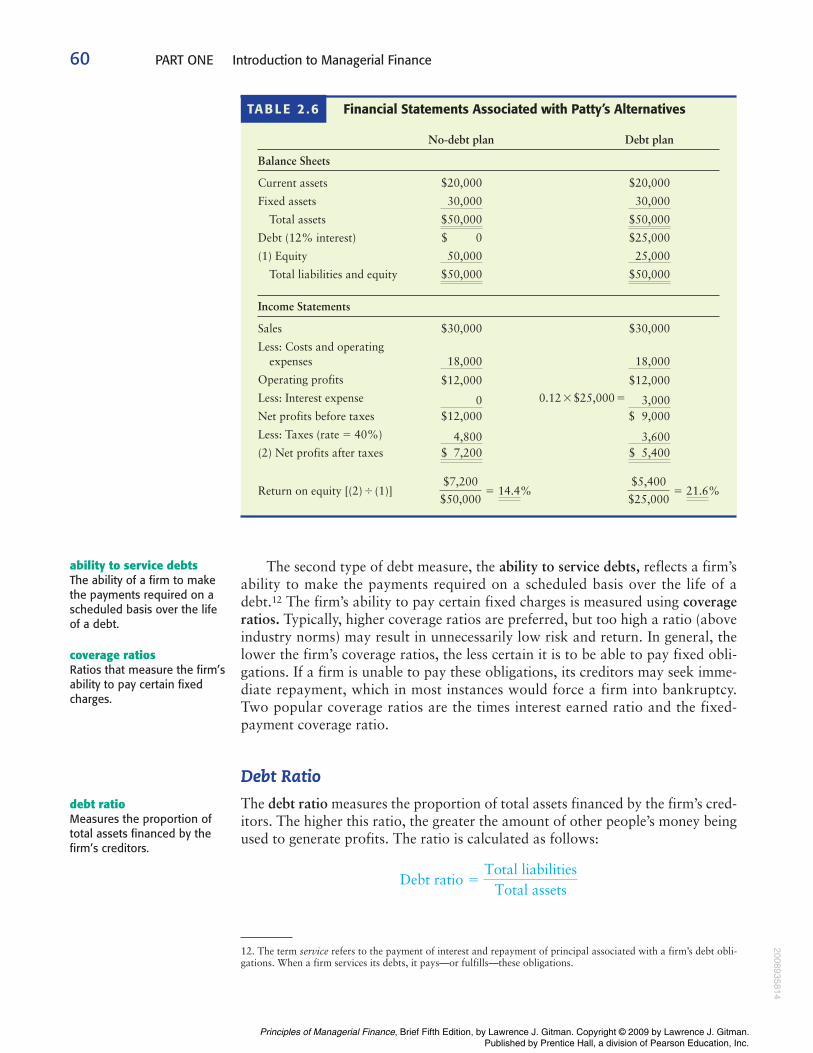
Patty Akers is in the process of incorporating her new business. After muchanalysis she determined that an initial investment of $50,000—$20,000 in cur-rent assets and $30,000 in fixed assets—is necessary. These funds can be obtainedin either of two ways. The first is the no-debt plan, under which she would investthe full $50,000 without borrowing. The other alternative, the debt plan, involvesinvesting $25,000 and borrowing the balance of $25,000 at 12% annual interest.
Regardless of which alternative she chooses, Patty expects sales to average$30,000, costs and operating expenses to average $18,000, and earnings to betaxed at a 40% rate. Projected balance sheets and income statements associatedwith the two plans are summarized in Table 2.6 (see page 60). The no-debt planresults in after-tax profits of $7,200, which represent a 14.4% rate of return onPatty’s $50,000 investment. The debt plan results in $5,400 of after-tax profits,which represent a 21.6% rate of return on Patty’s investment of $25,000. Thedebt plan provides Patty with a higher rate of return, but the risk of this plan isalso greater, because the annual $3,000 of interest must be paid before receipt ofearnings.
The example demonstrates that with increased debt comes greater risk aswell as higher potential return. Therefore, the greater the financial leverage, thegreater the potential risk and return. A detailed discussion of the impact of debton the firm’s risk, return, and value is included in Chapter 11. Here, we empha-size the use of financial debt ratios to assess externally a firm’s debt position.
There are two general types of debt measures: measures of the degree ofindebtedness and measures of the ability to service debts. The degree of indebted-ness measures the amount of debt relative to other significant balance sheetamounts. A popular measure of the degree of indebtedness is the debt ratio.
Example
LG4
financial leverageThe magnification of risk andreturn through the use offixed-cost financing, such asdebt and preferred stock.
degree of indebtednessMeasures the amount of debtrelative to other significantbalance sheet amounts.
M02_GITM4126_05_SE_C02.QXD 12/14/07 9:21 AM Page 59
2008
9358
14
Principles of Managerial Finance, Brief Fifth Edition, by Lawrence J. Gitman. Copyright © 2009 by Lawrence J. Gitman.Published by Prentice Hall, a division of Pearson Education, Inc.
The second type of debt measure, the ability to service debts, reflects a firm’sability to make the payments required on a scheduled basis over the life of adebt.12 The firm’s ability to pay certain fixed charges is measured using coverageratios. Typically, higher coverage ratios are preferred, but too high a ratio (aboveindustry norms) may result in unnecessarily low risk and return. In general, thelower the firm’s coverage ratios, the less certain it is to be able to pay fixed obli-gations. If a firm is unable to pay these obligations, its creditors may seek imme-diate repayment, which in most instances would force a firm into bankruptcy.Two popular coverage ratios are the times interest earned ratio and the fixed-payment coverage ratio.
Debt Ratio
The debt ratio measures the proportion of total assets financed by the firm’s cred-itors. The higher this ratio, the greater the amount of other people’s money beingused to generate profits. The ratio is calculated as follows:
Debt ratio 5Total liabilities
Total assets
60 PART ONE Introduction to Managerial Finance
debt ratioMeasures the proportion oftotal assets financed by thefirm’s creditors.
12. The term service refers to the payment of interest and repayment of principal associated with a firm’s debt obli-gations. When a firm services its debts, it pays—or fulfills—these obligations.
coverage ratiosRatios that measure the firm’sability to pay certain fixedcharges.
Financial Statements Associated with Patty’s Alternatives
No-debt plan Debt plan
Balance Sheets
Current assets $20,000 $20,000
Fixed assets
Total assets
Debt (12% interest) $ 0 $25,000
(1) Equity
Total liabilities and equity
Income Statements
Sales $30,000 $30,000
Less: Costs and operating expenses
Operating profits
Less: Interest expense 0.12�$25,000�
Net profits before taxes $12,000 $ 9,000
Less: Taxes (rate � 40%)
(2) Net profits after taxes
Return on equity [(2)� (1)]$5,400
$25,0005 21.6%
$7,200
$50,0005 14.4%
$ 5,400$ 7,2003,6004,800
3,0000
$12,000$12,000
18,00018,000
$50,000$50,000
25,00050,000
$50,000$50,000
30,00030,000
TABLE 2 .6
ability to service debtsThe ability of a firm to makethe payments required on ascheduled basis over the lifeof a debt.
M02_GITM4126_05_SE_C02.QXD 12/14/07 9:21 AM Page 60
2008935814
Principles of Managerial Finance, Brief Fifth Edition, by Lawrence J. Gitman. Copyright © 2009 by Lawrence J. Gitman.Published by Prentice Hall, a division of Pearson Education, Inc.
CHAPTER 2 Financial Statements and Analysis 61
The debt ratio for Bartlett Company in 2009 is
This value indicates that the company has financed close to half of its assets withdebt. The higher this ratio, the greater the firm’s degree of indebtedness and themore financial leverage it has.
Times Interest Earned Ratio
The times interest earned ratio, sometimes called the interest coverage ratio,measures the firm’s ability to make contractual interest payments. The higher itsvalue, the better able the firm is to fulfill its interest obligations. The timesinterest earned ratio is calculated as follows:
The figure for earnings before interest and taxes is the same as that for operatingprofits shown in the income statement. Applying this ratio to Bartlett Companyyields the following 2009 value:
The times interest earned ratio for Bartlett Company seems acceptable. A value ofat least 3.0—and preferably closer to 5.0—is often suggested. The firm’s earningsbefore interest and taxes could shrink by as much as 78 percent [(4.5 � 1.0) �4.5], and the firm would still be able to pay the $93,000 in interest it owes. Thusit has a good margin of safety.
Fixed-Payment Coverage Ratio
The fixed-payment coverage ratio measures the firm’s ability to meet all fixed-payment obligations, such as loan interest and principal, lease payments, and pre-ferred stock dividends.13 As is true of the times interest earned ratio, the higherthis value, the better. The formula for the fixed-payment coverage ratio is
where T is the corporate tax rate applicable to the firm’s income. The term 1/(1�T)is included to adjust the after-tax principal and preferred stock dividend payments
Fixed-paymentcoverageratio
5Earnings before interest and taxes 1 Lease payments
Interest 1 Lease payments15(Principal payments 1 Preferred stock dividends)3 31>(1 2 T )4 6
Times interest earned ratio 5$418,000$93,000
5 4.5
Times interest earned ratio 5Earnings before interest and taxes
Interest
$1,643,000$3,597,000
5 0.457 5 45.7%
times interest earned ratioMeasures the firm’s ability to make contractual interestpayments; sometimes calledthe interest coverage ratio.
13. Although preferred stock dividends, which are stated at the time of issue, can be “passed” (not paid) at theoption of the firm’s directors, it is generally believed that the payment of such dividends is necessary. This text there-fore treats the preferred stock dividend as a contractual obligation, to be paid as a fixed amount, as scheduled.
fixed-payment coverageratioMeasures the firm’s ability to meet all fixed-paymentobligations.
M02_GITM4126_05_SE_C02.QXD 12/14/07 9:21 AM Page 61
2008
9358
14
Principles of Managerial Finance, Brief Fifth Edition, by Lawrence J. Gitman. Copyright © 2009 by Lawrence J. Gitman.Published by Prentice Hall, a division of Pearson Education, Inc.
back to a before-tax equivalent that is consistent with the before-tax values of allother terms. Applying the formula to Bartlett Company’s 2009 data yields
Because the earnings available are nearly twice as large as its fixed-payment obli-gations, the firm appears safely able to meet the latter.
Like the times interest earned ratio, the fixed-payment coverage ratio meas-ures risk. The lower the ratio, the greater the risk to both lenders and owners; thegreater the ratio, the lower the risk. This ratio allows interested parties to assessthe firm’s ability to meet additional fixed-payment obligations without beingdriven into bankruptcy.
REVIEW QUESTIONS
2–11 What is financial leverage?2–12 What ratio measures the firm’s degree of indebtedness? What ratios assess
the firm’s ability to service debts?
2.6 Profitability Ratios
There are many measures of profitability. As a group, these measures enable ana-lysts to evaluate the firm’s profits with respect to a given level of sales, a certainlevel of assets, or the owners’ investment. Without profits, a firm could notattract outside capital. Owners, creditors, and management pay close attentionto boosting profits because of the great importance the market places on earnings.
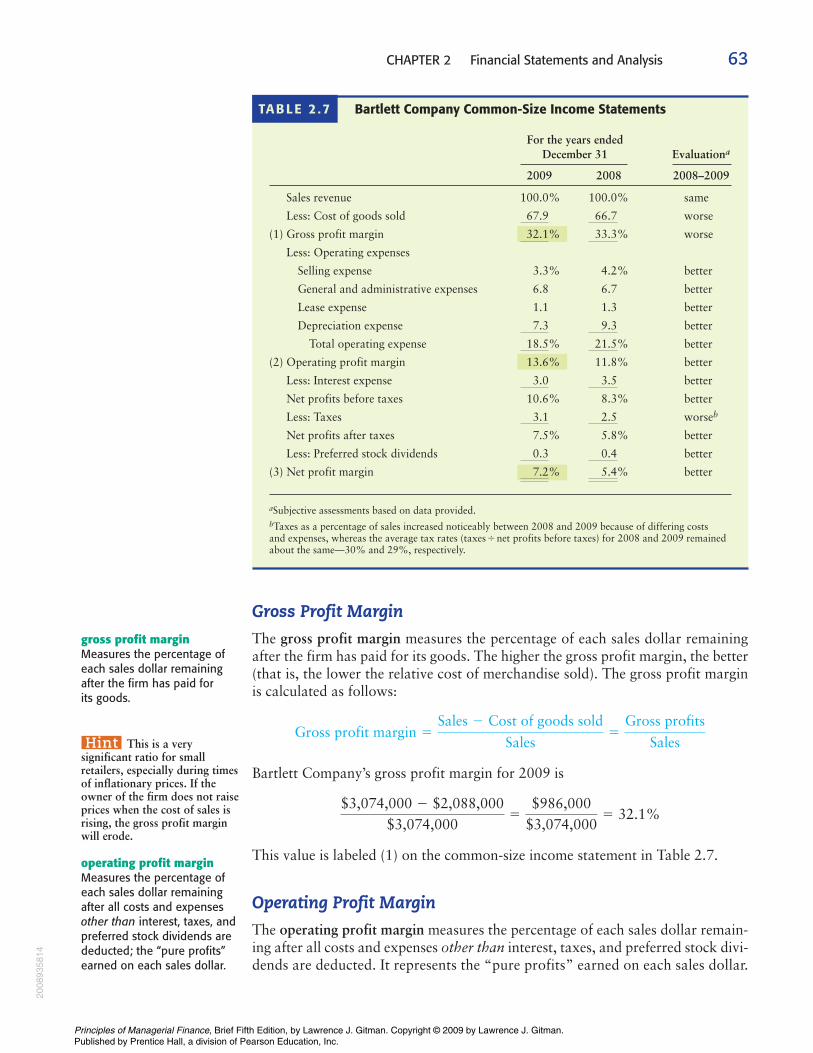
Common-Size Income Statements
A popular tool for evaluating profitability in relation to sales is the common-sizeincome statement. Each item on this statement is expressed as a percentage ofsales. Common-size income statements are especially useful in comparing per-formance across years. Three frequently cited ratios of profitability that can beread directly from the common-size income statement are (1) the gross profitmargin, (2) the operating profit margin, and (3) the net profit margin.
Common-size income statements for 2009 and 2008 for Bartlett Companyare presented and evaluated in Table 2.7. These statements reveal that the firm’scost of goods sold increased from 66.7 percent of sales in 2008 to 67.9 percent in2009, resulting in a worsening gross profit margin. However, thanks to a decreasein total operating expenses, the firm’s net profit margin rose from 5.4 percent ofsales in 2008 to 7.2 percent in 2009. The decrease in expenses more than com-pensated for the increase in the cost of goods sold. A decrease in the firm’s 2009interest expense (3.0 percent of sales versus 3.5 percent in 2008) added to theincrease in 2009 profits.
LG5
5$453,000$242,000
5 1.9
Fixed-paymentcoverage ratio
5$418,000 1 $35,000
$93,0001 $35,000 1 5($71,0001 $10,000) 3 31>(12 0.29) 46
62 PART ONE Introduction to Managerial Finance
common-size incomestatementAn income statement inwhich each item is expressedas a percentage of sales.
M02_GITM4126_05_SE_C02.QXD 12/14/07 9:21 AM Page 62
2008935814
Principles of Managerial Finance, Brief Fifth Edition, by Lawrence J. Gitman. Copyright © 2009 by Lawrence J. Gitman.Published by Prentice Hall, a division of Pearson Education, Inc.
CHAPTER 2 Financial Statements and Analysis 63
Gross Profit Margin
The gross profit margin measures the percentage of each sales dollar remainingafter the firm has paid for its goods. The higher the gross profit margin, the better(that is, the lower the relative cost of merchandise sold). The gross profit marginis calculated as follows:
Bartlett Company’s gross profit margin for 2009 is
This value is labeled (1) on the common-size income statement in Table 2.7.
Operating Profit Margin
The operating profit margin measures the percentage of each sales dollar remain-ing after all costs and expenses other than interest, taxes, and preferred stock divi-dends are deducted. It represents the “pure profits” earned on each sales dollar.
$3,074,000 2 $2,088,000$3,074,000
5$986,000
$3,074,0005 32.1%
Gross profit margin 5Sales 2 Cost of goods sold
Sales5
Gross profits
Sales
Bartlett Company Common-Size Income Statements
For the years endedDecember 31 Evaluationa
2009 2008 2008–2009
Sales revenue 100.0% 100.0% same
Less: Cost of goods sold worse
(1) Gross profit margin % % worse
Less: Operating expenses
Selling expense 3.3% 4.2% better
General and administrative expenses 6.8 6.7 better
Lease expense 1.1 1.3 better
Depreciation expense better
Total operating expense % % better
(2) Operating profit margin 13.6% 11.8% better
Less: Interest expense better
Net profits before taxes 10.6% 8.3% better
Less: Taxes worseb
Net profits after taxes 7.5% 5.8% better
Less: Preferred stock dividends better
(3) Net profit margin % % better
aSubjective assessments based on data provided.bTaxes as a percentage of sales increased noticeably between 2008 and 2009 because of differing costs and expenses, whereas the average tax rates (taxes�net profits before taxes) for 2008 and 2009 remainedabout the same—30% and 29%, respectively.
5.47.2
0.40.3
2.53.1
3.53.0
21.518.5
9.37.3
33.332.1
66.767.9
TAB LE 2 .7
gross profit marginMeasures the percentage ofeach sales dollar remainingafter the firm has paid for its goods.
Hint This is a verysignificant ratio for smallretailers, especially during timesof inflationary prices. If theowner of the firm does not raiseprices when the cost of sales isrising, the gross profit marginwill erode.
operating profit marginMeasures the percentage ofeach sales dollar remainingafter all costs and expensesother than interest, taxes, andpreferred stock dividends arededucted; the “pure profits”earned on each sales dollar.
M02_GITM4126_05_SE_C02.QXD 12/14/07 9:21 AM Page 63
2008
9358
14
Principles of Managerial Finance, Brief Fifth Edition, by Lawrence J. Gitman. Copyright © 2009 by Lawrence J. Gitman.Published by Prentice Hall, a division of Pearson Education, Inc.
Operating profits are “pure” because they measure only the profits earned on oper-ations and ignore interest, taxes, and preferred stock dividends. A high operatingprofit margin is preferred. The operating profit margin is calculated as follows:
Bartlett Company’s operating profit margin for 2009 is
This value is labeled (2) on the common-size income statement in Table 2.7.
Net Profit Margin
The net profit margin measures the percentage of each sales dollar remainingafter all costs and expenses, including interest, taxes, and preferred stock divi-dends, have been deducted. The higher the firm’s net profit margin, the better.The net profit margin is calculated as follows:
Bartlett Company’s net profit margin for 2009 is
This value is labeled (3) on the common-size income statement in Table 2.7.The net profit margin is a commonly cited measure of the firm’s success with
respect to earnings on sales. “Good” net profit margins differ considerably acrossindustries. A net profit margin of 1 percent or less would not be unusual for agrocery store, whereas a net profit margin of 10 percent would be low for a retailjewelry store.
Earnings per Share (EPS)
The firm’s earnings per share (EPS) is generally of interest to present or prospec-tive stockholders and management. As we noted earlier, EPS represents thenumber of dollars earned during the period on behalf of each outstanding shareof common stock. Earnings per share is calculated as follows:
Bartlett Company’s earnings per share in 2009 is
This figure represents the dollar amount earned on behalf of each outstandingshare of common stock. The dollar amount of cash actually distributed to each
$221,00076,262
5 $2.90
Earnings per share 5Earnings available for common stockholders
Number of shares of common stock outstanding
$221,000$3,074,000
5 7.2%
Net profit margin 5Earnings available for common stockholders
Sales
$418,000$3,074,000
5 13.6%
Operating profit margin 5Operating profits
Sales
64 PART ONE Introduction to Managerial Finance
Hint EPS represents thedollar amount earned on behalf of each outstandingshare of common stock—notthe amount of earnings actuallydistributed to shareholders.
Hint The net profit marginis sometimes defined as netprofits after taxes divided bysales. The formula used hereplaces greater emphasis on thecommon stockholders.
net profit marginMeasures the percentage ofeach sales dollar remainingafter all costs and expenses,including interest, taxes, andpreferred stock dividends,have been deducted.
M02_GITM4126_05_SE_C02.QXD 12/14/07 9:21 AM Page 64
2008935814
Principles of Managerial Finance, Brief Fifth Edition, by Lawrence J. Gitman. Copyright © 2009 by Lawrence J. Gitman.Published by Prentice Hall, a division of Pearson Education, Inc.
CHAPTER 2 Financial Statements and Analysis 65
shareholder is the dividend per share (DPS), which, as noted in Bartlett Com-pany’s income statement (Table 2.1), rose to $1.29 in 2009 from $0.75 in 2008.EPS is closely watched by the investing public and is considered an importantindicator of corporate success.
Return on Total Assets (ROA)
The return on total assets (ROA), often called the return on investment (ROI),measures the overall effectiveness of management in generating profits with itsavailable assets. The higher the firm’s return on total assets, the better. The returnon total assets is calculated as follows:
Bartlett Company’s return on total assets in 2009 is
This value indicates that the company earned 6.1 cents on each dollar of assetinvestment.
Return on Common Equity (ROE)
The return on common equity (ROE) measures the return earned on the commonstockholders’ investment in the firm. Generally, the higher this return, the betteroff are the owners. Return on common equity is calculated as follows:
This ratio for Bartlett Company in 2009 is
Note that the value for common stock equity ($1,754,000) was found by sub-tracting the $200,000 of preferred stock equity from the total stockholders’equity of $1,954,000 (see Bartlett Company’s 2009 balance sheet in Table 2.2).The calculated ROE of 12.6 percent indicates that during 2009 Bartlett earned12.6 cents on each dollar of common stock equity.
REVIEW QUESTIONS
2–13 What three ratios of profitability are found on a common-size incomestatement?
2–14 What would explain a firm’s having a high gross profit margin and a lownet profit margin?
2–15 Which measure of profitability is probably of greatest interest to theinvesting public? Why?
$221,000$1,754,000
5 12.6%
Return on common equity 5Earnings available for common stockholders
Common stock equity
$221,000$3,597,000
5 6.1%
Return on total assets 5Earnings available for common stockholders
Total assets
return on total assets (ROA)Measures the overalleffectiveness of managementin generating profits with itsavailable assets; also calledthe return on investment(ROI).
Hint Some firms use thismeasure as a simple decisiontechnique for evaluatingproposed fixed-assetinvestments.
return on common equity (ROE)Measures the return earnedon the common stockholders’investment in the firm.
M02_GITM4126_05_SE_C02.QXD 12/14/07 9:21 AM Page 65
2008
9358
14
Principles of Managerial Finance, Brief Fifth Edition, by Lawrence J. Gitman. Copyright © 2009 by Lawrence J. Gitman.Published by Prentice Hall, a division of Pearson Education, Inc.
2.7 Market Ratios
Market ratios relate the firm’s market value, as measured by its current shareprice, to certain accounting values. These ratios give insight into how wellinvestors in the marketplace feel the firm is doing in terms of risk and return.They tend to reflect, on a relative basis, the common stockholders’ assessment ofall aspects of the firm’s past and expected future performance. Here we considertwo popular market ratios, one that focuses on earnings and another that con-siders book value.
Price/Earnings (P/E) Ratio
The price/earnings (P/E) ratio is commonly used to assess the owners’ appraisal ofshare value. The P/E ratio measures the amount that investors are willing to payfor each dollar of a firm’s earnings. The level of this ratio indicates the degree ofconfidence that investors have in the firm’s future performance. The higher the P/Eratio, the greater the investor confidence. The P/E ratio is calculated as follows:
If Bartlett Company’s common stock at the end of 2009 was selling at $32.25,using the EPS of $2.90, the P/E ratio at year-end 2009 is
This figure indicates that investors were paying $11.10 for each $1.00 of earn-ings. The P/E ratio is most informative when applied in cross-sectional analysisusing an industry average P/E ratio or the P/E ratio of a benchmark firm.
Market/Book (M/B) Ratio
The market/book (M/B) ratio provides an assessment of how investors view thefirm’s performance. It relates the market value of the firm’s shares to their book—strict accounting—value. To calculate the firm’s M/B ratio, we first need to findthe book value per share of common stock:
Substituting the appropriate values for Bartlett Company from its 2009 balancesheet, we get
The formula for the market/book ratio is
Market>book (M>B) ratio 5Market price per share of common stock
Book value per share of common stock
Book value per shareof common stock
5$1,754,000
76,2625 $23.00
Book value per shareof common stock
5Common stock equity
Number of shares of common stock outstanding
$32.25$2.90
5 11.1
Price>earnings (P>E) ratio 5Market price per share of common stock
Earnings per share
LG5
66 PART ONE Introduction to Managerial Finance
market/book (M/B) ratioProvides an assessment ofhow investors view the firm’sperformance. Firms expectedto earn high returns relative to their risk typically sell athigher M/B multiples.
market ratiosRelate a firm’s market value,as measured by its currentshare price, to certainaccounting values.
price/earnings (P/E) ratioMeasures the amount thatinvestors are willing to pay for each dollar of a firm’searnings; the higher the P/Eratio, the greater the investorconfidence.
M02_GITM4126_05_SE_C02.QXD 12/14/07 9:21 AM Page 66
2008935814
Principles of Managerial Finance, Brief Fifth Edition, by Lawrence J. Gitman. Copyright © 2009 by Lawrence J. Gitman.Published by Prentice Hall, a division of Pearson Education, Inc.
CHAPTER 2 Financial Statements and Analysis 67
Substituting Bartlett Company’s end of 2009 common stock price of $32.25 andits $23.00 book value per share of common stock (calculated above) into the M/Bratio formula, we get
This M/B ratio means that investors are currently paying $1.40 for each $1.00 ofbook value of Bartlett Company’s stock.
The stocks of firms that are expected to perform well—improve profits,increase their market share, or launch successful products—typically sell at higherM/B ratios than the stocks of firms with less attractive outlooks. Simply stated,firms expected to earn high returns relative to their risk typically sell at higherM/B multiples. Clearly, Bartlett’s future prospects are being viewed favorably byinvestors, who are willing to pay more than its book value for the firm’s shares.Like P/E ratios, M/B ratios are typically assessed cross-sectionally, to get a feel forthe firm’s return and risk compared to peer firms.
REVIEW QUESTION
2–16 How do the price/earnings (P/E) ratio and the market/book (M/B) ratioprovide a feel for the firm’s return and risk?
2.8 A Complete Ratio Analysis
Analysts frequently wish to take an overall look at the firm’s financial perform-ance and status. Here we consider two popular approaches to a complete ratioanalysis: (1) summarizing all ratios and (2) the DuPont system of analysis. Thesummary analysis approach tends to view all aspects of the firm’s financial activi-ties to isolate key areas of responsibility. The DuPont system acts as a search tech-nique aimed at finding the key areas responsible for the firm’s financial condition.
Summarizing All Ratios
We can use Bartlett Company’s ratios to perform a complete ratio analysis usingboth cross-sectional and time-series analysis approaches. The 2009 ratio valuescalculated earlier and the ratio values calculated for 2007 and 2008 for BartlettCompany, along with the industry average ratios for 2009, are summarized inTable 2.8 (see pages 68 and 69), which also shows the formula used to calculateeach ratio. Using these data, we can discuss the five key aspects of Bartlett’s per-formance—liquidity, activity, debt, profitability, and market.
Liquidity
The overall liquidity of the firm seems to exhibit a reasonably stable trend,having been maintained at a level that is relatively consistent with the industryaverage in 2009. The firm’s liquidity seems to be good.
LG6
Market>book (M>B) ratio 5$32.25$23.00
5 1.40
M02_GITM4126_05_SE_C02.QXD 12/14/07 9:21 AM Page 67
2008
9358
14
Principles of Managerial Finance, Brief Fifth Edition, by Lawrence J. Gitman. Copyright © 2009 by Lawrence J. Gitman.Published by Prentice Hall, a division of Pearson Education, Inc.
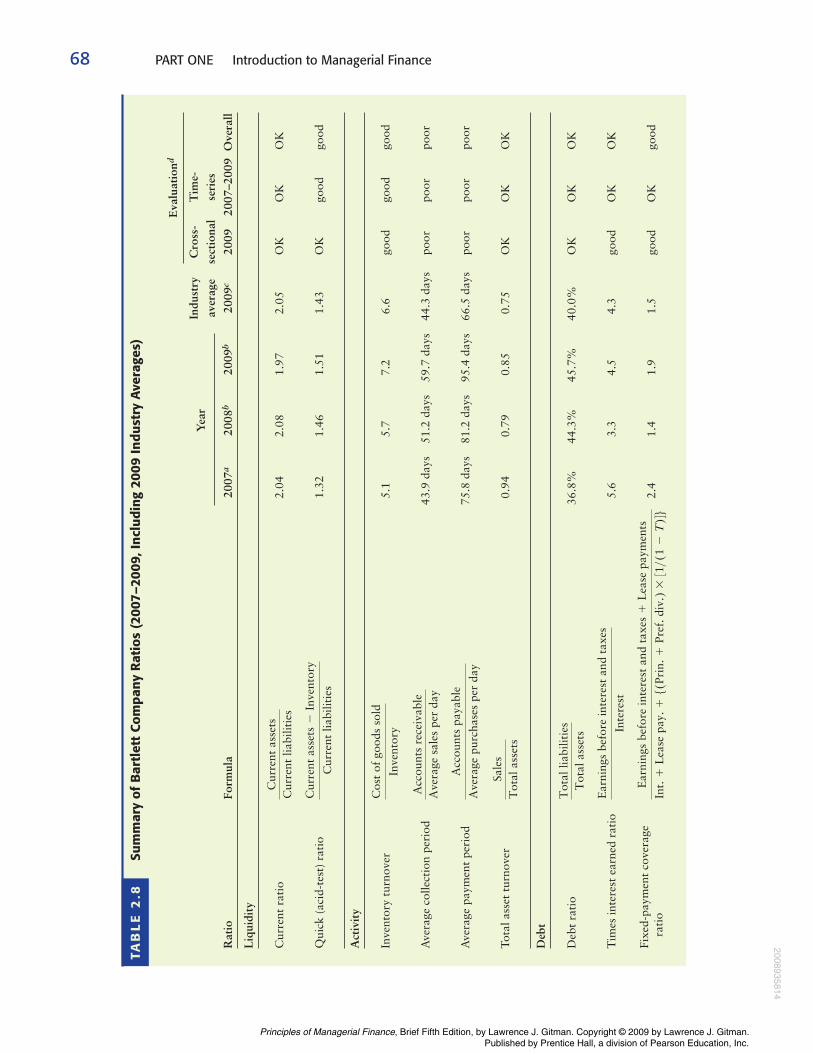
68 PART ONE Introduction to Managerial Finance
Sum
mar
y o
f B
artl
ett
Co
mp
any
Rat
ios
(200
7–20
09, I
ncl
ud
ing
2009
In
du
stry
Ave
rage
s)
Eva
luat
iond
Yea
rIn
dust
ryC
ross
-T
ime-
aver
age
sect
iona
lse
ries
Rat
ioFo
rmul
a20
07a
2008
b20
09b
2009
c20
0920
07–2
009
Ove
rall
Liq
uidi
ty
Cur
rent
rat
io2.
042.
081.
972.
05O
KO
KO
K
Qui
ck (
acid
-tes
t) r
atio
1.32
1.46
1.51
1.43
OK
good
good
Act
ivit
y
Inve
ntor
y tu
rnov
er5.
15.
77.
26.
6go
odgo
odgo
od
Ave
rage
col
lect
ion
peri
od43
.9 d
ays
51.2
day
s59
.7 d
ays
44.3
day
spo
orpo
orpo
or
Ave
rage
pay
men
t pe
riod
75.8
day
s81
.2 d
ays
95.4
day
s66
.5 d
ays
poor
poor
poor
Tota
l ass
et t
urno
ver
0.94
0.79
0.85
0.75
OK
OK
OK
Deb
t
Deb
t ra
tio
36.8
%44
.3%
45.7
%40
.0%
OK
OK
OK
Tim
es in
tere
st e
arne
d ra
tio
5.6
3.3
4.5
4.3
good
OK
OK
Fixe
d-pa
ymen
t co
vera
ge
rati
o2.
41.
41.
91.
5go
odO
Kgo
odE
arni
ngs
befo
re in
tere
st a
nd t
axes
1L
ease
pay
men
ts
Int.
1L
ease
pay
.1
5(Pr
in.
1Pr
ef. d
iv.)
331>
(12
T)46
Ear
ning
s be
fore
inte
rest
and
tax
es
Inte
rest
Tot
al li
abili
ties
Tot
al a
sset
s
Sale
sT
otal
ass
ets
Acc
ount
s pa
yabl
e
Ave
rage
pur
chas
es p
er d
ay
Acc
ount
s re
ceiv
able
Ave
rage
sal
es p
er d
ay
Cos
t of
goo
ds s
old
Inve
ntor
y
Cur
rent
ass
ets
2In
vent
ory
Cur
rent
liab
iliti
es
Cur
rent
ass
ets
Cur
rent
liab
iliti
es
TAB
LE
2.8
M02_GITM4126_05_SE_C02.QXD 12/14/07 9:21 AM Page 68
2008935814
Principles of Managerial Finance, Brief Fifth Edition, by Lawrence J. Gitman. Copyright © 2009 by Lawrence J. Gitman.Published by Prentice Hall, a division of Pearson Education, Inc.
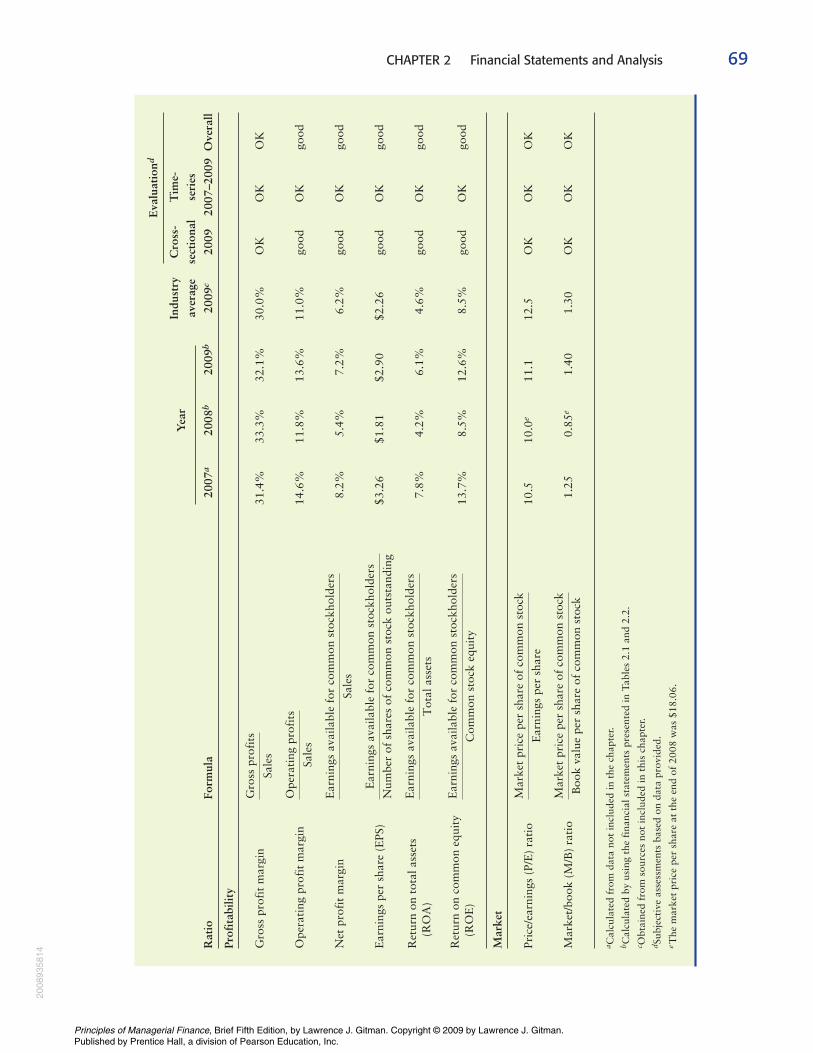
CHAPTER 2 Financial Statements and Analysis 69
Eva
luat
iond
Yea
rIn
dust
ryC
ross
-T
ime-
aver
age
sect
iona
lse
ries
Rat
ioFo
rmul
a20
07a
2008
b20
09b
2009
c20
0920
07–2
009
Ove
rall
Prof
itab
ility
Gro
ss p
rofi
t m
argi
n31
.4%
33.3
%32
.1%
30.0
%O
KO
KO
K
Ope
rati
ng p
rofi
t m
argi
n14
.6%
11.8
%13
.6%
11.0
%go
odO
Kgo
od
Net
pro
fit
mar
gin
8.2%
5.4%
7.2%
6.2%
good
OK
good
Ear
ning
s pe
r sh
are
(EPS
)$3
.26
$1.8
1$2
.90
$2.2
6go
odO
Kgo
od
Ret
urn
on t
otal
ass
ets
(RO
A)
7.8%
4.2%
6.1%
4.6%
good
OK
good
Ret
urn
on c
omm
on e
quit
y (R
OE
)13
.7%
8.5%
12.6
%8.
5%go
odO
Kgo
od
Mar
ket
Pric
e/ea
rnin
gs (
P/E
) ra
tio
10.5
10.0
e11
.112
.5O
KO
KO
K
Mar
ket/
book
(M
/B)
rati
o1.
250.
85e
1.40
1.30
OK
OK
OK
a Cal
cula
ted
from
dat
a no
t in
clud
ed in
the
cha
pter
.b C
alcu
late
d by
usi
ng t
he f
inan
cial
sta
tem
ents
pre
sent
ed in
Tab
les
2.1
and
2.2.
c Obt
aine
d fr
om s
ourc
es n
ot in
clud
ed in
thi
s ch
apte
r.d S
ubje
ctiv
e as
sess
men
ts b
ased
on
data
pro
vide
d.eT
he m
arke
t pr
ice
per
shar
e at
the
end
of
2008
was
$18
.06.
Mar
ket
pric
e pe
r sh
are
of c
omm
on s
tock
Boo
k va
lue
per
shar
e of
com
mon
sto
ck
Mar
ket
pric
e pe
r sh
are
of c
omm
on s
tock
Ear
ning
s pe
r sh
are
Ear
ning
s av
aila
ble
for
com
mon
sto
ckho
lder
s
Com
mon
sto
ck e
quit
y
Ear
ning
s av
aila
ble
for
com
mon
sto
ckho
lder
s
Tot
al a
sset
s
Ear
ning
s av
aila
ble
for
com
mon
sto
ckho
lder
s
Num
ber
of s
hare
s of
com
mon
sto
ck o
utst
andi
ng
Ear
ning
s av
aila
ble
for
com
mon
sto
ckho
lder
s
Sale
s
Ope
rati
ng p
rofi
ts
Sale
s
Gro
ss p
rofi
ts
Sale
s
M02_GITM4126_05_SE_C02.QXD 12/14/07 9:21 AM Page 69
2008
9358
14
Principles of Managerial Finance, Brief Fifth Edition, by Lawrence J. Gitman. Copyright © 2009 by Lawrence J. Gitman.Published by Prentice Hall, a division of Pearson Education, Inc.
Activity
Bartlett Company’s inventory appears to be in good shape. Its inventory manage-ment seems to have improved, and in 2009 it performed at a level above that ofthe industry. The firm may be experiencing some problems with accounts receiv-able. The average collection period seems to have crept up above that of theindustry. Bartlett also appears to be slow in paying its bills; it pays nearly 30 daysslower than the industry average. This could adversely affect the firm’s creditstanding. Although overall liquidity appears to be good, the management ofreceivables and payables should be examined. Bartlett’s total asset turnoverreflects a decline in the efficiency of total asset utilization between 2007 and2008. Although in 2009 it rose to a level considerably above the industry average,it appears that the pre-2008 level of efficiency has not yet been achieved.
Debt
Bartlett Company’s indebtedness increased over the 2007–2009 period and iscurrently above the industry average. Although this increase in the debt ratiocould be cause for alarm, the firm’s ability to meet interest and fixed-paymentobligations improved, from 2008 to 2009, to a level that outperforms theindustry. The firm’s increased indebtedness in 2008 apparently caused a deterio-ration in its ability to pay debt adequately. However, Bartlett has evidentlyimproved its income in 2009 so that it is able to meet its interest and fixed-pay-ment obligations at a level consistent with the average in the industry. In sum-mary, it appears that although 2008 was an off year, the company’s improvedability to pay debts in 2009 compensates for its increased degree of indebtedness.
Profitability
Bartlett’s profitability relative to sales in 2009 was better than the average com-pany in the industry, although it did not match the firm’s 2007 performance.Although the gross profit margin was better in 2008 and 2009 than in 2007,higher levels of operating and interest expenses in 2008 and 2009 appear to havecaused the 2009 net profit margin to fall below that of 2007. However, BartlettCompany’s 2009 net profit margin is quite favorable when compared to theindustry average.
The firm’s earnings per share, return on total assets, and return on commonequity behaved much as its net profit margin did over the 2007–2009 period.Bartlett appears to have experienced either a sizable drop in sales between 2007and 2008 or a rapid expansion in assets during that period. The exceptionallyhigh 2009 level of return on common equity suggests that the firm is performingquite well. The firm’s above-average returns—net profit margin, EPS, ROA, andROE—may be attributable to the fact that it is more risky than average. A lookat market ratios is helpful in assessing risk.
Market
Investors have greater confidence in the firm in 2009 than in the prior two years,as reflected in the price/earnings (P/E) ratio of 11.1. However, this ratio is belowthe industry average. The P/E ratio suggests that the firm’s risk has declined butremains above that of the average firm in its industry. The firm’s market/book
70 PART ONE Introduction to Managerial Finance
M02_GITM4126_05_SE_C02.QXD 12/14/07 9:21 AM Page 70
2008935814
Principles of Managerial Finance, Brief Fifth Edition, by Lawrence J. Gitman. Copyright © 2009 by Lawrence J. Gitman.Published by Prentice Hall, a division of Pearson Education, Inc.
CHAPTER 2 Financial Statements and Analysis 71
(M/B) ratio has increased over the 2007–2009 period, and in 2009 it exceeds theindustry average. This implies that investors are optimistic about the firm’s futureperformance. The P/E and M/B ratios reflect the firm’s increased profitabilityover the 2007–2009 period: Investors expect to earn high future returns as com-pensation for the firm’s above-average risk.
In summary, the firm appears to be growing and has recently undergone anexpansion in assets, financed primarily through the use of debt. The 2008–2009period seems to reflect a phase of adjustment and recovery from the rapid growthin assets. Bartlett’s sales, profits, and other performance factors seem to begrowing with the increase in the size of the operation. In addition, the marketresponse to these accomplishments appears to have been positive. In short, thefirm seems to have done well in 2009.
DuPont System of Analysis
The DuPont system of analysis is used to dissect the firm’s financial statementsand to assess its financial condition. It merges the income statement and balancesheet into two summary measures of profitability: return on total assets (ROA)and return on common equity (ROE). Figure 2.2 (see page 72) depicts the basicDuPont system with Bartlett Company’s 2009 monetary and ratio values. Theupper portion of the chart summarizes the income statement activities; the lowerportion summarizes the balance sheet activities.
DuPont Formula
The DuPont system first brings together the net profit margin, which measuresthe firm’s profitability on sales, with its total asset turnover, which indicates howefficiently the firm has used its assets to generate sales. In the DuPont formula,the product of these two ratios results in the return on total assets (ROA):
Substituting the appropriate formulas into the equation and simplifying results inthe formula given earlier,
When the 2009 values of the net profit margin and total asset turnover forBartlett Company, calculated earlier, are substituted into the DuPont formula, theresult is
This value is the same as that calculated directly in an earlier section (page 65).The DuPont formula enables the firm to break down its return into profit-on-sales and efficiency-of-asset-use components. Typically, a firm with a low netprofit margin has a high total asset turnover, which results in a reasonably goodreturn on total assets. Often, the opposite situation exists.
ROA 5 7.2% 3 0.85 5 6.1%
ROA 5
Earnings available forcommon stockholders
Sales3
SalesTotal assets
5
Earnings available forcommon stockholders
Total assets
ROA 5 Net profit margin 3 Total asset turnover
DuPont system of analysisSystem used to dissect thefirm’s financial statementsand to assess its financialcondition.
DuPont formulaMultiplies the firm’s net profitmargin by its total assetturnover to calculate the firm’sreturn on total assets (ROA).
M02_GITM4126_05_SE_C02.QXD 12/14/07 9:21 AM Page 71
2008
9358
14
Principles of Managerial Finance, Brief Fifth Edition, by Lawrence J. Gitman. Copyright © 2009 by Lawrence J. Gitman.Published by Prentice Hall, a division of Pearson Education, Inc.
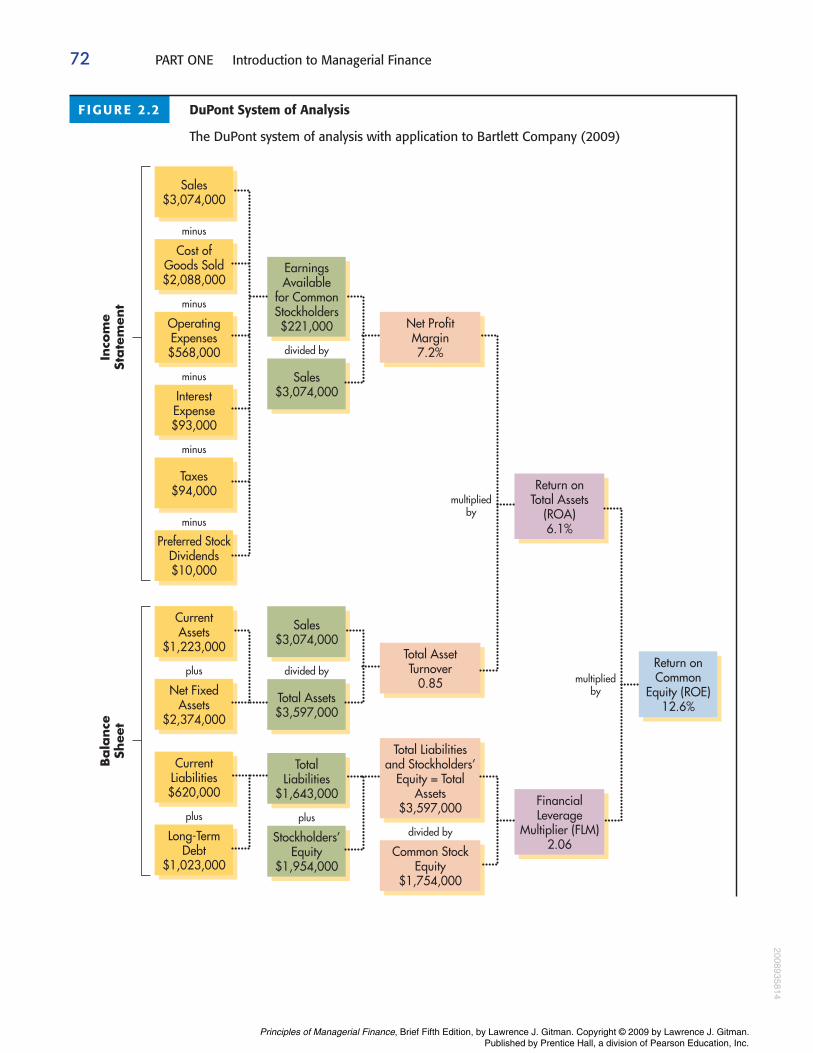
72 PART ONE Introduction to Managerial Finance
Sales$3,074,000
minus
Cost ofGoods Sold$2,088,000
minus
divided by
OperatingExpenses$568,000In
com
eSt
ate
men
t
minus
InterestExpense$93,000
minus
Taxes$94,000
minus
Preferred StockDividends$10,000
EarningsAvailable
for CommonStockholders$221,000 Net Profit
Margin7.2%
Sales$3,074,000
divided by
multipliedby
multipliedby
Sales$3,074,000
Total AssetTurnover
0.85
Common StockEquity
$1,754,000
Total Assets$3,597,000
Return onCommon
Equity (ROE)12.6%
plusdivided by
TotalLiabilities
$1,643,000 FinancialLeverage
Multiplier (FLM)2.06
Return onTotal Assets
(ROA)6.1%
Total Liabilitiesand Stockholders’
Equity = TotalAssets
$3,597,000
Stockholders’Equity
$1,954,000
CurrentAssets
$1,223,000
plus
Net FixedAssets
$2,374,000
CurrentLiabilities$620,000
plus
Long-TermDebt
$1,023,000
Bala
nce
Shee
tF IGURE 2 .2 DuPont System of Analysis
The DuPont system of analysis with application to Bartlett Company (2009)
M02_GITM4126_05_SE_C02.QXD 12/14/07 9:21 AM Page 72
2008935814
Principles of Managerial Finance, Brief Fifth Edition, by Lawrence J. Gitman. Copyright © 2009 by Lawrence J. Gitman.Published by Prentice Hall, a division of Pearson Education, Inc.
Modified DuPont Formula
The second step in the DuPont system employs the modified DuPont formula.This formula relates the firm’s return on total assets (ROA) to its return oncommon equity (ROE). The latter is calculated by multiplying the return on totalassets (ROA) by the financial leverage multiplier (FLM), which is the ratio oftotal assets to common stock equity:
ROE�ROA�FLM
Substituting the appropriate formulas into the equation and simplifying results inthe formula given earlier,
Use of the financial leverage multiplier (FLM) to convert the ROA into theROE reflects the impact of financial leverage on owners’ return. Substituting thevalues for Bartlett Company’s ROA of 6.1 percent, calculated earlier, andBartlett’s FLM of 2.06 ($3,597,000 total assets � $1,754,000 common stockequity) into the modified DuPont formula yields
ROE�6.1%�2.06�12.6%
The 12.6 percent ROE calculated by using the modified DuPont formula is thesame as that calculated directly (page 65).
Applying the DuPont System
The advantage of the DuPont system is that it allows the firm to break its returnon equity into a profit-on-sales component (net profit margin), an efficiency-of-asset-use component (total asset turnover), and a use-of-financial-leverage com-ponent (financial leverage multiplier). The total return to owners therefore can beanalyzed in these important dimensions.
The use of the DuPont system of analysis as a diagnostic tool is best explainedusing Figure 2.2. Beginning with the rightmost value—the ROE—the financialanalyst moves to the left, dissecting and analyzing the inputs to the formula to iso-late the probable cause of the resulting above-average (or below-average) value.
For the sake of demonstration, let’s ignore all industry average data in Table 2.8and assume that Bartlett’s ROE of 12.6 % is actually below the industry average.Moving to the left in Figure 2.2, we would examine the inputs to the ROE—theROA and the FLM—relative to the industry averages. Let’s assume that the FLM isin line with the industry average, but the ROA is below the industry average.Moving farther to the left, we examine the two inputs to the ROA—the net profitmargin and total asset turnover. Assume that the net profit margin is in line with theindustry average, but the total asset turnover is below the industry average.Moving still farther to the left, we find that whereas the firm’s sales are consistentwith the industry value, Bartlett’s total assets have grown significantly during thepast year. Looking farther to the left, we would review the firm’s activity ratios forcurrent assets. Let’s say that whereas the firm’s inventory turnover is in line with theindustry average, its average collection period is well above the industry average.
Example
5
Earnings available forcommon stockholders
Common stock equityROE 5
Earnings available forcommon stockholders
Total assets3
Total assetsCommon stock equity
CHAPTER 2 Financial Statements and Analysis 73
modified DuPont formulaRelates the firm’s return ontotal assets (ROA) to its returnon common equity (ROE)using the financial leveragemultiplier (FLM).
financial leveragemultiplier (FLM)The ratio of the firm’s totalassets to its common stockequity.
M02_GITM4126_05_SE_C02.QXD 12/14/07 9:21 AM Page 73
2008
9358
14
Principles of Managerial Finance, Brief Fifth Edition, by Lawrence J. Gitman. Copyright © 2009 by Lawrence J. Gitman.Published by Prentice Hall, a division of Pearson Education, Inc.
74 PART ONE Introduction to Managerial Finance
We can readily trace the possible problem back to its cause: Bartlett’s lowROE is primarily the consequence of slow collections of accounts receivable,which resulted in high levels of receivables and therefore high levels of totalassets. The high total assets slowed Bartlett’s total asset turnover, driving down itsROA, which then drove down its ROE. By using the DuPont system of analysis todissect Bartlett’s overall returns as measured by its ROE, we found that slow col-lections of receivables caused the below-industry-average ROE. Clearly, the firmneeds to better manage its credit operations.
REVIEW QUESTIONS
2–17 Financial ratio analysis is often divided into five areas: liquidity, activity,debt, profitability, and market ratios. Differentiate each of these areas ofanalysis from the others. Which is of the greatest concern to creditors?
2–18 Describe how you would use a large number of ratios to perform a com-plete ratio analysis of the firm.
2–19 What three areas of analysis are combined in the modified DuPont for-mula? Explain how the DuPont system of analysis is used to dissect thefirm’s results and isolate their causes.
Summary
Focus on Value
Financial managers review and analyze the firm’s financial statements periodi-cally, both to uncover developing problems and to assess the firm’s progresstoward achieving its goals. These actions are aimed at preserving and creatingvalue for the firm’s owners. Financial ratios enable financial managers to mon-itor the pulse of the firm and its progress toward its strategic goals. Althoughfinancial statements and financial ratios rely on accrual concepts, they can pro-vide useful insights into important aspects of risk and return (cash flow) thataffect share price.
Review of Learning Goals
Review the contents of the stockholders’ report and the procedures forconsolidating international financial statements. The annual stockholders’report, which publicly owned corporations must provide to stockholders,
documents the firm’s financial activities of the past year. It includes the letter tostockholders and various subjective and factual information. It also containsfour key financial statements: the income statement, the balance sheet, the state-ment of stockholders’ equity (or its abbreviated form, the statement of retainedearnings), and the statement of cash flows. Notes describing the technicalaspects of the financial statements follow. Financial statements of companiesthat have operations whose cash flows are denominated in one or more foreigncurrencies must be translated into dollars in accordance with FASB StandardNo. 52.
LG1
M02_GITM4126_05_SE_C02.QXD 12/14/07 9:21 AM Page 74
2008935814
Principles of Managerial Finance, Brief Fifth Edition, by Lawrence J. Gitman. Copyright © 2009 by Lawrence J. Gitman.Published by Prentice Hall, a division of Pearson Education, Inc.

CHAPTER 2 Financial Statements and Analysis 75
Understand who uses financial ratios, and how. Ratio analysis enablesstockholders, lenders, and the firm’s managers to evaluate the firm’s finan-cial performance. It can be performed on a cross-sectional or a time-series
basis. Benchmarking is a popular type of cross-sectional analysis. Users of ratiosshould understand the cautions that apply to their use.
Use ratios to analyze a firm’s liquidity and activity. Liquidity, or the abilityof the firm to pay its bills as they come due, can be measured by the currentratio and the quick (acid-test) ratio. Activity ratios measure the speed with
which accounts are converted into sales or cash—inflows or outflows. Theactivity of inventory can be measured by its turnover; that of accounts receivableby the average collection period; and that of accounts payable by the averagepayment period. Total asset turnover measures the efficiency with which the firmuses its assets to generate sales.
Discuss the relationship between debt and financial leverage and the ratiosused to analyze a firm’s debt. The more debt a firm uses, the greater itsfinancial leverage, which magnifies both risk and return. Financial debt
ratios measure both the degree of indebtedness and the ability to service debts.A common measure of indebtedness is the debt ratio. The ability to pay fixedcharges can be measured by times interest earned and fixed-payment coverageratios.
Use ratios to analyze a firm’s profitability and its market value. Thecommon-size income statement, which shows all items as a percentage of sales, can be used to determine gross profit margin, operating profit
margin, and net profit margin. Other measures of profitability include earningsper share, return on total assets, and return on common equity. Market ratiosinclude the price/earnings ratio and the market/book ratio.
Use a summary of financial ratios and the DuPont system of analysis toperform a complete ratio analysis. A summary of all ratios can be used to perform a complete ratio analysis using cross-sectional and time-series
analysis. The DuPont system of analysis is a diagnostic tool used to find the key areas responsible for the firm’s financial performance. It enables the firm to break the return on common equity into three components: profit on sales,efficiency of asset use, and use of financial leverage.
Self-Test Problems (Solutions in Appendix B)
ST2–1 Ratio formulas and interpretations Without referring to the text, indicate for eachof the following ratios the formula for calculating it and the kinds of problems, ifany, the firm is likely to have if that ratio is too high relative to the industry average.What if the ratio is too low relative to the industry average? Create a table similar tothe one on the next page and fill in the empty blocks.
LG5
LG4
LG3
LG6
LG5
LG4
LG3
LG2
M02_GITM4126_05_SE_C02.QXD 12/14/07 9:21 AM Page 75
2008
9358
14
Principles of Managerial Finance, Brief Fifth Edition, by Lawrence J. Gitman. Copyright © 2009 by Lawrence J. Gitman.Published by Prentice Hall, a division of Pearson Education, Inc.
ST2–2 Balance sheet completion using ratios Complete the 2009 balance sheet forO’Keefe Industries using the information that follows it.
The following financial data for 2009 are also available:(1) Sales totaled $1,800,000.(2) The gross profit margin was 25%.(3) Inventory turnover was 6.0.(4) There are 365 days in the year.(5) The average collection period was 40 days.(6) The current ratio was 1.60.(7) The total asset turnover ratio was 1.20.(8) The debt ratio was 60%.
Warm-Up Exercises A blue box (■) indicates exercises available in .
E2–1 You are a summer intern at the office of a local tax-preparer. To test your basicknowledge of financial statements, your manager, who graduated from your almamater 2 years ago, gives you the following list of accounts and asks you to prepare asimple income statement using those accounts.
LG1
LG5
LG4
LG3
76 PART ONE Introduction to Managerial Finance
O’Keefe IndustriesBalance Sheet
December 31, 2009
Assets Liabilities and Stockholders’ Equity
Cash $32,720 Accounts payable $120,000
Marketable securities 25,000 Notes payable ________
Accounts receivable _______ Accruals
Inventories _______ Total current liabilities ________
Total current assets _______ Long-term debt ________
Net fixed assets _______ Stockholders’ equity
Total assets Total liabilities andstockholders’ equity $
$
$600,000
20,000
Ratio Too high Too low
Current ratio �
Inventory turnover �
Times interest earned �
Gross profit margin �
Return on total assets �
Price/earnings (P/E) ratio �
M02_GITM4126_05_SE_C02.QXD 12/14/07 9:21 AM Page 76
2008935814
Principles of Managerial Finance, Brief Fifth Edition, by Lawrence J. Gitman. Copyright © 2009 by Lawrence J. Gitman.Published by Prentice Hall, a division of Pearson Education, Inc.
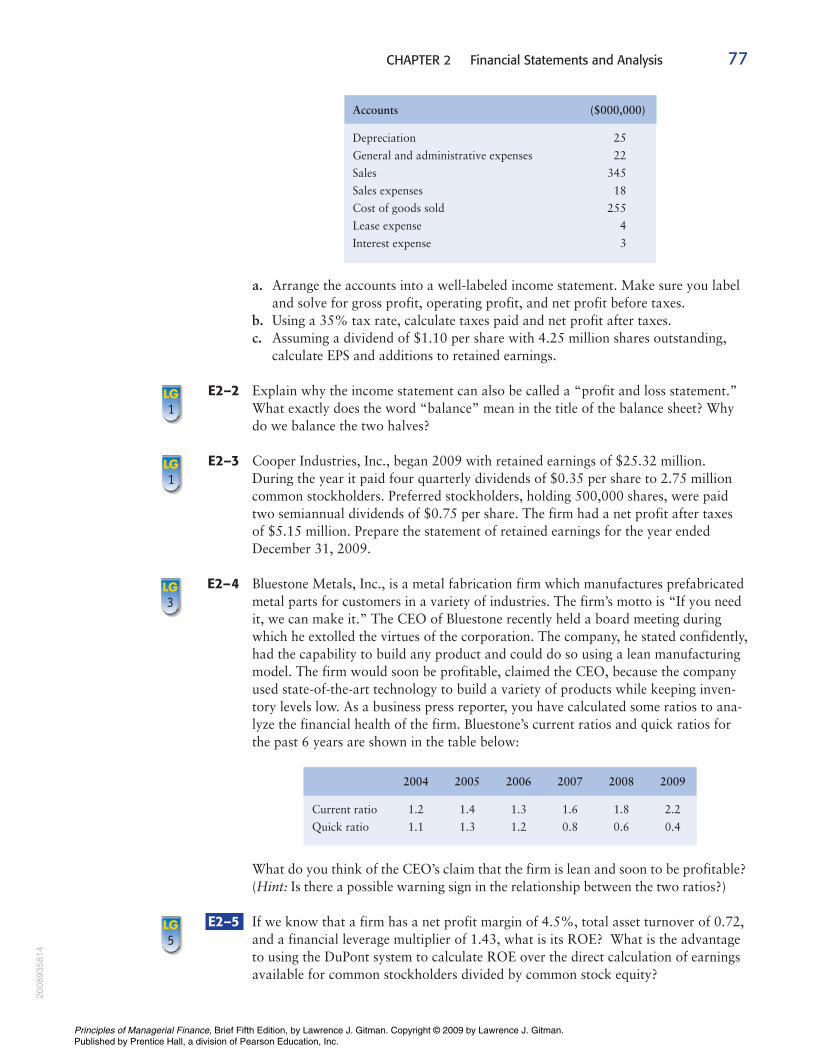
CHAPTER 2 Financial Statements and Analysis 77
a. Arrange the accounts into a well-labeled income statement. Make sure you labeland solve for gross profit, operating profit, and net profit before taxes.
b. Using a 35% tax rate, calculate taxes paid and net profit after taxes.c. Assuming a dividend of $1.10 per share with 4.25 million shares outstanding,
calculate EPS and additions to retained earnings.
E2–2 Explain why the income statement can also be called a “profit and loss statement.”What exactly does the word “balance” mean in the title of the balance sheet? Whydo we balance the two halves?
E2–3 Cooper Industries, Inc., began 2009 with retained earnings of $25.32 million.During the year it paid four quarterly dividends of $0.35 per share to 2.75 millioncommon stockholders. Preferred stockholders, holding 500,000 shares, were paidtwo semiannual dividends of $0.75 per share. The firm had a net profit after taxesof $5.15 million. Prepare the statement of retained earnings for the year endedDecember 31, 2009.
E2–4 Bluestone Metals, Inc., is a metal fabrication firm which manufactures prefabricatedmetal parts for customers in a variety of industries. The firm’s motto is “If you needit, we can make it.” The CEO of Bluestone recently held a board meeting duringwhich he extolled the virtues of the corporation. The company, he stated confidently,had the capability to build any product and could do so using a lean manufacturingmodel. The firm would soon be profitable, claimed the CEO, because the companyused state-of-the-art technology to build a variety of products while keeping inven-tory levels low. As a business press reporter, you have calculated some ratios to ana-lyze the financial health of the firm. Bluestone’s current ratios and quick ratios forthe past 6 years are shown in the table below:
What do you think of the CEO’s claim that the firm is lean and soon to be profitable?(Hint: Is there a possible warning sign in the relationship between the two ratios?)
E2–5 If we know that a firm has a net profit margin of 4.5%, total asset turnover of 0.72,and a financial leverage multiplier of 1.43, what is its ROE? What is the advantageto using the DuPont system to calculate ROE over the direct calculation of earningsavailable for common stockholders divided by common stock equity?
LG5
2004 2005 2006 2007 2008 2009
Current ratio 1.2 1.4 1.3 1.6 1.8 2.2
Quick ratio 1.1 1.3 1.2 0.8 0.6 0.4
LG3
LG1
LG1
Accounts ($000,000)
Depreciation 25
General and administrative expenses 22
Sales 345
Sales expenses 18
Cost of goods sold 255
Lease expense 4
Interest expense 3
M02_GITM4126_05_SE_C02.QXD 12/14/07 9:21 AM Page 77
2008
9358
14
Principles of Managerial Finance, Brief Fifth Edition, by Lawrence J. Gitman. Copyright © 2009 by Lawrence J. Gitman.Published by Prentice Hall, a division of Pearson Education, Inc.
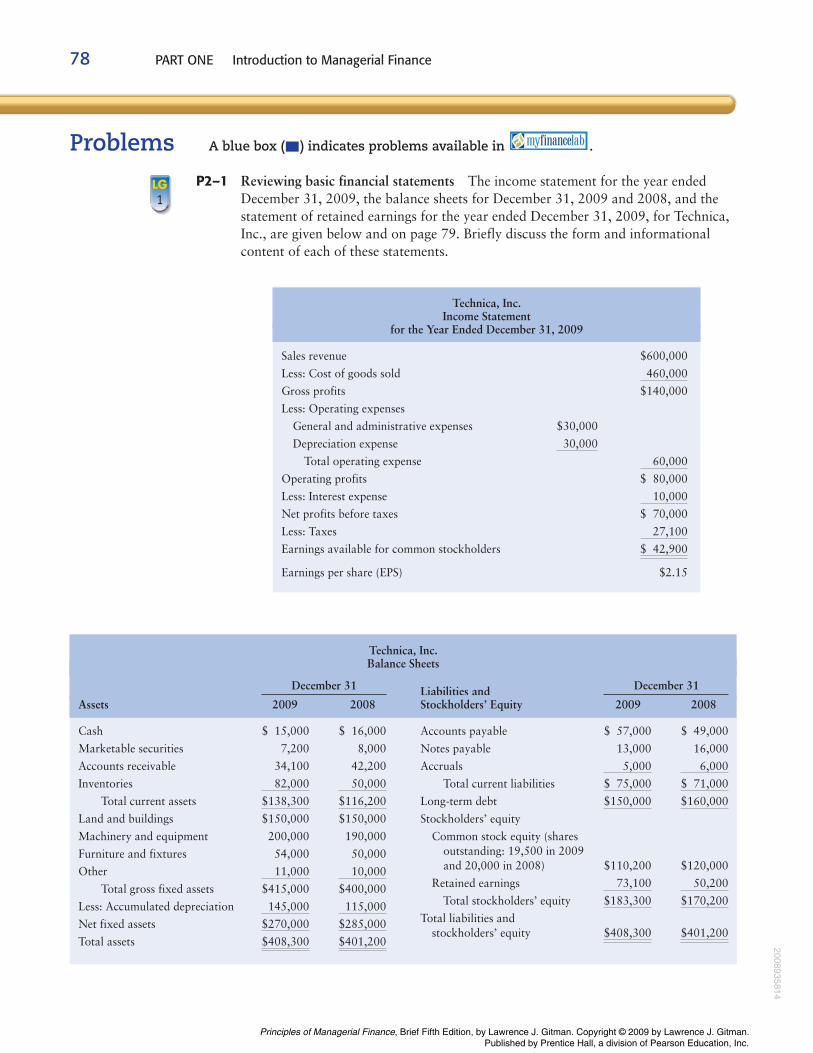
78 PART ONE Introduction to Managerial Finance
Technica, Inc.Income Statement
for the Year Ended December 31, 2009
Sales revenue $600,000
Less: Cost of goods sold
Gross profits $140,000
Less: Operating expenses
General and administrative expenses $30,000
Depreciation expense
Total operating expense
Operating profits $ 80,000
Less: Interest expense
Net profits before taxes $ 70,000
Less: Taxes
Earnings available for common stockholders
Earnings per share (EPS) $2.15
$ 42,900
27,100
10,000
60,000
30,000
460,000
Technica, Inc.Balance Sheets
December 31 Liabilities and December 31
Assets 2009 2008 Stockholders’ Equity 2009 2008
Cash $ 15,000 $ 16,000
Marketable securities 7,200 8,000
Accounts receivable 34,100 42,200
Inventories
Total current assets
Land and buildings $150,000 $150,000
Machinery and equipment 200,000 190,000
Furniture and fixtures 54,000 50,000
Other
Total gross fixed assets $415,000 $400,000
Less: Accumulated depreciation
Net fixed assets
Total assets $401,200$408,300
$285,000$270,000
115,000145,000
10,00011,000
$116,200$138,300
50,00082,000
Problems A blue box (■) indicates problems available in .
P2–1 Reviewing basic financial statements The income statement for the year endedDecember 31, 2009, the balance sheets for December 31, 2009 and 2008, and thestatement of retained earnings for the year ended December 31, 2009, for Technica,Inc., are given below and on page 79. Briefly discuss the form and informationalcontent of each of these statements.
LG1
Accounts payable $ 57,000 $ 49,000
Notes payable 13,000 16,000
Accruals
Total current liabilities
Long-term debt
Stockholders’ equity
Common stock equity (shares outstanding: 19,500 in 2009 and 20,000 in 2008) $110,200 $120,000
Retained earnings
Total stockholders’ equity
Total liabilities and stockholders’ equity $401,200$408,300
$170,200$183,300
50,20073,100
$160,000$150,000
$ 71,000$ 75,000
6,0005,000
M02_GITM4126_05_SE_C02.QXD 12/14/07 9:21 AM Page 78
2008935814
Principles of Managerial Finance, Brief Fifth Edition, by Lawrence J. Gitman. Copyright © 2009 by Lawrence J. Gitman.Published by Prentice Hall, a division of Pearson Education, Inc.
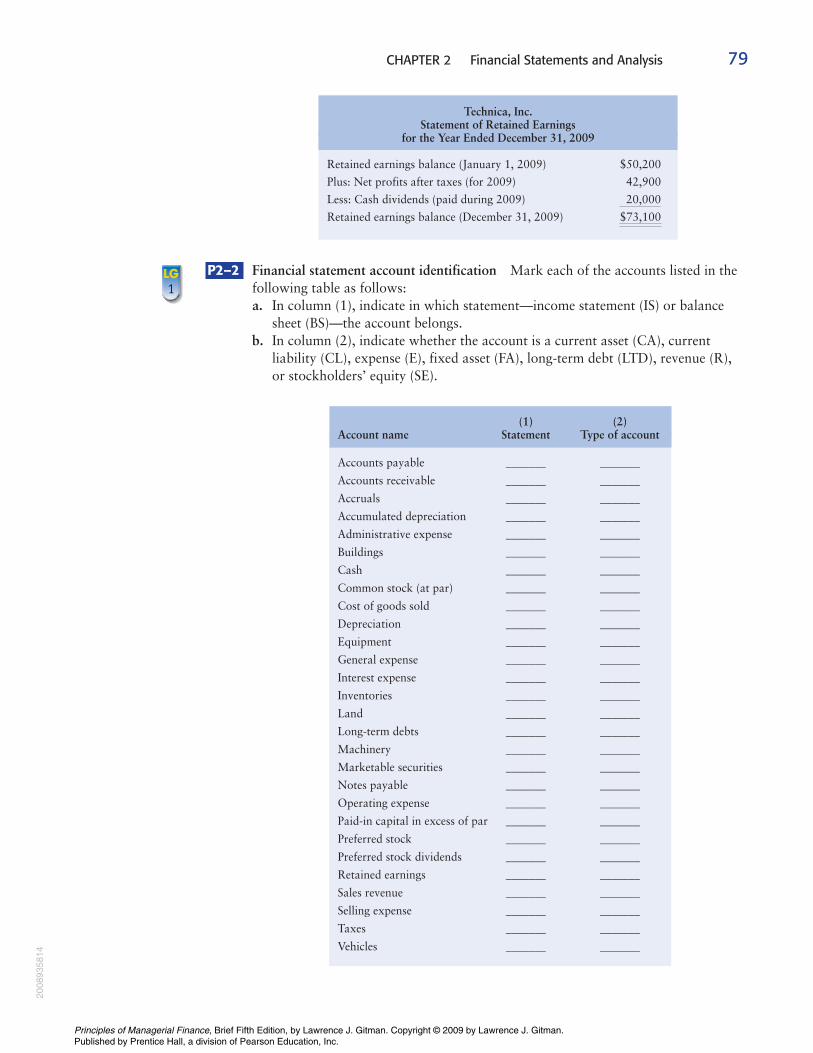
CHAPTER 2 Financial Statements and Analysis 79
Technica, Inc.Statement of Retained Earnings
for the Year Ended December 31, 2009
Retained earnings balance (January 1, 2009) $50,200
Plus: Net profits after taxes (for 2009) 42,900
Less: Cash dividends (paid during 2009)
Retained earnings balance (December 31, 2009) $73,100
20,000
P2–2 Financial statement account identification Mark each of the accounts listed in thefollowing table as follows:a. In column (1), indicate in which statement—income statement (IS) or balance
sheet (BS)—the account belongs.b. In column (2), indicate whether the account is a current asset (CA), current
liability (CL), expense (E), fixed asset (FA), long-term debt (LTD), revenue (R),or stockholders’ equity (SE).
(1) (2)Account name Statement Type of account
Accounts payable _______ _______
Accounts receivable _______ _______
Accruals _______ _______
Accumulated depreciation _______ _______
Administrative expense _______ _______
Buildings _______ _______
Cash _______ _______
Common stock (at par) _______ _______
Cost of goods sold _______ _______
Depreciation _______ _______
Equipment _______ _______
General expense _______ _______
Interest expense _______ _______
Inventories _______ _______
Land _______ _______
Long-term debts _______ _______
Machinery _______ _______
Marketable securities _______ _______
Notes payable _______ _______
Operating expense _______ _______
Paid-in capital in excess of par _______ _______
Preferred stock _______ _______
Preferred stock dividends _______ _______
Retained earnings _______ _______
Sales revenue _______ _______
Selling expense _______ _______
Taxes _______ _______
Vehicles _______ _______
LG1
M02_GITM4126_05_SE_C02.QXD 12/14/07 9:21 AM Page 79
2008
9358
14
Principles of Managerial Finance, Brief Fifth Edition, by Lawrence J. Gitman. Copyright © 2009 by Lawrence J. Gitman.Published by Prentice Hall, a division of Pearson Education, Inc.
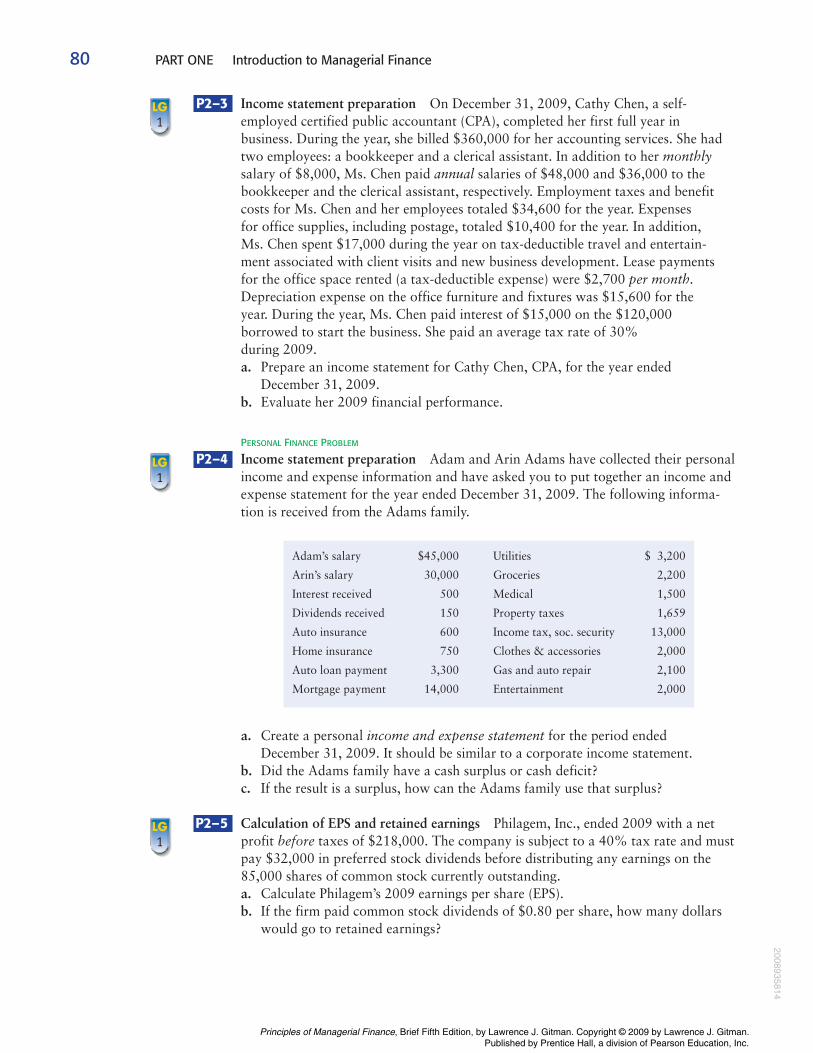
80 PART ONE Introduction to Managerial Finance
P2–3 Income statement preparation On December 31, 2009, Cathy Chen, a self-employed certified public accountant (CPA), completed her first full year in business. During the year, she billed $360,000 for her accounting services. She hadtwo employees: a bookkeeper and a clerical assistant. In addition to her monthlysalary of $8,000, Ms. Chen paid annual salaries of $48,000 and $36,000 to thebookkeeper and the clerical assistant, respectively. Employment taxes and benefitcosts for Ms. Chen and her employees totaled $34,600 for the year. Expenses for office supplies, including postage, totaled $10,400 for the year. In addition, Ms. Chen spent $17,000 during the year on tax-deductible travel and entertain-ment associated with client visits and new business development. Lease payments for the office space rented (a tax-deductible expense) were $2,700 per month.Depreciation expense on the office furniture and fixtures was $15,600 for the year. During the year, Ms. Chen paid interest of $15,000 on the $120,000 borrowed to start the business. She paid an average tax rate of 30% during 2009.a. Prepare an income statement for Cathy Chen, CPA, for the year ended
December 31, 2009.b. Evaluate her 2009 financial performance.
PERSONAL FINANCE PROBLEM
P2–4 Income statement preparation Adam and Arin Adams have collected their personalincome and expense information and have asked you to put together an income andexpense statement for the year ended December 31, 2009. The following informa-tion is received from the Adams family.
a. Create a personal income and expense statement for the period ended December 31, 2009. It should be similar to a corporate income statement.
b. Did the Adams family have a cash surplus or cash deficit?c. If the result is a surplus, how can the Adams family use that surplus?
P2–5 Calculation of EPS and retained earnings Philagem, Inc., ended 2009 with a netprofit before taxes of $218,000. The company is subject to a 40% tax rate and mustpay $32,000 in preferred stock dividends before distributing any earnings on the85,000 shares of common stock currently outstanding.a. Calculate Philagem’s 2009 earnings per share (EPS).b. If the firm paid common stock dividends of $0.80 per share, how many dollars
would go to retained earnings?
LG1
Adam’s salary $45,000 Utilities $ 3,200
Arin’s salary 30,000 Groceries 2,200
Interest received 500 Medical 1,500
Dividends received 150 Property taxes 1,659
Auto insurance 600 Income tax, soc. security 13,000
Home insurance 750 Clothes & accessories 2,000
Auto loan payment 3,300 Gas and auto repair 2,100
Mortgage payment 14,000 Entertainment 2,000
LG1
LG1
M02_GITM4126_05_SE_C02.QXD 12/14/07 9:21 AM Page 80
2008935814
Principles of Managerial Finance, Brief Fifth Edition, by Lawrence J. Gitman. Copyright © 2009 by Lawrence J. Gitman.Published by Prentice Hall, a division of Pearson Education, Inc.
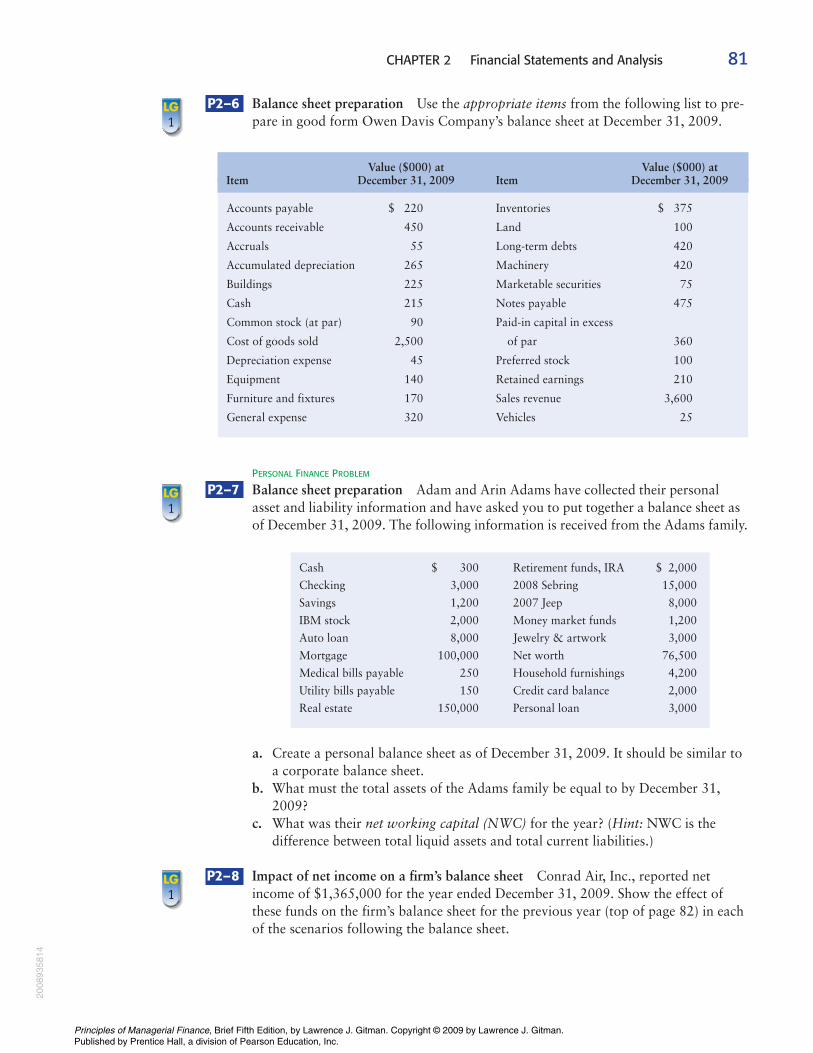
CHAPTER 2 Financial Statements and Analysis 81
P2–6 Balance sheet preparation Use the appropriate items from the following list to pre-pare in good form Owen Davis Company’s balance sheet at December 31, 2009.
PERSONAL FINANCE PROBLEM
P2–7 Balance sheet preparation Adam and Arin Adams have collected their personalasset and liability information and have asked you to put together a balance sheet asof December 31, 2009. The following information is received from the Adams family.
a. Create a personal balance sheet as of December 31, 2009. It should be similar toa corporate balance sheet.
b. What must the total assets of the Adams family be equal to by December 31,2009?
c. What was their net working capital (NWC) for the year? (Hint: NWC is thedifference between total liquid assets and total current liabilities.)
P2–8 Impact of net income on a firm’s balance sheet Conrad Air, Inc., reported netincome of $1,365,000 for the year ended December 31, 2009. Show the effect ofthese funds on the firm’s balance sheet for the previous year (top of page 82) in eachof the scenarios following the balance sheet.
LG1
Cash $ 300 Retirement funds, IRA $ 2,000
Checking 3,000 2008 Sebring 15,000
Savings 1,200 2007 Jeep 8,000
IBM stock 2,000 Money market funds 1,200
Auto loan 8,000 Jewelry & artwork 3,000
Mortgage 100,000 Net worth 76,500
Medical bills payable 250 Household furnishings 4,200
Utility bills payable 150 Credit card balance 2,000
Real estate 150,000 Personal loan 3,000
LG1
LG1
Value ($000) at Value ($000) atItem December 31, 2009 Item December 31, 2009
Accounts payable $ 220 Inventories $ 375
Accounts receivable 450 Land 100
Accruals 55 Long-term debts 420
Accumulated depreciation 265 Machinery 420
Buildings 225 Marketable securities 75
Cash 215 Notes payable 475
Common stock (at par) 90 Paid-in capital in excess
Cost of goods sold 2,500 of par 360
Depreciation expense 45 Preferred stock 100
Equipment 140 Retained earnings 210
Furniture and fixtures 170 Sales revenue 3,600
General expense 320 Vehicles 25
M02_GITM4126_05_SE_C02.QXD 12/14/07 9:21 AM Page 81
2008
9358
14
Principles of Managerial Finance, Brief Fifth Edition, by Lawrence J. Gitman. Copyright © 2009 by Lawrence J. Gitman.Published by Prentice Hall, a division of Pearson Education, Inc.
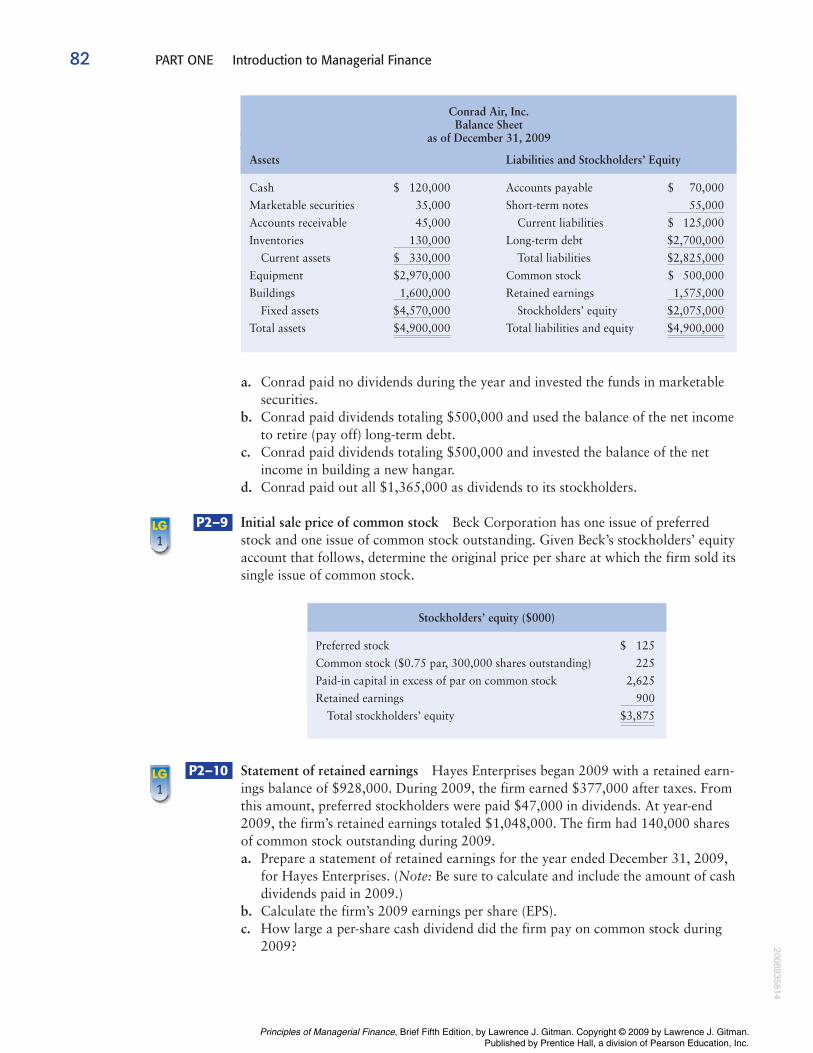
82 PART ONE Introduction to Managerial Finance
Stockholders’ equity ($000)
Preferred stock $ 125
Common stock ($0.75 par, 300,000 shares outstanding) 225
Paid-in capital in excess of par on common stock 2,625
Retained earnings
Total stockholders’ equity $3,875
900
Conrad Air, Inc.Balance Sheet
as of December 31, 2009
Assets Liabilities and Stockholders’ Equity
Cash $ 120,000 Accounts payable $ 70,000
Marketable securities 35,000 Short-term notes
Accounts receivable 45,000 Current liabilities $ 125,000
Inventories Long-term debt
Current assets Total liabilities
Equipment $2,970,000 Common stock $ 500,000
Buildings Retained earnings
Fixed assets Stockholders’ equity
Total assets Total liabilities and equity $4,900,000$4,900,000
$2,075,000$4,570,000
1,575,0001,600,000
$2,825,000$ 330,000
$2,700,000130,000
55,000
P2–10 Statement of retained earnings Hayes Enterprises began 2009 with a retained earn-ings balance of $928,000. During 2009, the firm earned $377,000 after taxes. Fromthis amount, preferred stockholders were paid $47,000 in dividends. At year-end2009, the firm’s retained earnings totaled $1,048,000. The firm had 140,000 sharesof common stock outstanding during 2009.a. Prepare a statement of retained earnings for the year ended December 31, 2009,
for Hayes Enterprises. (Note: Be sure to calculate and include the amount of cashdividends paid in 2009.)
b. Calculate the firm’s 2009 earnings per share (EPS).c. How large a per-share cash dividend did the firm pay on common stock during
2009?
LG1
a. Conrad paid no dividends during the year and invested the funds in marketablesecurities.
b. Conrad paid dividends totaling $500,000 and used the balance of the net incometo retire (pay off) long-term debt.
c. Conrad paid dividends totaling $500,000 and invested the balance of the netincome in building a new hangar.
d. Conrad paid out all $1,365,000 as dividends to its stockholders.
P2–9 Initial sale price of common stock Beck Corporation has one issue of preferredstock and one issue of common stock outstanding. Given Beck’s stockholders’ equityaccount that follows, determine the original price per share at which the firm sold itssingle issue of common stock.
LG1
M02_GITM4126_05_SE_C02.QXD 12/14/07 9:21 AM Page 82
2008935814
Principles of Managerial Finance, Brief Fifth Edition, by Lawrence J. Gitman. Copyright © 2009 by Lawrence J. Gitman.Published by Prentice Hall, a division of Pearson Education, Inc.
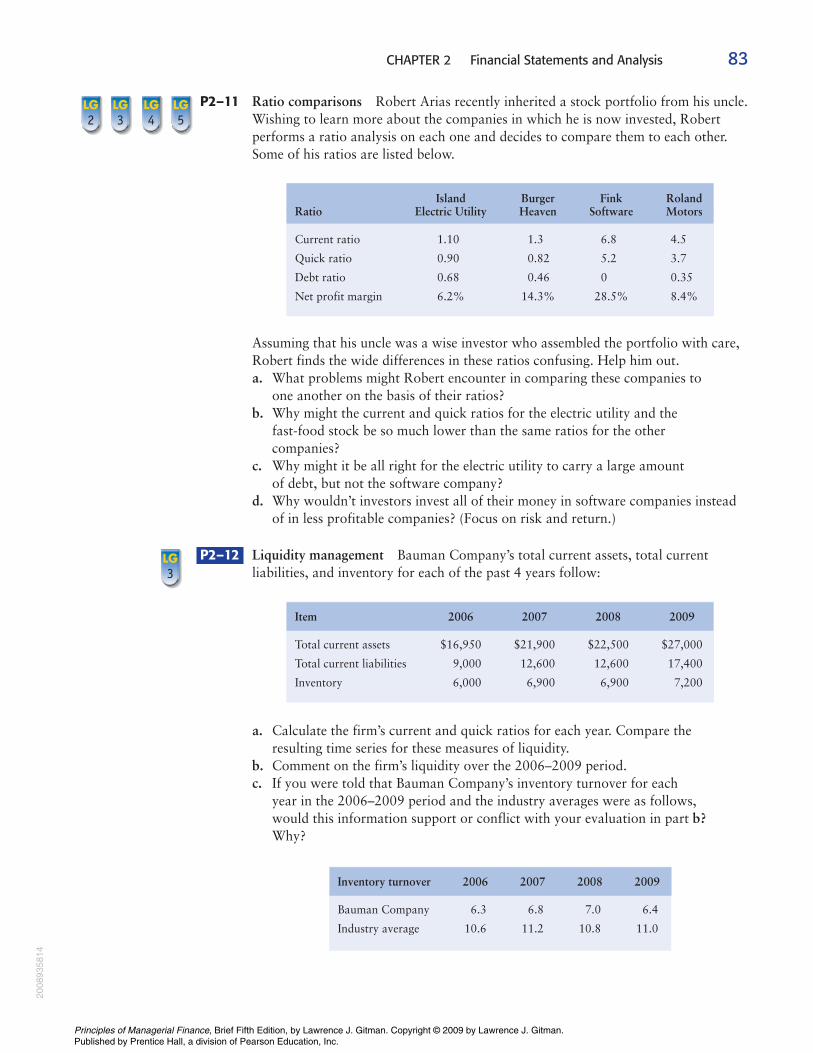
CHAPTER 2 Financial Statements and Analysis 83
P2–11 Ratio comparisons Robert Arias recently inherited a stock portfolio from his uncle.Wishing to learn more about the companies in which he is now invested, Robertperforms a ratio analysis on each one and decides to compare them to each other.Some of his ratios are listed below.
Assuming that his uncle was a wise investor who assembled the portfolio with care,Robert finds the wide differences in these ratios confusing. Help him out.a. What problems might Robert encounter in comparing these companies to
one another on the basis of their ratios?b. Why might the current and quick ratios for the electric utility and the
fast-food stock be so much lower than the same ratios for the other companies?
c. Why might it be all right for the electric utility to carry a large amount of debt, but not the software company?
d. Why wouldn’t investors invest all of their money in software companies insteadof in less profitable companies? (Focus on risk and return.)
P2–12 Liquidity management Bauman Company’s total current assets, total currentliabilities, and inventory for each of the past 4 years follow:
a. Calculate the firm’s current and quick ratios for each year. Compare the resulting time series for these measures of liquidity.
b. Comment on the firm’s liquidity over the 2006–2009 period.c. If you were told that Bauman Company’s inventory turnover for each
year in the 2006–2009 period and the industry averages were as follows, would this information support or conflict with your evaluation in part b?Why?
Inventory turnover 2006 2007 2008 2009
Bauman Company 6.3 6.8 7.0 6.4
Industry average 10.6 11.2 10.8 11.0
Item 2006 2007 2008 2009
Total current assets $16,950 $21,900 $22,500 $27,000
Total current liabilities 9,000 12,600 12,600 17,400
Inventory 6,000 6,900 6,900 7,200
LG3
Island Burger Fink RolandRatio Electric Utility Heaven Software Motors
Current ratio 1.10 1.3 6.8 4.5
Quick ratio 0.90 0.82 5.2 3.7
Debt ratio 0.68 0.46 0 0.35
Net profit margin 6.2% 14.3% 28.5% 8.4%
LG5
LG4
LG3
LG2
M02_GITM4126_05_SE_C02.QXD 12/14/07 9:21 AM Page 83
2008
9358
14
Principles of Managerial Finance, Brief Fifth Edition, by Lawrence J. Gitman. Copyright © 2009 by Lawrence J. Gitman.Published by Prentice Hall, a division of Pearson Education, Inc.
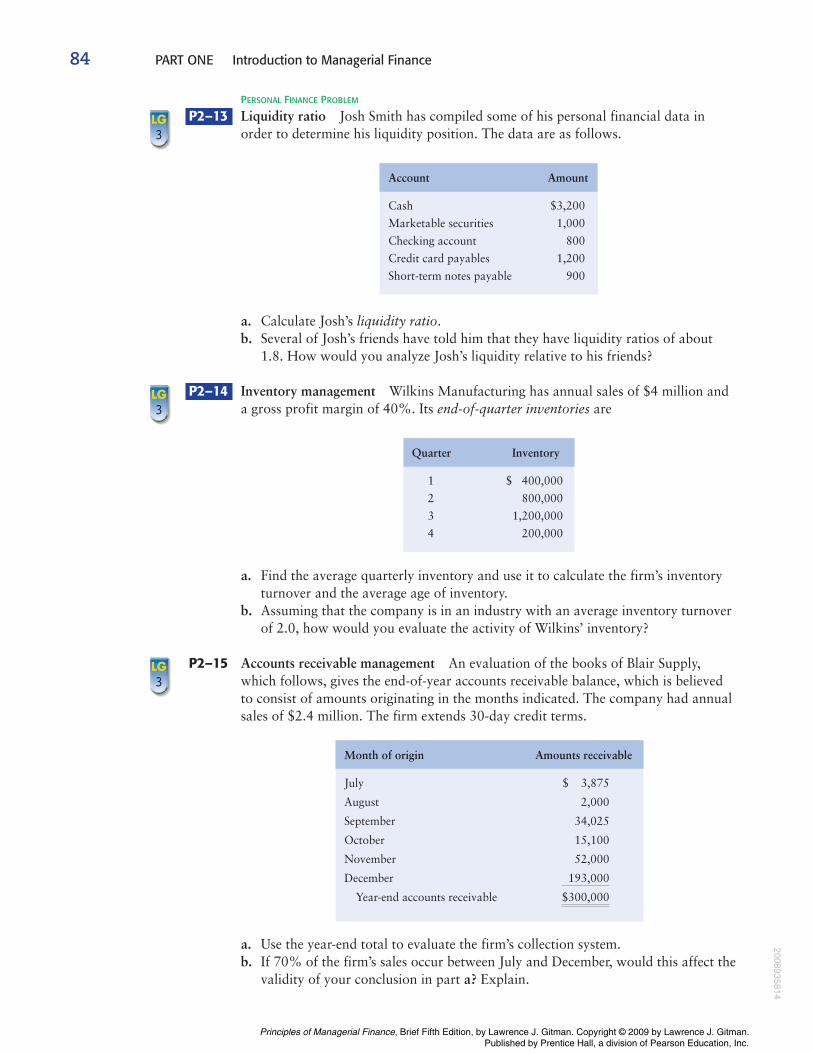
84 PART ONE Introduction to Managerial Finance
PERSONAL FINANCE PROBLEM
P2–13 Liquidity ratio Josh Smith has compiled some of his personal financial data inorder to determine his liquidity position. The data are as follows.
a. Calculate Josh’s liquidity ratio.b. Several of Josh’s friends have told him that they have liquidity ratios of about
1.8. How would you analyze Josh’s liquidity relative to his friends?
P2–14 Inventory management Wilkins Manufacturing has annual sales of $4 million anda gross profit margin of 40%. Its end-of-quarter inventories are
a. Find the average quarterly inventory and use it to calculate the firm’s inventoryturnover and the average age of inventory.
b. Assuming that the company is in an industry with an average inventory turnoverof 2.0, how would you evaluate the activity of Wilkins’ inventory?
P2–15 Accounts receivable management An evaluation of the books of Blair Supply,which follows, gives the end-of-year accounts receivable balance, which is believedto consist of amounts originating in the months indicated. The company had annualsales of $2.4 million. The firm extends 30-day credit terms.
a. Use the year-end total to evaluate the firm’s collection system.b. If 70% of the firm’s sales occur between July and December, would this affect the
validity of your conclusion in part a? Explain.
LG3
Quarter Inventory
1 $ 400,000
2 800,000
3 1,200,000
4 200,000
LG3
Account Amount
Cash $3,200
Marketable securities 1,000
Checking account 800
Credit card payables 1,200
Short-term notes payable 900
LG3
Month of origin Amounts receivable
July $ 3,875
August 2,000
September 34,025
October 15,100
November 52,000
December
Year-end accounts receivable $300,000
193,000
M02_GITM4126_05_SE_C02.QXD 12/14/07 9:21 AM Page 84
2008935814
Principles of Managerial Finance, Brief Fifth Edition, by Lawrence J. Gitman. Copyright © 2009 by Lawrence J. Gitman.Published by Prentice Hall, a division of Pearson Education, Inc.
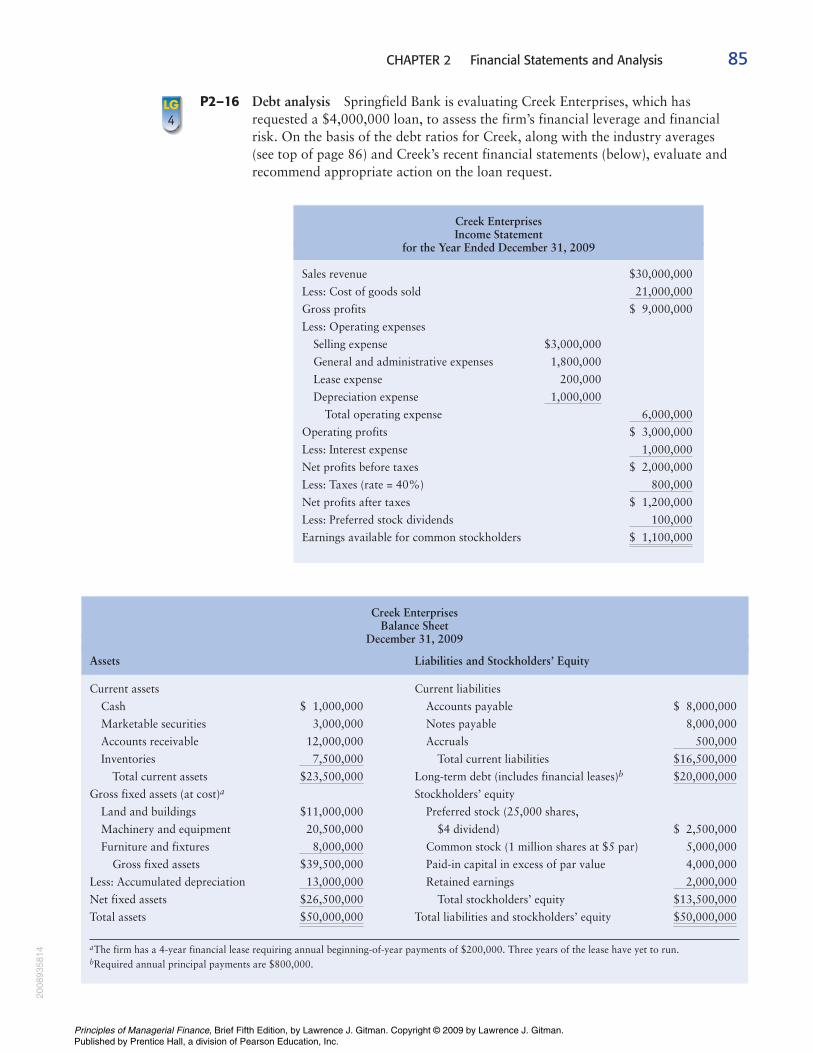
CHAPTER 2 Financial Statements and Analysis 85
P2–16 Debt analysis Springfield Bank is evaluating Creek Enterprises, which hasrequested a $4,000,000 loan, to assess the firm’s financial leverage and financialrisk. On the basis of the debt ratios for Creek, along with the industry averages (see top of page 86) and Creek’s recent financial statements (below), evaluate andrecommend appropriate action on the loan request.
LG4
Creek EnterprisesIncome Statement
for the Year Ended December 31, 2009
Sales revenue $30,000,000
Less: Cost of goods sold
Gross profits $ 9,000,000
Less: Operating expenses
Selling expense $3,000,000
General and administrative expenses 1,800,000
Lease expense 200,000
Depreciation expense
Total operating expense
Operating profits $ 3,000,000
Less: Interest expense
Net profits before taxes $ 2,000,000
Less: Taxes (rate = 40%)
Net profits after taxes $ 1,200,000
Less: Preferred stock dividends
Earnings available for common stockholders $ 1,100,000
100,000
800,000
1,000,000
6,000,000
1,000,000
21,000,000
Creek EnterprisesBalance Sheet
December 31, 2009
Assets Liabilities and Stockholders’ Equity
Current assets Current liabilities
Cash $ 1,000,000 Accounts payable $ 8,000,000
Marketable securities 3,000,000 Notes payable 8,000,000
Accounts receivable 12,000,000 Accruals
Inventories Total current liabilities
Total current assets Long-term debt (includes financial leases)b
Gross fixed assets (at cost)a Stockholders’ equity
Land and buildings $11,000,000 Preferred stock (25,000 shares,
Machinery and equipment 20,500,000 $4 dividend) $ 2,500,000
Furniture and fixtures Common stock (1 million shares at $5 par) 5,000,000
Gross fixed assets $39,500,000 Paid-in capital in excess of par value 4,000,000
Less: Accumulated depreciation Retained earnings
Net fixed assets Total stockholders’ equity
Total assets Total liabilities and stockholders’ equity
aThe firm has a 4-year financial lease requiring annual beginning-of-year payments of $200,000. Three years of the lease have yet to run.bRequired annual principal payments are $800,000.
$50,000,000$50,000,000
$13,500,000$26,500,000
2,000,00013,000,000
8,000,000
$20,000,000$23,500,000
$16,500,0007,500,000
500,000
M02_GITM4126_05_SE_C02.QXD 12/14/07 9:21 AM Page 85
2008
9358
14
Principles of Managerial Finance, Brief Fifth Edition, by Lawrence J. Gitman. Copyright © 2009 by Lawrence J. Gitman.Published by Prentice Hall, a division of Pearson Education, Inc.
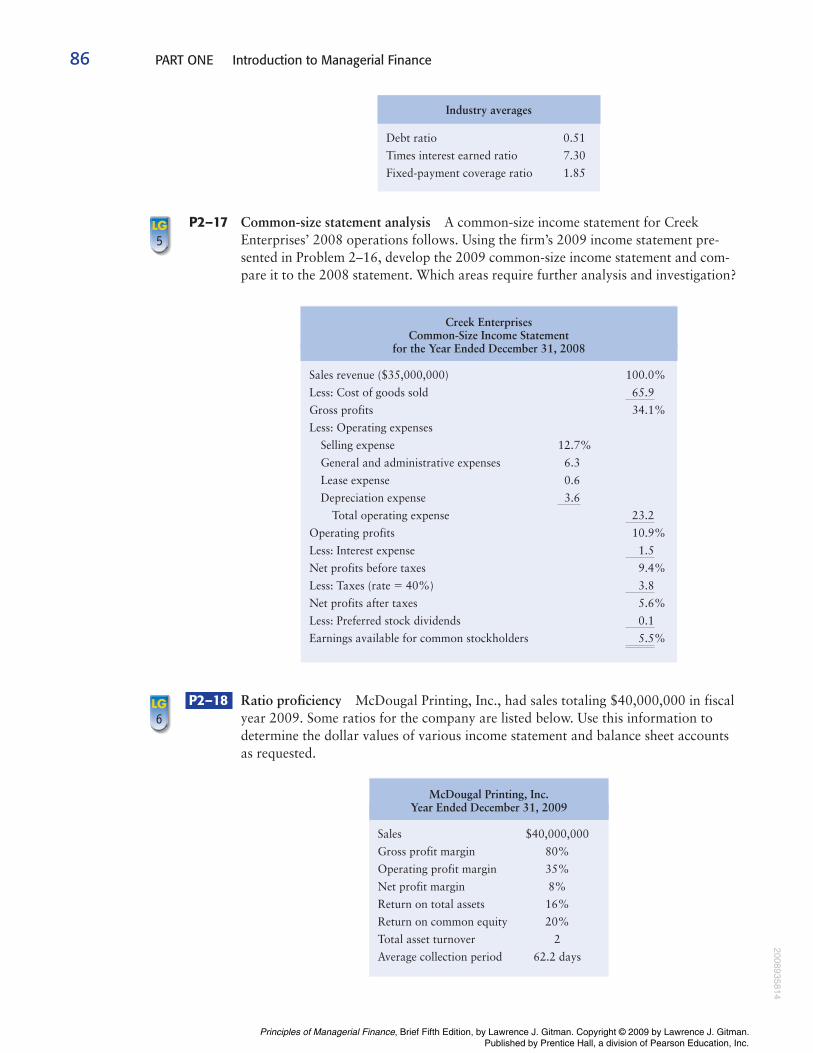
86 PART ONE Introduction to Managerial Finance
P2–17 Common-size statement analysis A common-size income statement for CreekEnterprises’ 2008 operations follows. Using the firm’s 2009 income statement pre-sented in Problem 2–16, develop the 2009 common-size income statement and com-pare it to the 2008 statement. Which areas require further analysis and investigation?
LG5
Industry averages
Debt ratio 0.51
Times interest earned ratio 7.30
Fixed-payment coverage ratio 1.85
Creek EnterprisesCommon-Size Income Statement
for the Year Ended December 31, 2008
Sales revenue ($35,000,000) 100.0%
Less: Cost of goods sold
Gross profits 34.1%
Less: Operating expenses
Selling expense 12.7%
General and administrative expenses 6.3
Lease expense 0.6
Depreciation expense
Total operating expense
Operating profits 10.9%
Less: Interest expense
Net profits before taxes 9.4%
Less: Taxes (rate � 40%)
Net profits after taxes 5.6%
Less: Preferred stock dividends
Earnings available for common stockholders %5.5
0.1
3.8
1.5
23.2
3.6
65.9
P2–18 Ratio proficiency McDougal Printing, Inc., had sales totaling $40,000,000 in fiscalyear 2009. Some ratios for the company are listed below. Use this information todetermine the dollar values of various income statement and balance sheet accountsas requested.
McDougal Printing, Inc.Year Ended December 31, 2009
Sales $40,000,000
Gross profit margin 80%
Operating profit margin 35%
Net profit margin 8%
Return on total assets 16%
Return on common equity 20%
Total asset turnover 2
Average collection period 62.2 days
LG6
M02_GITM4126_05_SE_C02.QXD 12/14/07 9:21 AM Page 86
2008935814
Principles of Managerial Finance, Brief Fifth Edition, by Lawrence J. Gitman. Copyright © 2009 by Lawrence J. Gitman.Published by Prentice Hall, a division of Pearson Education, Inc.
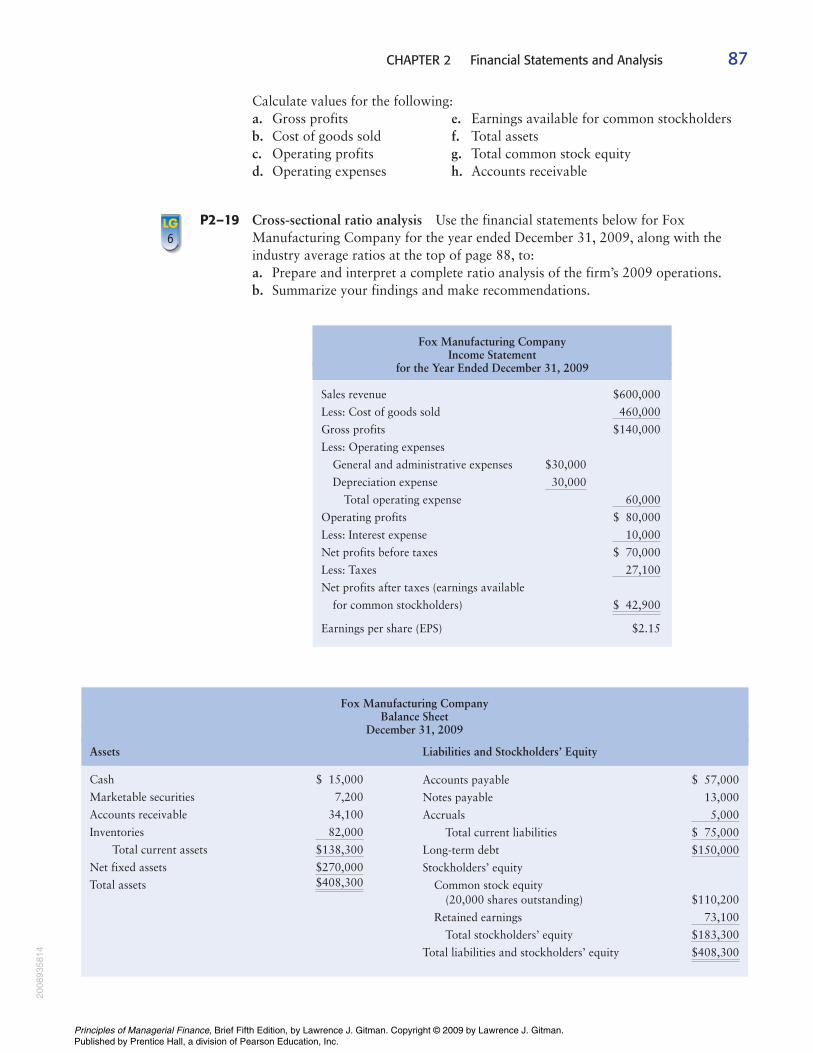
CHAPTER 2 Financial Statements and Analysis 87
Calculate values for the following:a. Gross profitsb. Cost of goods soldc. Operating profitsd. Operating expenses
Fox Manufacturing CompanyIncome Statement
for the Year Ended December 31, 2009
Sales revenue $600,000
Less: Cost of goods sold
Gross profits $140,000
Less: Operating expenses
General and administrative expenses $30,000
Depreciation expense
Total operating expense
Operating profits $ 80,000
Less: Interest expense
Net profits before taxes $ 70,000
Less: Taxes
Net profits after taxes (earnings available
for common stockholders)
Earnings per share (EPS) $2.15
$ 42,900
27,100
10,000
60,000
30,000
460,000
Fox Manufacturing CompanyBalance Sheet
December 31, 2009
Assets Liabilities and Stockholders’ Equity
Cash $ 15,000
Marketable securities 7,200
Accounts receivable 34,100
Inventories
Total current assets
Net fixed assets
Total assets $408,300$270,000
$138,300
82,000
Accounts payable $ 57,000
Notes payable 13,000
Accruals
Total current liabilities
Long-term debt
Stockholders’ equity
Common stock equity (20,000 shares outstanding) $110,200
Retained earnings
Total stockholders’ equity
Total liabilities and stockholders’ equity $408,300
$183,300
73,100
$150,000
$ 75,000
5,000
e. Earnings available for common stockholdersf. Total assetsg. Total common stock equityh. Accounts receivable
P2–19 Cross-sectional ratio analysis Use the financial statements below for FoxManufacturing Company for the year ended December 31, 2009, along with theindustry average ratios at the top of page 88, to:a. Prepare and interpret a complete ratio analysis of the firm’s 2009 operations.b. Summarize your findings and make recommendations.
LG6
M02_GITM4126_05_SE_C02.QXD 12/14/07 9:21 AM Page 87
2008
9358
14
Principles of Managerial Finance, Brief Fifth Edition, by Lawrence J. Gitman. Copyright © 2009 by Lawrence J. Gitman.Published by Prentice Hall, a division of Pearson Education, Inc.
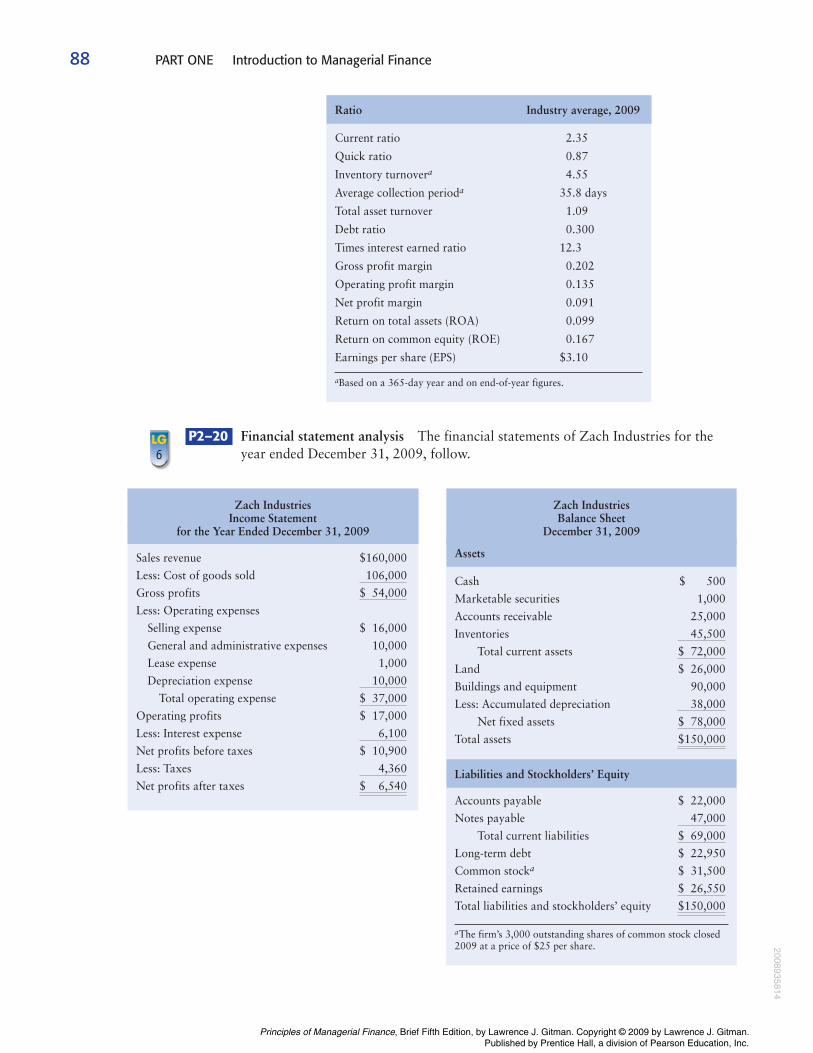
88 PART ONE Introduction to Managerial Finance
P2–20 Financial statement analysis The financial statements of Zach Industries for theyear ended December 31, 2009, follow.
LG6
Ratio Industry average, 2009
Current ratio 2.35
Quick ratio 0.87
Inventory turnovera 4.55
Average collection perioda 35.8 days
Total asset turnover 1.09
Debt ratio 0.300
Times interest earned ratio 12.3
Gross profit margin 0.202
Operating profit margin 0.135
Net profit margin 0.091
Return on total assets (ROA) 0.099
Return on common equity (ROE) 0.167
Earnings per share (EPS) $3.10
aBased on a 365-day year and on end-of-year figures.
Zach IndustriesIncome Statement
for the Year Ended December 31, 2009
Sales revenue $160,000
Less: Cost of goods sold
Gross profits
Less: Operating expenses
Selling expense $ 16,000
General and administrative expenses 10,000
Lease expense 1,000
Depreciation expense
Total operating expense
Operating profits $ 17,000
Less: Interest expense
Net profits before taxes $ 10,900
Less: Taxes
Net profits after taxes $ 6,540
4,360
6,100
$ 37,000
10,000
$ 54,000
106,000
Zach IndustriesBalance Sheet
December 31, 2009
Assets
Cash $ 500
Marketable securities 1,000
Accounts receivable 25,000
Inventories
Total current assets
Land $ 26,000
Buildings and equipment 90,000
Less: Accumulated depreciation
Net fixed assets
Total assets
Liabilities and Stockholders’ Equity
Accounts payable $ 22,000
Notes payable
Total current liabilities
Long-term debt $ 22,950
Common stocka $ 31,500
Retained earnings
Total liabilities and stockholders’ equity
aThe firm’s 3,000 outstanding shares of common stock closed2009 at a price of $25 per share.
$150,000
$ 26,550
$ 69,000
47,000
$150,000
$ 78,000
38,000
$ 72,000
45,500
M02_GITM4126_05_SE_C02.QXD 12/14/07 9:21 AM Page 88
2008935814
Principles of Managerial Finance, Brief Fifth Edition, by Lawrence J. Gitman. Copyright © 2009 by Lawrence J. Gitman.Published by Prentice Hall, a division of Pearson Education, Inc.
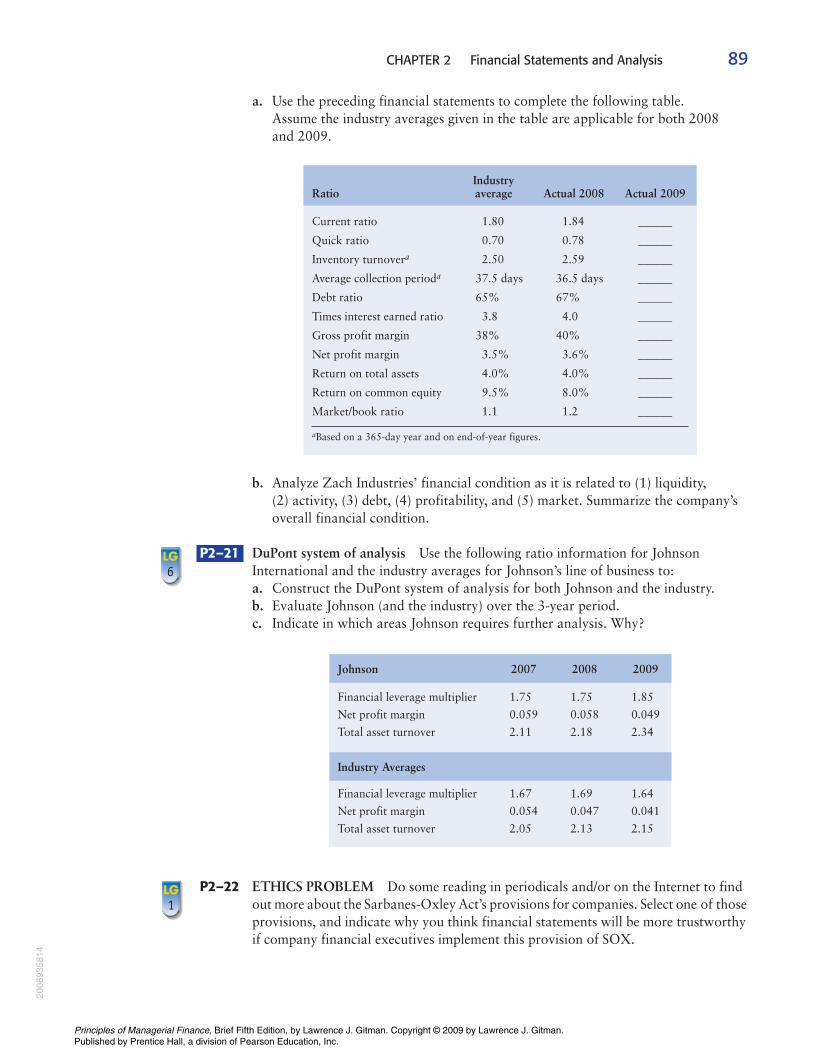
CHAPTER 2 Financial Statements and Analysis 89
a. Use the preceding financial statements to complete the following table. Assume the industry averages given in the table are applicable for both 2008 and 2009.
b. Analyze Zach Industries’ financial condition as it is related to (1) liquidity, (2) activity, (3) debt, (4) profitability, and (5) market. Summarize the company’soverall financial condition.
P2–21 DuPont system of analysis Use the following ratio information for JohnsonInternational and the industry averages for Johnson’s line of business to:a. Construct the DuPont system of analysis for both Johnson and the industry.b. Evaluate Johnson (and the industry) over the 3-year period.c. Indicate in which areas Johnson requires further analysis. Why?
P2–22 ETHICS PROBLEM Do some reading in periodicals and/or on the Internet to findout more about the Sarbanes-Oxley Act’s provisions for companies. Select one of thoseprovisions, and indicate why you think financial statements will be more trustworthyif company financial executives implement this provision of SOX.
LG1
Johnson 2007 2008 2009
Financial leverage multiplier 1.75 1.75 1.85
Net profit margin 0.059 0.058 0.049
Total asset turnover 2.11 2.18 2.34
Industry Averages
Financial leverage multiplier 1.67 1.69 1.64
Net profit margin 0.054 0.047 0.041
Total asset turnover 2.05 2.13 2.15
LG6
IndustryRatio average Actual 2008 Actual 2009
Current ratio 1.80 1.84 ______
Quick ratio 0.70 0.78 ______
Inventory turnovera 2.50 2.59 ______
Average collection perioda 37.5 days 36.5 days ______
Debt ratio 65% 67% ______
Times interest earned ratio 3.8 4.0 ______
Gross profit margin 38% 40% ______
Net profit margin 3.5% 3.6% ______
Return on total assets 4.0% 4.0% ______
Return on common equity 9.5% 8.0% ______
Market/book ratio 1.1 1.2 ______
aBased on a 365-day year and on end-of-year figures.
M02_GITM4126_05_SE_C02.QXD 12/14/07 9:21 AM Page 89
2008
9358
14
Principles of Managerial Finance, Brief Fifth Edition, by Lawrence J. Gitman. Copyright © 2009 by Lawrence J. Gitman.Published by Prentice Hall, a division of Pearson Education, Inc.
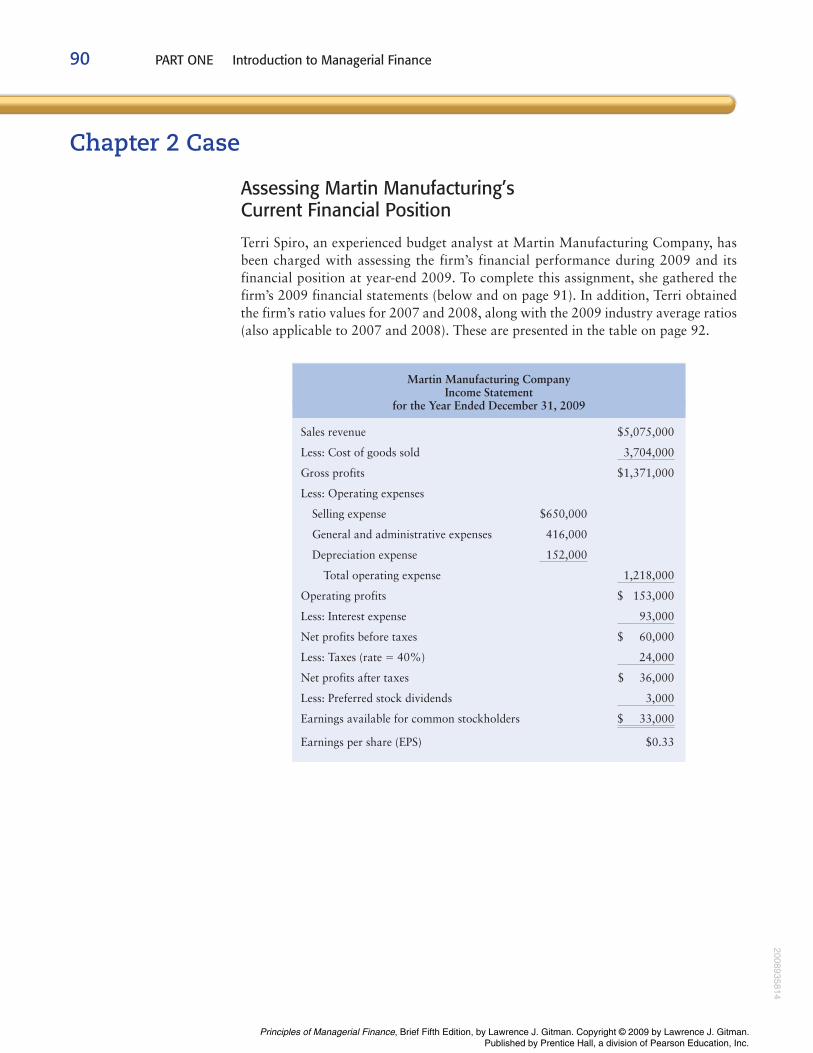
Chapter 2 Case
Assessing Martin Manufacturing’s Current Financial Position
Terri Spiro, an experienced budget analyst at Martin Manufacturing Company, hasbeen charged with assessing the firm’s financial performance during 2009 and itsfinancial position at year-end 2009. To complete this assignment, she gathered thefirm’s 2009 financial statements (below and on page 91). In addition, Terri obtainedthe firm’s ratio values for 2007 and 2008, along with the 2009 industry average ratios(also applicable to 2007 and 2008). These are presented in the table on page 92.
90 PART ONE Introduction to Managerial Finance
Martin Manufacturing CompanyIncome Statement
for the Year Ended December 31, 2009
Sales revenue $5,075,000
Less: Cost of goods sold
Gross profits $1,371,000
Less: Operating expenses
Selling expense $650,000
General and administrative expenses 416,000
Depreciation expense
Total operating expense
Operating profits $ 153,000
Less: Interest expense
Net profits before taxes $ 60,000
Less: Taxes (rate � 40%)
Net profits after taxes $ 36,000
Less: Preferred stock dividends
Earnings available for common stockholders
Earnings per share (EPS) $0.33
$ 33,000
3,000
24,000
93,000
1,218,000
152,000
3,704,000
M02_GITM4126_05_SE_C02.QXD 12/14/07 9:21 AM Page 90
2008935814
Principles of Managerial Finance, Brief Fifth Edition, by Lawrence J. Gitman. Copyright © 2009 by Lawrence J. Gitman.Published by Prentice Hall, a division of Pearson Education, Inc.
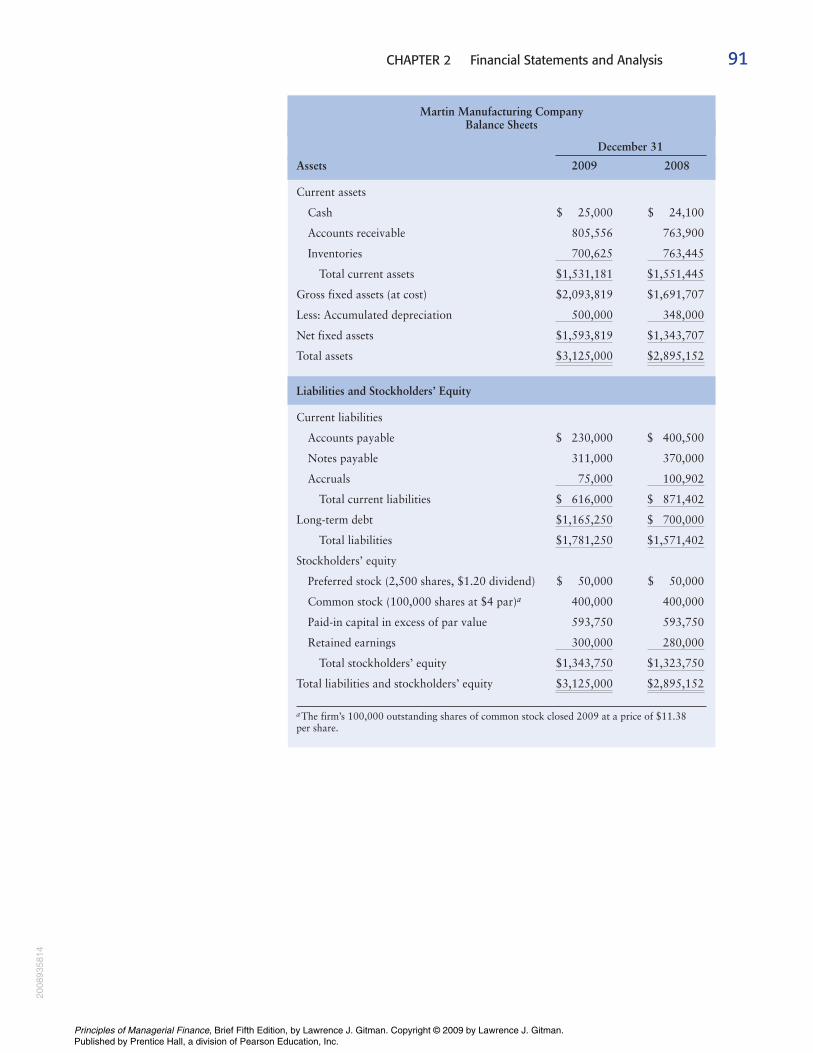
CHAPTER 2 Financial Statements and Analysis 91
Martin Manufacturing CompanyBalance Sheets
December 31
Assets 2009 2008
Current assets
Cash $ 25,000 $ 24,100
Accounts receivable 805,556 763,900
Inventories
Total current assets
Gross fixed assets (at cost) $2,093,819 $1,691,707
Less: Accumulated depreciation
Net fixed assets
Total assets
Liabilities and Stockholders’ Equity
Current liabilities
Accounts payable $ 230,000 $ 400,500
Notes payable 311,000 370,000
Accruals
Total current liabilities
Long-term debt
Total liabilities
Stockholders’ equity
Preferred stock (2,500 shares, $1.20 dividend) $ 50,000 $ 50,000
Common stock (100,000 shares at $4 par)a 400,000 400,000
Paid-in capital in excess of par value 593,750 593,750
Retained earnings
Total stockholders’ equity
Total liabilities and stockholders’ equity
aThe firm’s 100,000 outstanding shares of common stock closed 2009 at a price of $11.38 per share.
$2,895,152$3,125,000
$1,323,750$1,343,750
280,000300,000
$1,571,402$1,781,250
$ 700,000$1,165,250
$ 871,402$ 616,000
100,90275,000
$2,895,152$3,125,000
$1,343,707$1,593,819
348,000500,000
$1,551,445$1,531,181
763,445700,625
M02_GITM4126_05_SE_C02.QXD 12/14/07 9:21 AM Page 91
2008
9358
14
Principles of Managerial Finance, Brief Fifth Edition, by Lawrence J. Gitman. Copyright © 2009 by Lawrence J. Gitman.Published by Prentice Hall, a division of Pearson Education, Inc.
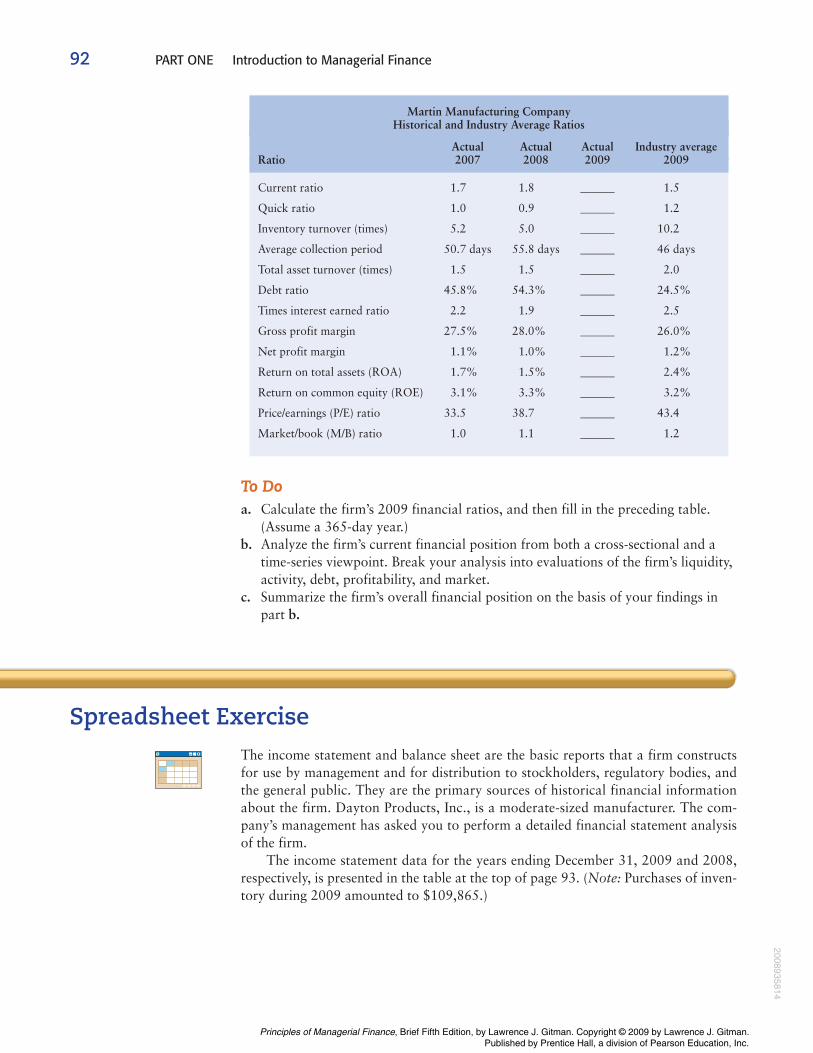
92 PART ONE Introduction to Managerial Finance
To Doa. Calculate the firm’s 2009 financial ratios, and then fill in the preceding table.
(Assume a 365-day year.)b. Analyze the firm’s current financial position from both a cross-sectional and a
time-series viewpoint. Break your analysis into evaluations of the firm’s liquidity,activity, debt, profitability, and market.
c. Summarize the firm’s overall financial position on the basis of your findings inpart b.
Spreadsheet ExerciseThe income statement and balance sheet are the basic reports that a firm constructsfor use by management and for distribution to stockholders, regulatory bodies, andthe general public. They are the primary sources of historical financial informationabout the firm. Dayton Products, Inc., is a moderate-sized manufacturer. The com-pany’s management has asked you to perform a detailed financial statement analysisof the firm.
The income statement data for the years ending December 31, 2009 and 2008,respectively, is presented in the table at the top of page 93. (Note: Purchases of inven-tory during 2009 amounted to $109,865.)
Martin Manufacturing CompanyHistorical and Industry Average Ratios
Actual Actual Actual Industry averageRatio 2007 2008 2009 2009
Current ratio 1.7 1.8 ______ 1.5
Quick ratio 1.0 0.9 ______ 1.2
Inventory turnover (times) 5.2 5.0 ______ 10.2
Average collection period 50.7 days 55.8 days ______ 46 days
Total asset turnover (times) 1.5 1.5 ______ 2.0
Debt ratio 45.8% 54.3% ______ 24.5%
Times interest earned ratio 2.2 1.9 ______ 2.5
Gross profit margin 27.5% 28.0% ______ 26.0%
Net profit margin 1.1% 1.0% ______ 1.2%
Return on total assets (ROA) 1.7% 1.5% ______ 2.4%
Return on common equity (ROE) 3.1% 3.3% ______ 3.2%
Price/earnings (P/E) ratio 33.5 38.7 ______ 43.4
Market/book (M/B) ratio 1.0 1.1 ______ 1.2
M02_GITM4126_05_SE_C02.QXD 12/14/07 9:21 AM Page 92
2008935814
Principles of Managerial Finance, Brief Fifth Edition, by Lawrence J. Gitman. Copyright © 2009 by Lawrence J. Gitman.Published by Prentice Hall, a division of Pearson Education, Inc.
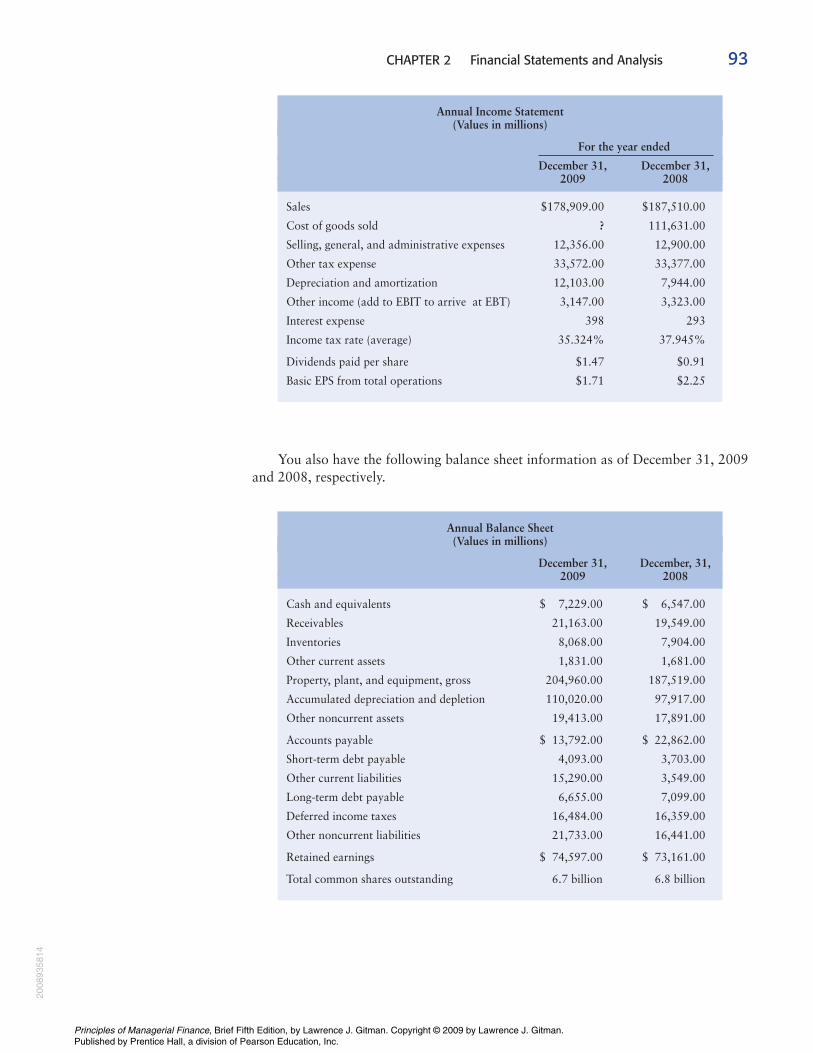
CHAPTER 2 Financial Statements and Analysis 93
You also have the following balance sheet information as of December 31, 2009and 2008, respectively.
Annual Balance Sheet(Values in millions)
December 31, December, 31, 2009 2008
Cash and equivalents $ 7,229.00 $ 6,547.00
Receivables 21,163.00 19,549.00
Inventories 8,068.00 7,904.00
Other current assets 1,831.00 1,681.00
Property, plant, and equipment, gross 204,960.00 187,519.00
Accumulated depreciation and depletion 110,020.00 97,917.00
Other noncurrent assets 19,413.00 17,891.00
Accounts payable $ 13,792.00 $ 22,862.00
Short-term debt payable 4,093.00 3,703.00
Other current liabilities 15,290.00 3,549.00
Long-term debt payable 6,655.00 7,099.00
Deferred income taxes 16,484.00 16,359.00
Other noncurrent liabilities 21,733.00 16,441.00
Retained earnings $ 74,597.00 $ 73,161.00
Total common shares outstanding 6.7 billion 6.8 billion
Annual Income Statement(Values in millions)
For the year ended
December 31, December 31,2009 2008
Sales $178,909.00 $187,510.00
Cost of goods sold ? 111,631.00
Selling, general, and administrative expenses 12,356.00 12,900.00
Other tax expense 33,572.00 33,377.00
Depreciation and amortization 12,103.00 7,944.00
Other income (add to EBIT to arrive at EBT) 3,147.00 3,323.00
Interest expense 398 293
Income tax rate (average) 35.324% 37.945%
Dividends paid per share $1.47 $0.91
Basic EPS from total operations $1.71 $2.25
M02_GITM4126_05_SE_C02.QXD 12/14/07 9:21 AM Page 93
2008
9358
14
Principles of Managerial Finance, Brief Fifth Edition, by Lawrence J. Gitman. Copyright © 2009 by Lawrence J. Gitman.Published by Prentice Hall, a division of Pearson Education, Inc.
94 PART ONE Introduction to Managerial Finance
To Doa. Create a spreadsheet similar to the spreadsheet in Table 2.1 (which can be viewed
at www.prenhall.com/gitman) to model the following:(1) A multiple-step comparative income statement for Dayton, Inc., for the
periods ending December 31, 2009 and 2008. You must calculate the cost ofgoods sold for the year 2009.
(2) A common-size income statement for Dayton, Inc., covering the years 2009and 2008.
b. Create a spreadsheet similar to the spreadsheet in Table 2.2 (which can be viewedat www.prenhall.com/gitman) to model the following:(1) A detailed, comparative balance sheet for Dayton, Inc., for the years ended
December 31, 2009 and 2008.(2) A common-size balance sheet for Dayton, Inc., covering the years 2009
and 2008.c. Create a spreadsheet similar to the spreadsheet in Table 2.8 (which can be viewed
at www.prenhall.com/gitman) to perform the following analysis:(1) Create a table that reflects both 2009 and 2008 operating ratios for Dayton,
Inc., segmented into (a) liquidity, (b) activity, (c) debt, (d) profitability, and(e) market. Assume that the current market price for the stock is $90.
(2) Compare the 2009 ratios to the 2008 ratios. Indicate whether the results“outperformed the prior year” or “underperformed relative to the prioryear.”
Web ExerciseGo to the book’s companion websiteat www.prenhall.com/gitman to findthe Web Exercise for this chapter.
Remember to check the book’s websiteat www.prenhall.com/gitman to findadditional resources, including WebExercises and a Web Case.
M02_GITM4126_05_SE_C02.QXD 12/14/07 9:21 AM Page 94
2008935814
Principles of Managerial Finance, Brief Fifth Edition, by Lawrence J. Gitman. Copyright © 2009 by Lawrence J. Gitman.Published by Prentice Hall, a division of Pearson Education, Inc.