financial statement analysis chapter 15 actg 202 – principles of managerial accounting
TRANSCRIPT
Financial Statement AnalysisChapter 15
ACTG 202 – Principles of Managerial Accounting
15-2
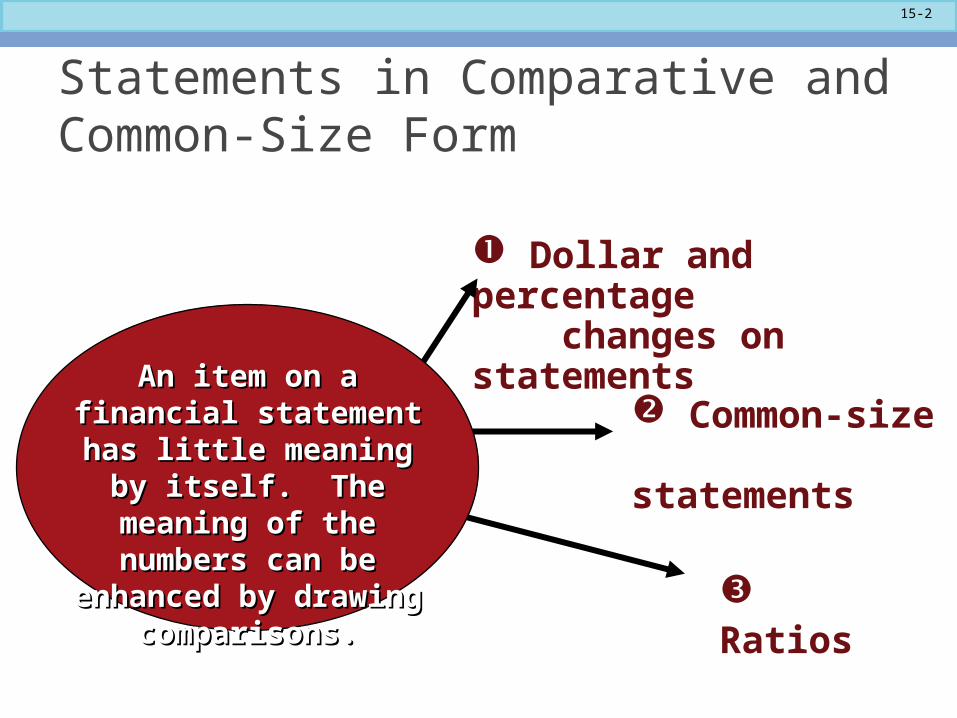
Statements in Comparative and Common-Size Form
Dollar and percentage changes on statements
Common-size statements
Ratios
An item on a financial An item on a financial statement has little statement has little
meaning by itself. The meaning by itself. The meaning of the numbers meaning of the numbers
can be enhanced by can be enhanced by drawing comparisons.drawing comparisons.
15-3
Learning Objective 1
Prepare and interpret financial statements in
comparative and common-size form.
15-4
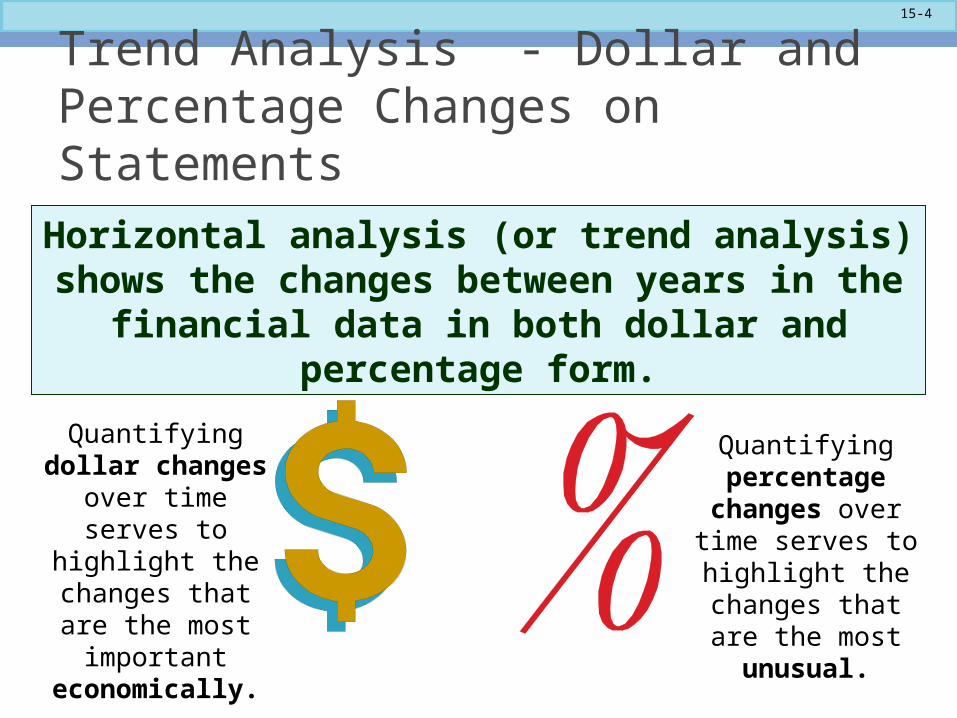
Trend Analysis - Dollar and Percentage Changes on Statements
Horizontal analysis (or trend analysis) shows the changes between years in the financial data in
both dollar and percentage form.
Quantifying dollar changes over time serves to highlight
the changes that are the most important
economically.
Quantifying percentage
changes over time serves to highlight
the changes that are the most unusual.

15-5
Trend Analysis
DollarChange
Current YearFigure
Base YearFigure
= –
The dollar amounts for
last year become the “base” year
figures.
Calculating Change in Dollar Amounts
15-6
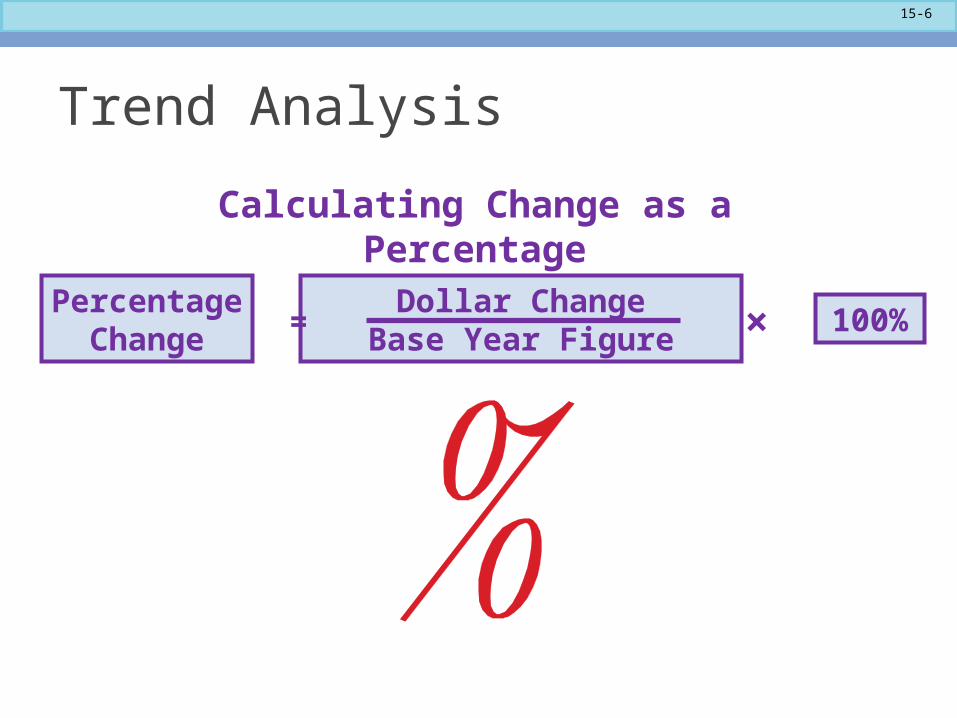
PercentageChange
Dollar Change Base Year Figure
100%= ×
Trend Analysis
Calculating Change as a Percentage
15-7
Trend Analysis
We could do this for balance sheet
items, but now let’s look at the income
statement accounts.
15-8
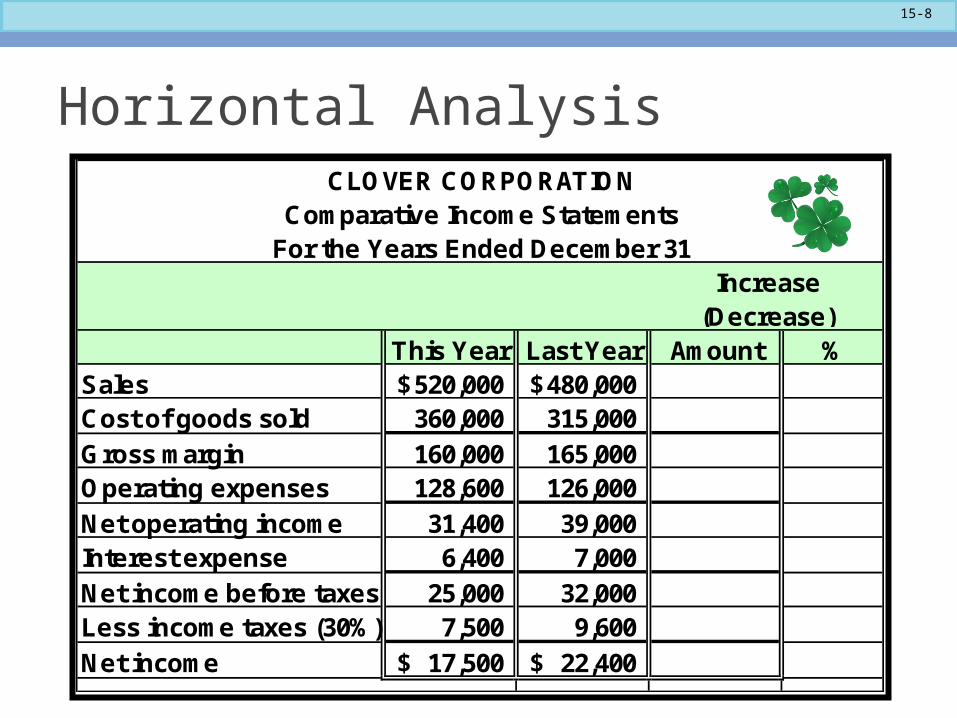
Horizontal AnalysisCLOVER CORPORATION
Comparative Income StatementsFor the Years Ended December 31
Increase (Decrease)
This Year Last Year Amount %Sales 520,000$ 480,000$ Cost of goods sold 360,000 315,000
Gross margin 160,000 165,000 Operating expenses 128,600 126,000
Net operating income 31,400 39,000 Interest expense 6,400 7,000
Net income before taxes 25,000 32,000 Less income taxes (30%) 7,500 9,600
Net income 17,500$ 22,400$
15-9
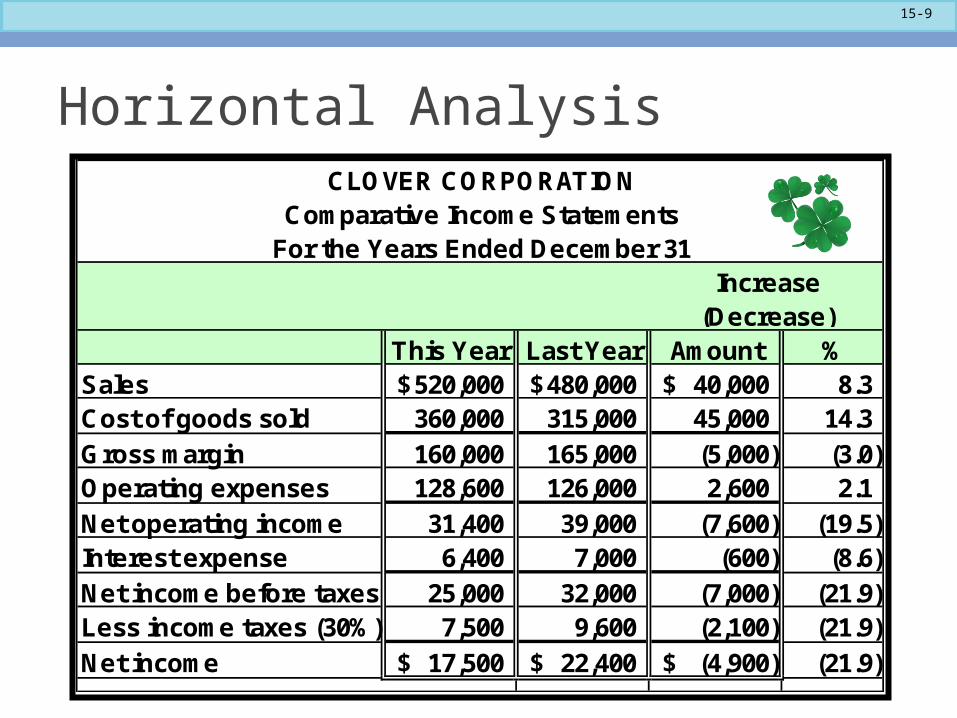
Horizontal AnalysisCLOVER CORPORATION
Comparative Income StatementsFor the Years Ended December 31
Increase (Decrease)
This Year Last Year Amount %Sales 520,000$ 480,000$ 40,000$ 8.3Cost of goods sold 360,000 315,000 45,000 14.3
Gross margin 160,000 165,000 (5,000) (3.0)Operating expenses 128,600 126,000 2,600 2.1
Net operating income 31,400 39,000 (7,600) (19.5)Interest expense 6,400 7,000 (600) (8.6)
Net income before taxes 25,000 32,000 (7,000) (21.9)Less income taxes (30%) 7,500 9,600 (2,100) (21.9)
Net income 17,500$ 22,400$ (4,900)$ (21.9)
15-10
Trend Percentages
Trend percentages state several years’
financial data in terms of a base year, which equals 100 percent.
15-11
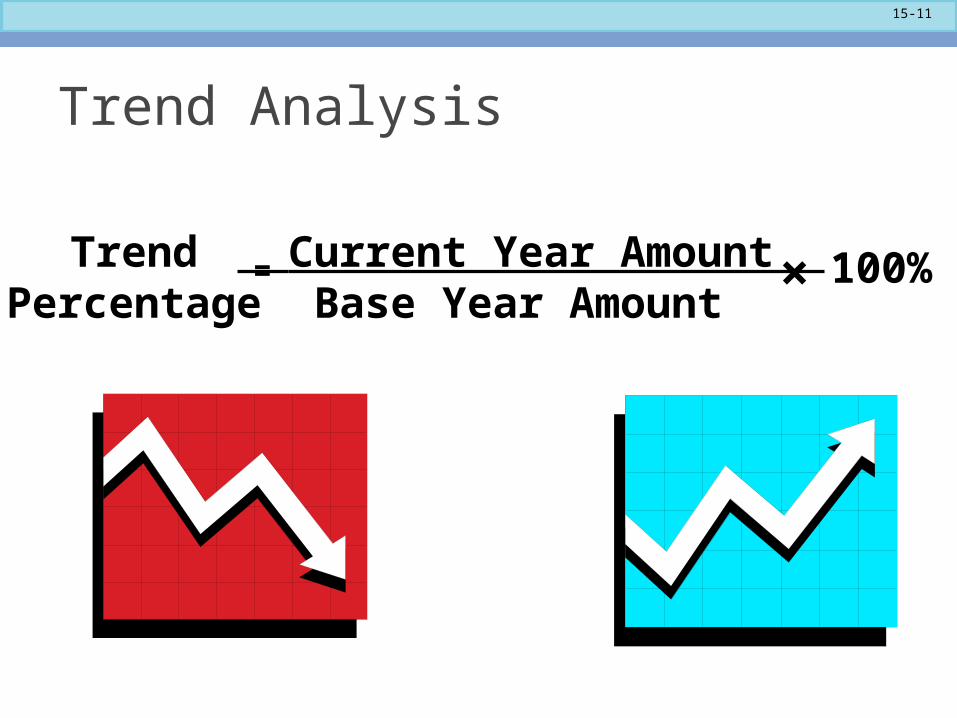
Trend Analysis
TrendPercentage
Current Year Amount Base Year Amount
100%= ×
15-12
Trend Analysis
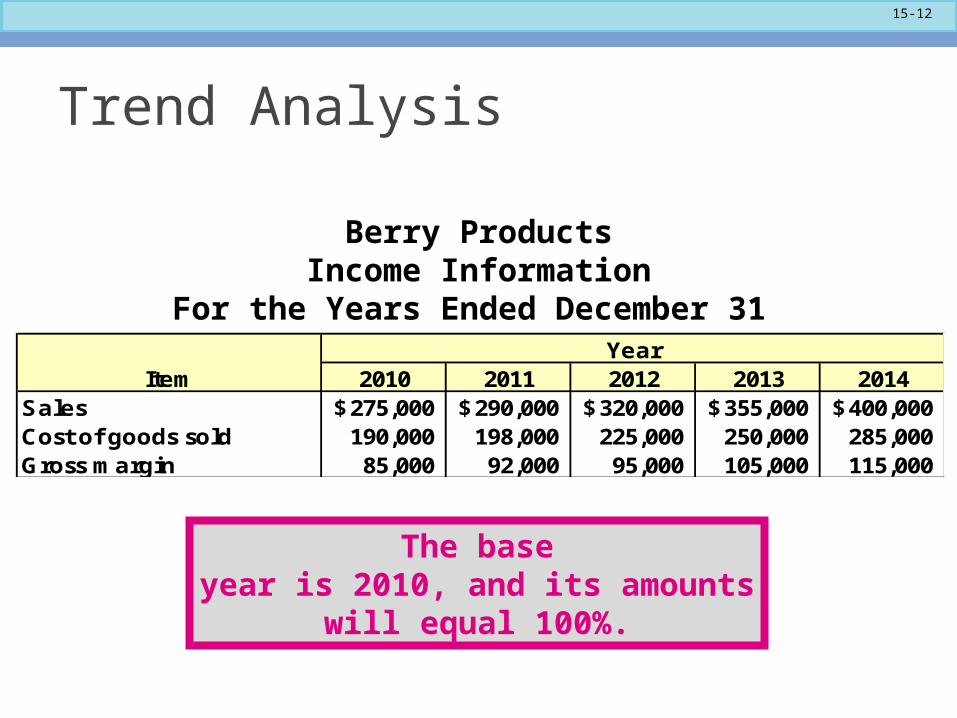
The baseyear is 2010, and its amounts
will equal 100%.
YearItem 2010 2011 2012 2013 2014
Sales 275,000$ 290,000$ 320,000$ 355,000$ 400,000$ Cost of goods sold 190,000 198,000 225,000 250,000 285,000 Gross margin 85,000 92,000 95,000 105,000 115,000
Berry ProductsIncome Information
For the Years Ended December 31
15-13
Trend Analysis
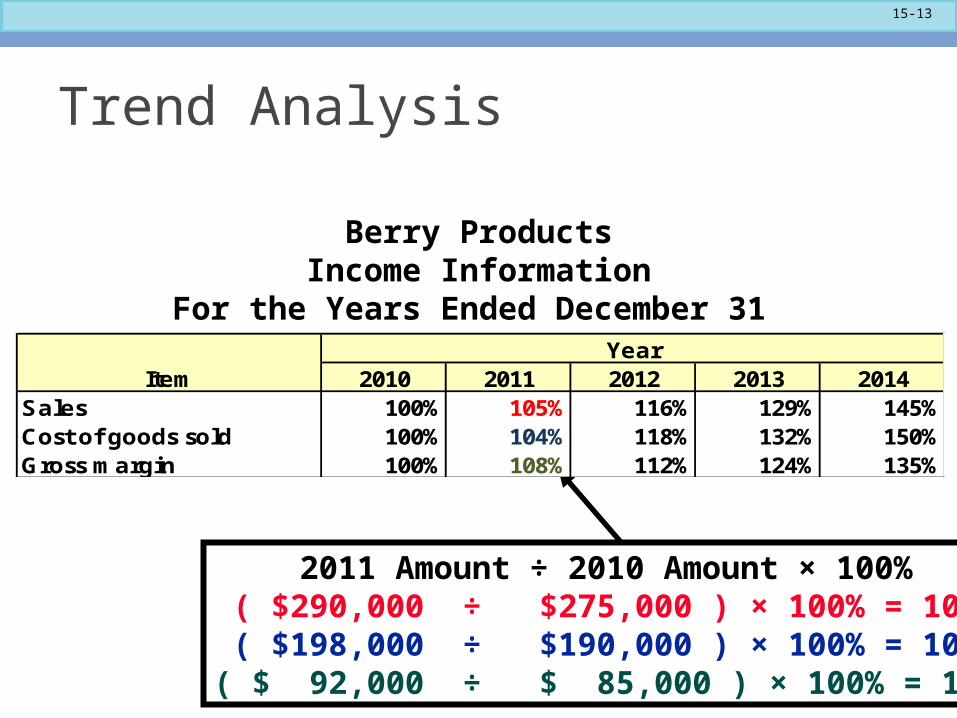
2011 Amount ÷ 2010 Amount × 100% ( $290,000 ÷ $275,000 ) × 100% = 105%( $198,000 ÷ $190,000 ) × 100% = 104%( $ 92,000 ÷ $ 85,000 ) × 100% = 108%
Berry ProductsIncome Information
For the Years Ended December 31 Year
Item 2010 2011 2012 2013 2014Sales 100% 105% 116% 129% 145%Cost of goods sold 100% 104% 118% 132% 150%Gross margin 100% 108% 112% 124% 135%
15-14
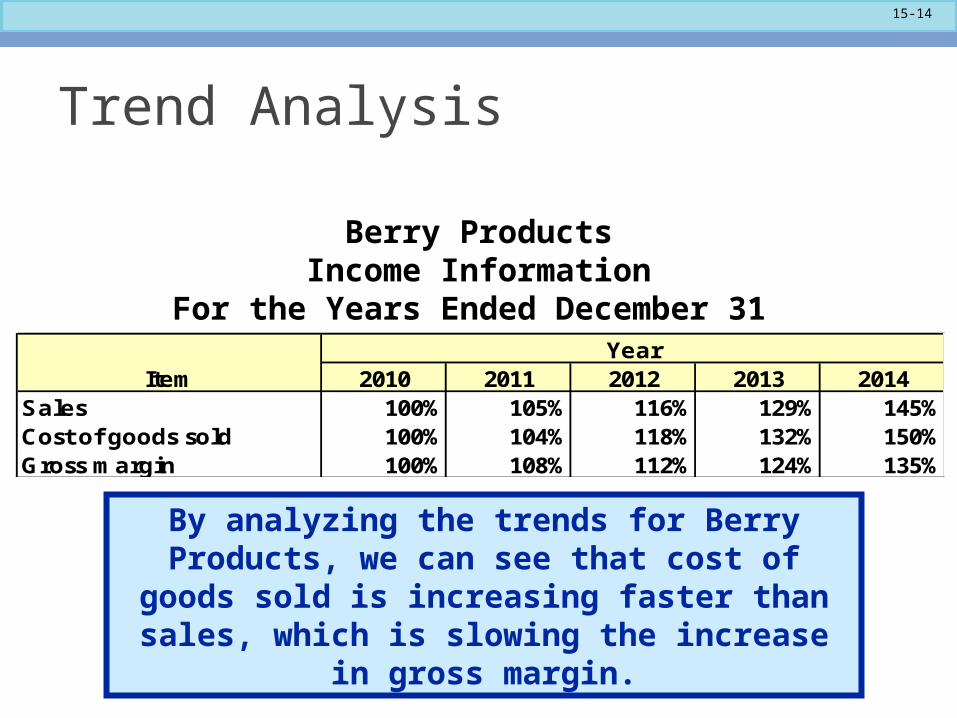
Trend Analysis
By analyzing the trends for Berry Products, we can see that cost of goods sold is increasing
faster than sales, which is slowing the increase in gross margin.
YearItem 2010 2011 2012 2013 2014
Sales 100% 105% 116% 129% 145%Cost of goods sold 100% 104% 118% 132% 150%Gross margin 100% 108% 112% 124% 135%
Berry ProductsIncome Information
For the Years Ended December 31
15-15
Common-Size Statements
Vertical analysis focuses on the relationships
among financial statement items at a given point in time. A
common-size financial statement is a vertical analysis in which each
financial statement item is expressed as a
percentage.
15-16
Common-Size Statements
In income statements, all items usually are expressed
as a percentage of sales.
15-17
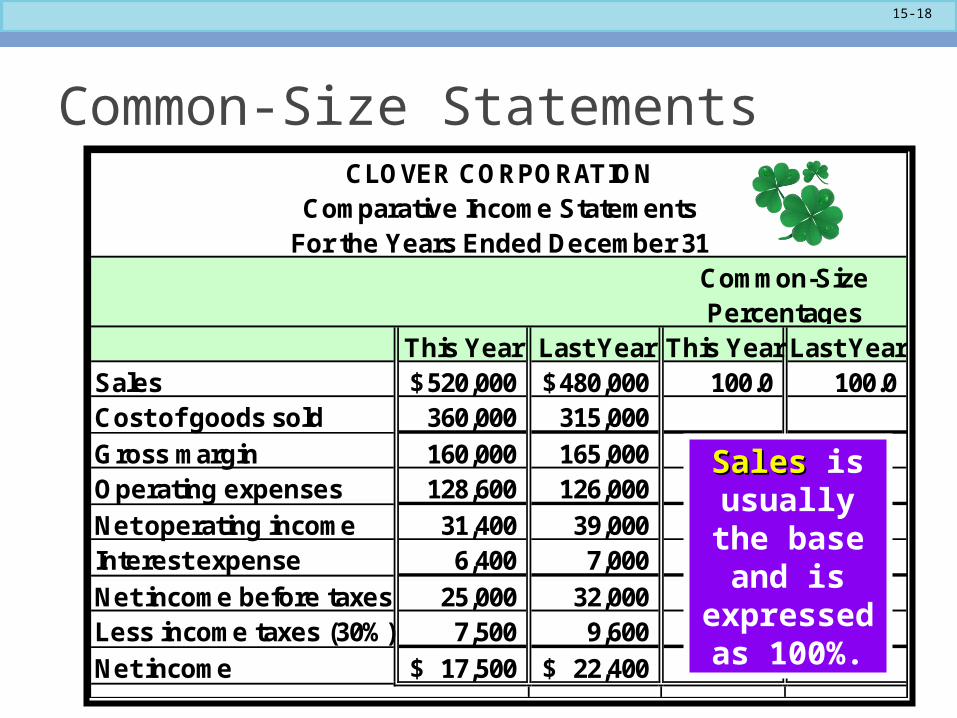
Common-Size Statements
Let’s take another look at the information from the comparative income statements of Clover Corporation for this year and
last year.
This time, let’s prepare common-size statements.
15-18
CLOVER CORPORATIONComparative Income Statements
For the Years Ended December 31Common-Size Percentages
This Year Last Year This Year Last YearSales 520,000$ 480,000$ 100.0 100.0 Cost of goods sold 360,000 315,000
Gross margin 160,000 165,000 Operating expenses 128,600 126,000
Net operating income 31,400 39,000 Interest expense 6,400 7,000
Net income before taxes 25,000 32,000 Less income taxes (30%) 7,500 9,600
Net income 17,500$ 22,400$
Common-Size Statements
Sales Sales is usually the base and is expressed as 100%.
15-19
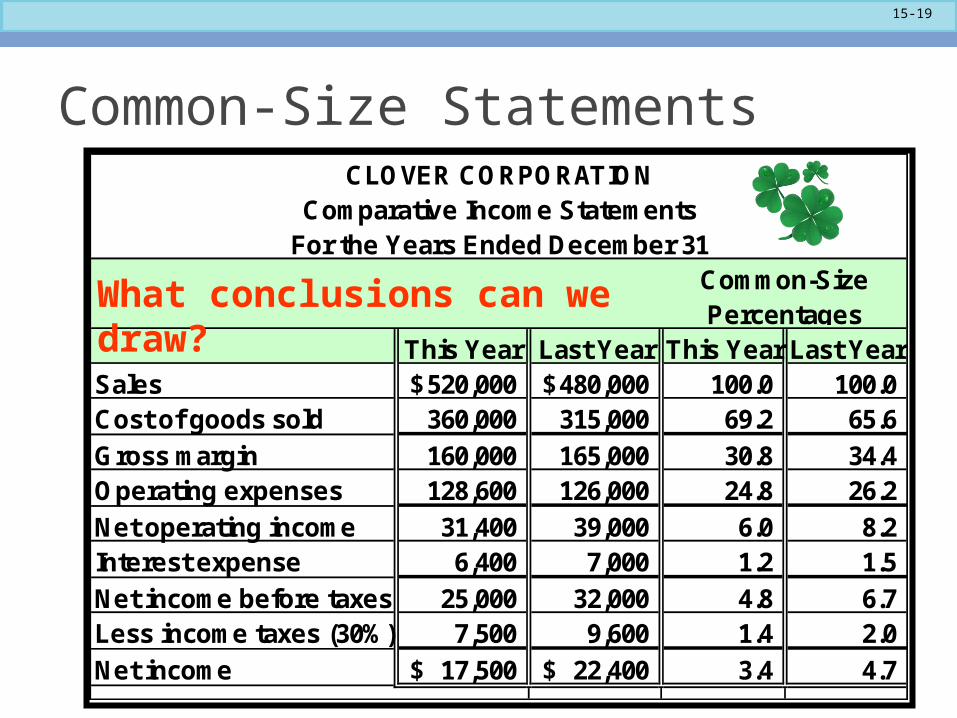
Common-Size StatementsCLOVER CORPORATION
Comparative Income StatementsFor the Years Ended December 31
Common-Size Percentages
This Year Last Year This Year Last YearSales 520,000$ 480,000$ 100.0 100.0 Cost of goods sold 360,000 315,000 69.2 65.6
Gross margin 160,000 165,000 30.8 34.4 Operating expenses 128,600 126,000 24.8 26.2
Net operating income 31,400 39,000 6.0 8.2 Interest expense 6,400 7,000 1.2 1.5
Net income before taxes 25,000 32,000 4.8 6.7 Less income taxes (30%) 7,500 9,600 1.4 2.0
Net income 17,500$ 22,400$ 3.4 4.7
What conclusions can we draw?
15-20
Learning Objective 2
Compute and interpret financial ratios that
managers use to assess liquidity.
15-21
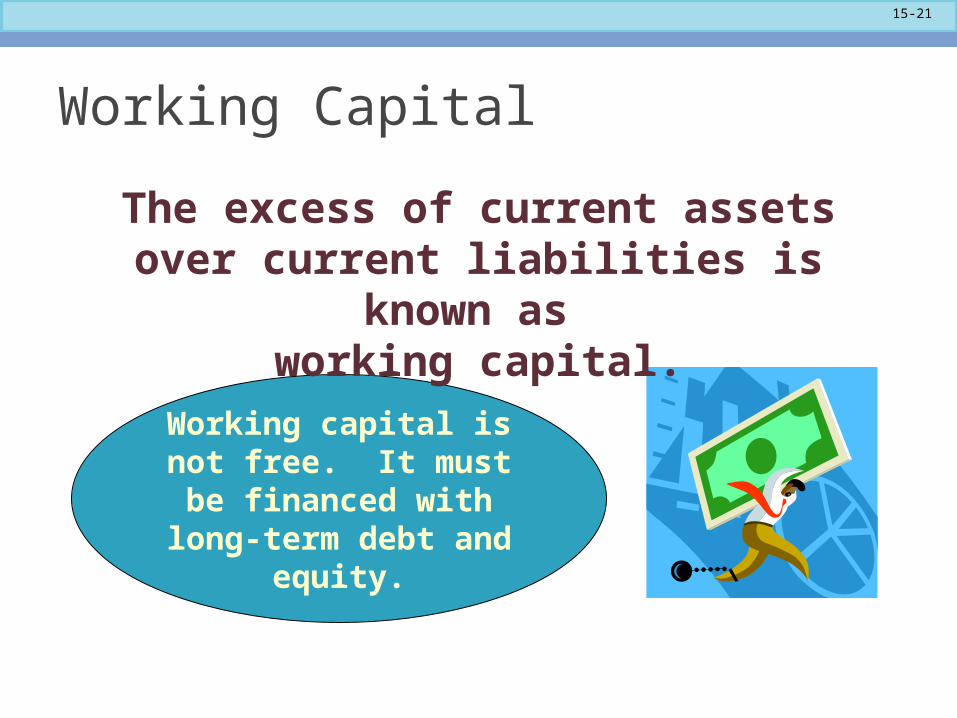
Working Capital
Working capital is not free. It must be
financed with long-term debt and equity.
The excess of current assets over current liabilities is known as
working capital.
15-22
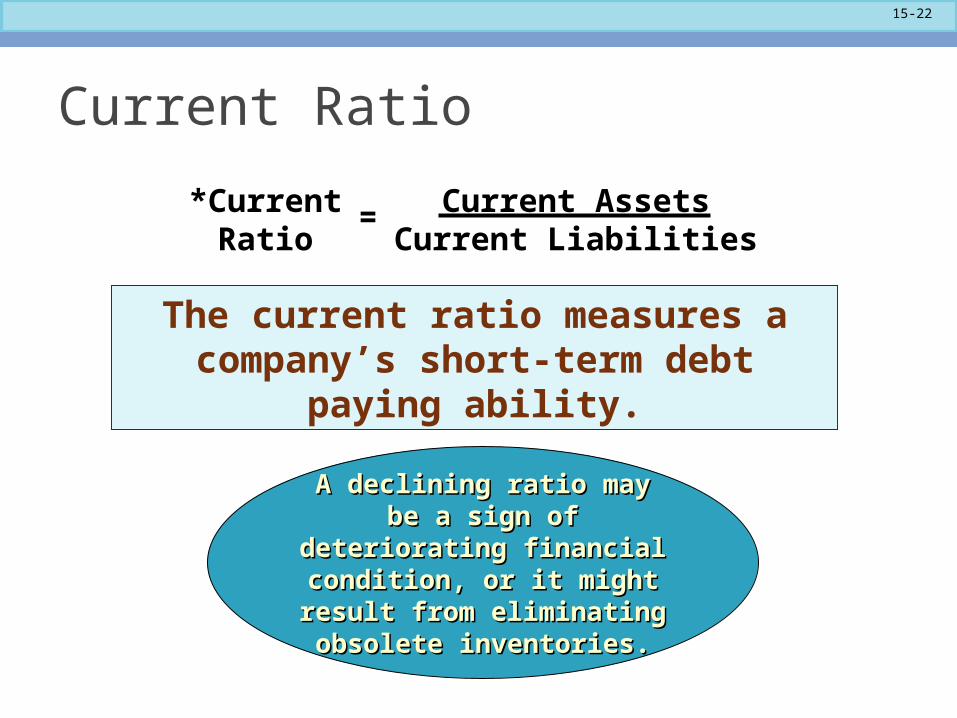
Current Ratio
A declining ratio may be a A declining ratio may be a sign of deteriorating sign of deteriorating
financial condition, or it financial condition, or it might result from eliminating might result from eliminating
obsolete inventories.obsolete inventories.
*CurrentRatio
Current Assets Current Liabilities
=
The current ratio measures a company’s short-term debt paying
ability.
15-23
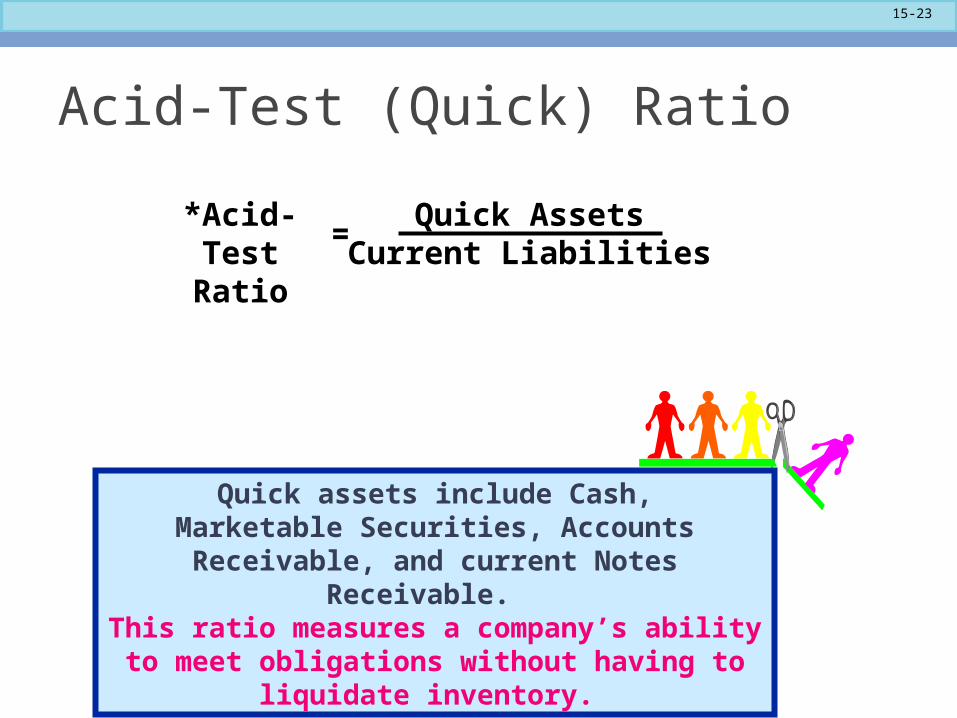
Acid-Test (Quick) Ratio
Quick Assets Current Liabilities
=*Acid-TestRatio
Quick assets include Cash,Marketable Securities, Accounts Receivable, and
current Notes Receivable. This ratio measures a company’s ability to meet
obligations without having to liquidate inventory.
15-24
Learning Objective 3
Compute and interpret financial ratios that
managers use for asset management purposes.
15-25
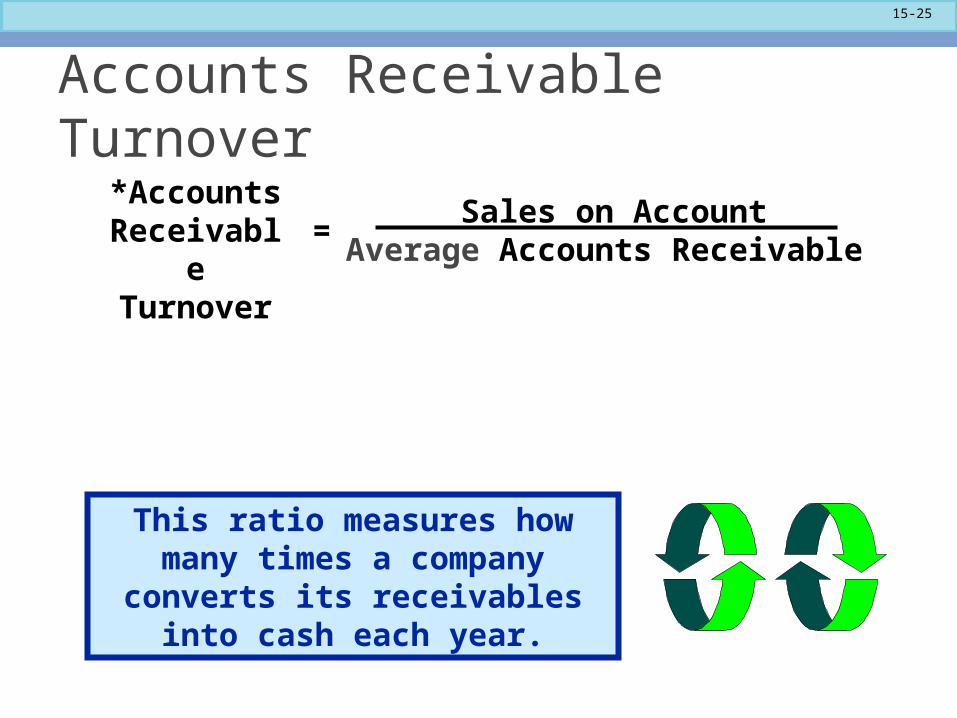
Accounts Receivable Turnover
Sales on Account Average Accounts Receivable
*Accounts ReceivableTurnover
=
This ratio measures how many times a company converts its
receivables into cash each year.
15-26
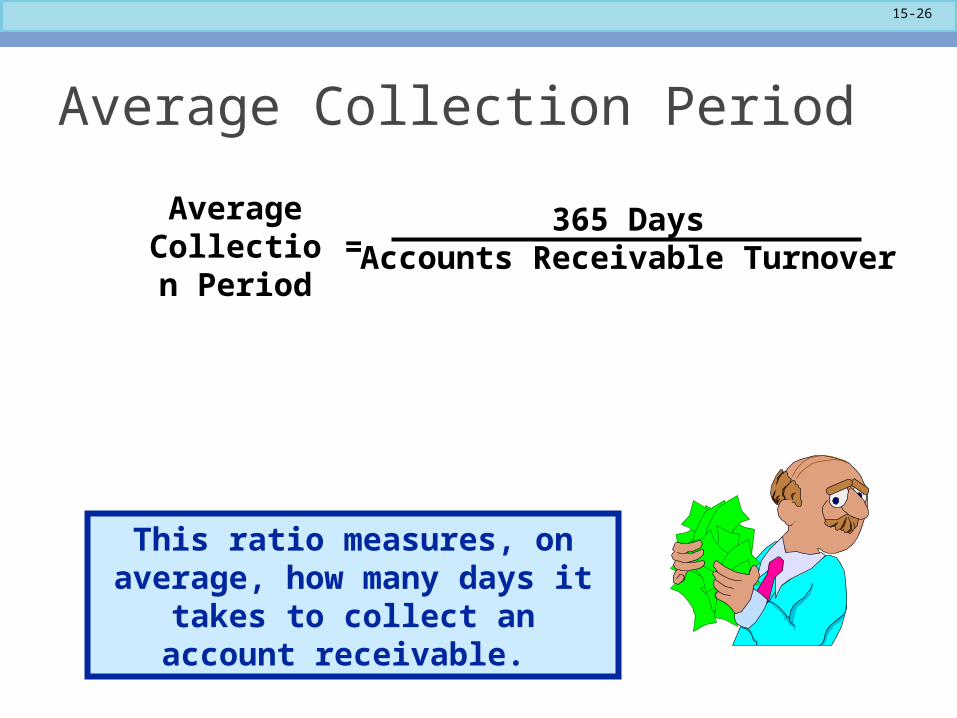
Average Collection Period
Average Collection
Period=
365 Days Accounts Receivable Turnover
This ratio measures, on average, how many days it takes to collect
an account receivable.
15-27
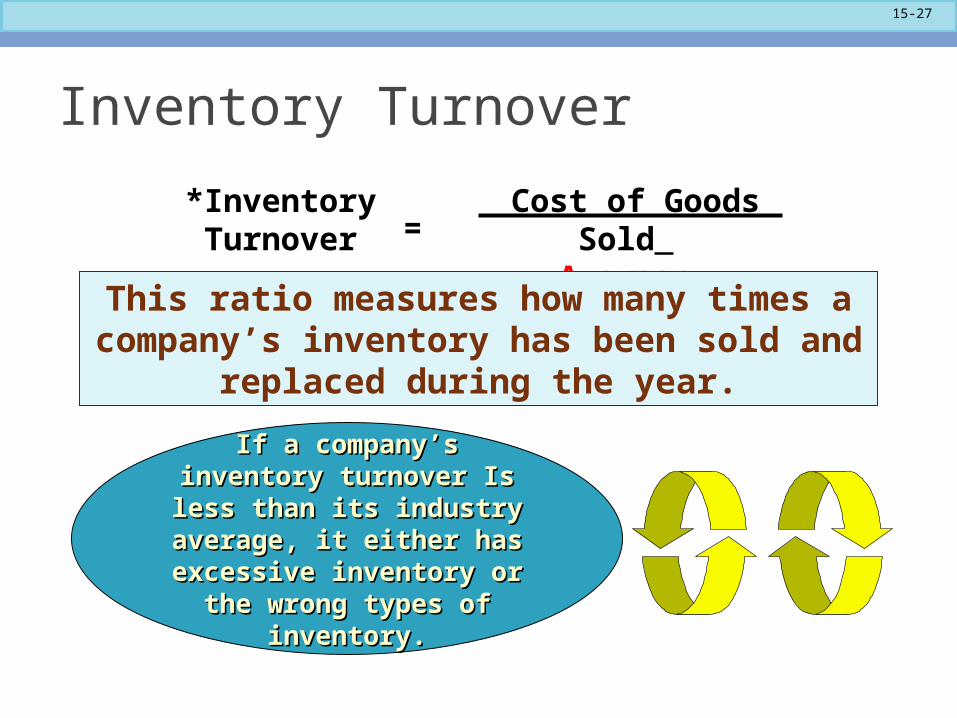
Inventory Turnover
If a company’s inventory If a company’s inventory turnover Is less than its turnover Is less than its
industry average, it either industry average, it either has excessive inventory or has excessive inventory or
the wrong types of the wrong types of inventory.inventory.
Cost of Goods Sold Average Inventory
*InventoryTurnover =
This ratio measures how many times a company’s inventory has been sold and
replaced during the year.
15-28
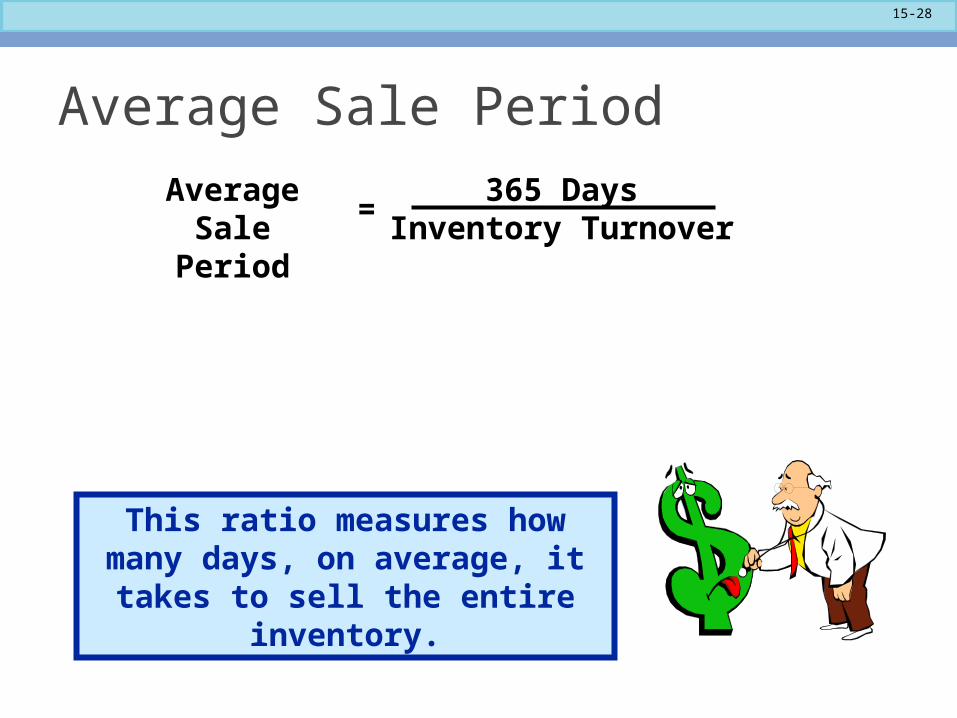
Average Sale Period
Average Sale Period
= 365 Days Inventory Turnover
This ratio measures how many days, on average, it takes to sell
the entire inventory.
15-29
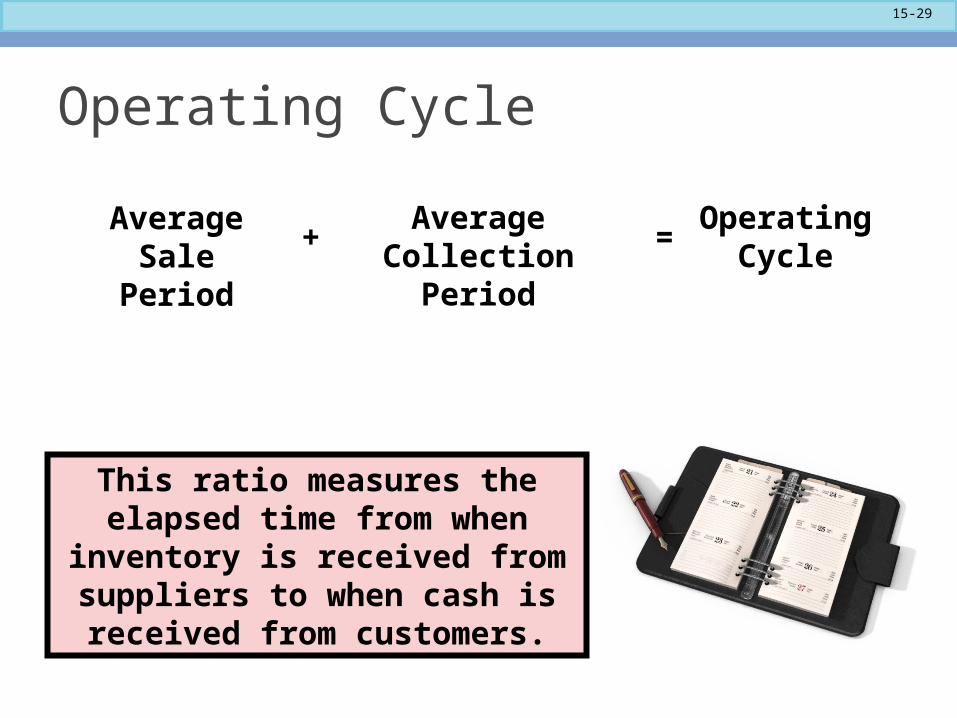
Operating Cycle
Average Sale Period
+Average
Collection Period=
Operating Cycle
This ratio measures the elapsed time from when inventory is
received from suppliers to when cash is received from customers.
15-30
Learning Objective 4
Compute and interpret financial ratios that
managers use for debt management purposes.
15-31
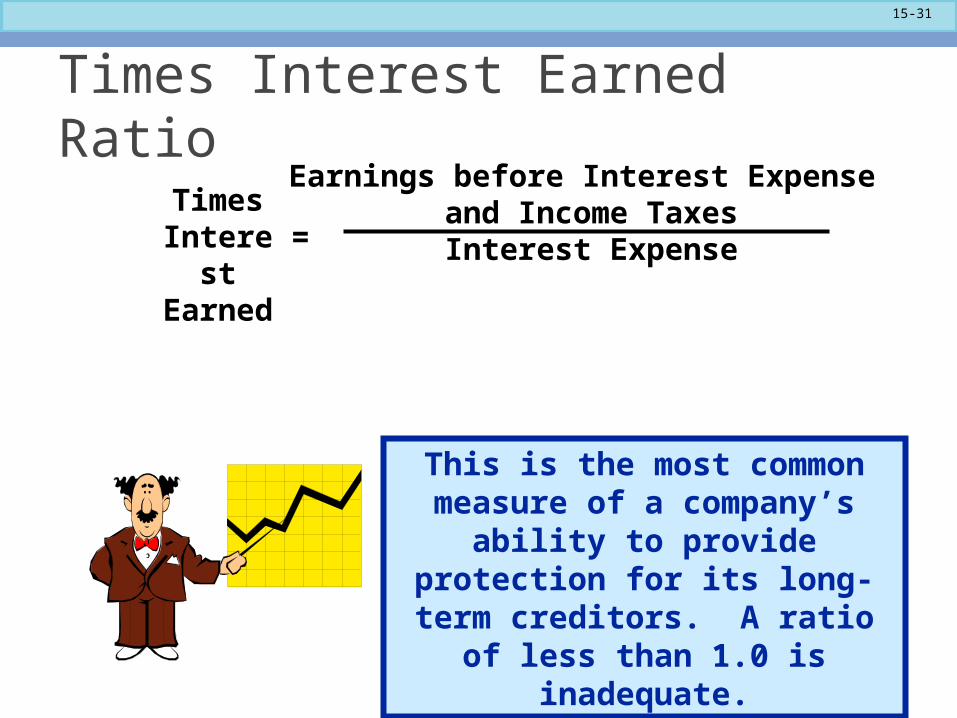
Times Interest Earned Ratio
This is the most common measure of a company’s ability
to provide protection for its long-term creditors. A ratio of
less than 1.0 is inadequate.
Times Interest Earned
Earnings before Interest Expense and Income TaxesInterest Expense=
15-32
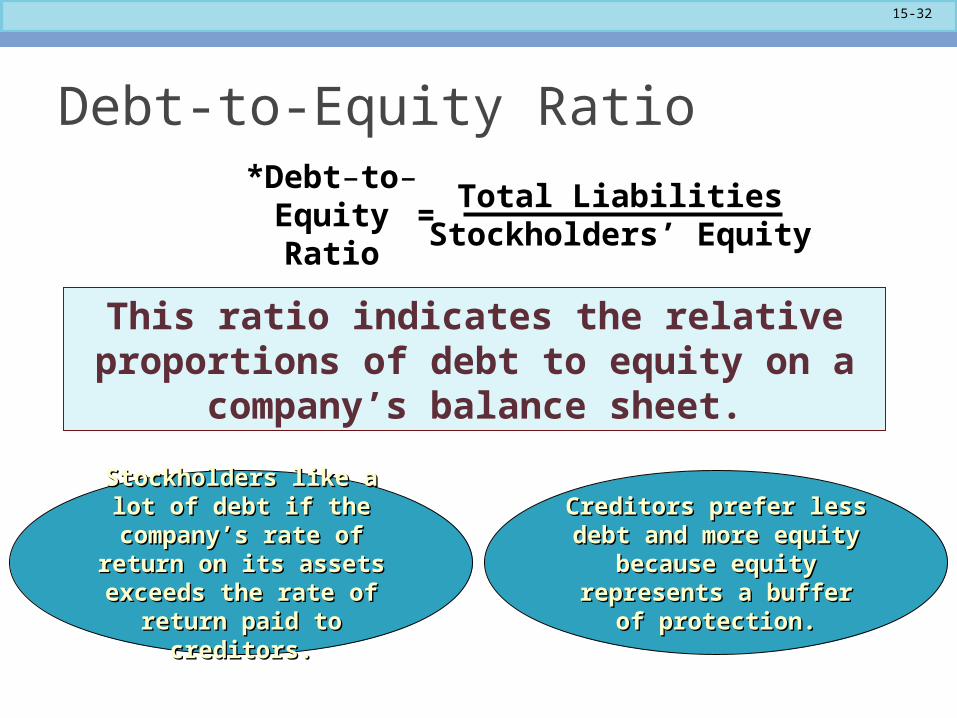
Debt-to-Equity Ratio
Stockholders like a lot of Stockholders like a lot of debt if the company’s rate debt if the company’s rate
of return on its assets of return on its assets exceeds the rate of return exceeds the rate of return
paid to creditors.paid to creditors.
Creditors prefer less debt Creditors prefer less debt and more equity because and more equity because equity represents a buffer equity represents a buffer
of protection.of protection.
Total Liabilities Stockholders’ Equity
*Debt–to–Equity Ratio
=
This ratio indicates the relative proportions of debt to equity on a company’s balance
sheet.
15-33
Learning Objective 5
Compute and interpret financial ratios that
managers use to assess profitability.
15-34
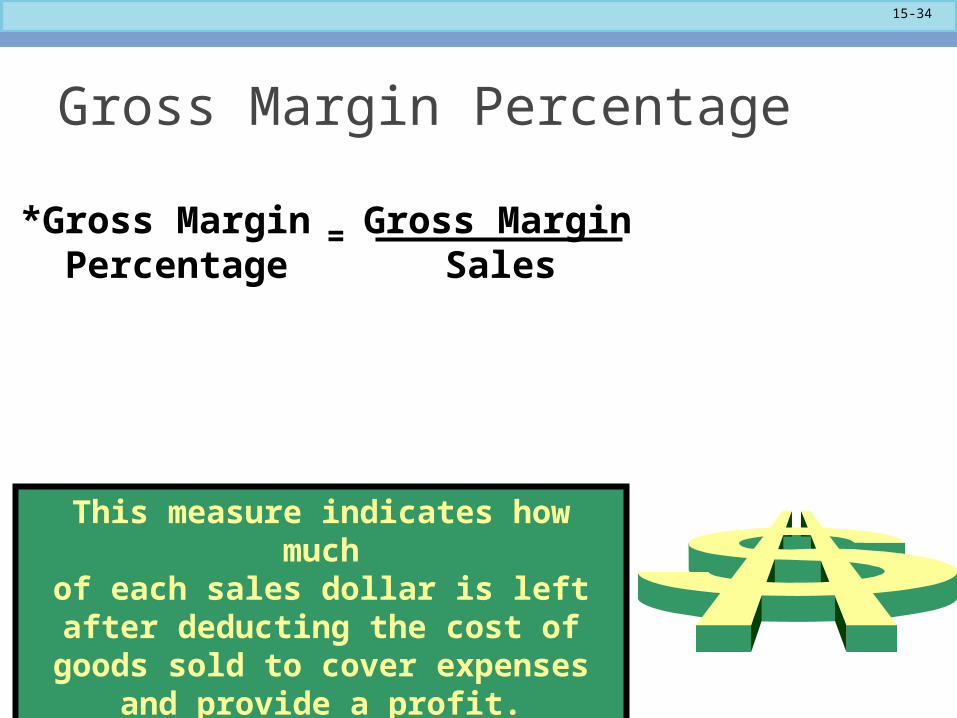
Gross Margin Percentage
*Gross Margin Percentage
Gross Margin Sales
=
This measure indicates how muchof each sales dollar is left after
deducting the cost of goods sold to cover expenses and provide a profit.

15-35
Net Profit Margin Percentage
*Net Profit Margin Percentage
Net IncomeSales
=
In addition to cost of goods sold, this ratio also looks at how selling and administrative expenses, interest expense, and income tax expense
influence performance.
15-36
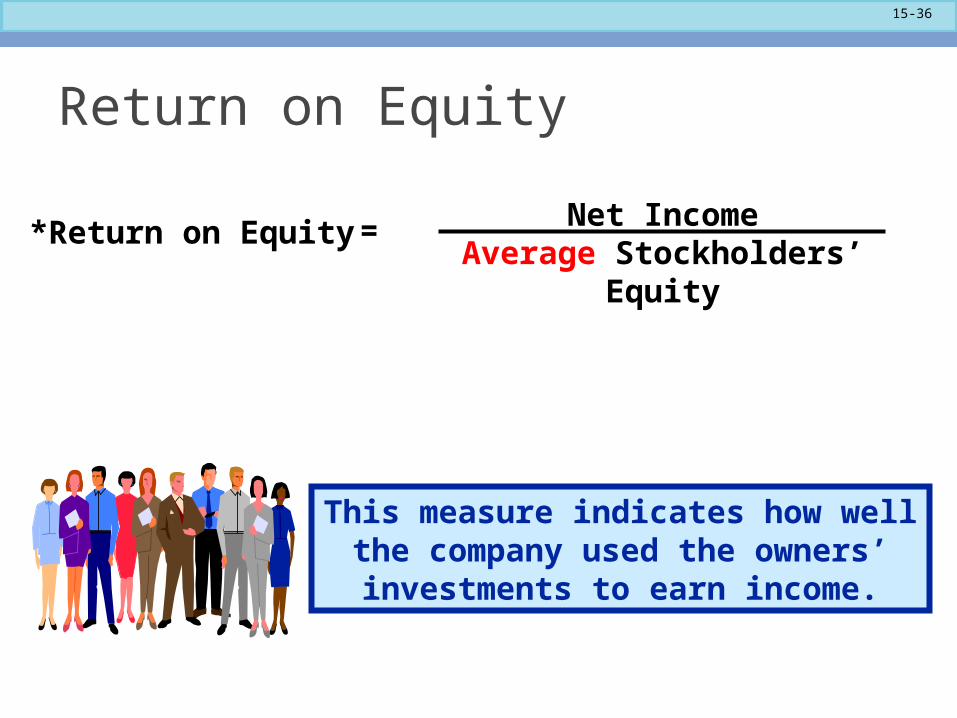
Return on Equity
*Return on EquityNet Income
Average Stockholders’ Equity=
This measure indicates how well the company used the owners’
investments to earn income.
15-37
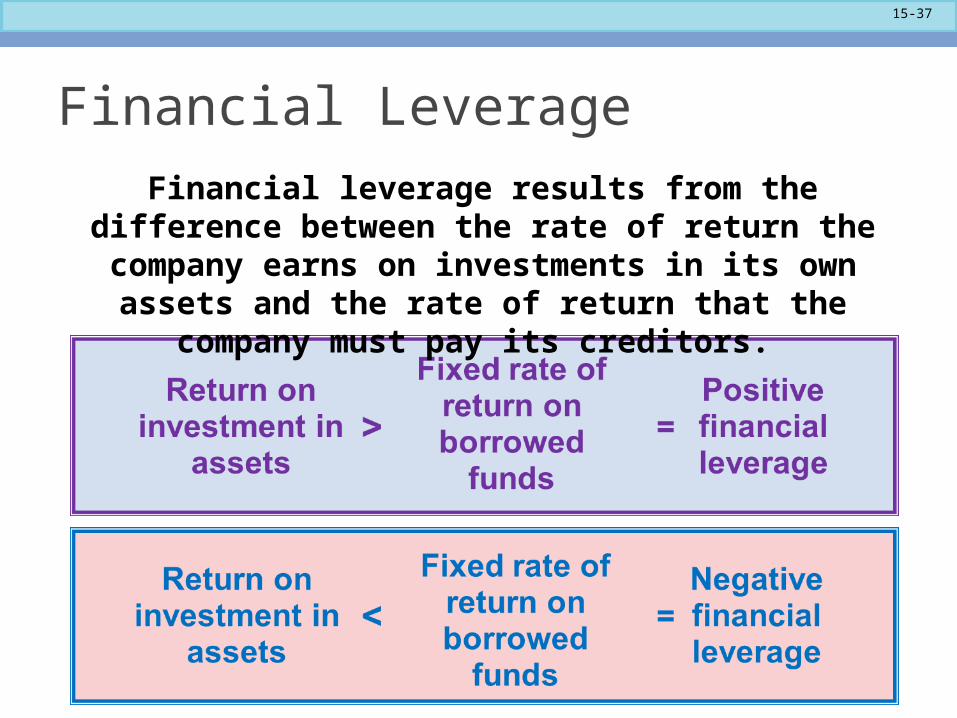
Financial Leverage
Financial leverage results from the difference between the rate of return the company earns on investments
in its own assets and the rate of return that the company must pay its creditors.
15-38
Learning Objective 6
Compute and interpret financial ratios that
managers use to assess market performance.
15-39
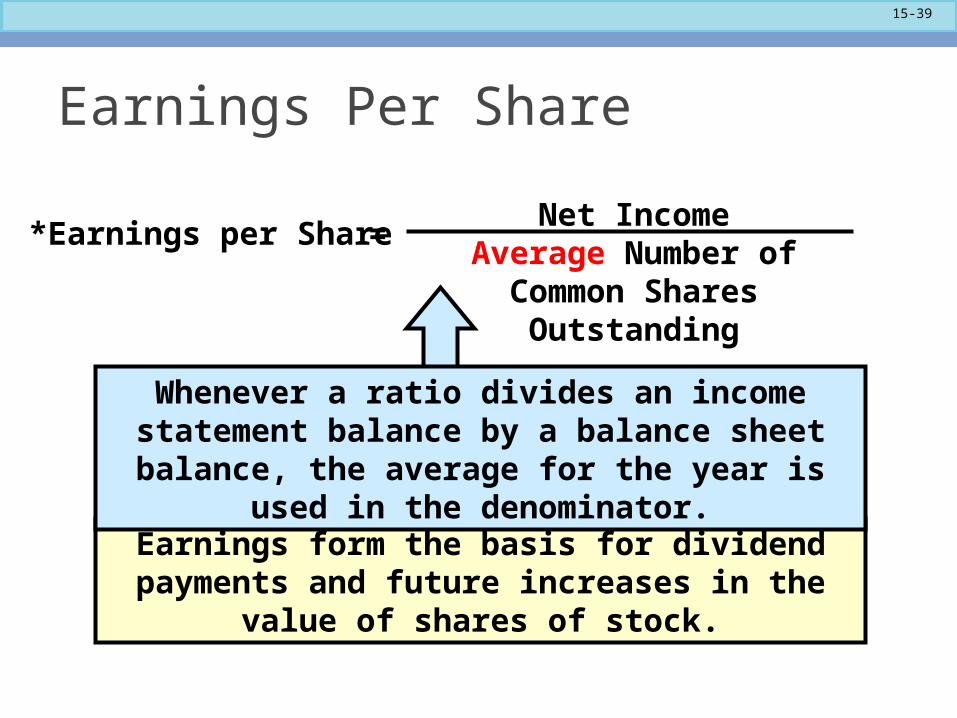
Earnings Per Share
*Earnings per ShareNet Income
Average Number of Common Shares Outstanding
=
Earnings form the basis for dividend payments and future increases in the value of shares of
stock.
Whenever a ratio divides an income statement balance by a balance sheet balance, the average
for the year is used in the denominator.
15-40
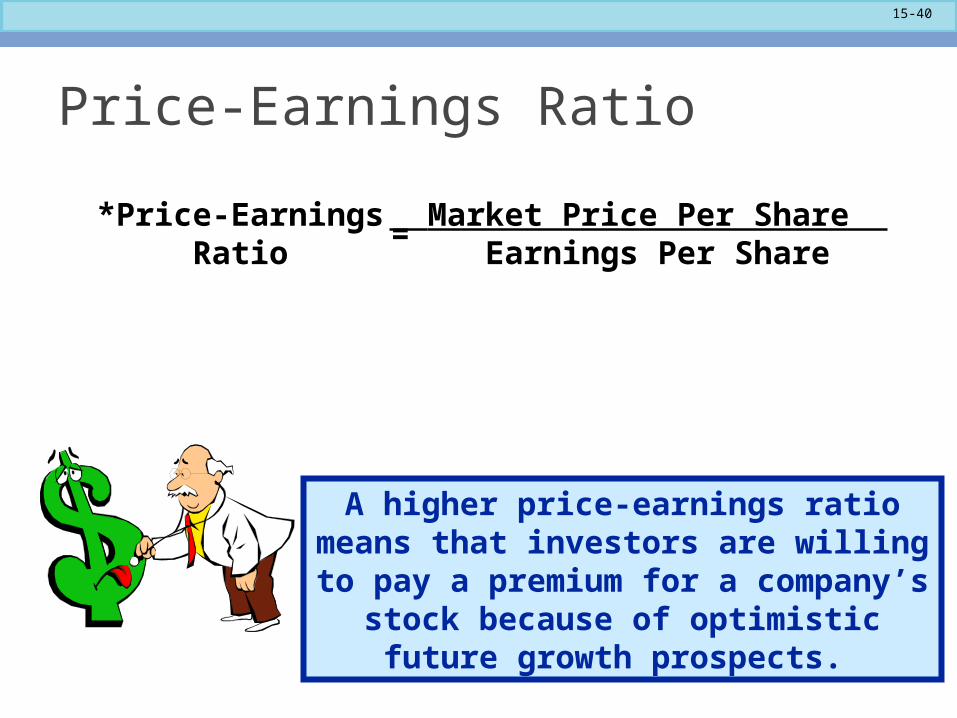
Price-Earnings Ratio
*Price-EarningsRatio
Market Price Per Share Earnings Per Share
=
A higher price-earnings ratio means that investors are willing to pay a premium
for a company’s stock because of optimistic future growth prospects.
15-41
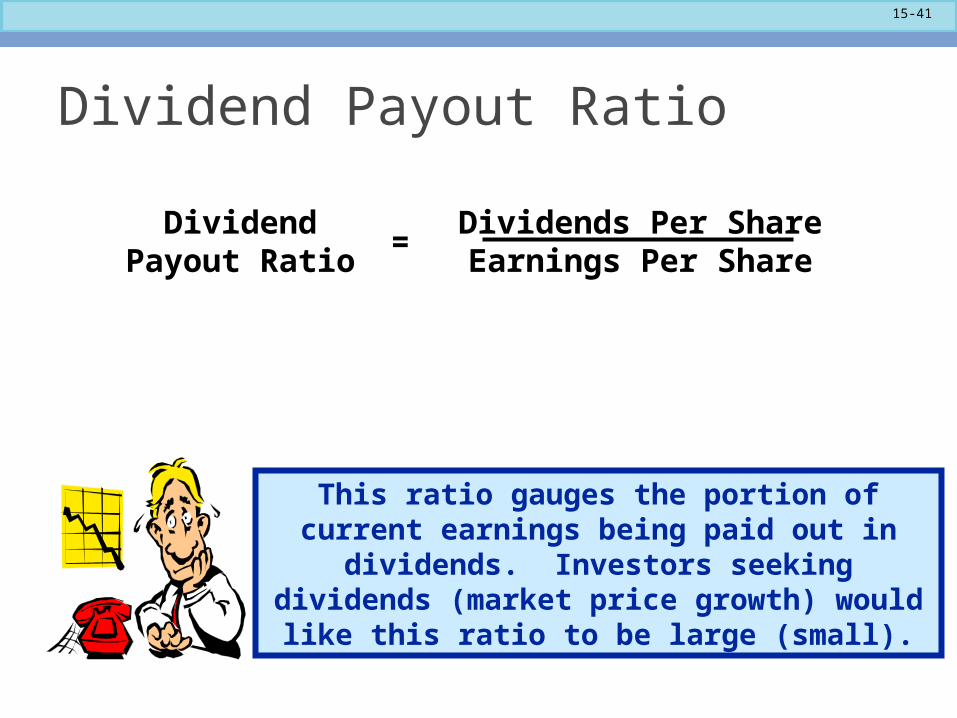
Dividend Payout Ratio
DividendPayout Ratio
Dividends Per Share Earnings Per Share
=
This ratio gauges the portion of current earnings being paid out in dividends. Investors seeking dividends (market price growth) would
like this ratio to be large (small).
15-42
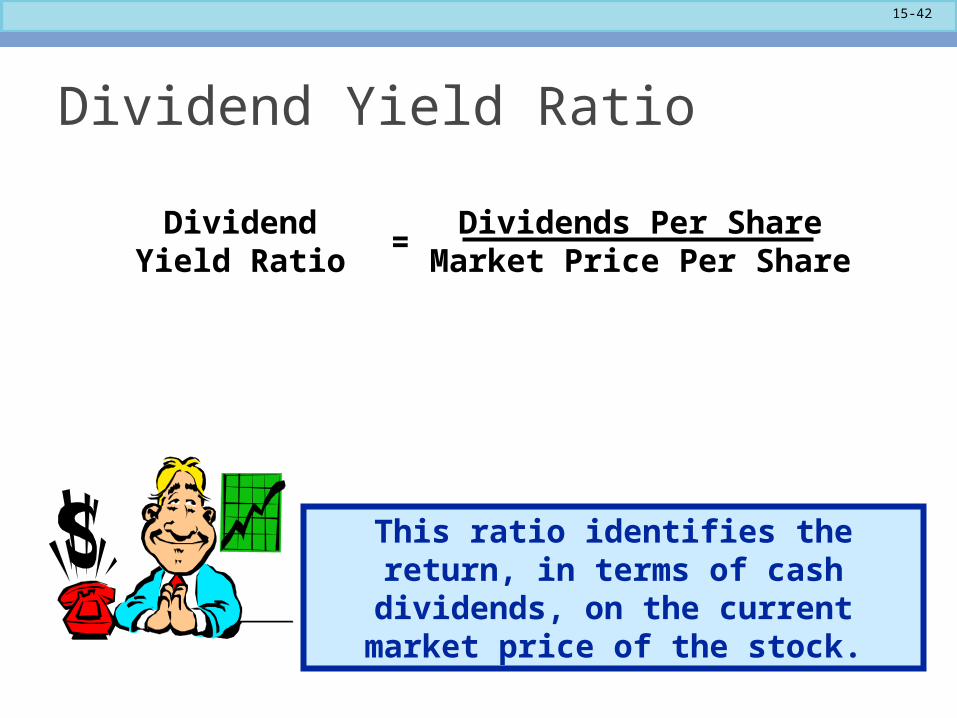
Dividend Yield Ratio
DividendYield Ratio
Dividends Per Share Market Price Per Share
=
This ratio identifies the return, in terms of cash dividends, on the current
market price of the stock.
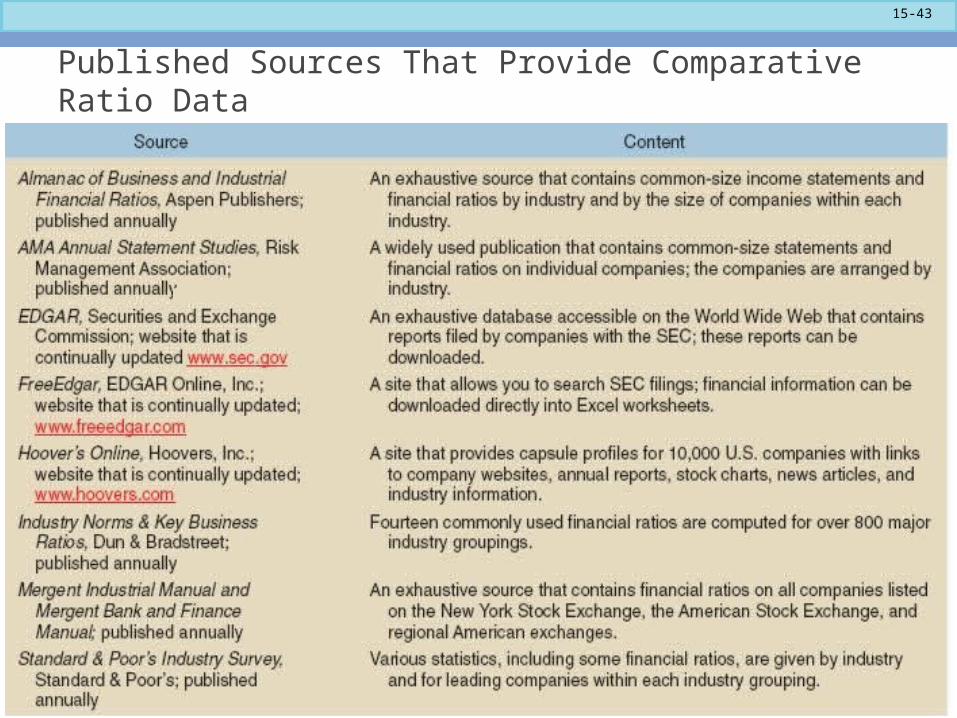
15-43
Published Sources That Provide Comparative Ratio Data
15-44
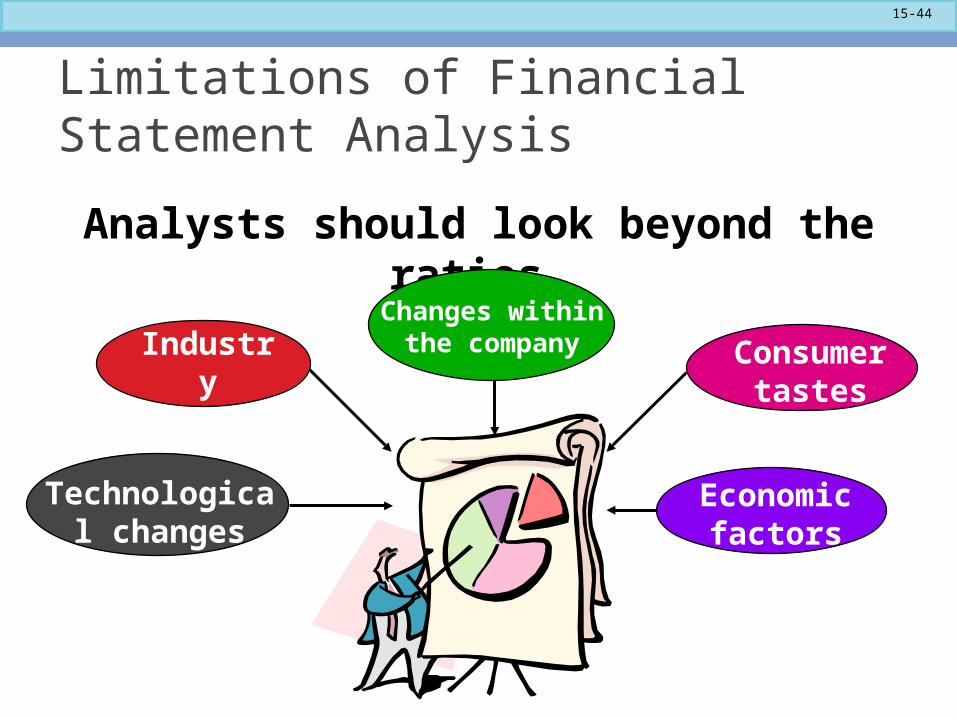
Limitations of Financial Statement Analysis
Analysts should look beyond the ratios.
Economic factors
Industry trends
Changes within the company
Technological changes
Consumer tastes