financial results - icici prulife
TRANSCRIPT


1
News release: April 24, 2018
NSE Code: ICICIPRULI BSE Code: 540133
VNB growth of 93.1%
Embedded Value rises to ` 187.88 billion
ICICI Prudential Life Insurance announces a strong full year financial performance.
The profitability of new business written, as measured in the Value of New Business (VNB),
increased 93.1% to ` 12.86 billion in FY2018 from ` 6.66 billion in FY2017. The Annualized
Premium Equivalent (APE) of new business written during the year increased 17.6%.
Protection APE grew by 71.5% to ` 4.46 billion in FY2018 from ` 2.60 billion in FY2017.
Embedded Value (EV*) rose by 16.1% to ` 187.88 billion as on March 31, 2018 from ` 161.84
billion as on March 31, 2017. The quality of business as measured by 13th
month persistency1
improved to 86.9%.
Commenting on the performance Mr. Sandeep Batra, Executive Director ICICI Prudential Life,
said “The Company registered a robust and well-rounded performance on all parameters. We
are a retail focused company and our endeavour has been to simplify the life insurance buying
process through customer centric products backed by superior customer service and
technology. This philosophy has ensured good quality of sale as seen in the high 13th
month
persistency and other value drivers. We are excited about the opportunities coming from
formalization of the economy and consequently financialisation of savings. We will continue
in our efforts to serve the protection and savings needs of individuals in the country.”
1. Excluding group and single premium policies
2
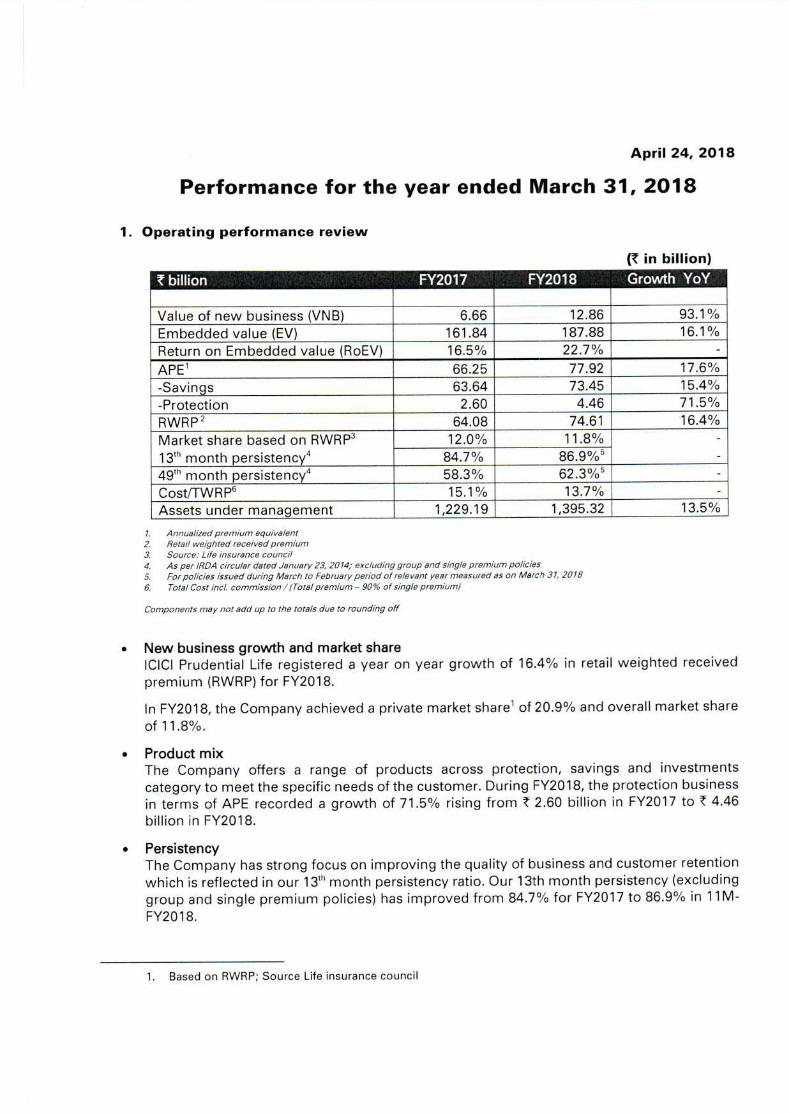
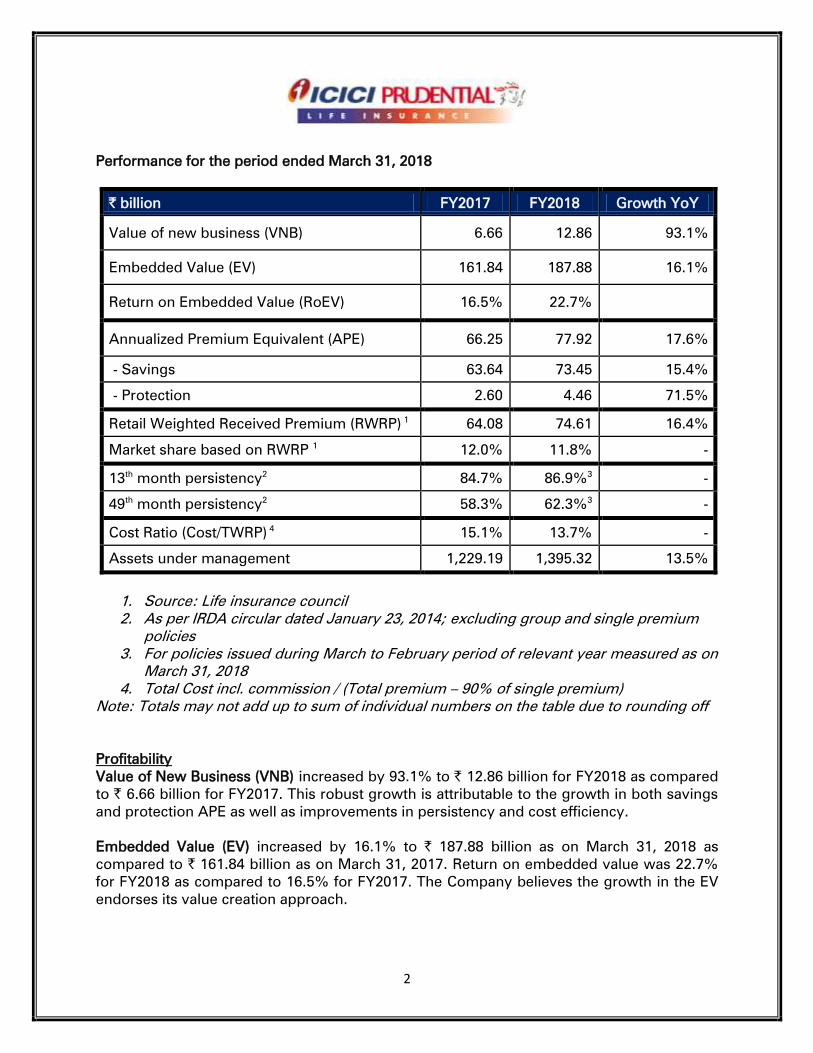
Performance for the period ended March 31, 2018
` billion FY2017 FY2018 Growth YoY
Value of new business (VNB) 6.66 12.86 93.1%
Embedded Value (EV) 161.84 187.88 16.1%
Return on Embedded Value (RoEV) 16.5% 22.7%
Annualized Premium Equivalent (APE)
66.25 77.92 17.6%
- Savings 63.64 73.45 15.4%
- Protection 2.60 4.46 71.5%
Retail Weighted Received Premium (RWRP) 1
64.08 74.61 16.4%
Market share based on RWRP 1
12.0% 11.8% -
13th
month persistency2
84.7% 86.9%3
-
49th
month persistency2
58.3% 62.3%3
-
Cost Ratio (Cost/TWRP) 4
15.1% 13.7% -
Assets under management 1,229.19 1,395.32 13.5%
1. Source: Life insurance council
2. As per IRDA circular dated January 23, 2014; excluding group and single premium
policies
3. For policies issued during March to February period of relevant year measured as on
March 31, 2018
4. Total Cost incl. commission / (Total premium – 90% of single premium)
Note: Totals may not add up to sum of individual numbers on the table due to rounding off
Profitability
Value of New Business (VNB) increased by 93.1% to ` 12.86 billion for FY2018 as compared
to ` 6.66 billion for FY2017. This robust growth is attributable to the growth in both savings
and protection APE as well as improvements in persistency and cost efficiency.
Embedded Value (EV) increased by 16.1% to ` 187.88 billion as on March 31, 2018 as
compared to ` 161.84 billion as on March 31, 2017. Return on embedded value was 22.7%
for FY2018 as compared to 16.5% for FY2017. The Company believes the growth in the EV
endorses its value creation approach.

3
New business growth
The Annualized Premium Equivalent (APE) of the Company increased by 17.6% year on year.
The savings business grew by 15.4% and protection business grew by 71.5% in the fiscal.
The Retail Weighted Received Premium (RWRP) of the Company registered a year on year
growth of 16.4% for FY2018. In FY2018, the Company achieved a private market share of
20.9% and overall market share of 11.8%.
Quality of business and efficiency
Persistency: The Company continues to make improvements in its persistency metrics. The
13th
month persistency improved to 86.9% for 11m-FY2018 from 84.7% for FY2017 and the
49th
month persistency improved to 62.3% for 11m-FY2018 from 58.3% for FY2017. This is
validation of the Company’s efforts to deliver superior customer service across all channels
and reaffirms the faith reposed in the Company by customers as their company of choice.
Cost ratios: The cost to Total Weighted Received Premium (TWRP) ratio stood at 13.7% for
FY2018 (15.1% for FY2017) primarily on account of growth in the business.
The Assets under Management (AUM) increased to ̀ 1,395.32 billion for FY2018 as compared
to ` 1,229.19 billion in FY2017, a growth of 13.5%.
Dividend
The Board has approved a Final dividend of ` 3.30 per equity share (including the special
dividend of ` 1.10 per equity share) for H2-FY2018. This is in addition to the interim dividend
of ̀ 3.40 per share already declared and paid, bringing the aggregate of total dividend of ̀ 6.70
per share for FY2018.
The Board of Directors of ICICI Prudential Life Insurance Company Limited approved its
audited financial results for the quarter ended March 31, 2018, following its meeting on
Tuesday, April 24, 2018 in Mumbai. The disclosure of financial results submitted to exchanges
is annexed to this release.

4
Definitions, abbreviations and explanatory notes
Annual Premium Equivalent (APE): APE is a measure of new business written by a life insurance
company. It is computed as the sum of annualised first year premiums on regular premium policies,
and ten percent of single premiums, written by the Company during any period from new retail and
group customers.
Value of New Business (VNB) and VNB margin: VNB is used to measure profitability of the new
business written in a period. It is present value of all future profits to shareholders measured at the
time of writing of the new business contract. Future profits are computed on the basis of long term
assumptions which are reviewed annually. Also referred to as NBP (new business profit). VNB
margin is computed as VNB for the period/APE for the period. It is similar to profit margin for any
other business.
Embedded Value (EV): EV is the current net worth of the company plus the present value of all
future profits to shareholders from the existing book of the Company (including new business
written in the year). As in the case of VNB, future profits are computed based on assumptions which
are reviewed annually. A positive EV variance is indicative of superior performance by the
Company as compared to what was assumed in arriving at the EV at the beginning of the year. A
positive EV variance and VNB increase the EV year on year. The change in EV because of
performance as compared to assumptions is disclosed by the Company through Analysis of
Movement disclosure annually. EV has been computed using IEV principles set out in Actuarial
practice standard 10.
Retail Weighted Received Premium (RWRP): RWRP is a new business measure very similar to APE
for the retail (also referred to as individual) business with the only difference being that the regular
premiums considered here are first year premiums actually received by the life insurer and not
annualised. Secondly since it is a new business measure for retail business, it includes only
premium received from retail customers. It is the sum of all retail first year premiums and ten
percent of retail single premiums received in a period.
Persistency: It is the most common parameter for quality of business representing the percentage
of retail policies (where premiums are expected) that continue paying premiums. The method of
computation of Persistency has been prescribed by IRDAI vide its circular dated January 23, 2014.
Total Weighted Received Premium (TWRP): TWRP is a measure of total premiums from new and
existing retail and group customers received in a period. It is sum of first year and renewal
premiums on regular premium policies and ten percent of single premiums received from both
retail and group customers by Company during the period.
Cost Ratio: Cost ratio is a measure of the cost efficiency of a Company. Expenses are incurred by
the Company on new business as well as renewal premiums. Cost ratio is computed as a ratio of
all expenses incurred in a period comprising commission, operating expenses, provision for
doubtful debts and bad debts written off to total weighted received premium (TWRP).
5
About ICICI Prudential Life Insurance
ICICI Prudential Life Insurance Company Ltd. (ICICI Prudential Life) is a joint venture between ICICI
Bank Ltd. and Prudential Corporation Holdings Limited which is a part of an international financial
services group headquartered in United Kingdom. ICICI Prudential Life was amongst the first private
sector insurance companies to begin operations in December 2000. The Company offers products
across the categories of Protection and Savings that fulfil the different life stage needs of customers.
ICICI Prudential Life is the first private life insurance company to cross the `1 trillion mark for assets
under management (AUM) and as on March 31, 2018 had an AUM of `1,395.32 billion. ICICI Prudential
Life is listed on both National Stock Exchange (NSE) and The Bombay Stock Exchange (BSE).
Disclaimer
Except for the historical information contained herein, statements in this release which contain words or phrases
such as 'will', ‘expected to’, etc., and similar expressions or variations of such expressions may constitute 'forward-
looking statements'. These forward-looking statements involve a number of risks, uncertainties and other factors
that could cause actual results, opportunities and growth potential to differ materially from those suggested by the
forward-looking statements. These risks and uncertainties include, but are not limited to, the actual growth in
demand for insurance and other financial products and services in the countries that we operate or where a
material number of our customers reside, our ability to successfully implement our strategy, including our use of
the Internet and other technology our exploration of merger and acquisition opportunities, our ability to integrate
mergers or acquisitions into our operations and manage the risks associated with such acquisitions to achieve our
strategic and financial objectives, our growth and expansion in domestic and overseas markets, technological
changes, our ability to market new products, the outcome of any legal, tax or regulatory proceedings in India and
in other jurisdictions we are or become a party to, the future impact of new accounting standards, our ability to
implement our dividend policy, the impact of changes in insurance regulations and other regulatory changes in
India and other jurisdictions on us. ICICI Prudential Life insurance undertakes no obligation to update forward-
looking statements to reflect events or circumstances after the date thereof. This release does not constitute an
offer of securities.
For further press queries please call Rajiv Adhikari / Akash Agarwal +91-22-40391600 (Ext: 1703 / 1732)
or email [email protected]
1 billion = 100 crore

Searchable format

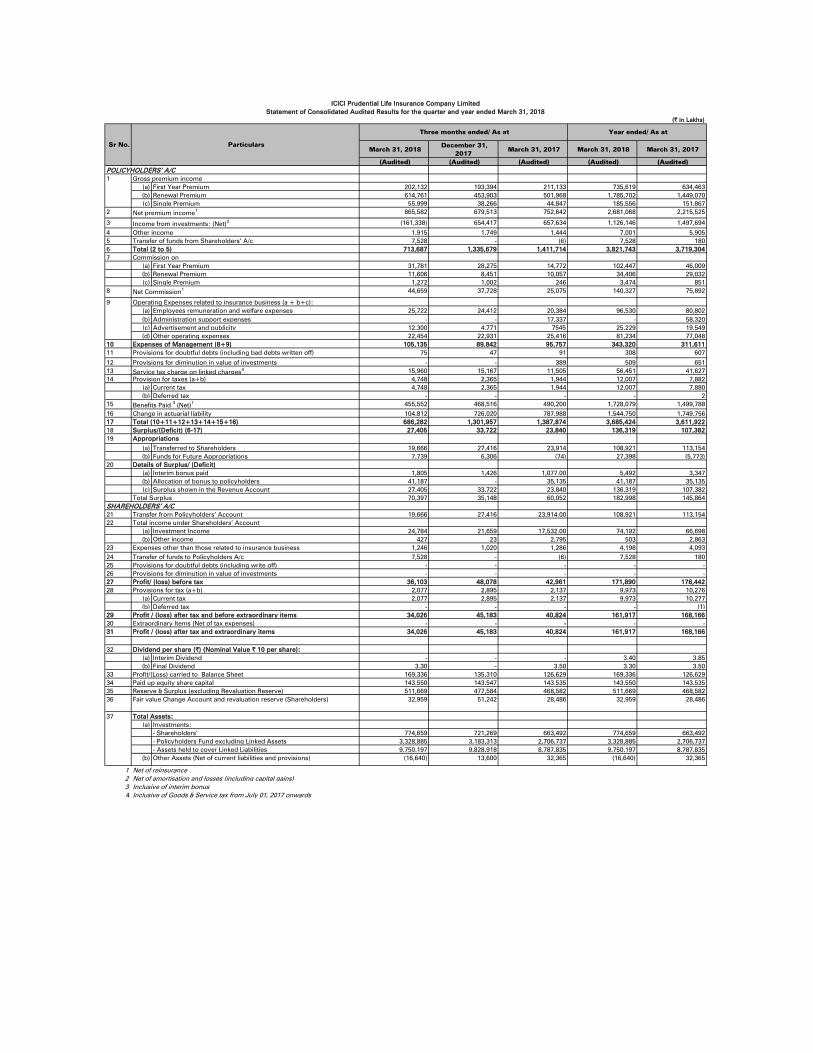
(` in Lakhs)
March 31, 2018 December 31,
2017 March 31, 2017 March 31, 2018 March 31, 2017
(Audited) (Audited) (Audited) (Audited) (Audited)
(a) First Year Premium 202,132 193,394 211,133 735,619 634,463
(b) Renewal Premium 614,761 453,903 501,968 1,785,702 1,449,070
(c) Single Premium 55,999 38,266 44,847 185,556 151,867
2 865,582 679,513 752,642 2,681,068 2,215,525
3 (161,338) 654,417 657,634 1,126,146 1,497,694
4 1,915 1,749 1,444 7,001 5,905
5 7,528 - (6) 7,528 180
6 713,687 1,335,679 1,411,714 3,821,743 3,719,304
7
(a) First Year Premium 31,781 28,275 14,772 102,447 46,009
(b) Renewal Premium 11,606 8,451 10,057 34,406 29,032
(c) Single Premium 1,272 1,002 246 3,474 851
8 44,659 37,728 25,075 140,327 75,892
(a) Employees remuneration and welfare expenses 25,722 24,412 20,384 96,530 80,802
(b) Administration support expenses - - 17,337 - 58,320
(c) Advertisement and publicity 12,300 4,771 7,545 25,229 19,549
(d) Other operating expenses 22,453 22,931 25,416 81,234 77,048
10 105,134 89,842 95,757 343,320 311,611
11 75 47 91 308 607
12 - - 389 509 651
13 15,960 15,167 11,505 56,451 41,627
14 4,749 2,365 1,944 12,007 7,882
(a) Current tax 4,749 2,365 1,944 12,007 7,880
(b) Deferred tax - - - - 2
15 455,552 468,516 490,200 1,728,079 1,499,788
16 104,812 726,020 787,988 1,544,750 1,749,756
17 686,282 1,301,957 1,387,874 3,685,424 3,611,922
18 27,405 33,722 23,840 136,319 107,382
19
(a) Transferred to Shareholders 19,666 27,416 23,914 108,921 113,154
(b) Funds for Future Appropriations 7,739 6,306 (74) 27,398 (5,773)
20
(a) Interim bonus paid 1,805 1,426 1,077 5,492 3,347
(b) Allocation of bonus to policyholders 41,187 - 35,135 41,187 35,135
(c) Surplus shown in the Revenue Account 27,405 33,722 23,840 136,319 107,382
70,397 35,148 60,052 182,998 145,864
21 19,666 27,416 23,914 108,921 113,154
22
(a) Investment Income 24,728 21,602 17,473 73,955 66,470
(b) Other income 421 18 2,792 484 2,853
23 1,152 932 1,206 3,876 3,796
24 7,528 - (6) 7,528 180
25 - - - - -
26 - - - - -
27 36,135 48,104 42,979 171,956 178,501
28 2,077 2,894 2,137 9,973 10,278
(a) Current tax 2,077 2,894 2,137 9,973 10,278
(b) Deferred tax - - - - -
29 34,058 45,210 40,842 161,983 168,223
30 - - - - -
31 34,058 45,210 40,842 161,983 168,223
32
(a) Interim Dividend - - - 3.40 3.85
(b) Final Dividend 3.30 - 3.50 3.30 3.50
33 169,603 135,545 126,830 169,603 126,830
34 143,550 143,547 143,535 143,550 143,535
35 511,937 477,819 468,783 511,937 468,783
36 32,959 51,242 28,486 32,959 28,486
(a) Investments:
- Shareholders’ 774,929 721,947 664,026 774,929 664,026
- Policyholders Fund excluding Linked Assets 3,328,885 3,183,313 2,706,737 3,328,885 2,706,737
- Assets held to cover Linked Liabilities 9,750,197 9,828,918 8,787,835 9,750,197 8,787,835
(b) Other Assets (Net of current liabilities and provisions) (16,643) 13,157 32,032 (16,643) 32,032
1 Net of reinsurance
2 Net of amortisation and losses (including capital gains)
3 Inclusive of interim bonus
4 Inclusive of Goods & Service tax from July 01, 2017 onwards
Dividend per share (`) (Nominal Value ` 10 per share):
Profit/(Loss) carried to Balance Sheet
Paid up equity share capital
Reserve & Surplus (excluding Revaluation Reserve)
Fair value Change Account and revaluation reserve (Shareholders)
37 Total Assets:
Provisions for tax (a+b)
Profit / (loss) after tax and before extraordinary items
Extraordinary Items (Net of tax expenses)
Profit / (loss) after tax and extraordinary items
Total income under Shareholders’ Account
Expenses other than those related to insurance business
Transfer of funds to Policyholders A/c
Provisions for doubtful debts (including write off)
Provisions for diminution in value of investments
Profit/ (loss) before tax
Surplus/(Deficit) (6-17)
Appropriations
Details of Surplus/ (Deficit)
Total Surplus
SHAREHOLDERS’ A/C
Transfer from Policyholders’ Account
Change in actuarial liability
Total (10+11+12+13+14+15+16)
Expenses of Management (8+9)
Provisions for doubtful debts (including bad debts written off)
Provisions for diminution in value of investments
Service tax charge on linked charges4
Provision for taxes (a+b)
Benefits Paid 3
(Net)1
Transfer of funds from Shareholders’ A/c
Total (2 to 5)
Commission on
Net Commission1
9 Operating Expenses related to insurance business (a + b+c):
POLICYHOLDERS’ A/C
1 Gross premium income
Net premium income1
Income from investments: (Net)2
Other income
ICICI Prudential Life Insurance Company Limited
Statement of Standalone Audited Results for the quarter and year ended March 31, 2018
Sr No. Particulars
Three months ended/ As at Year ended/ As at

(` in Lakhs)
March 31, 2018 December 31,
2017 March 31, 2017
(Audited) (Audited) (Audited)
Sources of funds
Shareholders' funds :
Share capital 143,550 143,547 143,535
Share application money - 5 -
Employees stock option outstanding - - -
Reserve and surplus 514,086 478,869 469,961
Credit/[debit] fair value change account 30,809 50,192 27,308
Sub - total 688,445 672,613 640,804
Borrowings - - -
Policyholders' funds :
Credit/[debit] fair value change account 205,506 244,161 178,666
Revaluation reserve - Investment property 6,145 5,840 6,035
Policy liabilities (A)+(B)+(C) 12,849,456 12,744,644 11,304,706
Non unit liabilities (mathematical reserves) (A) 3,099,339 2,915,812 2,516,953
Provision for linked liabilities (fund reserves) (B) 9,231,236 9,302,159 8,393,647
(a) Provision for linked liabilities 8,223,729 7,833,366 7,296,952
(b) Credit/[debit] fair value change account (Linked) 1,007,507 1,468,793 1,096,695
Funds for discontinued policies (C) 518,881 526,673 394,106
(a) Discontinued on account of non-payment of premium 518,412 526,452 393,736
(b) Other discontinuance 1,179 993 493
(c) Credit/[debit] fair value change account (710) (772) (123)
Total linked liabilities (B)+(C) 9,750,117 9,828,832 8,787,753
Sub - total 13,061,107 12,994,645 11,489,407
Funds for Future Appropriations
Linked 80 87 82
Non linked 87,736 79,990 60,337
Sub - total 87,816 80,077 60,419
Total 13,837,368 13,747,335 12,190,630
Application of funds
Investments
Shareholders’ 774,929 721,947 664,026
Policyholders’ 3,328,885 3,183,313 2,706,737
Asset held to cover linked liabilities 9,750,197 9,828,918 8,787,835
Loans 14,506 12,511 8,064
Fixed assets - net block 42,205 39,215 21,377
Deferred tax asset 5 5 5
Current assets
Cash and Bank balances 20,374 8,438 21,370
Advances and Other assets 251,026 231,376 264,839
Sub-Total (A) 271,400 239,814 286,209
Current liabilities 342,541 276,472 281,573
Provisions 2,218 1,916 2,050
Sub-Total (B) 344,759 278,388 283,623
Net Current Assets (C) = (A-B) (73,359) (38,574) 2,586
Miscellaneous expenditure (to the extent not written-off or adjusted) - - -
Debit Balance in Profit & Loss Account (Shareholders' account) - - -
Total 13,837,368 13,747,335 12,190,630
Contingent liabilities 20,312 19,684 20,727
ICICI Prudential Life Insurance Company Limited
Standalone Balance Sheet as at March 31, 2018
Particulars
As at

(` in Lakhs)
March 31,
2018
December 31,
2017
March 31,
2017
March 31,
2018
March 31,
2017
(Audited) (Audited) (Audited) (Audited) (Audited)
(i) Solvency Ratio: 252.5% 251.5% 280.7% 252.5% 280.7%
(ii) Expenses of management ratio 12.0% 13.1% 12.6% 12.7% 13.9%
(iii) Policyholder’s liabilities to shareholders’ fund 1909.9% 1943.9% 1802.4% 1909.9% 1802.4%
(iv) Earnings per share (`):
a) Basic EPS before and after extraordinary items
(net of tax expense) for the period (not
annualized for three/nine months)
2.37 3.15 2.85 11.28 11.73
b) Diluted EPS before and after extraordinary
items (net of tax expense) for the period (not
annualized for three/nine months)
2.37 3.15 2.84 11.28 11.72
(v) NPA ratios: (for policyholders' fund)
a) Gross & Net NPAs NIL NIL NIL NIL NIL
b) % of Gross & Net NPAs NIL NIL NIL NIL NIL
(vi) Yield on Investments (On Policyholders' fund)
A. Without unrealised gains
- Non Linked
Par 10.2% 8.0% 9.8% 11.0% 9.7%
Non Par 7.6% 8.2% 8.3% 8.0% 8.4%
- Linked
Non Par 9.8% 8.0% 10.7% 10.4% 11.0%
B. With unrealised gains
- Non Linked
Par 1.7% 2.5% 7.9% 7.0% 14.0%
Non Par 2.0% 1.7% 6.0% 6.3% 13.2%
- Linked
Non Par -10.4% 26.1% 31.3% 8.1% 15.4%
(vii) NPA ratios: (for shareholders' fund)
a) Gross & Net NPAs NIL NIL NIL NIL NIL
b) % of Gross & Net NPAs NIL NIL NIL NIL NIL
(viii) Yield on Investments (on Shareholders' A/c)
A. Without unrealised gains 15.2% 13.6% 11.8% 11.5% 11.9%
B. With unrealised gains 1.8% 8.2% 9.4% 9.9% 12.3%
(ix) Persistency Ratio2
by premium
13th month 85.7% 81.8% 84.3% 87.8% 85.7%
25th month 78.8% 75.2% 70.9% 78.8% 73.9%
37th month 67.1% 64.9% 63.6% 68.9% 66.8%
49th month 62.8% 61.7% 55.5% 63.6% 59.3%
61st month 54.1% 52.5% 53.6% 54.8% 56.2%
by count
13th month 79.7% 76.3% 78.5% 81.7% 80.6%
25th month 72.3% 69.6% 69.7% 73.8% 71.3%
37th month 66.3% 63.1% 60.5% 66.4% 61.8%
49th month 59.5% 57.4% 52.0% 58.7% 53.9%
61st month 49.5% 46.1% 48.2% 49.3% 49.1%
(x) Conservation Ratio3
Par Life 97.6% 88.8% 88.3% 93.0% 90.8%
Par Pension 83.6% 76.2% 88.8% 83.8% 92.3%
Non Par 85.7% 84.2% 92.4% 89.4% 94.8%
Non Par Variable NA NA NA NA NA
Non Par Variable Pension NA NA NA NA NA
Annuity Non Par NA NA NA NA NA
Health 83.5% 83.8% 88.1% 86.0% 88.9%
Linked Life 83.5% 82.4% 82.6% 83.4% 81.1%
Linked Pension 72.3% 77.6% 80.4% 77.3% 77.6%
Linked Health 88.1% 85.1% 87.1% 86.5% 83.8%
Linked Group 204.4% 101.8% 52.2% 132.3% 68.3%
1 Analytical ratios have been calculated as per definition given in IRDAI Analytical ratios disclosure.
2 Calculations are in accordance with the IRDA circular IRDA/ACT/CIR/MISC/035/01/2014 dated January 23, 2014.
3 As required by IRDAI circular IRDA/F&I/REG/CIR/208/10/2016 dated October 25, 2016, Linked Group segment has been bifurcated into
Linked Group Life and Linked Group Pension from quarter ended December 2016 onwards. However, Conservation Ratio for the Linked
Group Segment has been calculated at total level.
a) Persistency ratios for the quarter ending March 31, 2018 have been calculated on March 31, 2018 for the policies issued in December to
February period of the relevant years. For example, the 13th month persistency for quarter ending March 31,2018 is calculated for
policies issued from December 1, 2016 to February 28, 2017.
b) Persistency ratios for the quarter ending December 31, 2017 have been calculated on January 31, 2018 for the policies issued in
October to December period of the relevant years. For example, the 13th month persistency for quarter ending December 31, 2017 is
calculated for policies issued from October 1, 2016 to December 31, 2016.
c) Persistency ratios for the quarter ending March 31, 2017 have been calculated on April 30, 2017 for the policies issued in January to
March period of the relevant years. For example, the 13th month persistency for quarter ending March 31, 2017 is calculated for policies
issued from January 1, 2016 to March 31, 2016.
d) Persistency ratios for year ending March 31, 2018 have been calculated on March 31, 2018 for the policies issued in March to February
period of the relevant years. For example, the 13th month persistency for year ending March 31, 2018 is calculated for policies issued
from March 1, 2016 to February 28, 2017.
e) Persistency ratios for the year ending March 31, 2017 have been calculated on April 30, 2017 for the policies issued in April to March
period of the relevant years. For example, the 13th month persistency for year ending March 31, 2017 is calculated for policies issued
from April 1, 2015 to March 31, 2016.
f) Group policies and policies under micro insurance are excluded.
Analytical Ratios:1
ICICI Prudential Life Insurance Company Limited
Statement of Standalone Audited Results for the quarter and year ended March 31, 2018
Sr
No. Particulars
Three months ended/ As at Year ended/as at

(` in Lakhs)
March 31,
2018
December 31,
2017
March 31,
2017
March 31,
2018
March 31,
2017
(Audited) (Audited) (Audited) (Audited) (Audited)
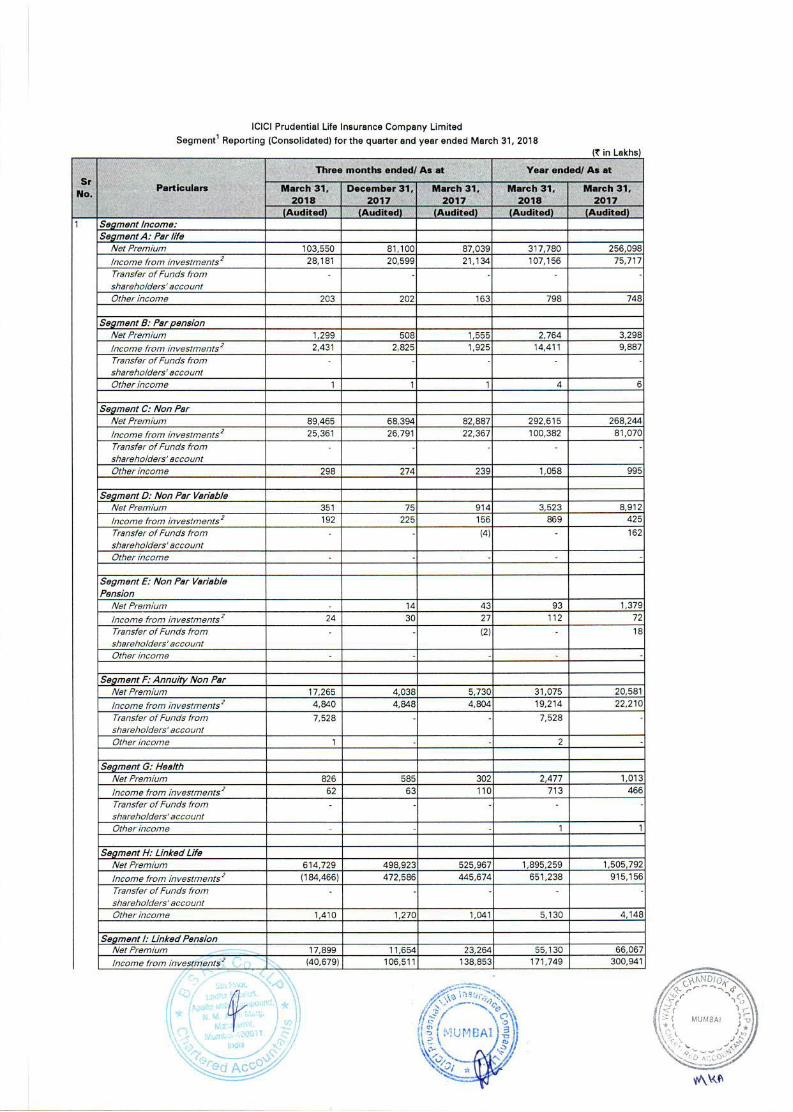
Segment Income:
Segment A: Par life
Net Premium 103,550 81,100 87,039 317,780 256,098
Income from investments2
28,181 20,599 21,134 107,156 75,717
Transfer of Funds from
shareholders' account
- - - - -
Other income 203 202 163 798 748
Segment B: Par pension
Net Premium 1,299 508 1,555 2,764 3,298
Income from investments2
2,431 2,825 1,925 14,411 9,887
Transfer of Funds from
shareholders' account
- - - - -
Other income 1 1 1 4 6
Segment C: Non Par
Net Premium 89,465 68,394 82,887 292,615 268,244
Income from investments2
25,361 26,791 22,367 100,382 81,070
Transfer of Funds from
shareholders' account
- - - - -
Other income 297 274 239 1,058 995
Segment D: Non Par Variable
Net Premium 351 75 914 3,523 8,912
Income from investments2
192 225 156 869 425
Transfer of Funds from
shareholders' account
- - (4) - 162
Other income - - - - -
Segment E: Non Par Variable
Pension
Net Premium - 14 43 93 1,379
Income from investments2
24 30 27 112 72
Transfer of Funds from
shareholders' account
- - (2) - 18
Other income - - - - -
Segment F: Annuity Non Par
Net Premium 17,265 4,038 5,730 31,075 20,581
Income from investments2
4,840 4,848 4,804 19,214 22,210
Transfer of Funds from
shareholders' account
7,528 - - 7,528 -
Other income 1 - - 2 -
Segment G: Health
Net Premium 826 585 302 2,477 1,013
Income from investments2
62 63 110 713 466
Transfer of Funds from
shareholders' account
- - - - -
Other income - - - 1 1
Segment H: Linked Life
Net Premium 614,729 498,923 525,967 1,895,259 1,505,792
Income from investments2
(184,466) 472,586 445,674 651,238 915,156
Transfer of Funds from
shareholders' account
- - - - -
Other income 1,411 1,270 1,041 5,130 4,148
Segment I: Linked Pension
Net Premium 17,899 11,654 23,264 55,130 66,067
Income from investments2
(40,679) 106,511 138,853 171,749 300,941
Transfer of Funds from
shareholders' account
- - - - -
Other income 1 1 - 3 5
Segment J: Linked Health
Net Premium 3,072 1,247 3,584 7,165 8,747
Income from investments2
(3,237) 6,992 7,163 10,470 13,795
Transfer of Funds from
shareholders' account
- - - - -
Other income - - - 1 -
Segment K: Linked Group
Net Premium 17,126 12,975 21,357 73,187 75,394
Income from investments2
5,953 12,947 15,032 49,323 77,304
Transfer of Funds from
shareholders' account
- - - - -
Other income 1 1 - 4 2
1
ICICI Prudential Life Insurance Company Limited
Segment1
Reporting (Standalone) for the quarter and year ended March 31, 2018
Sr
No.
Particulars
Three months ended/ As at Year ended/ As at

Breakup of Linked Group Segment into Linked Group Life and Linked Group Pension is given below:
Segment: Linked Group Life
Net Premium 12,687 7,990 14,239 46,670 NA
Income from investments2
3,215 6,606 7,700 26,747 NA
Transfer of Funds from
shareholders' account
- - - - NA
Other income 1 1 - 3 NA
Segment: Linked Group Pension
Net Premium 4,439 4,985 7,118 26,517 NA
Income from investments2
2,738 6,341 7,332 22,577 NA
Transfer of Funds from
shareholders' account
- - - - NA
Other income - - - 1 NA
Shareholders
Income from investments2
24,728 21,602 17,473 73,955 66,470
Other income 421 18 2,792 484 2,853
Segment Surplus/ (Deficit) (net of
transfer from shareholders’ A/c) :
Segment A: Par life 14,105 5,586 7,179 29,539 13,313
Segment B: Par pension (1,174) 717 1,310 3,047 3,804
Segment C: Non Par (239) 6,042 1,567 20,519 23,274
Segment D: Non Par Variable 16 (40) 4 65 (162)
Segment E: Non Par Variable Pension
(2) 1 2 7 (18)
Segment F: Annuity Non Par (11,339) 1,346 3,910 (7,528) 10,613
Segment G: Health 1,507 (4) 216 2,121 1,367
Segment H: Linked Life 10,098 11,318 1,122 48,473 20,210
Segment I: Linked Pension 5,999 7,067 6,932 27,026 29,113
Segment J: Linked Health 942 941 997 3,471 3,758
Segment K: Linked Group -36 748 607 2051 1,930
Breakup of Linked Group Segment into Linked Group Life and Linked Group Pension is given below:
Segment: Linked Group Life (125) 496 396 897 NA
Segment: Linked Group Pension 89 252 211 1,155 NA
Shareholders 21,920 17,794 16,922 60,590 55,249
Segment Assets:
Segment A: Par life 1,308,866 1,241,938 1,020,696 1,308,866 1,020,696
Segment B: Par pension 118,834 121,224 117,565 118,834 117,565
Segment C: Non Par 1,598,509 1,530,368 1,291,954 1,598,509 1,291,954
Segment D: Non Par Variable 9,654 10,413 9,236 9,654 9,236
Segment E: Non Par Variable Pension
1,391 1,398 1,368 1,391 1,368
Segment F: Annuity Non Par 270,044 241,444 228,902 270,044 228,902
Segment G: Health 1,742 3,019 2,893 1,742 2,893
Segment H: Linked -
Segment H: Linked Life 7,713,464 7,647,700 6,524,413 7,713,464 6,524,413
Segment I: Linked Pension 1,314,276 1,466,855 1,588,938 1,314,276 1,588,938
Segment J: Linked Health 96,354 99,076 88,549 96,354 88,549
Segment K: Linked Group 715,789 711,287 675,312 715,789 675,312
Breakup of Linked Group Segment into Linked Group Life and Linked Group Pension is given below:
Segment: Linked Group Life 386,441 383,962 365,469 386,441 365,469
Segment: Linked Group Pension 329,348 327,325 309,843 329,348 309,843
Shareholders 688,445 672,613 640,804 688,445 640,804
Segment Policy Liabilities:
Segment A: Par life 1,308,866 1,241,938 1,020,696 1,308,866 1,020,696
Segment B: Par pension 118,834 121,224 117,565 118,834 117,565
Segment C: Non Par 1,598,509 1,530,368 1,291,954 1,598,509 1,291,954
Segment D: Non Par Variable 9,654 10,413 9,236 9,654 9,236
Segment E: Non Par Variable Pension
1,391 1,398 1,368 1,391 1,368
Segment F: Annuity Non Par 270,044 241,444 228,902 270,044 228,902
Segment G: Health 1,742 3,019 2,893 1,742 2,893
Segment H: Linked Life 7,713,464 7,647,700 6,524,413 7,713,464 6,524,413
Segment I: Linked Pension 1,314,276 1,466,855 1,588,938 1,314,276 1,588,938
Segment J: Linked Health 96,354 99,076 88,549 96,354 88,549
Segment K: Linked Group 715,789 711,287 675,312 715,789 675,312
Breakup of Linked Group Segment into Linked Group Life and Linked Group Pension is given below:
Segment: Linked Group Life 386,441 383,962 365,469 386,441 365,469
Segment: Linked Group Pension 329,348 327,325 309,843 329,348 309,843
Footnotes:
1
a
b
c
d Business within India and business outside India
2 Net of Provisions for diminution in value of investments
3
Non-Linked
1. Non-Participating Policies: (i) Life (ii) General Annuity and Pension (iii) Health (iv) Variable
2. Participating Policies : (i) Life (ii) General Annuity and Pension (iii) Health (iv) Variable
Variable insurance shall be further segregated into Life, General Annuity and Pension and Health where any such segment
contributes ten per cent or more of the total premium of the Company.
As required by IRDAI circular IRDA/F&I/REG/CIR/208/10/2016 dated October 25, 2016, Linked Group segment has been
bifurcated into Linked Group Life and Linked Group Pension from quarter ended December 2016 onwards.
1
2
3
4
Segments are as under:
Linked Policies (i) Life (ii) General Annuity and Pension (iii) Health (iv) Variable
(` in Lakhs)
March 31, 2018 December 31,
2017 March 31, 2017 March 31, 2018 March 31, 2017
(Audited) (Audited) (Audited) (Audited) (Audited)
(a) First Year Premium 202,132 193,394 211,133 735,619 634,463
(b) Renewal Premium 614,761 453,903 501,968 1,785,702 1,449,070
(c) Single Premium 55,999 38,266 44,847 185,556 151,867
2 865,582 679,513 752,642 2,681,068 2,215,525
3 (161,338) 654,417 657,634 1,126,146 1,497,694
4 1,915 1,749 1,444 7,001 5,905
5 7,528 - (6) 7,528 180
6 713,687 1,335,679 1,411,714 3,821,743 3,719,304
7
(a) First Year Premium 31,781 28,275 14,772 102,447 46,009
(b) Renewal Premium 11,606 8,451 10,057 34,406 29,032
(c) Single Premium 1,272 1,002 246 3,474 851
8 44,659 37,728 25,075 140,327 75,892
(a) Employees remuneration and welfare expenses 25,722 24,412 20,384 96,530 80,802
(b) Administration support expenses - - 17,337 - 58,320
(c) Advertisement and publicity 12,300 4,771 7545 25,229 19,549
(d) Other operating expenses 22,454 22,931 25,416 81,234 77,048
10 105,135 89,842 95,757 343,320 311,611
11 75 47 91 308 607
12 - - 389 509 651
13 15,960 15,167 11,505 56,451 41,627
14 4,748 2,365 1,944 12,007 7,882
(a) Current tax 4,748 2,365 1,944 12,007 7,880
(b) Deferred tax - - - - 2
15 455,552 468,516 490,200 1,728,079 1,499,788
16 104,812 726,020 787,988 1,544,750 1,749,756
17 686,282 1,301,957 1,387,874 3,685,424 3,611,922
18 27,405 33,722 23,840 136,319 107,382
19
(a) Transferred to Shareholders 19,666 27,416 23,914 108,921 113,154
(b) Funds for Future Appropriations 7,739 6,306 (74) 27,398 (5,773)
20
(a) Interim bonus paid 1,805 1,426 1,077.00 5,492 3,347
(b) Allocation of bonus to policyholders 41,187 - 35,135 41,187 35,135
(c) Surplus shown in the Revenue Account 27,405 33,722 23,840 136,319 107,382
70,397 35,148 60,052 182,998 145,864
21 19,666 27,416 23,914.00 108,921 113,154
22
(a) Investment Income 24,784 21,659 17,532.00 74,192 66,698
(b) Other income 427 23 2,795 503 2,863
23 1,246 1,020 1,286 4,198 4,093
24 7,528 - (6) 7,528 180
25 - - - - -
26 - - - - -
27 36,103 48,078 42,961 171,890 178,442
28 2,077 2,895 2,137 9,973 10,276
(a) Current tax 2,077 2,895 2,137 9,973 10,277
(b) Deferred tax - - - - (1)
29 34,026 45,183 40,824 161,917 168,166
30 - - - - -
31 34,026 45,183 40,824 161,917 168,166
32
(a) Interim Dividend - - - 3.40 3.85
(b) Final Dividend 3.30 - 3.50 3.30 3.50
33 169,336 135,310 126,629 169,336 126,629
34 143,550 143,547 143,535 143,550 143,535
35 511,669 477,584 468,582 511,669 468,582
36 32,959 51,242 28,486 32,959 28,486
(a) Investments:
- Shareholders’ 774,659 721,269 663,492 774,659 663,492
- Policyholders Fund excluding Linked Assets 3,328,885 3,183,313 2,706,737 3,328,885 2,706,737
- Assets held to cover Linked Liabilities 9,750,197 9,828,918 8,787,835 9,750,197 8,787,835
(b) Other Assets (Net of current liabilities and provisions) (16,640) 13,600 32,365 (16,640) 32,365
1 Net of reinsurance
2 Net of amortisation and losses (including capital gains)
3 Inclusive of interim bonus
4 Inclusive of Goods & Service tax from July 01, 2017 onwards
Dividend per share (`) (Nominal Value ` 10 per share):
Profit/(Loss) carried to Balance Sheet
Paid up equity share capital
Reserve & Surplus (excluding Revaluation Reserve)
Fair value Change Account and revaluation reserve (Shareholders)
37 Total Assets:
Provisions for tax (a+b)
Profit / (loss) after tax and before extraordinary items
Extraordinary Items (Net of tax expenses)
Profit / (loss) after tax and extraordinary items
Total income under Shareholders’ Account
Expenses other than those related to insurance business
Transfer of funds to Policyholders A/c
Provisions for doubtful debts (including write off)
Provisions for diminution in value of investments
Profit/ (loss) before tax
Surplus/(Deficit) (6-17)
Appropriations
Details of Surplus/ (Deficit)
Total Surplus
SHAREHOLDERS’ A/C
Transfer from Policyholders’ Account
Change in actuarial liability
Total (10+11+12+13+14+15+16)
Expenses of Management (8+9)
Provisions for doubtful debts (including bad debts written off)
Provisions for diminution in value of investments
Service tax charge on linked charges4
Provision for taxes (a+b)
Benefits Paid 3
(Net)1
Transfer of funds from Shareholders’ A/c
Total (2 to 5)
Commission on
Net Commission1
9 Operating Expenses related to insurance business (a + b+c):
POLICYHOLDERS’ A/C
1 Gross premium income
Net premium income1
Income from investments: (Net)2
Other income
ICICI Prudential Life Insurance Company Limited
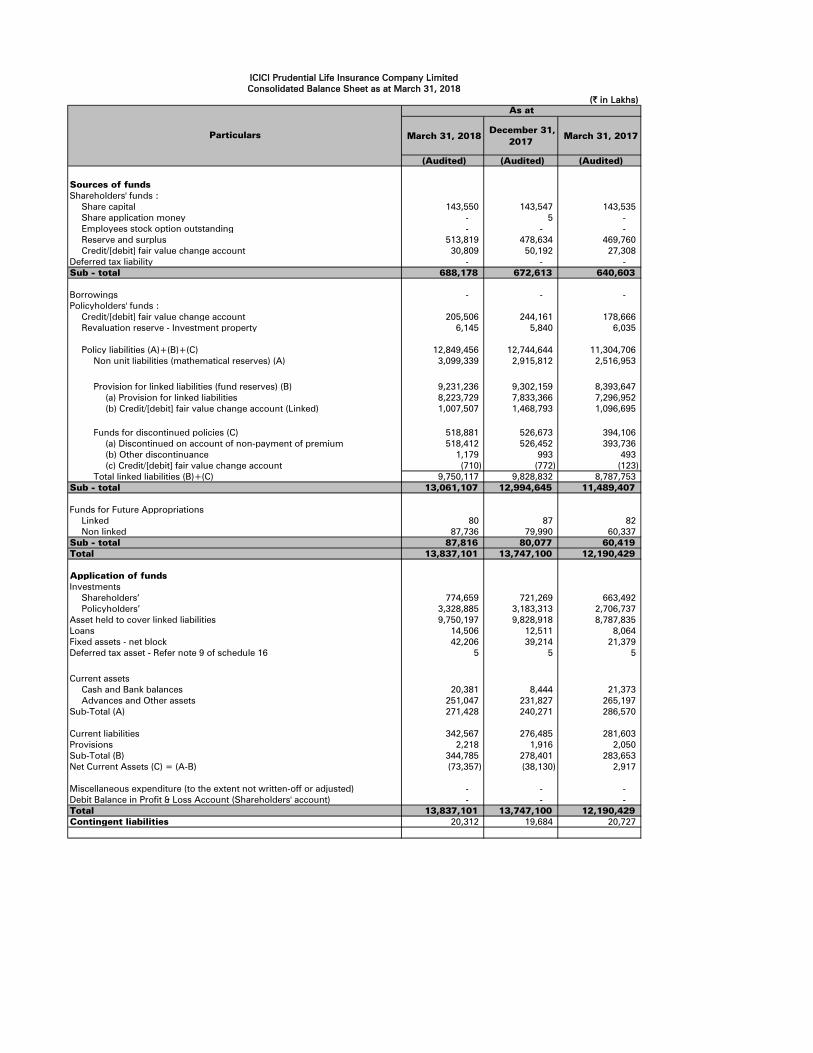
Statement of Consolidated Audited Results for the quarter and year ended March 31, 2018
Sr No. Particulars
Three months ended/ As at Year ended/ As at
(` in Lakhs)
March 31, 2018 December 31,
2017 March 31, 2017
(Audited) (Audited) (Audited)
Sources of funds
Shareholders' funds :
Share capital 143,550 143,547 143,535
Share application money - 5 -
Employees stock option outstanding - - -
Reserve and surplus 513,819 478,634 469,760
Credit/[debit] fair value change account 30,809 50,192 27,308
Deferred tax liability - - -
Sub - total 688,178 672,613 640,603
Borrowings - - -
Policyholders' funds :
Credit/[debit] fair value change account 205,506 244,161 178,666
Revaluation reserve - Investment property 6,145 5,840 6,035
Policy liabilities (A)+(B)+(C) 12,849,456 12,744,644 11,304,706
Non unit liabilities (mathematical reserves) (A) 3,099,339 2,915,812 2,516,953
Provision for linked liabilities (fund reserves) (B) 9,231,236 9,302,159 8,393,647
(a) Provision for linked liabilities 8,223,729 7,833,366 7,296,952
(b) Credit/[debit] fair value change account (Linked) 1,007,507 1,468,793 1,096,695
Funds for discontinued policies (C) 518,881 526,673 394,106
(a) Discontinued on account of non-payment of premium 518,412 526,452 393,736
(b) Other discontinuance 1,179 993 493
(c) Credit/[debit] fair value change account (710) (772) (123)
Total linked liabilities (B)+(C) 9,750,117 9,828,832 8,787,753
Sub - total 13,061,107 12,994,645 11,489,407
Funds for Future Appropriations
Linked 80 87 82
Non linked 87,736 79,990 60,337
Sub - total 87,816 80,077 60,419
Total 13,837,101 13,747,100 12,190,429
Application of funds
Investments
Shareholders’ 774,659 721,269 663,492
Policyholders’ 3,328,885 3,183,313 2,706,737
Asset held to cover linked liabilities 9,750,197 9,828,918 8,787,835
Loans 14,506 12,511 8,064
Fixed assets - net block 42,206 39,214 21,379
Deferred tax asset - Refer note 9 of schedule 16 5 5 5
Current assets
Cash and Bank balances 20,381 8,444 21,373
Advances and Other assets 251,047 231,827 265,197
Sub-Total (A) 271,428 240,271 286,570
Current liabilities 342,567 276,485 281,603
Provisions 2,218 1,916 2,050
Sub-Total (B) 344,785 278,401 283,653
Net Current Assets (C) = (A-B) (73,357) (38,130) 2,917
Miscellaneous expenditure (to the extent not written-off or adjusted) - - -
Debit Balance in Profit & Loss Account (Shareholders' account) - - -
Total 13,837,101 13,747,100 12,190,429
Contingent liabilities 20,312 19,684 20,727
ICICI Prudential Life Insurance Company Limited
Consolidated Balance Sheet as at March 31, 2018
Particulars
As at
Year Ended/
As at
Year Ended/
As at
March 31,
2018
December 31,
2017
March 31,
2017
March 31,
2018
March 31,
2017
(Audited) (Audited) (Audited) (Audited) (Audited)
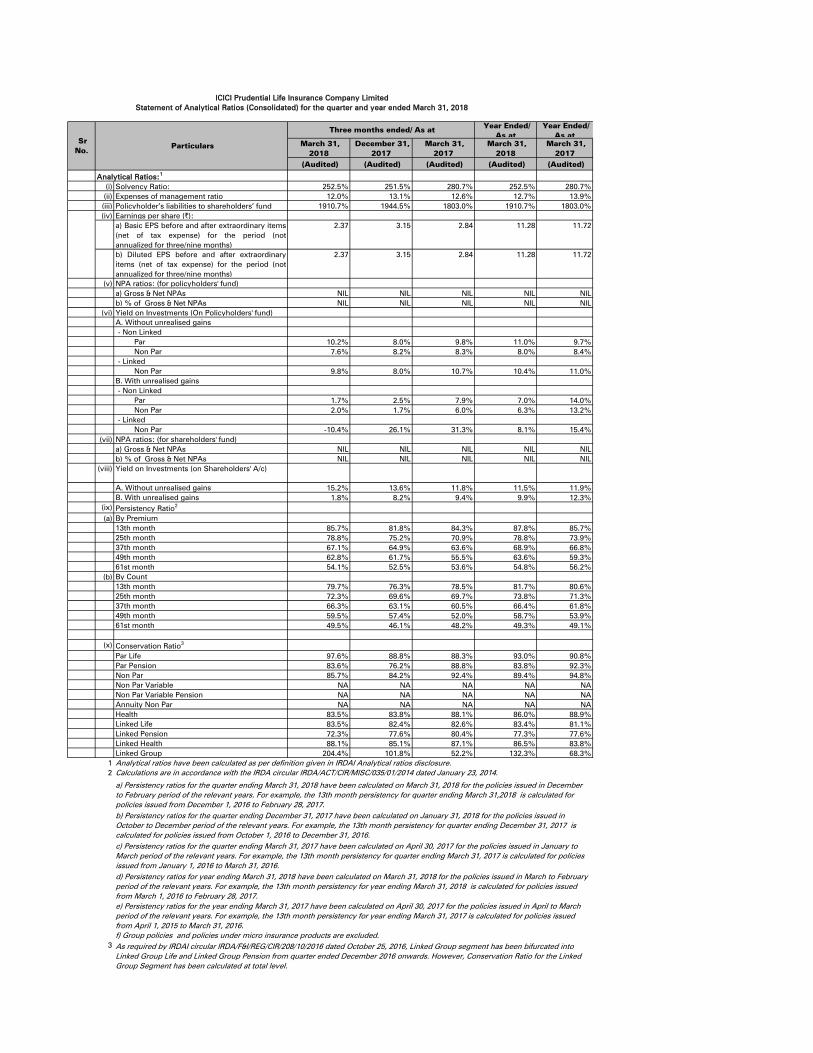
(i) Solvency Ratio: 252.5% 251.5% 280.7% 252.5% 280.7%
(ii) Expenses of management ratio 12.0% 13.1% 12.6% 12.7% 13.9%
(iii) Policyholder’s liabilities to shareholders’ fund 1910.7% 1944.5% 1803.0% 1910.7% 1803.0%
(iv) Earnings per share (`):
a) Basic EPS before and after extraordinary items
(net of tax expense) for the period (not
annualized for three/nine months)
2.37 3.15 2.84 11.28 11.72
b) Diluted EPS before and after extraordinary
items (net of tax expense) for the period (not
annualized for three/nine months)
2.37 3.15 2.84 11.28 11.72
(v) NPA ratios: (for policyholders' fund)
a) Gross & Net NPAs NIL NIL NIL NIL NIL
b) % of Gross & Net NPAs NIL NIL NIL NIL NIL
(vi) Yield on Investments (On Policyholders' fund)
A. Without unrealised gains
- Non Linked
Par 10.2% 8.0% 9.8% 11.0% 9.7%
Non Par 7.6% 8.2% 8.3% 8.0% 8.4%
- Linked
Non Par 9.8% 8.0% 10.7% 10.4% 11.0%
B. With unrealised gains
- Non Linked
Par 1.7% 2.5% 7.9% 7.0% 14.0%
Non Par 2.0% 1.7% 6.0% 6.3% 13.2%
- Linked
Non Par -10.4% 26.1% 31.3% 8.1% 15.4%
(vii) NPA ratios: (for shareholders' fund)
a) Gross & Net NPAs NIL NIL NIL NIL NIL
b) % of Gross & Net NPAs NIL NIL NIL NIL NIL
(viii) Yield on Investments (on Shareholders' A/c)
A. Without unrealised gains 15.2% 13.6% 11.8% 11.5% 11.9%
B. With unrealised gains 1.8% 8.2% 9.4% 9.9% 12.3%
(ix) Persistency Ratio2
(a) By Premium
13th month 85.7% 81.8% 84.3% 87.8% 85.7%
25th month 78.8% 75.2% 70.9% 78.8% 73.9%
37th month 67.1% 64.9% 63.6% 68.9% 66.8%
49th month 62.8% 61.7% 55.5% 63.6% 59.3%
61st month 54.1% 52.5% 53.6% 54.8% 56.2%
(b) By Count
13th month 79.7% 76.3% 78.5% 81.7% 80.6%
25th month 72.3% 69.6% 69.7% 73.8% 71.3%
37th month 66.3% 63.1% 60.5% 66.4% 61.8%
49th month 59.5% 57.4% 52.0% 58.7% 53.9%
61st month 49.5% 46.1% 48.2% 49.3% 49.1%
(x) Conservation Ratio3
Par Life 97.6% 88.8% 88.3% 93.0% 90.8%
Par Pension 83.6% 76.2% 88.8% 83.8% 92.3%
Non Par 85.7% 84.2% 92.4% 89.4% 94.8%
Non Par Variable NA NA NA NA NA
Non Par Variable Pension NA NA NA NA NA
Annuity Non Par NA NA NA NA NA
Health 83.5% 83.8% 88.1% 86.0% 88.9%
Linked Life 83.5% 82.4% 82.6% 83.4% 81.1%
Linked Pension 72.3% 77.6% 80.4% 77.3% 77.6%
Linked Health 88.1% 85.1% 87.1% 86.5% 83.8%
Linked Group 204.4% 101.8% 52.2% 132.3% 68.3%
1 Analytical ratios have been calculated as per definition given in IRDAI Analytical ratios disclosure.
2 Calculations are in accordance with the IRDA circular IRDA/ACT/CIR/MISC/035/01/2014 dated January 23, 2014.
3 As required by IRDAI circular IRDA/F&I/REG/CIR/208/10/2016 dated October 25, 2016, Linked Group segment has been bifurcated into
Linked Group Life and Linked Group Pension from quarter ended December 2016 onwards. However, Conservation Ratio for the Linked
Group Segment has been calculated at total level.
a) Persistency ratios for the quarter ending March 31, 2018 have been calculated on March 31, 2018 for the policies issued in December
to February period of the relevant years. For example, the 13th month persistency for quarter ending March 31,2018 is calculated for
policies issued from December 1, 2016 to February 28, 2017.
b) Persistency ratios for the quarter ending December 31, 2017 have been calculated on January 31, 2018 for the policies issued in
October to December period of the relevant years. For example, the 13th month persistency for quarter ending December 31, 2017 is
calculated for policies issued from October 1, 2016 to December 31, 2016.
c) Persistency ratios for the quarter ending March 31, 2017 have been calculated on April 30, 2017 for the policies issued in January to
March period of the relevant years. For example, the 13th month persistency for quarter ending March 31, 2017 is calculated for policies
issued from January 1, 2016 to March 31, 2016.
d) Persistency ratios for year ending March 31, 2018 have been calculated on March 31, 2018 for the policies issued in March to February
period of the relevant years. For example, the 13th month persistency for year ending March 31, 2018 is calculated for policies issued
from March 1, 2016 to February 28, 2017.
e) Persistency ratios for the year ending March 31, 2017 have been calculated on April 30, 2017 for the policies issued in April to March
period of the relevant years. For example, the 13th month persistency for year ending March 31, 2017 is calculated for policies issued
from April 1, 2015 to March 31, 2016.
f) Group policies and policies under micro insurance products are excluded.
Analytical Ratios:1
ICICI Prudential Life Insurance Company Limited
Statement of Analytical Ratios (Consolidated) for the quarter and year ended March 31, 2018
Sr
No. Particulars
Three months ended/ As at

(` in Lakhs)
March 31,
2018
December 31,
2017
March 31,
2017
March 31,
2018
March 31,
2017
(Audited) (Audited) (Audited) (Audited) (Audited)
Segment Income:
Segment A: Par life
Net Premium 103,550 81,100 87,039 317,780 256,098
Income from investments2
28,181 20,599 21,134 107,156 75,717
Transfer of Funds from
shareholders' account
- - - - -
Other income 203 202 163 798 748
Segment B: Par pension
Net Premium 1,299 508 1,555 2,764 3,298
Income from investments2
2,431 2,825 1,925 14,411 9,887
Transfer of Funds from
shareholders' account
- - - - -
Other income 1 1 1 4 6
Segment C: Non Par
Net Premium 89,465 68,394 82,887 292,615 268,244
Income from investments2
25,361 26,791 22,367 100,382 81,070
Transfer of Funds from
shareholders' account
- - - - -
Other income 298 274 239 1,058 995
Segment D: Non Par Variable
Net Premium 351 75 914 3,523 8,912
Income from investments2
192 225 156 869 425
Transfer of Funds from
shareholders' account
- - (4) - 162
Other income - - - - -
Segment E: Non Par Variable
Pension
Net Premium - 14 43 93 1,379
Income from investments2
24 30 27 112 72
Transfer of Funds from
shareholders' account
- - (2) - 18
Other income - - - - -
Segment F: Annuity Non Par
Net Premium 17,265 4,038 5,730 31,075 20,581
Income from investments2
4,840 4,848 4,804 19,214 22,210
Transfer of Funds from
shareholders' account
7,528 - - 7,528 -
Other income 1 - - 2 -
Segment G: Health
Net Premium 826 585 302 2,477 1,013
Income from investments2
62 63 110 713 466
Transfer of Funds from
shareholders' account
- - - - -
Other income - - - 1 1
Segment H: Linked Life
Net Premium 614,729 498,923 525,967 1,895,259 1,505,792
Income from investments2
(184,466) 472,586 445,674 651,238 915,156
Transfer of Funds from
shareholders' account
- - - - -
Other income 1,410 1,270 1,041 5,130 4,148
Segment I: Linked Pension
Net Premium 17,899 11,654 23,264 55,130 66,067
Income from investments2
(40,679) 106,511 138,853 171,749 300,941
1
ICICI Prudential Life Insurance Company Limited
Segment1
Reporting (Consolidated) for the quarter and year ended March 31, 2018
Sr
No. Particulars
Three months ended/ As at Year ended/ As at

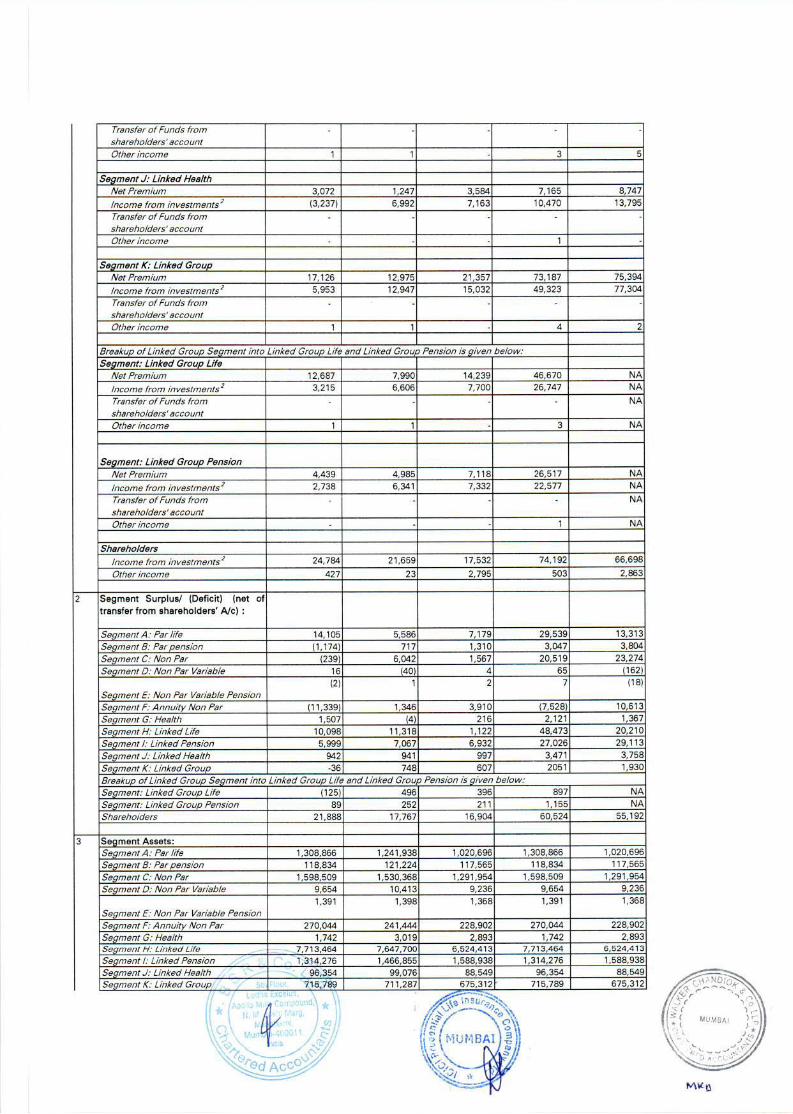
Transfer of Funds from
shareholders' account
- - - - -
Other income 1 1 - 3 5
Segment J: Linked Health
Net Premium 3,072 1,247 3,584 7,165 8,747
Income from investments2
(3,237) 6,992 7,163 10,470 13,795
Transfer of Funds from
shareholders' account
- - - - -
Other income - - - 1 -
Segment K: Linked Group
Net Premium 17,126 12,975 21,357 73,187 75,394
Income from investments2
5,953 12,947 15,032 49,323 77,304
Transfer of Funds from
shareholders' account
- - - - -
Other income 1 1 - 4 2
Breakup of Linked Group Segment into Linked Group Life and Linked Group Pension is given below:
Segment: Linked Group Life
Net Premium 12,687 7,990 14,239 46,670 NA
Income from investments2
3,215 6,606 7,700 26,747 NA
Transfer of Funds from
shareholders' account
- - - - NA
Other income 1 1 - 3 NA
Segment: Linked Group Pension
Net Premium 4,439 4,985 7,118 26,517 NA
Income from investments2
2,738 6,341 7,332 22,577 NA
Transfer of Funds from
shareholders' account
- - - - NA
Other income - - - 1 NA
Shareholders
Income from investments2
24,784 21,659 17,532 74,192 66,698
Other income 427 23 2,795 503 2,863
Segment Surplus/ (Deficit) (net of
transfer from shareholders’ A/c) :
Segment A: Par life 14,105 5,586 7,179 29,539 13,313
Segment B: Par pension (1,174) 717 1,310 3,047 3,804
Segment C: Non Par (239) 6,042 1,567 20,519 23,274
Segment D: Non Par Variable 16 (40) 4 65 (162)
Segment E: Non Par Variable Pension
(2) 1 2 7 (18)
Segment F: Annuity Non Par (11,339) 1,346 3,910 (7,528) 10,613
Segment G: Health 1,507 (4) 216 2,121 1,367
Segment H: Linked Life 10,098 11,318 1,122 48,473 20,210
Segment I: Linked Pension 5,999 7,067 6,932 27,026 29,113
Segment J: Linked Health 942 941 997 3,471 3,758
Segment K: Linked Group -36 748 607 2051 1,930
Breakup of Linked Group Segment into Linked Group Life and Linked Group Pension is given below:
Segment: Linked Group Life (125) 496 396 897 NA
Segment: Linked Group Pension 89 252 211 1,155 NA
Shareholders 21,888 17,767 16,904 60,524 55,192
Segment Assets:
Segment A: Par life 1,308,866 1,241,938 1,020,696 1,308,866 1,020,696
Segment B: Par pension 118,834 121,224 117,565 118,834 117,565
Segment C: Non Par 1,598,509 1,530,368 1,291,954 1,598,509 1,291,954
Segment D: Non Par Variable 9,654 10,413 9,236 9,654 9,236
Segment E: Non Par Variable Pension
1,391 1,398 1,368 1,391 1,368
Segment F: Annuity Non Par 270,044 241,444 228,902 270,044 228,902
Segment G: Health 1,742 3,019 2,893 1,742 2,893
Segment H: Linked Life 7,713,464 7,647,700 6,524,413 7,713,464 6,524,413
Segment I: Linked Pension 1,314,276 1,466,855 1,588,938 1,314,276 1,588,938
Segment J: Linked Health 96,354 99,076 88,549 96,354 88,549
Segment K: Linked Group 715,789 711,287 675,312 715,789 675,312
1
2
3

Breakup of Linked Group Segment into Linked Group Life and Linked Group Pension is given below:
Segment: Linked Group Life 386,441 383,962 365,469 386,441 365,469
Segment: Linked Group Pension 329,348 327,325 309,843 329,348 309,843
Shareholders 688,178 672,613 640,603 688,178 640,603
Segment Policy Liabilities:
Segment A: Par life 1,308,866 1,241,938 1,020,696 1,308,866 1,020,696
Segment B: Par pension 118,834 121,224 117,565 118,834 117,565
Segment C: Non Par 1,598,509 1,530,368 1,291,954 1,598,509 1,291,954
Segment D: Non Par Variable 9,654 10,413 9,236 9,654 9,236
Segment E: Non Par Variable Pension
1,391 1,398 1,368 1,391 1,368
Segment F: Annuity Non Par 270,044 241,444 228,902 270,044 228,902
Segment G: Health 1,742 3,019 2,893 1,742 2,893
Segment H: Linked Life 7,713,464 7,647,700 6,524,413 7,713,464 6,524,413
Segment I: Linked Pension 1,314,276 1,466,855 1,588,938 1,314,276 1,588,938
Segment J: Linked Health 96,354 99,076 88,549 96,354 88,549
Segment K: Linked Group 715,789 711,287 675,312 715,789 675,312
Breakup of Linked Group Segment into Linked Group Life and Linked Group Pension is given below: - - - - -
Segment: Linked Group Life 386,441 383,962 365,469 386,441 365,469
Segment: Linked Group Pension 329,348 327,325 309,843 329,348 309,843
Footnotes:
1
a
b
c
d Business within India and business outside India
2 Net of Provisions for diminution in value of investments
3
Non-Linked
1. Non-Participating Policies: (i) Life (ii) General Annuity and Pension (iii) Health (iv) Variable
2. Participating Policies : (i) Life (ii) General Annuity and Pension (iii) Health (iv) Variable
Variable insurance shall be further segregated into Life, General Annuity and Pension and Health where any such segment
contributes ten per cent or more of the total premium of the Company.
As required by IRDAI circular IRDA/F&I/REG/CIR/208/10/2016 dated October 25, 2016, Linked Group segment has been
bifurcated into Linked Group Life and Linked Group Pension from quarter ended December 2016 onwards.
3
4
Segments are as under:
Linked Policies (i) Life (ii) General Annuity and Pension (iii) Health (iv) Variable

Status of Shareholders Complaints for the year ended March 31, 2018:
Sr No. Particulars Number
1 No. of investor complaints pending at the beginning of period 2
2 No. of investor complaints received during the period 440
3 No. of investor complaints disposed off during the period 441
4 No. of investor complaints remaining unresolved at the end of the period 1*
* This complaint has been responded within timeline.
ICICI Prudential Life Insurance Company Limited
Other disclosures:

Notes:
1. The above financial results have been approved by the Board of Directors at its meeting held
on April 24, 2018.
2. The above standalone and consolidated financial results are audited by the joint statutory
auditors, B S R & Co. LLP, Chartered Accountants and Walker Chandiok & Co LLP, Chartered
Accountants.
3. Other income includes interest on tax refund for the year ended March 31, 2018 of ̀ 403 lakhs,
(for the quarter ended March 31, 2018 of ` 403 lakhs & for the quarter ended March 31, 2017
and year ended March 31, 2017 of ` 2,780 lakhs & for the quarter ended December 31, 2017
of ` NIL).
4. In view of seasonality of Industry, the financial results for the quarter are not indicative of full
year's expected performance.
5. The Board of directors declared an interim dividend of ` 3.40 per equity share (including
special dividend of ̀ 1.10 per equity share) of face value of ̀ 10. Further, the Board of directors
has recommended a final dividend of ` 3.30 per equity share (including special dividend of `
1.10 per equity share) of face value of ` 10 each for the year ended March 31, 2018. The
declaration and payment of final dividend is subject to requisite approvals.
6. During the quarter ended March 31, 2018, the Company has allotted 30,750 equity shares of
face value of ` 10 each pursuant to exercise of employee stock options.
7. With effect from quarter ended September 30, 2017 onwards, for more appropriate
presentation, reinsurance claims receivable are accounted for in the period in which the claim
is intimated. Prior to this change in accounting policy, reinsurance claims receivable were
accounted in the period in which the claim was settled. Consequent to the said change,
reinsurance claims and thereby the profit for the year ended March 31, 2018 is higher by `
1,395 lakhs. Correspondingly, reinsurance claim receivable is also higher by ` 1,395 lakhs as
at the Balance Sheet date.
8. During the quarter ended December 31, 2017, the Company converted certain investment
properties to fixed assets for self-use based on approval and stipulations of Insurance
Regulatory and Development Authority of India (IRDAI). Investment properties held in
Participating fund at a cost of ` 10,774 lakhs were transferred to Shareholders’ fund as fixed
assets at a fair value of ` 11,321 lakhs thereby resulting in gain of ` 547 lakhs and reversal of
revaluation reserve of ` 195 lakhs. Investment properties held in Shareholder’s fund
amounting to ` 7,165 lakhs were reclassified to fixed assets at cost of ` 7,036 lakhs and
revaluation reserve amounting to ` 128 lakhs has been reversed.
9. The amounts for the quarter ended March 31, 2018 are balancing amounts between the
amounts as per audited accounts for the year ended March 31, 2018 and nine months ended
December 31, 2017.
10. Figures of the previous year have been re-grouped to conform to the current year
presentation.

11. In accordance with requirements of IRDAI Master Circular on Preparation of Financial
Statements and Filing of Returns, the Company will publish the financials on the company’s
website latest by May 24, 2018.
For and on behalf of the Board of Directors
_________________
Sandeep Batra
Mumbai Executive Director
April 24, 2018 DIN: 03620913

B S R & Co. LLP Walker Chandiok & Co LLP Chartered Accountants
Chartered Accountants
5th Floor, Lodha Excelus
Apollo Mills Compound
Mahalakshmi
MUMBAI – 400 011
India
Telephone +91 22 4345 5300
Fax +91 22 4345 5399
16th Floor, Tower II
Indiabulls Finance Centre
S. B. Marg, Elphinstone (West)
MUMBAI – 400 013
India
Telephone +91 22 6626 2600
Fax +91 22 6626 2601
B S R & Co. LLP (LLPIN No. AAB-8181),
registered with limited liability
Auditors’ Report on Quarterly Standalone Financial Results and Year to
Date Results of ICICI Prudential Life Insurance Company Limited
pursuant to the Regulation 33 of the SEBI (Listing Obligations and
Disclosure Requirements) Regulations, 2015 read with IRDA Circular
reference: IRDAI/F&I/REG/CIR/208/10/2016 dated 25th October 2016
To The Board of Directors of
ICICI Prudential Life Insurance Company Limited
We have audited the accompanying quarterly standalone financial results of ICICI Prudential Life
Insurance Company Limited (the “Company”) for the quarter ended March 31, 2018 and the standalone
year to date financial results for the period April 1, 2017 to March 31, 2018 attached herewith, being
submitted by the Company pursuant to the requirement of Regulation 33 of the SEBI (Listing
Obligations and Disclosure Requirements) Regulations, 2015 and IRDA Circular reference:
IRDAI/F&I/REG/CIR/208/10/2016 dated October 25, 2016. Attention is drawn to the fact that the
figures for the quarter ended March 31, 2018 and the corresponding quarter ended in the previous year
as reported in these standalone financial results are the balancing figures between audited figures in
respect of the full financial year and the published audited year to figures upto the end of the third
quarter.
These standalone quarterly financial results as well as the standalone year to financial results have been
prepared on the basis of the standalone financial statements, which are the responsibility of the
Company’s management and have been approved by the Board of Directors on April 24, 2018.
Our responsibility is to express an opinion on these standalone financial results and standalone year to
date financial results based on our audit of such standalone financial statements, which have been
prepared in accordance with the recognition and measurement principles specified under Section 133
of the Companies Act, 2013 (the “Act”), including the relevant provisions of the Insurance Act, 1938
(the “Insurance Act”), the Insurance Regulatory and Development Authority Act, 1999 (the “IRDA
Act”) and other accounting principles generally accepted in India, to the extent considered relevant and
appropriate for the purpose of standalone quarterly financial results as well as the standalone year to
date financial results and which are not inconsistent with the accounting principles as prescribed in the
Insurance Regulatory and Development Authority (Preparation of Financial Statements and Auditors’
Report of Insurance Companies) Regulations, 2002 (the “Regulations”) and orders/directions/circulars
issued by the Insurance Regulatory and Development Authority of India (“IRDAI”/ “Authority”) to the
extent applicable.
We conducted our audit in accordance with the auditing standards generally accepted in India. Those
standards require that we plan and perform the audit to obtain reasonable assurance about whether the
financial results are free of material misstatements. An audit includes examining, on a test basis,
evidence supporting the amounts disclosed as standalone financial results.

B S R & Co. LLP Walker Chandiok & Co LLP
Auditors’ Report on Quarterly Standalone Financial Results and Year to
Date Results of ICICI Prudential Life Insurance Company Limited
pursuant to the Regulation 33 of the SEBI (Listing Obligations and
Disclosure Requirements) Regulations, 2015 read with IRDA Circular
reference: IRDAI/F&I/REG/CIR/208/10/2016 dated 25th October 2016
(Continued)
ICICI Prudential Life Insurance Company Limited
An audit also includes assessing the accounting principles used and significant estimates made by
management. We believe that our audit provides a reasonable basis for our opinion.
In our opinion and to the best of our information and according to the explanations given to us these
standalone quarterly financial results as well as the standalone year to date results:
(i) are presented in accordance with the requirements of Regulation 33 of the SEBI (Listing
Obligations and Disclosure Requirements) Regulations, 2015 and IRDAI Circular
reference IRDAI/F&I/REG/CIR/208/10/2016 dated October 25, 2016 in this regard; and
(ii) give a true and fair view of the standalone net profit and other financial information for the
quarter ended March 31, 2018 as well as the standalone year to date results for the year
from April 1, 2017 to March 31, 2018.
Other Matters
The actuarial valuation of liabilities for life policies in force and for policies in respect of which
premium has been discontinued but liability exits as at March 31, 2018 is the responsibility of the
Company’s Appointed Actuary (the “Appointed Actuary”). The actuarial valuation of these liabilities
for life policies in force and for policies in respect of which premium has been discontinued but liability
exists as at March 31, 2018 has been duly certified by the Appointed Actuary and in her opinion, the
assumptions for such valuation are in accordance with the guidelines and norms issued by the IRDAI
and the Institute of Actuaries of India in concurrence with the Authority. We have relied upon the
Appointed Actuary’s certificate in this regard for forming our opinion on the valuation of liabilities for
life policies in force and for policies in respect of which premium has been discontinued but liability
exists, as contained in the standalone financial statements of the Company. Our opinion is not modified
in respect of the above matter.
For B S R & Co. LLP For Walker Chandiok & Co LLP
Chartered Accountants Chartered Accountants
ICAI Firm Registration No:
101248W/W-100022
ICAI Firm Registration No:
001076N/N500013
Venkataramanan Vishwanath per Khushroo B. Panthaky Partner Partner
Membership No: 113156 Membership No: 42423
Place : Mumbai Place : Mumbai
Date : April 24, 2018 Date : April 24, 2018

B S R & Co. LLP Walker Chandiok & Co LLP Chartered Accountants
Chartered Accountants
5th Floor, Lodha Excelus
Apollo Mills Compound
Mahalakshmi
MUMBAI – 400 011
India
Telephone +91 22 4345 5300
Fax +91 22 4345 5399
16th Floor, Tower II
Indiabulls Finance Centre
S. B. Marg, Elphinstone (West)
MUMBAI – 400 013
India
Telephone +91 22 6626 2600
Fax +91 22 6626 2601
B S R & Co. LLP (LLPIN No. AAB-8181),
registered with limited liability
Auditors’ Report on Quarterly Consolidated Financial Results and Year to
Date Results of ICICI Prudential Life Insurance Company Limited
pursuant to the Regulation 33 of the SEBI (Listing Obligations and
Disclosure Requirements) Regulations, 2015 read with IRDA Circular
reference: IRDAI/F&I/REG/CIR/208/10/2016 dated 25th October 2016
To The Board of Directors of
ICICI Prudential Life Insurance Company Limited
We have audited the accompanying quarterly consolidated financial results of ICICI Prudential Life
Insurance Company Limited (hereinafter referred to as “the Holding Company”) and its subsidiary,
ICICI Prudential Pension Funds Management Company Limited (the Holding Company and its
subsidiary together referred to as the “Group”) for the quarter ended March 31, 2018 and the
consolidated year to date financial results for the period April 1, 2017 to March 31, 2018, attached
herewith, being submitted by the Company pursuant to the requirement of Regulation 33 of the SEBI
(Listing Obligations and Disclosure Requirements) Regulations, 2015 and IRDA Circular reference:
IRDAI/F&I/REG/CIR/208/10/2016 dated October 25, 2016. Attention is drawn to the fact that the
figures for the quarter ended March 31, 2018 and the corresponding quarter ended in the previous year
as reported in these consolidated financial results are the balancing figures between audited figures in
respect of the full financial year and the audited year to figures upto the end of the third quarter.
These consolidated quarterly financial results as well as the consolidated year to date financial results
have been prepared on the basis of the consolidated financial statements, which is the responsibility of
the Holding Company’s management and have been approved by the Board of Directors on April 24,
2018.
Our responsibility is to express an opinion on these consolidated financial results and consolidated year
to date financial results based on our audit of such consolidated financial statements, which have been
prepared in accordance with the recognition and measurement principles specified under Section 133
of the Companies Act, 2013 (the “Act”), including the relevant provisions of the Insurance Act, 1938
(the “Insurance Act”), the Insurance Regulatory and Development Authority Act, 1999 (the “IRDA
Act”) and other accounting principles generally accepted in India, to the extent considered relevant and
appropriate for the purpose of consolidated quarterly financial results as well as the consolidated year
to date financial results and which are not inconsistent with the accounting principles as prescribed in
the Insurance Regulatory and Development Authority (Preparation of Financial Statements and
Auditors’ Report of Insurance Companies) Regulations, 2002 (the “Regulations”) and
orders/directions/circulars issued by the Insurance Regulatory and Development Authority of India
(“IRDAI”/ “Authority”) to the extent applicable.

B S R & Co. LLP Walker Chandiok & Co LLP
Auditors’ Report on Quarterly Consolidated Financial Results and Year to
Date Results of ICICI Prudential Life Insurance Company Limited
pursuant to the Regulation 33 of the SEBI (Listing Obligations and
Disclosure Requirements) Regulations, 2015 read with IRDA Circular
reference: IRDAI/F&I/REG/CIR/208/10/2016 dated 25th October 2016
(Continued)
ICICI Prudential Life Insurance Company Limited
We conducted our audit in accordance with the auditing standards generally accepted in India. Those
standards require that we plan and perform the audit to obtain reasonable assurance about whether the
financial results are free of material misstatements. An audit includes examining, on a test basis,
evidence supporting the amounts disclosed as consolidated financial results. An audit also includes
assessing the accounting principles used and significant estimates made by management. We believe
that our audit provides a reasonable basis for our opinion.
In our opinion and to the best of our information and according to the explanations given to us these
consolidated quarterly financial results as well as the consolidated year to date results:
(i) are presented in accordance with the requirements of Regulation 33 of the SEBI (Listing
Obligations and Disclosure Requirements) Regulations, 2015 and IRDAI Circular
reference IRDAI/F&I/REG/CIR/208/10/2016 dated October 25, 2016 in this regard; and
(ii) give a true and fair view of the consolidated net profit and other financial information for
the quarter ended March 31, 2018 as well as the consolidated year to date results for the
period from April 1, 2017 to March 31, 2018.
Other Matters
a. The actuarial valuation of liabilities for life policies in force and for policies in respect of which
premium has been discontinued but liability exists as at March 31, 2018 is the responsibility of
the Holding Company’s Appointed Actuary (the “Appointed Actuary”). The actuarial valuation
of these liabilities for life policies in force and for policies in respect of which premium has
been discontinued but liability exists as at March 31, 2018 has been duly certified by the
Appointed Actuary and in her opinion, the assumptions for such valuation are in accordance
with the guidelines and norms issued by the IRDAI and the Institute of Actuaries of India in
concurrence with the Authority. We have relied upon the Appointed Actuary’s certificate in
this regard for forming our opinion on the valuation of liabilities for life policies in force and
for policies in respect of which premium has been discontinued but liability exists, as contained
in the consolidated financial statements of the Group.
B S R & Co. LLP Walker Chandiok & Co LLP
Auditors’ Report on Quarterly Consolidated Financial Results and Year to
Date Results of ICICI Prudential Life Insurance Company Limited
pursuant to the Regulation 33 of the SEBI (Listing Obligations and
Disclosure Requirements) Regulations, 2015 read with IRDA Circular
reference: IRDAI/F&I/REG/CIR/208/10/2016 dated 25th October 2016
(Continued)
ICICI Prudential Life Insurance Company Limited
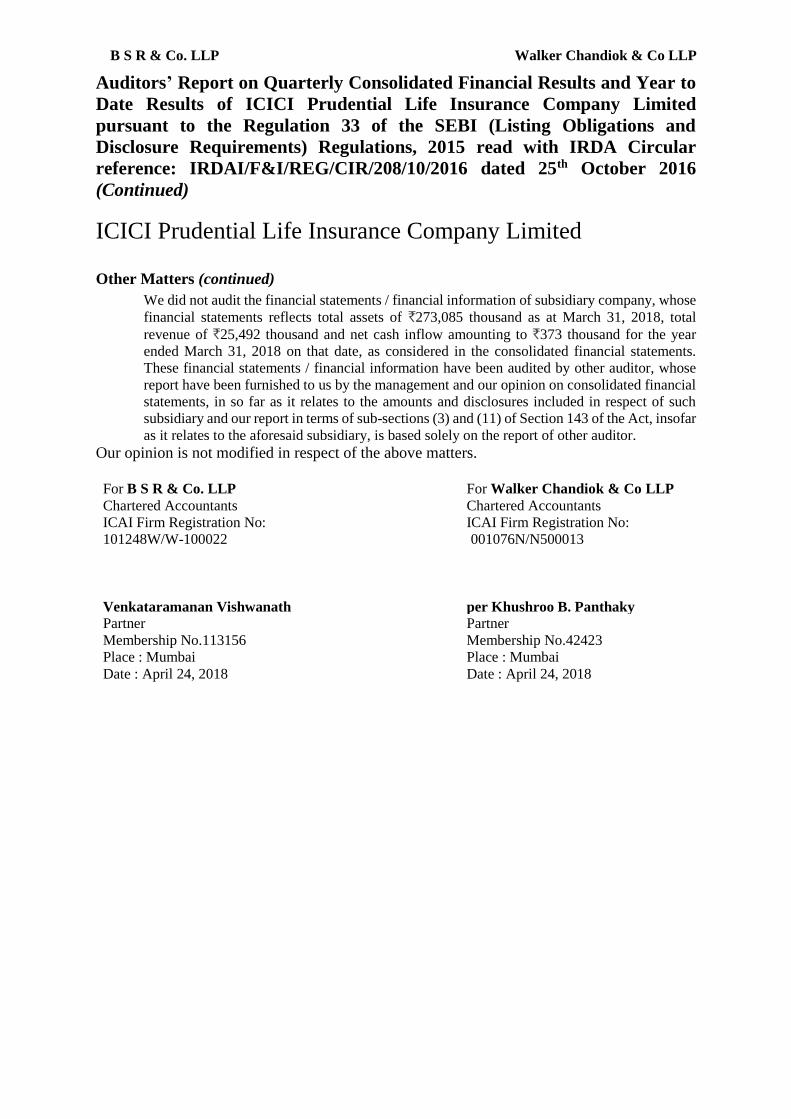
Other Matters (continued)
We did not audit the financial statements / financial information of subsidiary company, whose
financial statements reflects total assets of `273,085 thousand as at March 31, 2018, total
revenue of `25,492 thousand and net cash inflow amounting to `373 thousand for the year
ended March 31, 2018 on that date, as considered in the consolidated financial statements.
These financial statements / financial information have been audited by other auditor, whose
report have been furnished to us by the management and our opinion on consolidated financial
statements, in so far as it relates to the amounts and disclosures included in respect of such
subsidiary and our report in terms of sub-sections (3) and (11) of Section 143 of the Act, insofar
as it relates to the aforesaid subsidiary, is based solely on the report of other auditor.
Our opinion is not modified in respect of the above matters.
For B S R & Co. LLP For Walker Chandiok & Co LLP
Chartered Accountants Chartered Accountants
ICAI Firm Registration No:
101248W/W-100022
ICAI Firm Registration No:
001076N/N500013
Venkataramanan Vishwanath per Khushroo B. Panthaky Partner Partner
Membership No.113156 Membership No.42423
Place : Mumbai Place : Mumbai
Date : April 24, 2018 Date : April 24, 2018

1
ICICI Prudential Life Insurance Company Limited
Embedded Value Results
This report on Embedded Value results as at March 31, 2018 has been prepared by the
Company and the results presented in the report have been reviewed by Milliman Advisors
LLP.
1 Basis of preparation
The Embedded Value (EV) is a measure of the consolidated value of the shareholders’
interest in the life insurance business. The EV results have been prepared based on the
Indian Embedded Value (IEV) methodology and principles as set out in Actuarial Practice
Standard 101
(APS10) issued by the Institute of Actuaries of India (IAI). Since APS10 is
applicable for the limited purpose of an Initial Public Offering (IPO), compliance with APS10
is limited to the methodology and principles used to develop the IEV Results presented in
this report. The IEV methodology is broadly in line with the Market Consistent Embedded
Value2
(MCEV) principles used in Europe.
A detailed description of the IEV methodology is provided in section 3.
1 The Actuarial Practice Standard 10 for the IEV method is available at
http://www.actuariesindia.org/downloads/APS/APS_10_modification_ver1_02_28_03_2015.pdf
2 The MCEV principles as defined by the CFO forum are available at
http://www.cfoforum.nl/downloads/MCEV_Principles_and_Guidance_October_2009.pdf

2
2 Key results
2.1 Value of new business (VNB)
New business details (` bn) FY2017 FY2018
Value of New Business (VNB) 6.66 12.86
New Business Margin (VNB/APE) 10.1% 16.5%
Single Premium 17.95 20.34
Regular Premium 64.45 75.88
Annual Premium Equivalent (APE) 66.25 77.92
Protection 2.60 4.46
Savings 63.64 73.45
Components of VNB (` bn) As at March
31, 2017
As at March
31, 2018
VNB before TVFOG, CRNHR, FC 7.93 14.52
TVFOG in respect of new business (0.12) (0.14)
CRNHR in respect of new business (0.79) (1.25)
FC in respect of new business (0.36) (0.28)
Value of new business 6.66 12.86
2.2 IEV
Components of IEV (` bn) As at March
31, 2017
As at March
31, 2018
Free surplus (FS) 39.73 37.69
Required capital (RC) 27.83 32.55
Adjusted net worth (ANW) 67.56 70.24
Present value of future profits (PVFP) 99.74 124.25
Time value of financial options and guarantees
(TVFOG) (0.52) (0.98)
Cost of residual non-hedgeable risks (CRNHR) (3.10) (4.22)
Frictional cost of required capital (FC) (1.85) (1.41)
Value of in-force business (VIF) 94.28 117.64
Indian embedded value (IEV) 161.84 187.88
IEV operating earnings (EVOP) 22.95 36.80
Return on Embedded Value (ROEV) 16.5% 22.7%
Growth in IEV 16.1% 16.1%
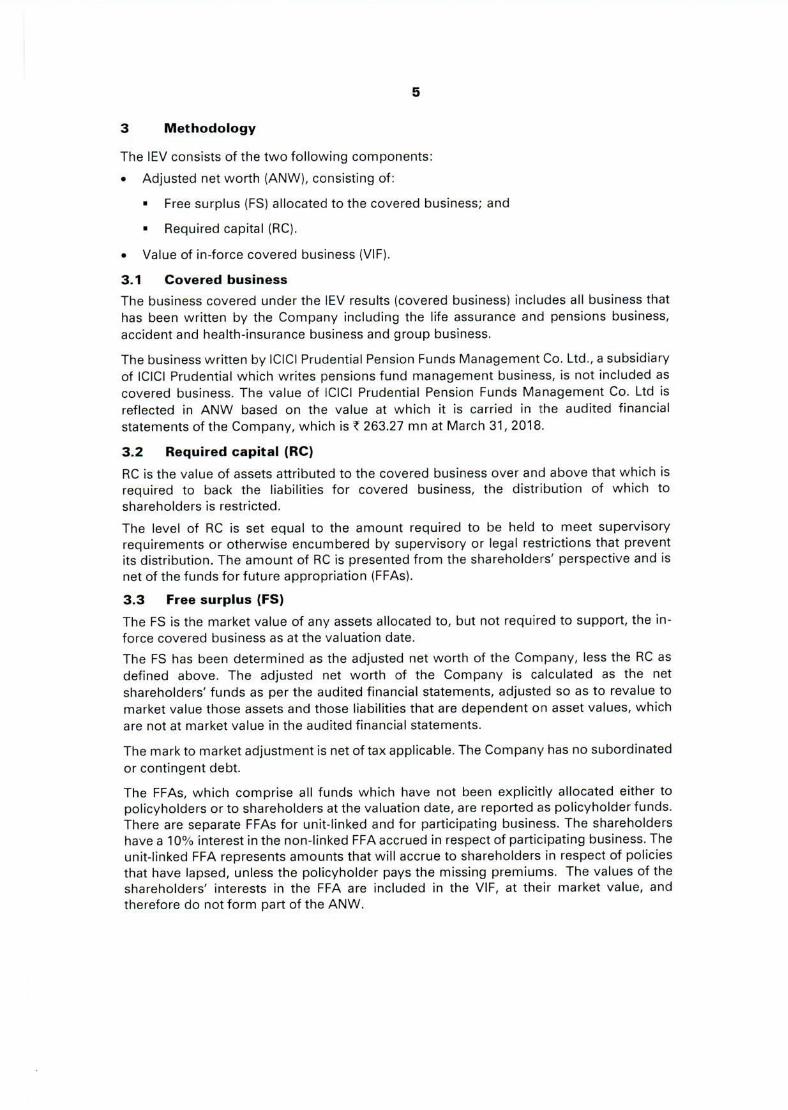
3
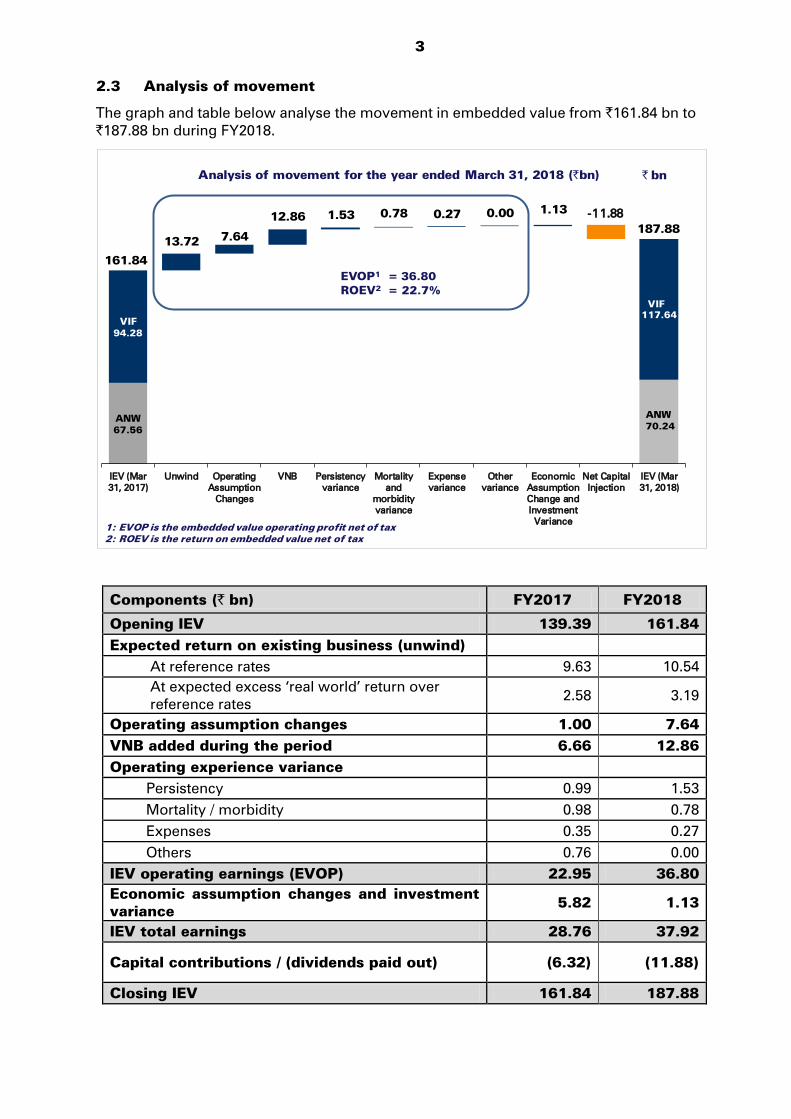
2.3 Analysis of movement
The graph and table below analyse the movement in embedded value from `161.84 bn to
`187.88 bn during FY2018.
Components (` bn) FY2017 FY2018
Opening IEV 139.39 161.84
Expected return on existing business (unwind)
At reference rates 9.63 10.54
At expected excess ‘real world’ return over
reference rates 2.58 3.19
Operating assumption changes 1.00 7.64
VNB added during the period 6.66 12.86
Operating experience variance
Persistency 0.99 1.53
Mortality / morbidity 0.98 0.78
Expenses 0.35 0.27
Others 0.76 0.00
IEV operating earnings (EVOP) 22.95 36.80
Economic assumption changes and investment
variance 5.82 1.13
IEV total earnings 28.76 37.92
Capital contributions / (dividends paid out) (6.32) (11.88)
Closing IEV 161.84 187.88
ANW
67.56
VIF
94.28
13.72 7.64
12.86 1.53 0.78 0.27 0.00 1.13
-11.88
IEV (Mar
31, 2017)
Unwind Operating
Assumption
Changes
VNB Persistency
variance
Mortality
and
morbidity
variance
Expense
variance
Other
variance
Economic
Assumption
Change and
Investment
Variance
Net Capital
Injection
IEV (Mar
31, 2018)
ANW
70.24
VIF
117.64
161.84
187.88
EVOP1
= 36.80
ROEV2
= 22.7%
` bn
1: EVOP is the embedded value operating profit net of tax
2: ROEV is the return on embedded value net of tax
Analysis of movement for the year ended March 31, 2018 (`bn)

4
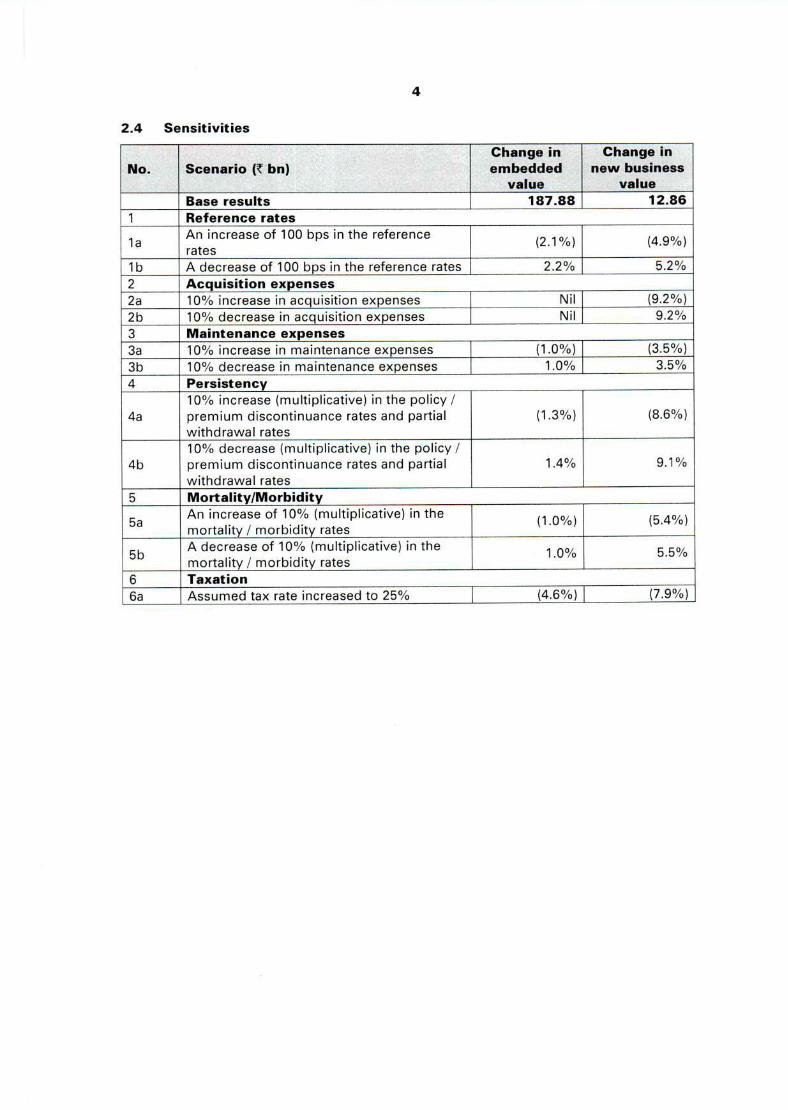
2.4 Sensitivities
No. Scenario (` bn)
Change in
embedded
value
Change in
new business
value
Base results 187.88 12.86
1 Reference rates
1a An increase of 100 bps in the reference
rates (2.1%) (4.9%)
1b A decrease of 100 bps in the reference rates 2.2% 5.2%
2 Acquisition expenses
2a 10% increase in acquisition expenses Nil (9.2%)
2b 10% decrease in acquisition expenses Nil 9.2%
3 Maintenance expenses
3a 10% increase in maintenance expenses (1.0%) (3.5%)
3b 10% decrease in maintenance expenses 1.0% 3.5%
4 Persistency
4a
10% increase (multiplicative) in the policy /
premium discontinuance rates and partial
withdrawal rates
(1.3%) (8.6%)
4b
10% decrease (multiplicative) in the policy /
premium discontinuance rates and partial
withdrawal rates
1.4% 9.1%
5 Mortality/Morbidity
5a An increase of 10% (multiplicative) in the
mortality / morbidity rates (1.0%) (5.4%)
5b A decrease of 10% (multiplicative) in the
mortality / morbidity rates 1.0% 5.5%
6 Taxation
6a Assumed tax rate increased to 25% (4.6%) (7.9%)

5
3 Methodology
The IEV consists of the two following components:
Adjusted net worth (ANW), consisting of:
Free surplus (FS) allocated to the covered business; and
Required capital (RC).
Value of in-force covered business (VIF).
3.1 Covered business
The business covered under the IEV results (covered business) includes all business that
has been written by the Company including the life assurance and pensions business,
accident and health-insurance business and group business.
The business written by ICICI Prudential Pension Funds Management Co. Ltd., a subsidiary
of ICICI Prudential which writes pensions fund management business, is not included as
covered business. The value of ICICI Prudential Pension Funds Management Co. Ltd is
reflected in ANW based on the value at which it is carried in the audited financial
statements of the Company, which is ` 263.27 mn at March 31, 2018.
3.2 Required capital (RC)
RC is the value of assets attributed to the covered business over and above that which is
required to back the liabilities for covered business, the distribution of which to
shareholders is restricted.
The level of RC is set equal to the amount required to be held to meet supervisory
requirements or otherwise encumbered by supervisory or legal restrictions that prevent
its distribution. The amount of RC is presented from the shareholders’ perspective and is
net of the funds for future appropriation (FFAs).
3.3 Free surplus (FS)
The FS is the market value of any assets allocated to, but not required to support, the in-
force covered business as at the valuation date.
The FS has been determined as the adjusted net worth of the Company, less the RC as
defined above. The adjusted net worth of the Company is calculated as the net
shareholders’ funds as per the audited financial statements, adjusted so as to revalue to
market value those assets and those liabilities that are dependent on asset values, which
are not at market value in the audited financial statements.
The mark to market adjustment is net of tax applicable. The Company has no subordinated
or contingent debt.
The FFAs, which comprise all funds which have not been explicitly allocated either to
policyholders or to shareholders at the valuation date, are reported as policyholder funds.
There are separate FFAs for unit-linked and for participating business. The shareholders
have a 10% interest in the non-linked FFA accrued in respect of participating business. The
unit-linked FFA represents amounts that will accrue to shareholders in respect of policies
that have lapsed, unless the policyholder pays the missing premiums. The values of the
shareholders’ interests in the FFA are included in the VIF, at their market value, and
therefore do not form part of the ANW.

6
3.4 Value of in-force business (VIF)
The VIF represents the present value of the shareholders’ interest in the earnings
distributable from the assets allocated to the business after sufficient allowance for the
aggregate risks in the business. The VIF consists of the following components:
the present value of future profits (PVFP); adjusted for
the time value of financial options and guarantees (TVFOG);
the frictional costs of required capital (FC); and
the cost of residual non-hedgeable risks (CRNHR).
Present value of future profits (PVFP)
The PVFP is the present value of projected distributable profits to shareholders arising
from the in-force covered business, determined by projecting the post taxation
shareholder cash flows from the in-force covered business and the assets backing the
associated liabilities. The distributable profits also include the release to shareholders of
the amounts from the FFA. For one year renewable group term business, expected
renewals from existing members are included in the PVFP.
For products with reviewable rates and charges, the projection of future cash flows
assumes that the rates and charges as at the valuation date remain unchanged.
The projection of future distributable profits arising from the covered business is carried
out using best estimate non-economic assumptions and market consistent economic
assumptions.
Distributable profits are determined by reference to liabilities determined in accordance
with the statutory requirements for life insurance companies.
The Company holds ‘global reserves’ calculated outside of its actuarial models as at the
valuation date. Wherever appropriate, the shareholders’ interest in the assets backing
such global reserves is calculated by assuming a suitable release pattern of such reserves.
Time value of financial options and guarantees (TVFOG)
The TVFOG reflects the value of the additional cost to shareholders that may arise from
the embedded financial options and guarantees attaching to the covered business. The
intrinsic value of such options and guarantees is reflected in the PVFP.
A stochastic approach is used to determine the TVFOG using methods and assumptions
consistent with the underlying embedded value. The economic assumptions used in
determining the TVFOG ensure that the projected cashflows are valued in line with the
price of similar cash flows that are traded in the capital markets.
Frictional cost (FC)
The VIF includes an allowance for the FC of RC for the covered business. These FCs
represent investment management expenses and taxation costs associated with holding
the RC. The investment costs have been reflected as an explicit reduction from the gross
investment return.
Cost of residual non-hedgeable risk (CRNHR)
The CRNHR is an allowance for risks to shareholder value to the extent that these are not
already allowed for in the TVFOG or the PVFP. In particular, the CRNHR makes allowance
for:
asymmetries in the impact of the risks on shareholder value; and
7
risks that are not allowed for in the TVFOG or the PVFP (e.g. operational risk).
The CRNHR reflects operational risk, catastrophe mortality/morbidity risk and mass
lapsation risk. The CRNHR has been determined using a cost of capital approach. The
CRNHR is the present value of a notional cost of capital charge levied on the projected
capital in respect of the residual non-hedgeable risks. Allowance has been made for
diversification benefits among the non-hedgeable risks, other than the operational risk.
The cost of capital charge is assumed to be 4% per annum.
3.5 New business and renewals
The VIF includes the value of expected renewal premiums on the in-force business,
including any foreseeable variations in the level of renewal premiums, but excludes any
value relating to future new business (i.e. the new business that may be written after the
applicable valuation date).
The VNB reflects the additional value to shareholders created through the activity of
writing new business over the stated period ending on the valuation date, and includes
the value of expected renewal premiums on that new business.
The new business comprises both individual and group policies sold during the reporting
period, including the expected renewal premiums and expected future contractual
alterations to those contracts. It also includes the non-contractual single premium
payments received during the reporting period. New business for one year renewable
group term business is business from new members that have joined a scheme during the
financial year and the VNB includes expected renewal premium. The VNB is calculated in
the same way as the VIF, with appropriate allowance for changes in the ANW during the
reporting period.
The VNB is determined as at March 31, 2018 and takes into account acquisition
commissions and acquisition expenses at the unit cost level incurred in the full year to
March 31, 2018.

8
3.6 Analysis of movement of IEV
A brief description of the various components is provided below
Components Description
Expected return on
existing business
(1) Expected investment income at opening reference rate
on VIF and ANW; and
(2) Expected excess ‘real world’ investment return over the
opening reference rate on VIF and ANW.
Operating
assumption changes
This is the impact of updating of non-economic assumptions
both on best estimate and statutory bases to those adopted
in the closing IEV.
VNB added during
the period This is as described in section 3.5 above
Operating experience
variance
The variance arising from discontinuance and mortality is
analysed at a policy level, by considering the actual change
in the policy status from the opening IEV to the closing IEV
dates and captures the difference between the actual and
expected experience and is calculated in the following order:
a. Discontinuance rates
b. Mortality / morbidity rates
c. Expenses
Economic
assumption changes
and Investment
variance
Economic assumption changes reflect the update of the
reference rate yield curve, inflation and valuation economic
assumptions from opening IEV to closing IEV.
The investment variance is the difference between the actual
investment return and the expected ‘real world’ rates for
existing business as at March 31, 2017 and the closing and
opening reference rates for new business written during
FY2017-18.
Capital contributions
/ (dividends paid out)
These are the actual capital infusions / dividends paid out to
the shareholders, including the dividend distribution tax
incurred during the period.
3.7 Sensitivities
Sensitivity analyses are carried out for one parameter at a time and do not include changes
in other parameters not explicitly mentioned as part of the sensitivity.
The key assumption changes represented by each of the sensitivities and their impact on
IEV and VNB are provided in section 2.
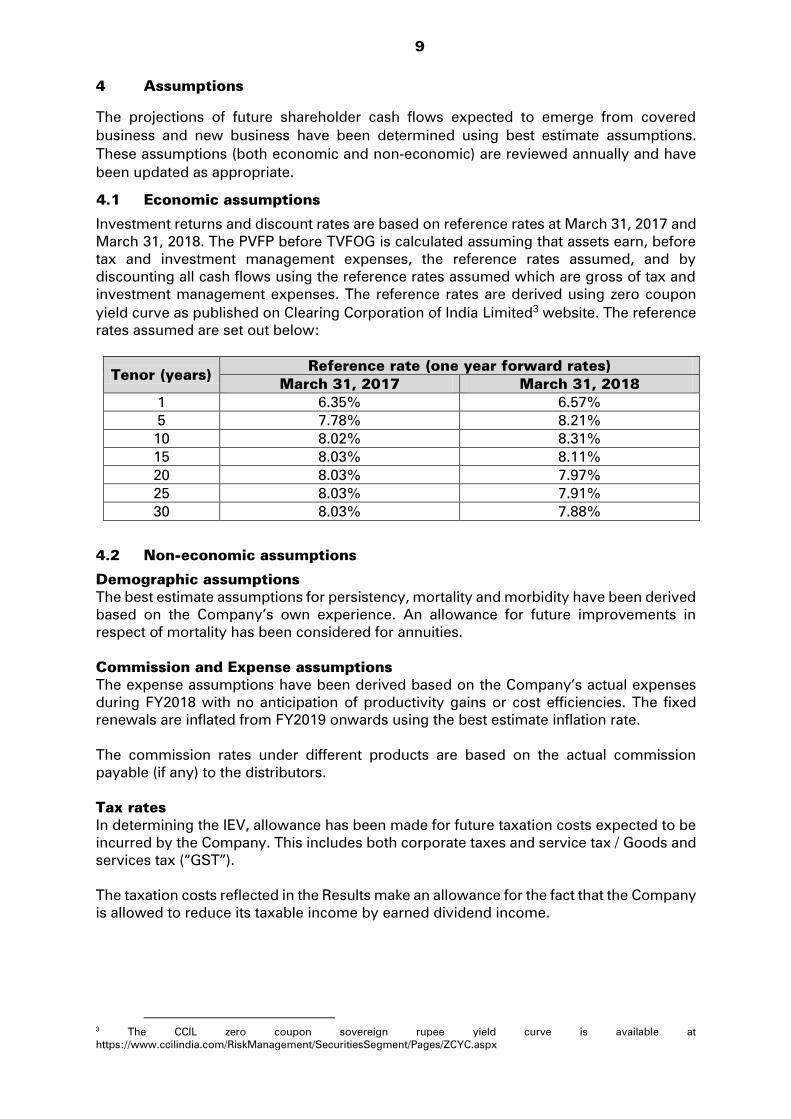
9
4 Assumptions
The projections of future shareholder cash flows expected to emerge from covered
business and new business have been determined using best estimate assumptions.
These assumptions (both economic and non-economic) are reviewed annually and have
been updated as appropriate.
4.1 Economic assumptions
Investment returns and discount rates are based on reference rates at March 31, 2017 and
March 31, 2018. The PVFP before TVFOG is calculated assuming that assets earn, before
tax and investment management expenses, the reference rates assumed, and by
discounting all cash flows using the reference rates assumed which are gross of tax and
investment management expenses. The reference rates are derived using zero coupon
yield curve as published on Clearing Corporation of India Limited3 website. The reference
rates assumed are set out below:
Tenor (years) Reference rate (one year forward rates)
March 31, 2017 March 31, 2018
1 6.35% 6.57%
5 7.78% 8.21%
10 8.02% 8.31%
15 8.03% 8.11%
20 8.03% 7.97%
25 8.03% 7.91%
30 8.03% 7.88%
4.2 Non-economic assumptions
Demographic assumptions
The best estimate assumptions for persistency, mortality and morbidity have been derived
based on the Company’s own experience. An allowance for future improvements in
respect of mortality has been considered for annuities.
Commission and Expense assumptions
The expense assumptions have been derived based on the Company’s actual expenses
during FY2018 with no anticipation of productivity gains or cost efficiencies. The fixed
renewals are inflated from FY2019 onwards using the best estimate inflation rate.
The commission rates under different products are based on the actual commission
payable (if any) to the distributors.
Tax rates
In determining the IEV, allowance has been made for future taxation costs expected to be
incurred by the Company. This includes both corporate taxes and service tax / Goods and
services tax (“GST”).
The taxation costs reflected in the Results make an allowance for the fact that the Company
is allowed to reduce its taxable income by earned dividend income.
3 The CCIL zero coupon sovereign rupee yield curve is available at
https://www.ccilindia.com/RiskManagement/SecuritiesSegment/Pages/ZCYC.aspx
Milliman Advisors LLP
B/712, 215 ATRIUM
Chakala, Andheri-Kurla Road
Andheri (E), Mumbai 400 059
India
Tel + 91 (22) 6784 8484
Fax + 91 (22) 6784 8401
milliman.com LLPIN: AAF-5603 R.O.: B/712, 215 ATRIUM, Chakala, Andheri-Kurla Road, Andheri (E), Mumbai 400 059
23 April 2018
The Board of Directors
ICICI Prudential Life Insurance Company Limited
ICICI PruLife Towers
Appasaheb Maratha Marg
Prabhadevi, Mumbai - 400 025
Re: Milliman’s opinion on the IEV results as at 31 March 2018
Dear Sirs
Introduction
ICICI Prudential Life Insurance Company Limited (‘ICICI Prudential’, ‘the Company’) has prepared an
Indian Embedded Value (IEV) as at 31 March 2018 and Value of New Business (VNB) for new
business sold during the year ending 31 March 2018 (together ‘the Results’), in line with the
methodology and principles set out in the Actuarial Practice Standard 10 (APS10) issued by the
Institute of Actuaries of India. The Results along with the methodology and assumptions that have
been used to prepare the Results have been summarized by the Company in this Annual Report.
Scope of services
Milliman Advisors LLP (‘Milliman’, ‘we’, ‘us’, ‘our’) has been engaged by ICICI Prudential Life
Insurance Company Limited (‘ICICI Prudential’, ‘the Company’) to carry out a review and certification
of the Results. Our scope of work includes the following:
a review of the methodology and assumptions used by the Company in developing the
Results for compliance with the relevant IEV principles set out in APS10, including a review of
process used to conduct the analysis of movement of IEV and various sensitivity analyses;
a review of the Company’s actuarial models (covering the IEV, VNB, analysis of movement
and sensitivity models) used to develop the Results for a selection of model points covering
the more material products comprising the VIF and VNB; and
a detailed review of the aggregation templates used by the Company to develop the company
level results.

Opinion
Based on the work carried out and subject to the reliances and limitations mentioned below, I am of
the opinion that the Results have been developed in all material respects in accordance with the
methodology and principles set out in APS10. In particular:
the methodology used to develop the Results is reasonable and in line with APS10;
the assumptions (economic and non-economic) used to develop the Results have been
developed substantially in line with the requirements of APS10, using the Company’s
operating experience (for non-economic assumptions) and are reasonable;
the Results have been prepared materially in accordance with the methodology and
assumptions described in the Annual Report and with the accounting information presented in
the financial statements;
the Results have been prepared materially in accordance with the requirements of APS10.
Reliances and Limitations
This Opinion has been prepared solely for use by ICICI Prudential for inclusion in this Annual Report.
It should not be relied upon for any other purpose. Milliman does not intend to create a legal duty to
any third party recipient of its work.
We have relied on information supplied by the management and staff of ICICI Prudential. Reliance
was placed on, but not limited to, the general accuracy of all the information provided to us.
We have obtained a management representation letter from ICICI Prudential, stating that, to the best
of ICICI Prudential’s knowledge, the data and information provided to us is accurate and complete
and that there are no material inaccuracies or omissions therein.
An actuarial assessment of the components of value of a life insurance company will not necessarily
be consistent with the value of a life insurance company or a portfolio in the open market and should
not be interpreted in that manner.
The Results are based on a series of assumptions as to future operating experience. It should be
recognised that actual experience will differ from these assumptions on account of changes in the
operating and economic environment and natural variations in experience. To the extent that actual
experience is different from the assumptions, the future projected profits from which the Results are
derived will also differ. The Annual Report includes various sensitivity results to illustrate how
vulnerable the Results are to changes in assumptions for the key risks. The Results shown are
presented at the valuation dates stated in this Report and no warranty is given by Milliman that future
experience after these valuation dates will be in line with the assumptions made.
The Results have been determined on a going concern basis, and assume a stable economic, legal
and regulatory environment going forward. Any change in the general operating environment would
add a high degree of uncertainty to the Results.
Unless explicitly stated, the Results do not consider any external (including regulatory) developments
after the valuation date of 31 March 2018.
Kind Regards,
Richard Holloway FIAI
Partner
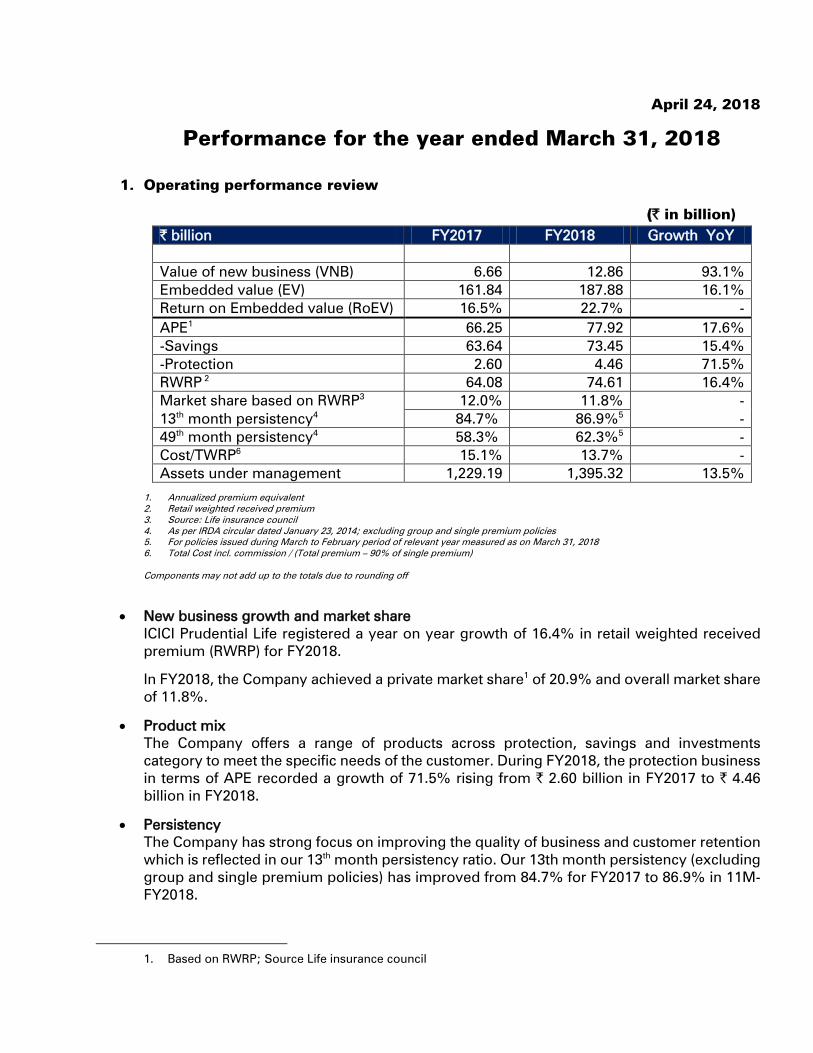
April 24, 2018
Performance for the year ended March 31, 2018
1. Operating performance review
(` in billion)
1. Annualized premium equivalent
2. Retail weighted received premium
3. Source: Life insurance council
4. As per IRDA circular dated January 23, 2014; excluding group and single premium policies
5. For policies issued during March to February period of relevant year measured as on March 31, 2018
6. Total Cost incl. commission / (Total premium – 90% of single premium)
Components may not add up to the totals due to rounding off
New business growth and market share
ICICI Prudential Life registered a year on year growth of 16.4% in retail weighted received
premium (RWRP) for FY2018.
In FY2018, the Company achieved a private market share1
of 20.9% and overall market share
of 11.8%.
Product mix
The Company offers a range of products across protection, savings and investments
category to meet the specific needs of the customer. During FY2018, the protection business
in terms of APE recorded a growth of 71.5% rising from ` 2.60 billion in FY2017 to ` 4.46
billion in FY2018.
Persistency
The Company has strong focus on improving the quality of business and customer retention
which is reflected in our 13th
month persistency ratio. Our 13th month persistency (excluding
group and single premium policies) has improved from 84.7% for FY2017 to 86.9% in 11M-
FY2018.
1. Based on RWRP; Source Life insurance council
` billion FY2017 FY2018 Growth YoY
Value of new business (VNB) 6.66 12.86 93.1%
Embedded value (EV) 161.84 187.88 16.1%
Return on Embedded value (RoEV) 16.5% 22.7% -
APE1
66.25 77.92 17.6%
-Savings 63.64 73.45 15.4%
-Protection 2.60 4.46 71.5%
RWRP 2
64.08 74.61 16.4%
Market share based on RWRP3
12.0% 11.8% -
13th
month persistency4
84.7% 86.9%5
-
49th
month persistency4
58.3% 62.3%5
-
Cost/TWRP6
15.1% 13.7% -
Assets under management 1,229.19 1,395.32 13.5%

Cost efficiency
The cost to TWRP ratio stood at 13.7% in FY2018 compared to 15.1% in FY2017 primarily on
account of strong growth.
Profitability
Value of New Business (VNB) for FY2018 was ` 12.86 billion compared to ` 6.66 billion for
FY2017. The VNB margin stood at 16.5% in FY2018.
The Company’s profit after tax was ` 16.20 billion for the year ended March 31, 2018
compared to ` 16.82 billion for the year ended March 31, 2017.
Embedded value
Our Embedded Value as on March 31, 2018 was ` 187.88 bn compared to ` 161.84 bn as on
March 31, 2017. Return on embedded value was 22.7% for FY2018 as compared to 16.5%
for FY2017.
Assets under management
As at March 31, 2018, the total assets under management of the Company were ` 1,395.32
billion which makes it one of the largest fund managers in India. As at March 31, 2018 the
Company has a debt-equity mix of 53%:47%. Over 90% of the debt investments are in AAA
rated and government bonds.
Net worth and capital position
Company’s net worth was ` 68.84 billion as at March 31, 2018. The solvency ratio was 252%
against regulatory requirement of 150%.
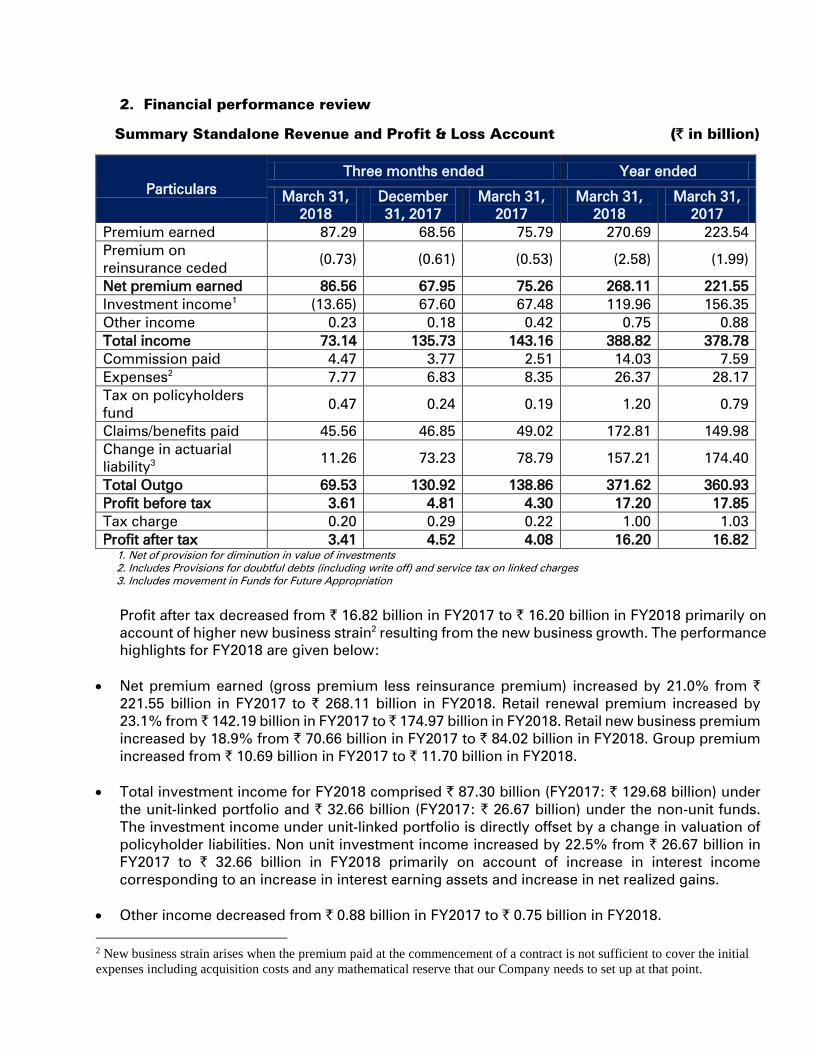
2. Financial performance review
Summary Standalone Revenue and Profit & Loss Account (` in billion)
Particulars
Three months ended Year ended
March 31,
2018
December
31, 2017
March 31,
2017
March 31,
2018
March 31,
2017
Premium earned 87.29 68.56 75.79 270.69 223.54
Premium on
reinsurance ceded (0.73) (0.61) (0.53) (2.58) (1.99)
Net premium earned 86.56 67.95 75.26 268.11 221.55
Investment income1
(13.65) 67.60 67.48 119.96 156.35
Other income 0.23 0.18 0.42 0.75 0.88
Total income 73.14 135.73 143.16 388.82 378.78
Commission paid 4.47 3.77 2.51 14.03 7.59
Expenses2
7.77 6.83 8.35 26.37 28.17
Tax on policyholders
fund 0.47 0.24 0.19 1.20 0.79
Claims/benefits paid 45.56 46.85 49.02 172.81 149.98
Change in actuarial
liability3
11.26 73.23 78.79 157.21 174.40
Total Outgo 69.53 130.92 138.86 371.62 360.93
Profit before tax 3.61 4.81 4.30 17.20 17.85
Tax charge 0.20 0.29 0.22 1.00 1.03
Profit after tax 3.41 4.52 4.08 16.20 16.82
1. Net of provision for diminution in value of investments
2. Includes Provisions for doubtful debts (including write off) and service tax on linked charges
3. Includes movement in Funds for Future Appropriation
Profit after tax decreased from ` 16.82 billion in FY2017 to ` 16.20 billion in FY2018 primarily on
account of higher new business strain2
resulting from the new business growth. The performance
highlights for FY2018 are given below:
Net premium earned (gross premium less reinsurance premium) increased by 21.0% from `
221.55 billion in FY2017 to ` 268.11 billion in FY2018. Retail renewal premium increased by
23.1% from ̀ 142.19 billion in FY2017 to ̀ 174.97 billion in FY2018. Retail new business premium
increased by 18.9% from ` 70.66 billion in FY2017 to ` 84.02 billion in FY2018. Group premium
increased from ` 10.69 billion in FY2017 to ` 11.70 billion in FY2018.
Total investment income for FY2018 comprised ` 87.30 billion (FY2017: ` 129.68 billion) under
the unit-linked portfolio and ` 32.66 billion (FY2017: ` 26.67 billion) under the non-unit funds.
The investment income under unit-linked portfolio is directly offset by a change in valuation of
policyholder liabilities. Non unit investment income increased by 22.5% from ` 26.67 billion in
FY2017 to ` 32.66 billion in FY2018 primarily on account of increase in interest income
corresponding to an increase in interest earning assets and increase in net realized gains.
Other income decreased from ` 0.88 billion in FY2017 to ` 0.75 billion in FY2018.
2 New business strain arises when the premium paid at the commencement of a contract is not sufficient to cover the initial
expenses including acquisition costs and any mathematical reserve that our Company needs to set up at that point.
Total expenses (including commission) increased by 12.9% from ` 35.76 billion in FY2017 to ` 40.40 billion in FY2018. Commission expense increased by 84.9% from ` 7.59 billion in FY2017
to ` 14.03 billion in FY2018. New Business Commission has increased from ` 4.69 billion in
FY2017 to ` 10.59 billion in FY2018. Renewal Commission has increased from ` 2.90 billion in
FY2017 to ` 3.44 billion in FY2018. The increase in commission expense is on account of the
change in product mix and growth in premium. Operating expenses decreased by 6.4% from `
28.17 billion in FY2017 to ` 26.37 billion in FY2018 on account of lower sales and marketing
expenses in the period partly offset by increased employee cost and service tax expenses.
Claims and benefit payouts increased by 15.2% from ̀ 149.98 billion in FY2017 to ̀ 172.81 billion
in FY2018 primarily on account of increase in surrender claims by ` 9.67 billion in FY2018 and
increase in maturity claims by ` 10.75 billion from ` 22.83 billion in FY2017 to ` 33.58 billion in
FY2018.
Change in actuarial liability, including funds for future appropriation, decreased from ` 174.40
billion in FY2017 to ` 157.21 billion in FY2018. Fund reserve, which represents liability carried on
account of units held by unit linked policyholders, decreased from ` 125.83 billion in FY2017 to
` 96.24 billion in FY2018. The decrease in fund reserves is primarily due a direct offset of lower
investment income, an increase in claims net of premium received in the unit-linked portfolio.
Non-unit reserve increased from ` 49.15 billion in FY2017 to ` 58.24 billion in FY2018 reflecting
broadly the increase in premium net of benefit outgo.
Disclaimer
Except for the historical information contained herein, statements in this release which contain words or phrases such as
'will', ‘expected to’, etc., and similar expressions or variations of such expressions may constitute 'forward-looking
statements'. These forward-looking statements involve a number of risks, uncertainties and other factors that could cause
actual results, opportunities and growth potential to differ materially from those suggested by the forward-looking
statements. These risks and uncertainties include, but are not limited to, the actual growth in demand for insurance and
other financial products and services in the countries that we operate or where a material number of our customers reside,
our ability to successfully implement our strategy, including our use of the Internet and other technology our exploration
of merger and acquisition opportunities, our ability to integrate mergers or acquisitions into our operations and manage
the risks associated with such acquisitions to achieve our strategic and financial objectives, our growth and expansion in
domestic and overseas markets, technological changes, our ability to market new products, the outcome of any legal, tax
or regulatory proceedings in India and in other jurisdictions we are or become a party to, the future impact of new
accounting standards, our ability to implement our dividend policy, the impact of changes in insurance regulations and
other regulatory changes in India and other jurisdictions on us. ICICI Prudential Life insurance undertakes no obligation to
update forward-looking statements to reflect events or circumstances after the date thereof.
This release does not constitute an offer of securities.
For investor queries please call Vikas Gupta at 91-22-40391600 (Ext: 1897) or email [email protected].
1 billion = 100 crore
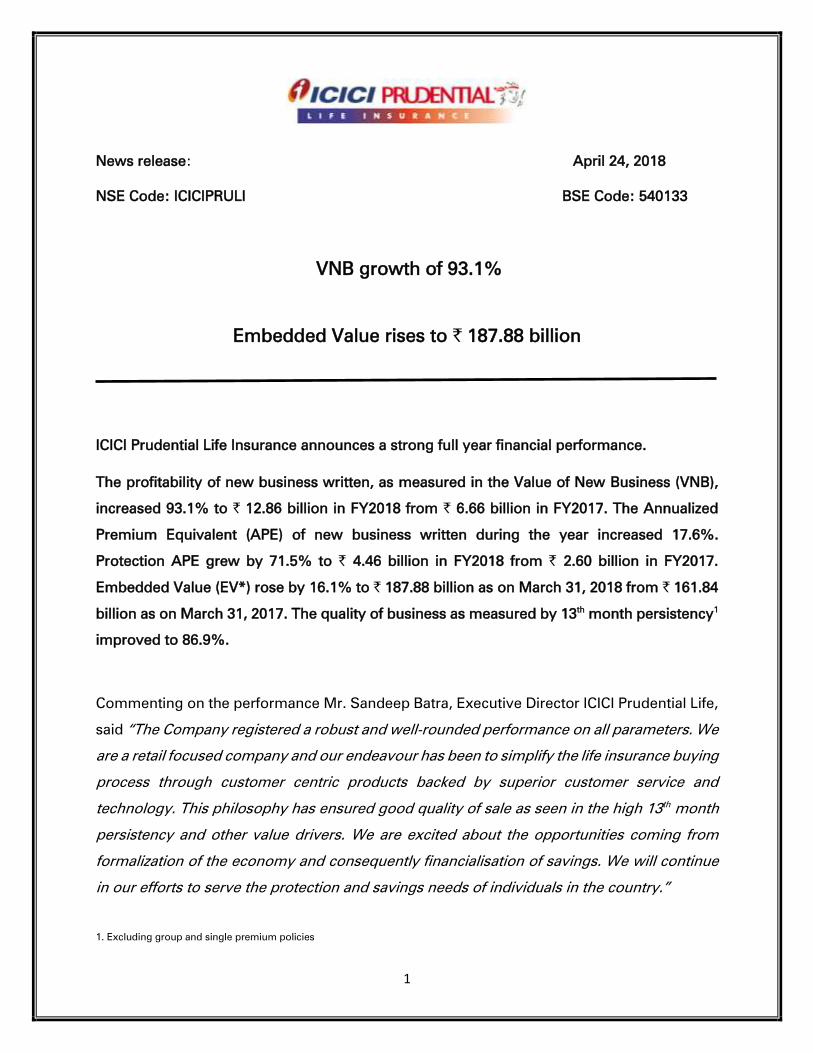
1
News release: April 24, 2018
NSE Code: ICICIPRULI BSE Code: 540133
VNB growth of 93.1%
Embedded Value rises to ` 187.88 billion
ICICI Prudential Life Insurance announces a strong full year financial performance.
The profitability of new business written, as measured in the Value of New Business (VNB),
increased 93.1% to ` 12.86 billion in FY2018 from ` 6.66 billion in FY2017. The Annualized
Premium Equivalent (APE) of new business written during the year increased 17.6%.
Protection APE grew by 71.5% to ` 4.46 billion in FY2018 from ` 2.60 billion in FY2017.
Embedded Value (EV*) rose by 16.1% to ` 187.88 billion as on March 31, 2018 from ` 161.84
billion as on March 31, 2017. The quality of business as measured by 13th
month persistency1
improved to 86.9%.
Commenting on the performance Mr. Sandeep Batra, Executive Director ICICI Prudential Life,
said “The Company registered a robust and well-rounded performance on all parameters. We
are a retail focused company and our endeavour has been to simplify the life insurance buying
process through customer centric products backed by superior customer service and
technology. This philosophy has ensured good quality of sale as seen in the high 13th
month
persistency and other value drivers. We are excited about the opportunities coming from
formalization of the economy and consequently financialisation of savings. We will continue
in our efforts to serve the protection and savings needs of individuals in the country.”
1. Excluding group and single premium policies

2
Performance for the period ended March 31, 2018
` billion FY2017 FY2018 Growth YoY
Value of new business (VNB) 6.66 12.86 93.1%
Embedded Value (EV) 161.84 187.88 16.1%
Return on Embedded Value (RoEV) 16.5% 22.7%
Annualized Premium Equivalent (APE)
66.25 77.92 17.6%
- Savings 63.64 73.45 15.4%
- Protection 2.60 4.46 71.5%
Retail Weighted Received Premium (RWRP) 1
64.08 74.61 16.4%
Market share based on RWRP 1
12.0% 11.8% -
13th
month persistency2
84.7% 86.9%3
-
49th
month persistency2
58.3% 62.3%3
-
Cost Ratio (Cost/TWRP) 4
15.1% 13.7% -
Assets under management 1,229.19 1,395.32 13.5%
1. Source: Life insurance council
2. As per IRDA circular dated January 23, 2014; excluding group and single premium
policies
3. For policies issued during March to February period of relevant year measured as on
March 31, 2018
4. Total Cost incl. commission / (Total premium – 90% of single premium)
Note: Totals may not add up to sum of individual numbers on the table due to rounding off
Profitability
Value of New Business (VNB) increased by 93.1% to ` 12.86 billion for FY2018 as compared
to ` 6.66 billion for FY2017. This robust growth is attributable to the growth in both savings
and protection APE as well as improvements in persistency and cost efficiency.
Embedded Value (EV) increased by 16.1% to ` 187.88 billion as on March 31, 2018 as
compared to ` 161.84 billion as on March 31, 2017. Return on embedded value was 22.7%
for FY2018 as compared to 16.5% for FY2017. The Company believes the growth in the EV
endorses its value creation approach.
3
New business growth
The Annualized Premium Equivalent (APE) of the Company increased by 17.6% year on year.
The savings business grew by 15.4% and protection business grew by 71.5% in the fiscal.
The Retail Weighted Received Premium (RWRP) of the Company registered a year on year
growth of 16.4% for FY2018. In FY2018, the Company achieved a private market share of
20.9% and overall market share of 11.8%.
Quality of business and efficiency
Persistency: The Company continues to make improvements in its persistency metrics. The
13th
month persistency improved to 86.9% for 11m-FY2018 from 84.7% for FY2017 and the
49th
month persistency improved to 62.3% for 11m-FY2018 from 58.3% for FY2017. This is
validation of the Company’s efforts to deliver superior customer service across all channels
and reaffirms the faith reposed in the Company by customers as their company of choice.
Cost ratios: The cost to Total Weighted Received Premium (TWRP) ratio stood at 13.7% for
FY2018 (15.1% for FY2017) primarily on account of growth in the business.
The Assets under Management (AUM) increased to ̀ 1,395.32 billion for FY2018 as compared
to ` 1,229.19 billion in FY2017, a growth of 13.5%.
Dividend
The Board has approved a Final dividend of ` 3.30 per equity share (including the special
dividend of ` 1.10 per equity share) for H2-FY2018. This is in addition to the interim dividend
of ̀ 3.40 per share already declared and paid, bringing the aggregate of total dividend of ̀ 6.70
per share for FY2018.
The Board of Directors of ICICI Prudential Life Insurance Company Limited approved its
audited financial results for the quarter ended March 31, 2018, following its meeting on
Tuesday, April 24, 2018 in Mumbai. The disclosure of financial results submitted to exchanges
is annexed to this release.
4
Definitions, abbreviations and explanatory notes
Annual Premium Equivalent (APE): APE is a measure of new business written by a life insurance
company. It is computed as the sum of annualised first year premiums on regular premium policies,
and ten percent of single premiums, written by the Company during any period from new retail and
group customers.
Value of New Business (VNB) and VNB margin: VNB is used to measure profitability of the new
business written in a period. It is present value of all future profits to shareholders measured at the
time of writing of the new business contract. Future profits are computed on the basis of long term
assumptions which are reviewed annually. Also referred to as NBP (new business profit). VNB
margin is computed as VNB for the period/APE for the period. It is similar to profit margin for any
other business.
Embedded Value (EV): EV is the current net worth of the company plus the present value of all
future profits to shareholders from the existing book of the Company (including new business
written in the year). As in the case of VNB, future profits are computed based on assumptions which
are reviewed annually. A positive EV variance is indicative of superior performance by the
Company as compared to what was assumed in arriving at the EV at the beginning of the year. A
positive EV variance and VNB increase the EV year on year. The change in EV because of
performance as compared to assumptions is disclosed by the Company through Analysis of
Movement disclosure annually. EV has been computed using IEV principles set out in Actuarial
practice standard 10.
Retail Weighted Received Premium (RWRP): RWRP is a new business measure very similar to APE
for the retail (also referred to as individual) business with the only difference being that the regular
premiums considered here are first year premiums actually received by the life insurer and not
annualised. Secondly since it is a new business measure for retail business, it includes only
premium received from retail customers. It is the sum of all retail first year premiums and ten
percent of retail single premiums received in a period.
Persistency: It is the most common parameter for quality of business representing the percentage
of retail policies (where premiums are expected) that continue paying premiums. The method of
computation of Persistency has been prescribed by IRDAI vide its circular dated January 23, 2014.
Total Weighted Received Premium (TWRP): TWRP is a measure of total premiums from new and
existing retail and group customers received in a period. It is sum of first year and renewal
premiums on regular premium policies and ten percent of single premiums received from both
retail and group customers by Company during the period.
Cost Ratio: Cost ratio is a measure of the cost efficiency of a Company. Expenses are incurred by
the Company on new business as well as renewal premiums. Cost ratio is computed as a ratio of
all expenses incurred in a period comprising commission, operating expenses, provision for
doubtful debts and bad debts written off to total weighted received premium (TWRP).

5
About ICICI Prudential Life Insurance
ICICI Prudential Life Insurance Company Ltd. (ICICI Prudential Life) is a joint venture between ICICI
Bank Ltd. and Prudential Corporation Holdings Limited which is a part of an international financial
services group headquartered in United Kingdom. ICICI Prudential Life was amongst the first private
sector insurance companies to begin operations in December 2000. The Company offers products
across the categories of Protection and Savings that fulfil the different life stage needs of customers.
ICICI Prudential Life is the first private life insurance company to cross the `1 trillion mark for assets
under management (AUM) and as on March 31, 2018 had an AUM of `1,395.32 billion. ICICI Prudential
Life is listed on both National Stock Exchange (NSE) and The Bombay Stock Exchange (BSE).
Disclaimer
Except for the historical information contained herein, statements in this release which contain words or phrases
such as 'will', ‘expected to’, etc., and similar expressions or variations of such expressions may constitute 'forward-
looking statements'. These forward-looking statements involve a number of risks, uncertainties and other factors
that could cause actual results, opportunities and growth potential to differ materially from those suggested by the
forward-looking statements. These risks and uncertainties include, but are not limited to, the actual growth in
demand for insurance and other financial products and services in the countries that we operate or where a
material number of our customers reside, our ability to successfully implement our strategy, including our use of
the Internet and other technology our exploration of merger and acquisition opportunities, our ability to integrate
mergers or acquisitions into our operations and manage the risks associated with such acquisitions to achieve our
strategic and financial objectives, our growth and expansion in domestic and overseas markets, technological
changes, our ability to market new products, the outcome of any legal, tax or regulatory proceedings in India and
in other jurisdictions we are or become a party to, the future impact of new accounting standards, our ability to
implement our dividend policy, the impact of changes in insurance regulations and other regulatory changes in
India and other jurisdictions on us. ICICI Prudential Life insurance undertakes no obligation to update forward-
looking statements to reflect events or circumstances after the date thereof. This release does not constitute an
offer of securities.
For further press queries please call Rajiv Adhikari / Akash Agarwal +91-22-40391600 (Ext: 1703 / 1732)
or email [email protected]
1 billion = 100 crore