financial performance of state owned enterprises in emerging economies
DESCRIPTION
This report examines the financial performance of state owned enterprises (SOEs) in emerging economies, with specific reference to Pakistan Rail (PR), and highlights the factors that have contributed to its poor financial performance. It identifies the shortcomings in the financial management systems of PR and suggests measures for improvement.TRANSCRIPT
Financial performance of state owned enterprises in emerging economies
Research executive summary series
Volume 8 | Issue 2
Authors Baqar Hussain Bhatti, Principal Researcher Atiqa Sarwet
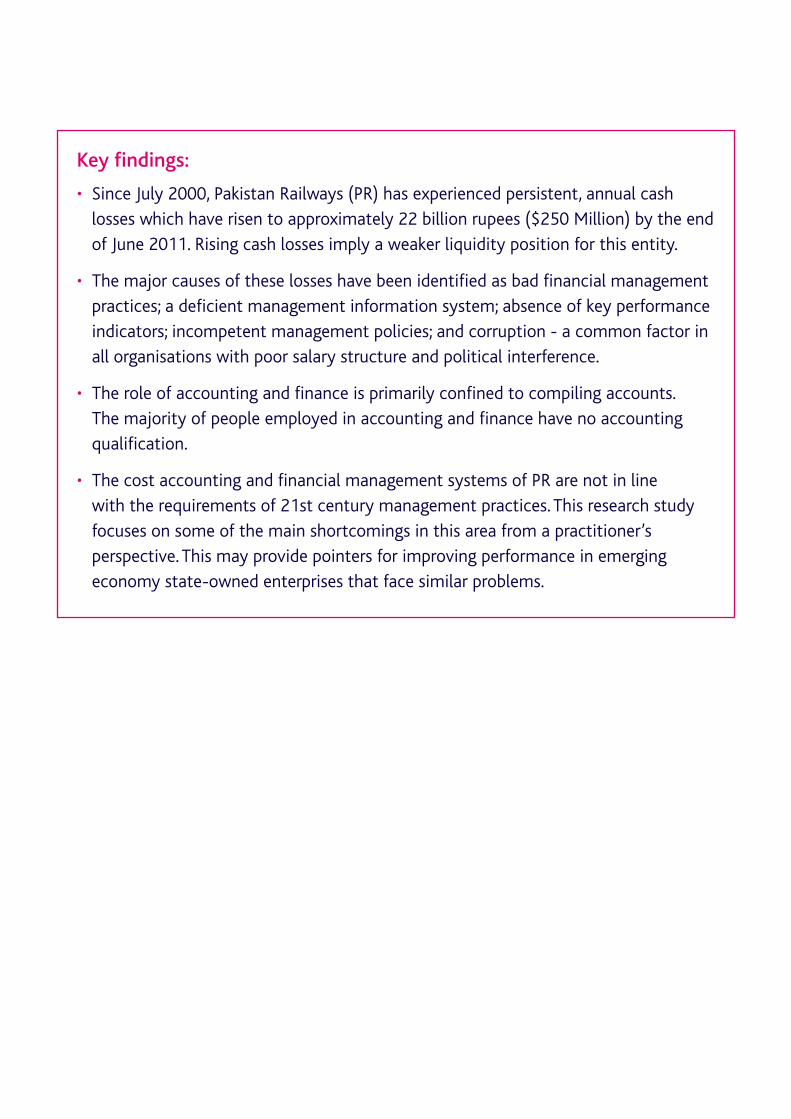
Key findings:
• Since July 2000, Pakistan Railways (PR) has experienced persistent, annual cash losses which have risen to approximately 22 billion rupees ($250 Million) by the end of June 2011. Rising cash losses imply a weaker liquidity position for this entity.
• The major causes of these losses have been identified as bad financial management practices; a deficient management information system; absence of key performance indicators; incompetent management policies; and corruption - a common factor in all organisations with poor salary structure and political interference.
• The role of accounting and finance is primarily confined to compiling accounts. The majority of people employed in accounting and finance have no accounting qualification.
• The cost accounting and financial management systems of PR are not in line with the requirements of 21st century management practices. This research study focuses on some of the main shortcomings in this area from a practitioner’s perspective. This may provide pointers for improving performance in emerging economy state-owned enterprises that face similar problems.
1 | Financial performance of state owned enterprises in emerging economies
Project Overview
This project examined the financial performance of Pakistan Railways (PR) - an important state-owned enterprise (SOE) in Pakistan - to identify the causes of its poor financial performance. Using a case study approach helped the researchers to analyse the issue by bridging the gap between theory and practice.
The study is based on a review of official documents and work practices, including interviews with PR managers and officials. The report focuses on audited financial statements from the last eleven years. These are the most authentic and important sources of information about the financial performance of PR. To determine the trend of declining financial performance, we also analysed quantitative data from the last six decades, as provided in key variables taken from the PR Year Books. However, the quality of the Year Books data may not be reliable in some instances due to poor management information systems in PR. (See appendices D, E, F and G).
Objectives
The primary objective of this research project is to analyse the financial performance of SOEs in emerging economies, with specific reference to PR. The aim is to highlight those factors that have contributed to the poor financial performance of PR. The research study also intends to identify shortcomings in the financial management systems of PR and suggest measures for improvement.
Emerging economies with the potential for rapid economic growth, but with volatile economic and political systems, have many common governance issues. The findings of this research project may also help practitioners and researchers to identify possible causes and solutions to the problems of similar SOEs in other emerging countries.
Pakistan Railways (PR) - The historical perspective
PR inherited a well-maintained infrastructure from British India in 1947. Up to the 1980s, this entity enjoyed a near monopoly status in the transportation sector due to weak competition from the road system. However, with the introduction of national highways and motorways in Pakistan, more people started to use the roads rather than the railways.
Due to its huge infrastructure and enormous operational overheads, the fall in the volume of business caused PR’s losses to increase rapidly. The government had to offer large annual subsidies to PR to mitigate its financial losses. But conventional management practices and bureaucratic inertia at PR meant that the situation did not improve.
The government had no option but to explore the possibility of privatising PR or some form of public-private partnership to improve performance. At the time of writing, it is still investigating these options.
Main findings and their implications
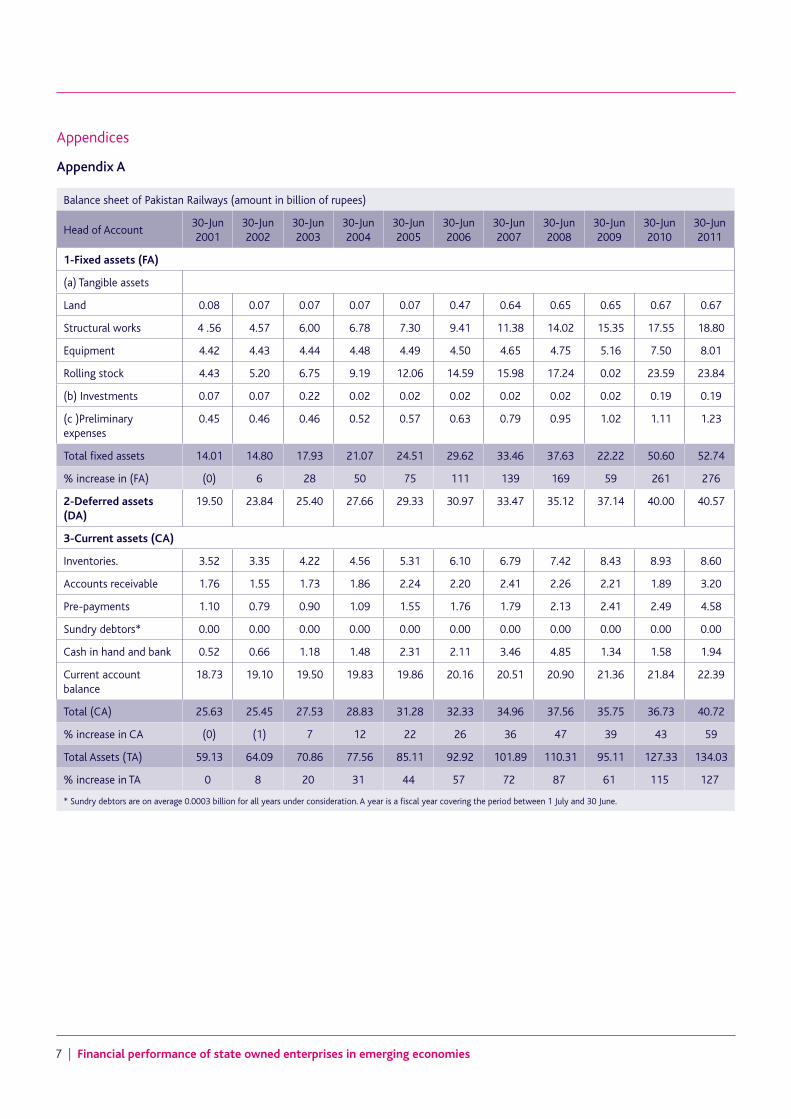
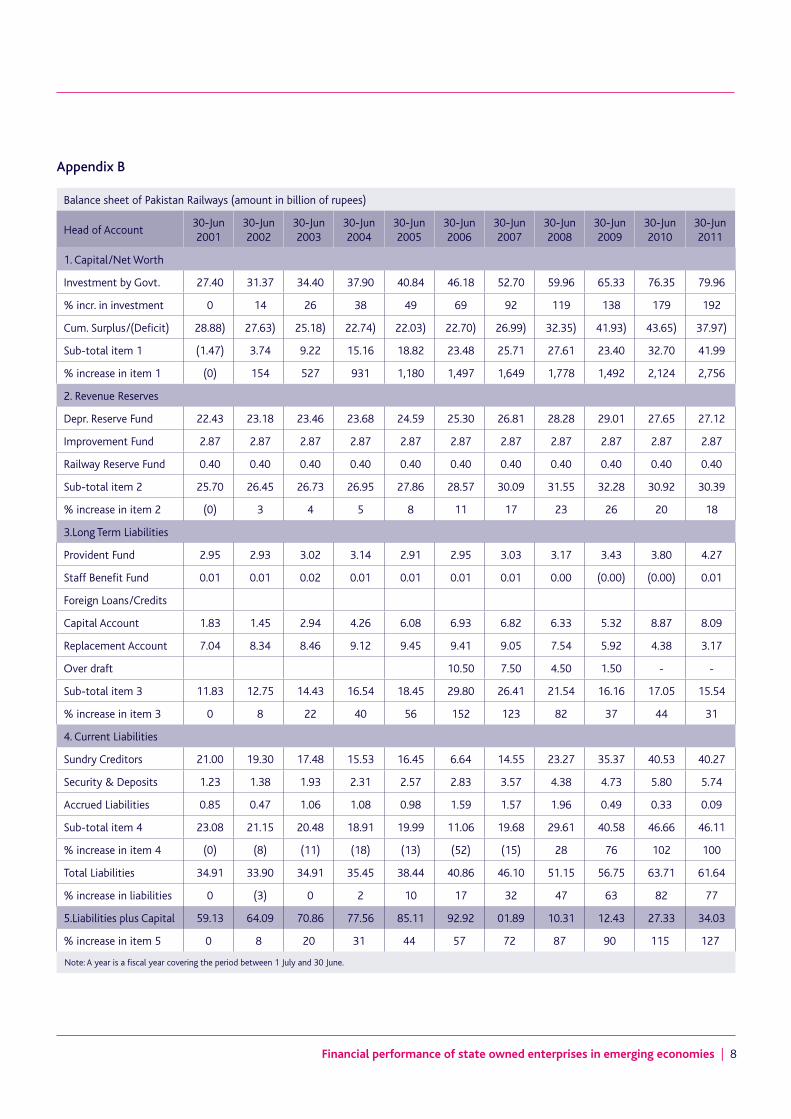
(a) Balance Sheets Analysis (Appendices A & B)
Between 2001 and 2011, total assets increased by a margin of 127%, while total liabilities increased by 77%. Among fixed assets, the greatest increase was recorded in land, rolling stock and structural works respectively. These statistics show that the asset base of the entity has been expanding gradually over the years in monetary terms. (However, appendix D reveals that the number of physical assets in quantitative terms has been declining.) During the same period, government investment increased by 192%, which largely offset PR’s deficits and improved the net worth of the business.
The current ratio of PR decreased from 1.11 in 2001 to 0.88 in 2011. This may reflect the fact that its short-term liquidity position has deteriorated making it difficult to meet day-to-day cash expenses. Realities on the ground confirm this. For example, employee salaries had to be stopped on several occasions recently due to non-availability of cash leading to administrative chaos! This also has serious consequences on the business operations of PR caused by a demoralised workforce.
Financial performance of state owned enterprises in emerging economies | 2
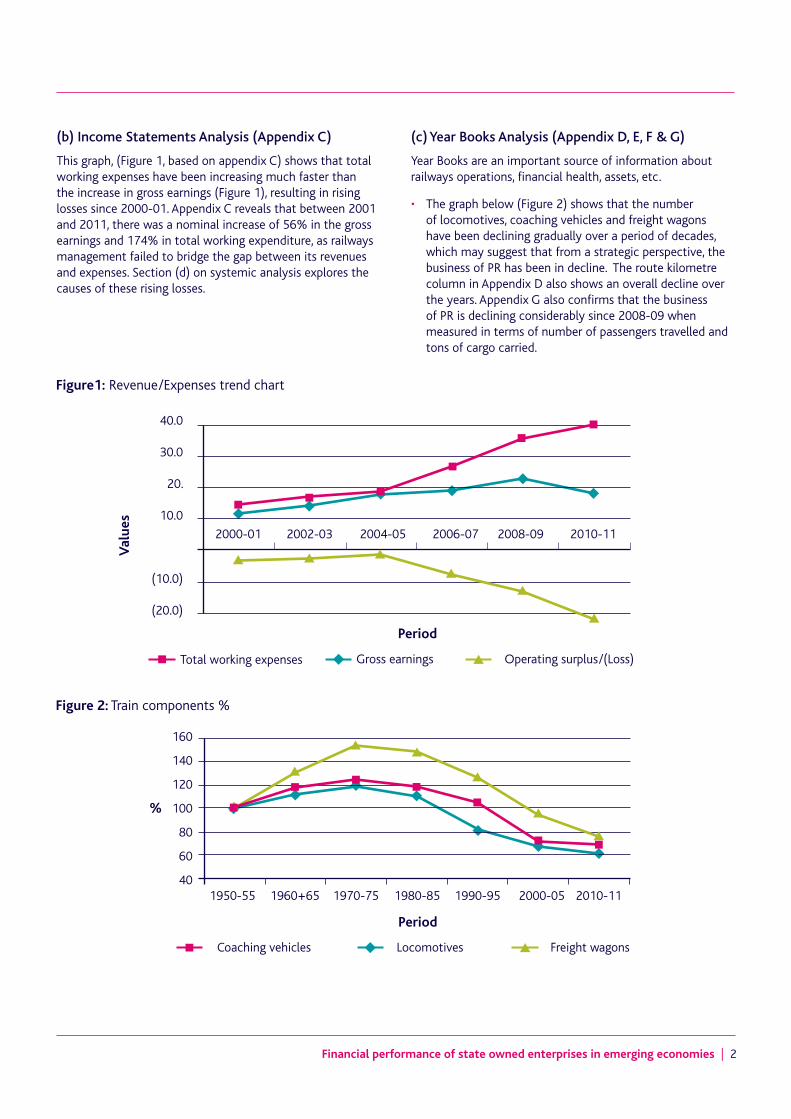
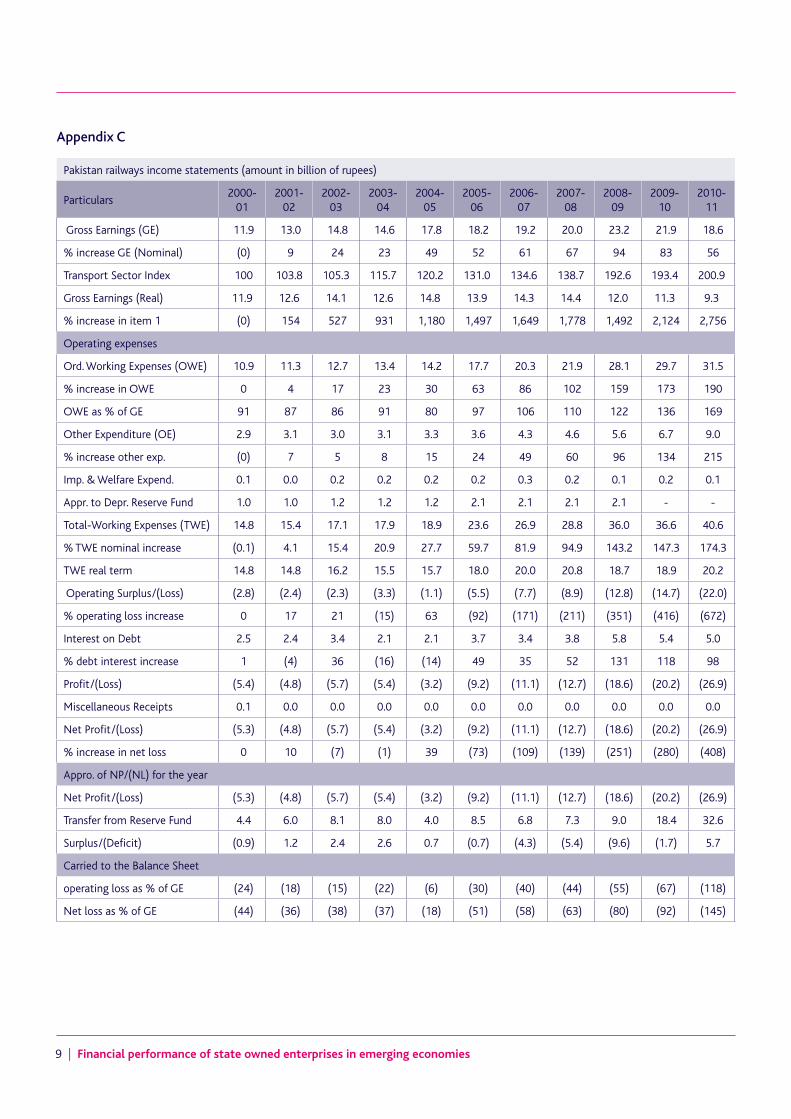
(b) Income Statements Analysis (Appendix C)
This graph, (Figure 1, based on appendix C) shows that total working expenses have been increasing much faster than the increase in gross earnings (Figure 1), resulting in rising losses since 2000-01. Appendix C reveals that between 2001 and 2011, there was a nominal increase of 56% in the gross earnings and 174% in total working expenditure, as railways management failed to bridge the gap between its revenues and expenses. Section (d) on systemic analysis explores the causes of these rising losses.
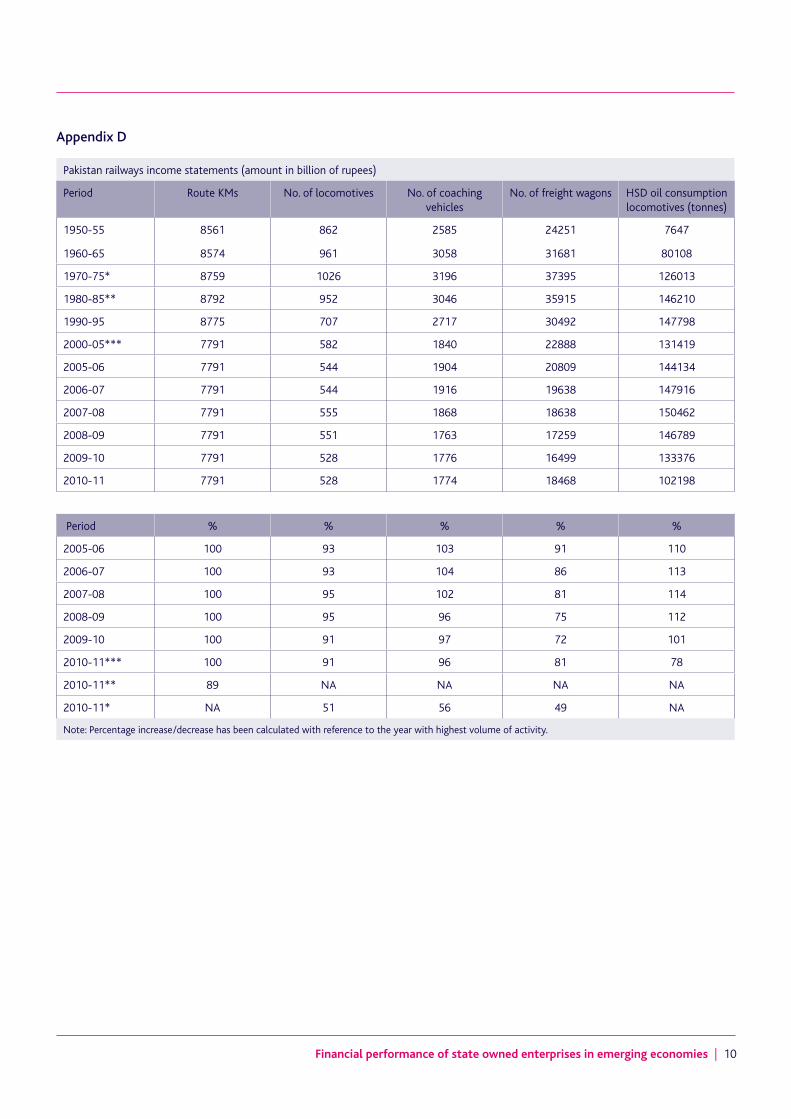
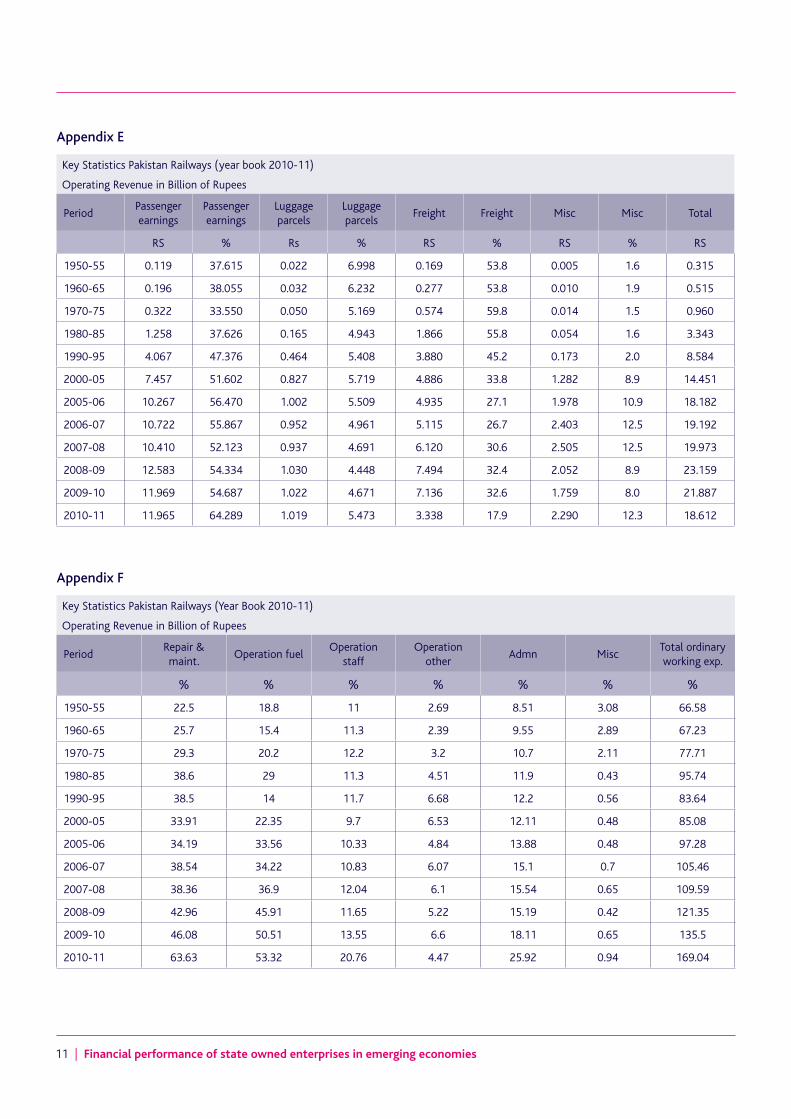
(c) Year Books Analysis (Appendix D, E, F & G)
Year Books are an important source of information about railways operations, financial health, assets, etc.
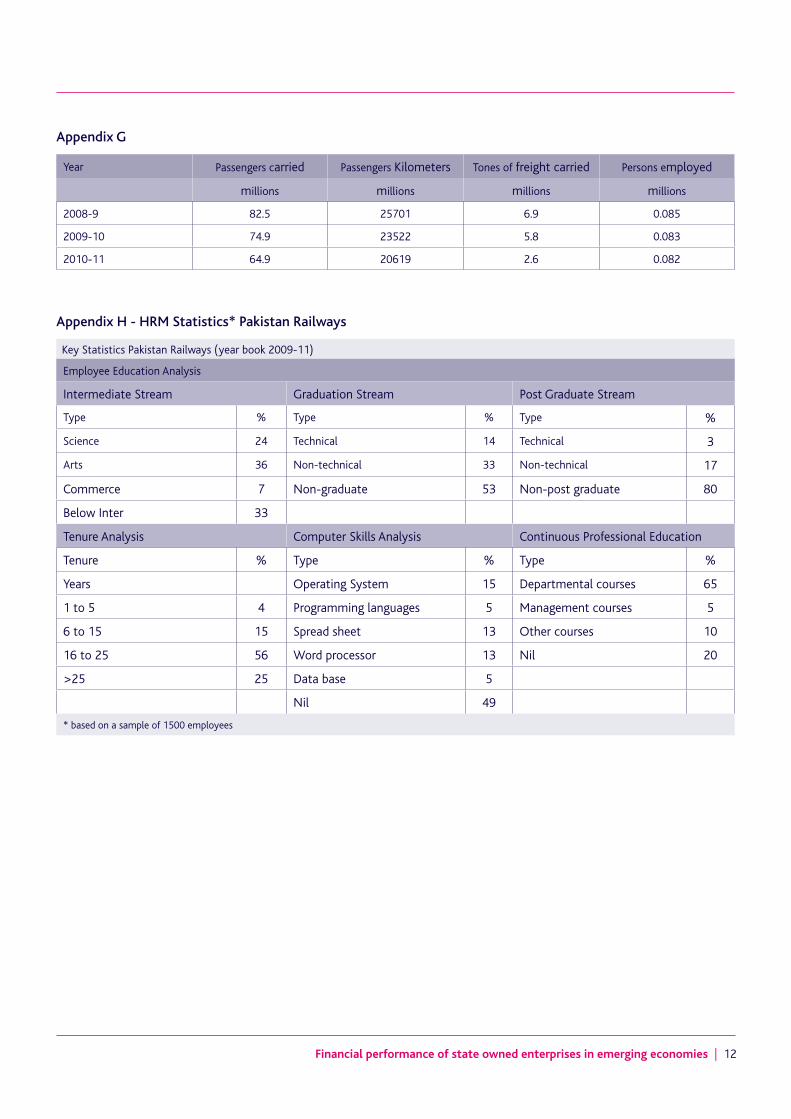
• The graph below (Figure 2) shows that the number of locomotives, coaching vehicles and freight wagons have been declining gradually over a period of decades, which may suggest that from a strategic perspective, the business of PR has been in decline. The route kilometre column in Appendix D also shows an overall decline over the years. Appendix G also confirms that the business of PR is declining considerably since 2008-09 when measured in terms of number of passengers travelled and tons of cargo carried.
2000-01 2002-03 2004-05 2006-07 2008-09 2010-11
40.0
30.0
20.
10.0
(10.0)
(20.0)
Period
Gross earningsTotal working expenses Operating surplus/(Loss)
Val
ues
Figure1: Revenue/Expenses trend chart
1950-55 1960+65 1970-75 1980-85 1990-95 2010-112000-05
160
140
120
100
80
60
40
Period
%
Coaching vehicles Locomotives Freight wagons
Figure 2: Train components %
3 | Financial performance of state owned enterprises in emerging economies
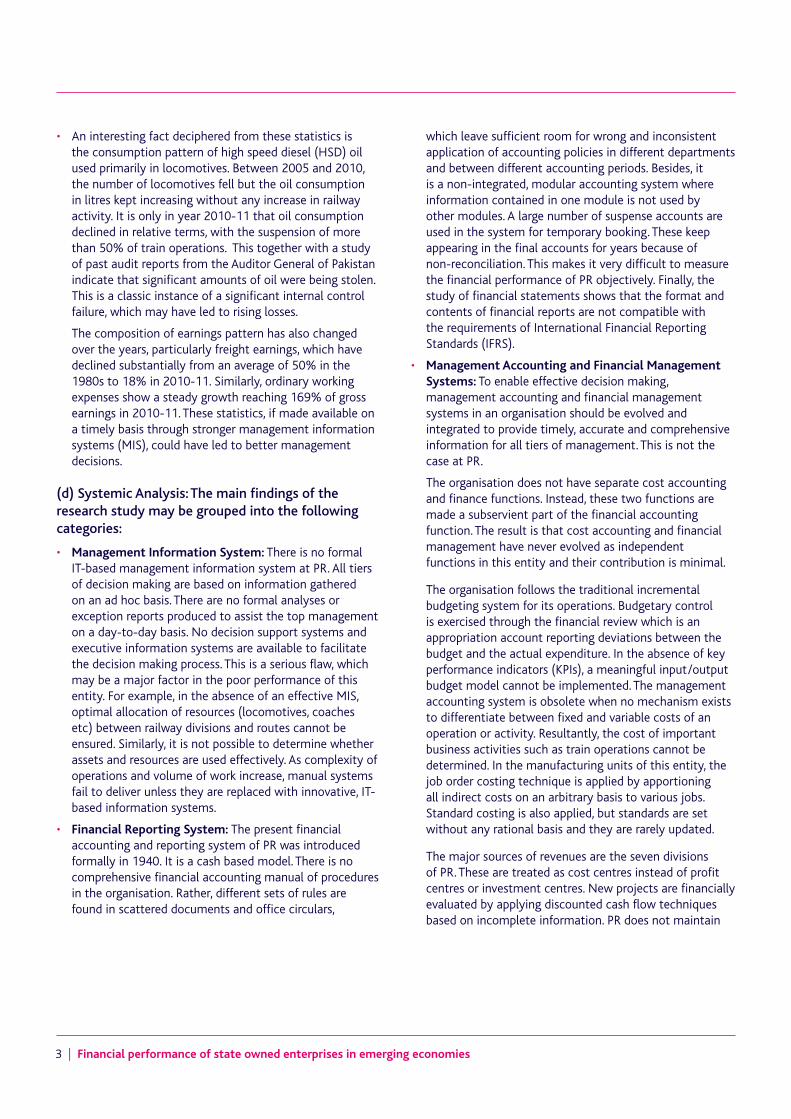
• An interesting fact deciphered from these statistics is the consumption pattern of high speed diesel (HSD) oil used primarily in locomotives. Between 2005 and 2010, the number of locomotives fell but the oil consumption in litres kept increasing without any increase in railway activity. It is only in year 2010-11 that oil consumption declined in relative terms, with the suspension of more than 50% of train operations. This together with a study of past audit reports from the Auditor General of Pakistan indicate that significant amounts of oil were being stolen. This is a classic instance of a significant internal control failure, which may have led to rising losses.
The composition of earnings pattern has also changed over the years, particularly freight earnings, which have declined substantially from an average of 50% in the 1980s to 18% in 2010-11. Similarly, ordinary working expenses show a steady growth reaching 169% of gross earnings in 2010-11. These statistics, if made available on a timely basis through stronger management information systems (MIS), could have led to better management decisions.
(d) Systemic Analysis: The main findings of the research study may be grouped into the following categories:
• Management Information System: There is no formal IT-based management information system at PR. All tiers of decision making are based on information gathered on an ad hoc basis. There are no formal analyses or exception reports produced to assist the top management on a day-to-day basis. No decision support systems and executive information systems are available to facilitate the decision making process. This is a serious flaw, which may be a major factor in the poor performance of this entity. For example, in the absence of an effective MIS, optimal allocation of resources (locomotives, coaches etc) between railway divisions and routes cannot be ensured. Similarly, it is not possible to determine whether assets and resources are used effectively. As complexity of operations and volume of work increase, manual systems fail to deliver unless they are replaced with innovative, IT-based information systems.
• Financial Reporting System: The present financial accounting and reporting system of PR was introduced formally in 1940. It is a cash based model. There is no comprehensive financial accounting manual of procedures in the organisation. Rather, different sets of rules are found in scattered documents and office circulars,
which leave sufficient room for wrong and inconsistent application of accounting policies in different departments and between different accounting periods. Besides, it is a non-integrated, modular accounting system where information contained in one module is not used by other modules. A large number of suspense accounts are used in the system for temporary booking. These keep appearing in the final accounts for years because of non-reconciliation. This makes it very difficult to measure the financial performance of PR objectively. Finally, the study of financial statements shows that the format and contents of financial reports are not compatible with the requirements of International Financial Reporting Standards (IFRS).
• Management Accounting and Financial Management Systems: To enable effective decision making, management accounting and financial management systems in an organisation should be evolved and integrated to provide timely, accurate and comprehensive information for all tiers of management. This is not the case at PR.
The organisation does not have separate cost accounting and finance functions. Instead, these two functions are made a subservient part of the financial accounting function. The result is that cost accounting and financial management have never evolved as independent functions in this entity and their contribution is minimal.
The organisation follows the traditional incremental budgeting system for its operations. Budgetary control is exercised through the financial review which is an appropriation account reporting deviations between the budget and the actual expenditure. In the absence of key performance indicators (KPIs), a meaningful input/output budget model cannot be implemented. The management accounting system is obsolete when no mechanism exists to differentiate between fixed and variable costs of an operation or activity. Resultantly, the cost of important business activities such as train operations cannot be determined. In the manufacturing units of this entity, the job order costing technique is applied by apportioning all indirect costs on an arbitrary basis to various jobs. Standard costing is also applied, but standards are set without any rational basis and they are rarely updated.
The major sources of revenues are the seven divisions of PR. These are treated as cost centres instead of profit centres or investment centres. New projects are financially evaluated by applying discounted cash flow techniques based on incomplete information. PR does not maintain
Financial performance of state owned enterprises in emerging economies | 4
any pension fund to provide for future pension costs. Rather all pension costs are met from the regular annual budget as part of operational expenses.
All these work practices have serious financial implications.
• Inventory and Procurement Management System: PR maintains a central depot/store and several sub-depots/stores for keeping around 35,000 types of inventory items. There is no formal inventory classification system in place for effective control and monitoring. Besides, once an item of inventory has been issued from the main depot, it is shown as consumed, although it may be kept in the sub-depot for months or years. This weak internal control results in pilferage of inventory by unscrupulous staff. A large number of items are purchased without establishing their actual need. Consequently, substantial amounts of money are blocked in redundant items of stock which could be used elsewhere. This also results in non-availability of essential inventory items due to consumption of limited funds on redundant items. The result is stoppage of various train operations due to non-availability of essential parts and components. Study of past audit reports also revealed that, in many instances, procurements have been made at inflated prices by corrupt officials. All these practices lead to rising losses in PR.
• Asset Management System: No proper system exists to monitor and evaluate the maintenance and replacement schedule of various items of assets. For example, locomotives and carriages are allowed to wear out due to poor maintenance up to a point where they cannot remain operational. At the time of writing, almost 50% of train operations have been suspended due to the non-availability of locomotives and carriages. The result is a substantial decline in the earnings of PR on a gradual basis. (Please refer to appendix C).
• Risk Management System: Risk management has become a critical issue in all businesses. Organisations need to have a proper risk management strategy in place to address critical risk issues in a timely manner. At PR, the responsibility of risk assessment and strategy formulation lies with the railway board comprising civil servants with limited knowledge of railway operations. Besides, these civil servants may be transferred too frequently on political and administrative grounds. The result is that risk management and strategy formulation is always done on an ad hoc basis with no tangible and consistent policy options.
• Human Resource Management: Employees of an organisation are its most important assets because they help transform organisational goals into real achievements. A study conducted by consultants, Riaz and Co, has highlighted flawed recruitment procedures at Pakistan Railways. Resultantly, a large number of employees in various functions do not possess the required qualifications (see Appendix H). The majority of employees were educated in arts subjects, while railway jobs generally require technical subjects such as engineering, management and finance. Interestingly, there are no wage differentials between non-skilled and skilled workers. The result is mismanagement and inefficiency in all business operations.
• Internal Control Systems: PR inherited an elaborate system of internal controls as designed during the British rule of India. However, over time: the complexity of business operations; increase in volume of transactions; and non-adherence to these controls; have led to the controls gradually lost their utility and efficacy. During the course of this research project, we observed many instances of internal control failure. These included procurements at inflated rates, pilferage of inventory from the stores, embezzlement of earnings from railway stations, passengers travelling without tickets, stealing of oil from the locomotives and stores, and employees claiming overtimes without performing actual work. These are all done with the connivance of PR officials at various levels. The result is substantial increase in annual financial losses at PR. Study of past audit reports corroborates these research findings.
• Cultural Impact: PR is a huge, bureaucratic organisation with traditional long tiers of management and slow decision-making processes. There is also political interference in all key decisions. This situation results in two outcomes. First, slow response to the dynamics of the changing business environment. A classic example is the time consumed by official meetings. The chairman and members of the Railways Board visit the Headquarters at Lahore almost on a weekly basis on the pretext of different meetings. All senior managers have to attend these meetings as a protocol. The result is that 40% of productive time is lost due to these non-value added meetings each week. Second, some decisions may be politically motivated with serious financial consequences for PR.
5 | Financial performance of state owned enterprises in emerging economies
Conclusion
This research study shows that the decline in financial performance of PR is due to multiple factors. The most important factors identified by the research include outdated information systems, poor financial management practices and a weak organisational culture. Since every management decision and policy has financial consequences (both in the short- and long-term), all these factors have contributed to the poor financial performance of this entity.
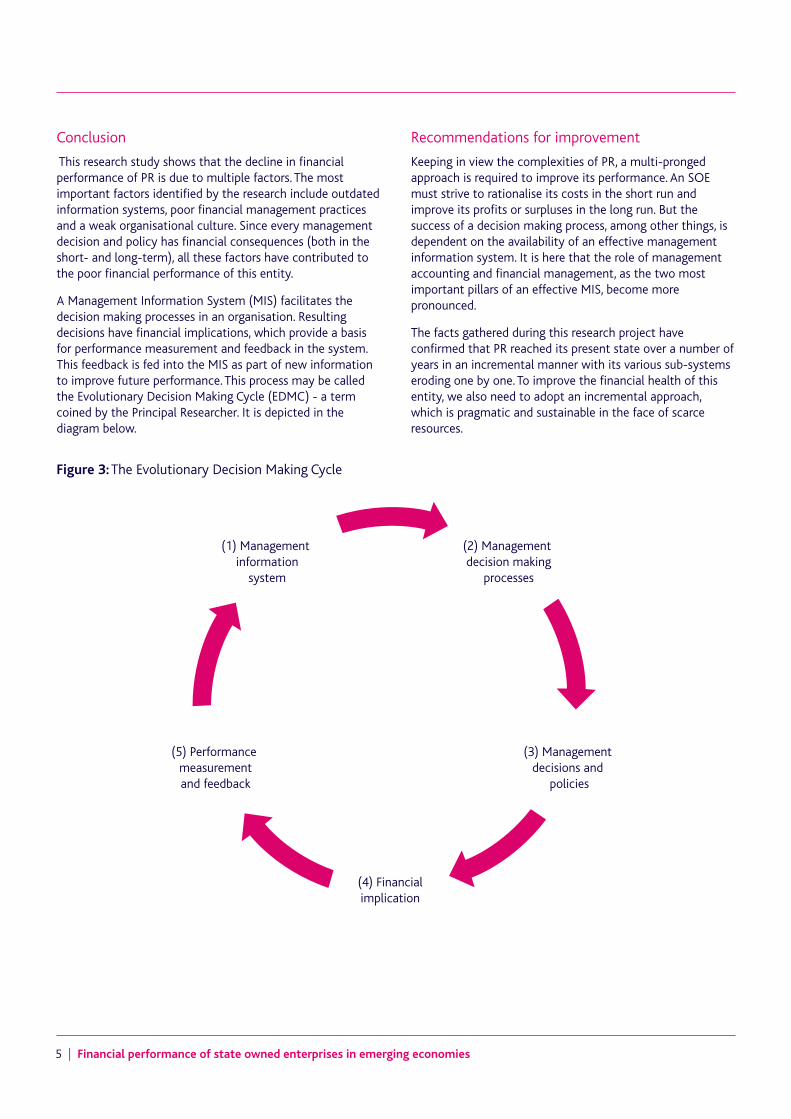
A Management Information System (MIS) facilitates the decision making processes in an organisation. Resulting decisions have financial implications, which provide a basis for performance measurement and feedback in the system. This feedback is fed into the MIS as part of new information to improve future performance. This process may be called the Evolutionary Decision Making Cycle (EDMC) - a term coined by the Principal Researcher. It is depicted in the diagram below.
Recommendations for improvement
Keeping in view the complexities of PR, a multi-pronged approach is required to improve its performance. An SOE must strive to rationalise its costs in the short run and improve its profits or surpluses in the long run. But the success of a decision making process, among other things, is dependent on the availability of an effective management information system. It is here that the role of management accounting and financial management, as the two most important pillars of an effective MIS, become more pronounced.
The facts gathered during this research project have confirmed that PR reached its present state over a number of years in an incremental manner with its various sub-systems eroding one by one. To improve the financial health of this entity, we also need to adopt an incremental approach, which is pragmatic and sustainable in the face of scarce resources.
Figure 3: The Evolutionary Decision Making Cycle
(2) Management decision making
processes
(3) Management decisions and
policies
(4) Financialimplication
(5) Performance measurementand feedback
(1) Management information
system
Financial performance of state owned enterprises in emerging economies | 6
Some of the main steps to improve financial performance of PR may include:
• Development of an IT-based management information system, which is fully integrated with the costing and financial management system of this entity.
• Full adoption of IFRS to make PR financial statements transparent, user friendly and comprehensible to all stakeholders.
• Adoption of modern management accounting techniques to strengthen its management accounting function. For example, Activity Based Costing (ABC) may be introduced to determine accurately the cost of each train operation. The introduction of output budgeting may provide a rational basis for performance measurement in this organisation. Similarly, an ABC Inventory model may help in classifying inventory items on a logical basis for effective inventory management.
• In the realm of financial management, cash budgets and cash management models may be introduced to synchronise cash receipts and expenses to overcome liquidity problems. Discounted Cash Flow Analysis (DCF) techniques, based on reliable forecasts, can improve project management issues significantly. Similarly pension costs may be rationalised by conducting an actuarial study and introducing a pension fund scheme.
• Introduction of improved internal control systems to minimise possibilities of pilferage, fraud and errors in all business operations. The internal audit function can play an important role in this context. As a first step, all procedural manuals - which are decades old - must be revised to bring them in line with modern management practices.
• Improvement in the recruitment procedures and introduction of a performance based salary structure may improve the productivity of the work force significantly. This may also reduce cases of willful corruption by the officials.
• In the long run, say six to 12 years, PR may be restructured in a manner that could facilitate its privatisation, in whole or part, to bring in management flair from the private sector. In the light of changing dynamics in the business environment, it is hard to assume that PR can operate as a financially viable organisation by remaining part of the government sector. Many countries such as the United Kingdom, New Zealand, Japan, and the USA have restructured their railways through deregulation, privatisation and public-private partnerships, and PR should not be an exception to this rule.
Scope for further research
This research study has identified broad variables responsible for the poor financial performance of PR. All the factors highlighted in the systemic analysis section provide sufficient ground for detailed research to highlight the specific roles of each factor in the financial performance of an SOE. Therefore, future research could focus on any one of these issues for detailed insight and understanding.
7 | Financial performance of state owned enterprises in emerging economies
Appendices
Appendix A
Balance sheet of Pakistan Railways (amount in billion of rupees)
Head of Account30-Jun 2001
30-Jun 2002
30-Jun 2003
30-Jun 2004
30-Jun 2005
30-Jun 2006
30-Jun 2007
30-Jun 2008
30-Jun 2009
30-Jun 2010
30-Jun 2011
1-Fixed assets (FA)
(a) Tangible assets
Land 0.08 0.07 0.07 0.07 0.07 0.47 0.64 0.65 0.65 0.67 0.67
Structural works 4 .56 4.57 6.00 6.78 7.30 9.41 11.38 14.02 15.35 17.55 18.80
Equipment 4.42 4.43 4.44 4.48 4.49 4.50 4.65 4.75 5.16 7.50 8.01
Rolling stock 4.43 5.20 6.75 9.19 12.06 14.59 15.98 17.24 0.02 23.59 23.84
(b) Investments 0.07 0.07 0.22 0.02 0.02 0.02 0.02 0.02 0.02 0.19 0.19
(c )Preliminary expenses
0.45 0.46 0.46 0.52 0.57 0.63 0.79 0.95 1.02 1.11 1.23
Total fixed assets 14.01 14.80 17.93 21.07 24.51 29.62 33.46 37.63 22.22 50.60 52.74
% increase in (FA) (0) 6 28 50 75 111 139 169 59 261 276
2-Deferred assets (DA)
19.50 23.84 25.40 27.66 29.33 30.97 33.47 35.12 37.14 40.00 40.57
3-Current assets (CA)
Inventories. 3.52 3.35 4.22 4.56 5.31 6.10 6.79 7.42 8.43 8.93 8.60
Accounts receivable 1.76 1.55 1.73 1.86 2.24 2.20 2.41 2.26 2.21 1.89 3.20
Pre-payments 1.10 0.79 0.90 1.09 1.55 1.76 1.79 2.13 2.41 2.49 4.58
Sundry debtors* 0.00 0.00 0.00 0.00 0.00 0.00 0.00 0.00 0.00 0.00 0.00
Cash in hand and bank 0.52 0.66 1.18 1.48 2.31 2.11 3.46 4.85 1.34 1.58 1.94
Current account balance
18.73 19.10 19.50 19.83 19.86 20.16 20.51 20.90 21.36 21.84 22.39
Total (CA) 25.63 25.45 27.53 28.83 31.28 32.33 34.96 37.56 35.75 36.73 40.72
% increase in CA (0) (1) 7 12 22 26 36 47 39 43 59
Total Assets (TA) 59.13 64.09 70.86 77.56 85.11 92.92 101.89 110.31 95.11 127.33 134.03
% increase in TA 0 8 20 31 44 57 72 87 61 115 127
* Sundry debtors are on average 0.0003 billion for all years under consideration. A year is a fiscal year covering the period between 1 July and 30 June.
Financial performance of state owned enterprises in emerging economies | 8
Appendix B
Balance sheet of Pakistan Railways (amount in billion of rupees)
Head of Account30-Jun 2001
30-Jun 2002
30-Jun 2003
30-Jun 2004
30-Jun 2005
30-Jun 2006
30-Jun 2007
30-Jun 2008
30-Jun 2009
30-Jun 2010
30-Jun 2011
1. Capital/Net Worth
Investment by Govt. 27.40 31.37 34.40 37.90 40.84 46.18 52.70 59.96 65.33 76.35 79.96
% incr. in investment 0 14 26 38 49 69 92 119 138 179 192
Cum. Surplus/(Deficit) 28.88) 27.63) 25.18) 22.74) 22.03) 22.70) 26.99) 32.35) 41.93) 43.65) 37.97)
Sub-total item 1 (1.47) 3.74 9.22 15.16 18.82 23.48 25.71 27.61 23.40 32.70 41.99
% increase in item 1 (0) 154 527 931 1,180 1,497 1,649 1,778 1,492 2,124 2,756
2. Revenue Reserves
Depr. Reserve Fund 22.43 23.18 23.46 23.68 24.59 25.30 26.81 28.28 29.01 27.65 27.12
Improvement Fund 2.87 2.87 2.87 2.87 2.87 2.87 2.87 2.87 2.87 2.87 2.87
Railway Reserve Fund 0.40 0.40 0.40 0.40 0.40 0.40 0.40 0.40 0.40 0.40 0.40
Sub-total item 2 25.70 26.45 26.73 26.95 27.86 28.57 30.09 31.55 32.28 30.92 30.39
% increase in item 2 (0) 3 4 5 8 11 17 23 26 20 18
3.Long Term Liabilities
Provident Fund 2.95 2.93 3.02 3.14 2.91 2.95 3.03 3.17 3.43 3.80 4.27
Staff Benefit Fund 0.01 0.01 0.02 0.01 0.01 0.01 0.01 0.00 (0.00) (0.00) 0.01
Foreign Loans/Credits
Capital Account 1.83 1.45 2.94 4.26 6.08 6.93 6.82 6.33 5.32 8.87 8.09
Replacement Account 7.04 8.34 8.46 9.12 9.45 9.41 9.05 7.54 5.92 4.38 3.17
Over draft 10.50 7.50 4.50 1.50 - -
Sub-total item 3 11.83 12.75 14.43 16.54 18.45 29.80 26.41 21.54 16.16 17.05 15.54
% increase in item 3 0 8 22 40 56 152 123 82 37 44 31
4. Current Liabilities
Sundry Creditors 21.00 19.30 17.48 15.53 16.45 6.64 14.55 23.27 35.37 40.53 40.27
Security & Deposits 1.23 1.38 1.93 2.31 2.57 2.83 3.57 4.38 4.73 5.80 5.74
Accrued Liabilities 0.85 0.47 1.06 1.08 0.98 1.59 1.57 1.96 0.49 0.33 0.09
Sub-total item 4 23.08 21.15 20.48 18.91 19.99 11.06 19.68 29.61 40.58 46.66 46.11
% increase in item 4 (0) (8) (11) (18) (13) (52) (15) 28 76 102 100
Total Liabilities 34.91 33.90 34.91 35.45 38.44 40.86 46.10 51.15 56.75 63.71 61.64
% increase in liabilities 0 (3) 0 2 10 17 32 47 63 82 77
5.Liabilities plus Capital 59.13 64.09 70.86 77.56 85.11 92.92 01.89 10.31 12.43 27.33 34.03
% increase in item 5 0 8 20 31 44 57 72 87 90 115 127
Note: A year is a fiscal year covering the period between 1 July and 30 June.
9 | Financial performance of state owned enterprises in emerging economies
Appendix C
Pakistan railways income statements (amount in billion of rupees)
Particulars2000-
012001-
022002-
032003-
042004-
052005-
062006-
072007-
082008-
092009-
102010-
11
Gross Earnings (GE) 11.9 13.0 14.8 14.6 17.8 18.2 19.2 20.0 23.2 21.9 18.6
% increase GE (Nominal) (0) 9 24 23 49 52 61 67 94 83 56
Transport Sector Index 100 103.8 105.3 115.7 120.2 131.0 134.6 138.7 192.6 193.4 200.9
Gross Earnings (Real) 11.9 12.6 14.1 12.6 14.8 13.9 14.3 14.4 12.0 11.3 9.3
% increase in item 1 (0) 154 527 931 1,180 1,497 1,649 1,778 1,492 2,124 2,756
Operating expenses
Ord. Working Expenses (OWE) 10.9 11.3 12.7 13.4 14.2 17.7 20.3 21.9 28.1 29.7 31.5
% increase in OWE 0 4 17 23 30 63 86 102 159 173 190
OWE as % of GE 91 87 86 91 80 97 106 110 122 136 169
Other Expenditure (OE) 2.9 3.1 3.0 3.1 3.3 3.6 4.3 4.6 5.6 6.7 9.0
% increase other exp. (0) 7 5 8 15 24 49 60 96 134 215
Imp. & Welfare Expend. 0.1 0.0 0.2 0.2 0.2 0.2 0.3 0.2 0.1 0.2 0.1
Appr. to Depr. Reserve Fund 1.0 1.0 1.2 1.2 1.2 2.1 2.1 2.1 2.1 - -
Total-Working Expenses (TWE) 14.8 15.4 17.1 17.9 18.9 23.6 26.9 28.8 36.0 36.6 40.6
% TWE nominal increase (0.1) 4.1 15.4 20.9 27.7 59.7 81.9 94.9 143.2 147.3 174.3
TWE real term 14.8 14.8 16.2 15.5 15.7 18.0 20.0 20.8 18.7 18.9 20.2
Operating Surplus/(Loss) (2.8) (2.4) (2.3) (3.3) (1.1) (5.5) (7.7) (8.9) (12.8) (14.7) (22.0)
% operating loss increase 0 17 21 (15) 63 (92) (171) (211) (351) (416) (672)
Interest on Debt 2.5 2.4 3.4 2.1 2.1 3.7 3.4 3.8 5.8 5.4 5.0
% debt interest increase 1 (4) 36 (16) (14) 49 35 52 131 118 98
Profit/(Loss) (5.4) (4.8) (5.7) (5.4) (3.2) (9.2) (11.1) (12.7) (18.6) (20.2) (26.9)
Miscellaneous Receipts 0.1 0.0 0.0 0.0 0.0 0.0 0.0 0.0 0.0 0.0 0.0
Net Profit/(Loss) (5.3) (4.8) (5.7) (5.4) (3.2) (9.2) (11.1) (12.7) (18.6) (20.2) (26.9)
% increase in net loss 0 10 (7) (1) 39 (73) (109) (139) (251) (280) (408)
Appro. of NP/(NL) for the year
Net Profit/(Loss) (5.3) (4.8) (5.7) (5.4) (3.2) (9.2) (11.1) (12.7) (18.6) (20.2) (26.9)
Transfer from Reserve Fund 4.4 6.0 8.1 8.0 4.0 8.5 6.8 7.3 9.0 18.4 32.6
Surplus/(Deficit) (0.9) 1.2 2.4 2.6 0.7 (0.7) (4.3) (5.4) (9.6) (1.7) 5.7
Carried to the Balance Sheet
operating loss as % of GE (24) (18) (15) (22) (6) (30) (40) (44) (55) (67) (118)
Net loss as % of GE (44) (36) (38) (37) (18) (51) (58) (63) (80) (92) (145)
Financial performance of state owned enterprises in emerging economies | 10
Appendix D
Pakistan railways income statements (amount in billion of rupees)
Period Route KMs No. of locomotives No. of coaching vehicles
No. of freight wagons HSD oil consumption locomotives (tonnes)
1950-55 8561 862 2585 24251 7647
1960-65 8574 961 3058 31681 80108
1970-75* 8759 1026 3196 37395 126013
1980-85** 8792 952 3046 35915 146210
1990-95 8775 707 2717 30492 147798
2000-05*** 7791 582 1840 22888 131419
2005-06 7791 544 1904 20809 144134
2006-07 7791 544 1916 19638 147916
2007-08 7791 555 1868 18638 150462
2008-09 7791 551 1763 17259 146789
2009-10 7791 528 1776 16499 133376
2010-11 7791 528 1774 18468 102198
Period % % % % %
2005-06 100 93 103 91 110
2006-07 100 93 104 86 113
2007-08 100 95 102 81 114
2008-09 100 95 96 75 112
2009-10 100 91 97 72 101
2010-11*** 100 91 96 81 78
2010-11** 89 NA NA NA NA
2010-11* NA 51 56 49 NA
Note: Percentage increase/decrease has been calculated with reference to the year with highest volume of activity.
11 | Financial performance of state owned enterprises in emerging economies
Appendix E
Key Statistics Pakistan Railways (year book 2010-11)
Operating Revenue in Billion of Rupees
PeriodPassenger earnings
Passenger earnings
Luggage parcels
Luggage parcels
Freight Freight Misc Misc Total
RS % Rs % RS % RS % RS
1950-55 0.119 37.615 0.022 6.998 0.169 53.8 0.005 1.6 0.315
1960-65 0.196 38.055 0.032 6.232 0.277 53.8 0.010 1.9 0.515
1970-75 0.322 33.550 0.050 5.169 0.574 59.8 0.014 1.5 0.960
1980-85 1.258 37.626 0.165 4.943 1.866 55.8 0.054 1.6 3.343
1990-95 4.067 47.376 0.464 5.408 3.880 45.2 0.173 2.0 8.584
2000-05 7.457 51.602 0.827 5.719 4.886 33.8 1.282 8.9 14.451
2005-06 10.267 56.470 1.002 5.509 4.935 27.1 1.978 10.9 18.182
2006-07 10.722 55.867 0.952 4.961 5.115 26.7 2.403 12.5 19.192
2007-08 10.410 52.123 0.937 4.691 6.120 30.6 2.505 12.5 19.973
2008-09 12.583 54.334 1.030 4.448 7.494 32.4 2.052 8.9 23.159
2009-10 11.969 54.687 1.022 4.671 7.136 32.6 1.759 8.0 21.887
2010-11 11.965 64.289 1.019 5.473 3.338 17.9 2.290 12.3 18.612
Appendix F
Key Statistics Pakistan Railways (Year Book 2010-11)
Operating Revenue in Billion of Rupees
PeriodRepair & maint.
Operation fuelOperation
staffOperation
otherAdmn Misc
Total ordinary working exp.
% % % % % % %
1950-55 22.5 18.8 11 2.69 8.51 3.08 66.58
1960-65 25.7 15.4 11.3 2.39 9.55 2.89 67.23
1970-75 29.3 20.2 12.2 3.2 10.7 2.11 77.71
1980-85 38.6 29 11.3 4.51 11.9 0.43 95.74
1990-95 38.5 14 11.7 6.68 12.2 0.56 83.64
2000-05 33.91 22.35 9.7 6.53 12.11 0.48 85.08
2005-06 34.19 33.56 10.33 4.84 13.88 0.48 97.28
2006-07 38.54 34.22 10.83 6.07 15.1 0.7 105.46
2007-08 38.36 36.9 12.04 6.1 15.54 0.65 109.59
2008-09 42.96 45.91 11.65 5.22 15.19 0.42 121.35
2009-10 46.08 50.51 13.55 6.6 18.11 0.65 135.5
2010-11 63.63 53.32 20.76 4.47 25.92 0.94 169.04
Financial performance of state owned enterprises in emerging economies | 12
Appendix G
Year Passengers carried Passengers Kilometers Tones of freight carried Persons employed
millions millions millions millions
2008-9 82.5 25701 6.9 0.085
2009-10 74.9 23522 5.8 0.083
2010-11 64.9 20619 2.6 0.082
Appendix H - HRM Statistics* Pakistan Railways
Key Statistics Pakistan Railways (year book 2009-11)
Employee Education Analysis
Intermediate Stream Graduation Stream Post Graduate Stream
Type % Type % Type %
Science 24 Technical 14 Technical 3
Arts 36 Non-technical 33 Non-technical 17
Commerce 7 Non-graduate 53 Non-post graduate 80
Below Inter 33
Tenure Analysis Computer Skills Analysis Continuous Professional Education
Tenure % Type % Type %
Years Operating System 15 Departmental courses 65
1 to 5 4 Programming languages 5 Management courses 5
6 to 15 15 Spread sheet 13 Other courses 10
16 to 25 56 Word processor 13 Nil 20
>25 25 Data base 5
Nil 49
* based on a sample of 1500 employees
13 | Financial performance of state owned enterprises in emerging economies
Acknowledgements
The researchers would like to thank The Chartered Institute of Management Accountants (CIMA) General Charitable Trust Fund for funding this project. We would also like to thank Susan Kendal, CIMA Projects Specialist, and Mathew Tsamenyi, Professor of Accounting, Birmingham Business School, for their assistance.
References
Ministry of Railways, Government of Pakistan (2000-11), Appropriation Accounts of Pakistan Railways, Islamabad
Ministry of Railways, Government of Pakistan (2010-11), Year Book, Islamabad
Auditor General of Pakistan (2008-11), Audit Reports on the accounts of Pakistan Railways, Islamabad
Ministry of Finance, Government of Pakistan (2009-11), Economic Surveys of Pakistan, Islamabad
Pakistan Railways (1952), Pakistan Railways Code for the Accounts Department, Lahore
Pakistan Railways (1955), Pakistan Railways Code for the Mechanical Department (Workshops), Lahore
Pakistan Railways (1952), Pakistan Railways Code for the Stores Department, Lahore
Pakistan Railways (1939), Pakistan Railways Code for the Traffic Department (Commercial), Lahore

ISSN 1744 70389
Chartered Institute of Management Accountants 26 Chapter Street London SW1P 4NP United Kingdom T. +44 (0)20 7663 5441 E. [email protected] www.cimaglobal.com
© May 2012, Chartered Institute of Management Accountants