financial pacific - mobile remain a key opportunity, google (third party)
DESCRIPTION
Visit our website for more information: http://www.investingpacific.com/Financial Pacific: “The Right Wave to Invest”In today’s global economy it is important to be fully aware of the intricacies of international investments and the opportunities that these have to offer. Financial Pacific offers proven overseas investment opportunities.If you are interested in a reliable investment institution look no further because Financial Pacific provides: Wealth Management, Online Trading, Institutional Services and Corporate Finance. With cutting edge technology we are capable to support highly specialized derivatives instruments such as: CFDs, ETFs, CFDs on Commodities, ETCs, Futures and Options. In addition investors have access to a wide range of investment opportunities through: Structured Notes, Fixed Income, Reverse Convertibles, Preferred Stocks, and Institutional Hedge Funds.Fully regulated by Comisión Nacional de Valores de Panama since 2003; allow us to provide you with the necessary tools to take advantage of the global markets.TRANSCRIPT
UBS Investment Research
Morning Expresso - United States
Monday 27 June 2011
Global Equity Research
Americas
Equity Strategy
Market Comment
27 June 2011
www.ubs.com/investmentresearch
U.S. Equity Product Management
212-713-2400
Morning Expresso
This report has been prepared by UBS Securities LLC ANALYST CERTIFICATION AND REQUIRED DISCLOSURES BEGIN ON PAGE 28. UBS does and seeks to do business with companies covered in its research reports. As a result, investors should be aware that the firm may have a conflict of interest that could affect the objectivity of this report. Investors should consider this report as only a single factor in making their investment decision.
ab
Morning Expresso - United States 27 June 2011
UBS 2
Morning Meeting Agenda Key Call: Google Inc. Rating: Buy Target: US$765.00 Price: US$480.22 RIC: GOOG.O Prior: Unchanged Prior: Unchanged Mkt Cap: US$115bn BBG: GOOG US
Internet Services Analyst: Brian Pitz Tel: +1-212-713 9310
Positive on Key Call GOOG; Reiterate Buy Stock remains under pressure, despite the positive fundamentals While the FTC specter has been a 2011 overhang, we believe near-term
weakness reflects pressure from the (mid-May) Panda update -- while improving relevancy and the user experience over time (deemphasizing sites that solely aggregate content), the changes may pressure some near-term AdSense Network revenue. Note, Google makes constant refinements to the listing / ranking process, and the most recent (Jun 16) ‘Panda 2.2’ update has seen some affiliates recoup traffic.
Our proprietary Product Image Ad data shows accelerating growth Our proprietary analysis of 100K+ commercial keywords (p. 3-5) indicates that 19% of all search results had a Product Image Ad; significant growth from 10-11% in the previous 3-4 qtrs. We believe the format has 40-50% higher click-thru rates vs. text ads (and they are CPA-based); the effect is similar to increasing ARPU.
Mobile remain a key opportunity, while search innovation continues… Mobile search traffic is up 5x in the past two years, a similar trajectory to the early days of the desktop. AdMob now sees ~2.7B+ mobile ad requests / day, up from ~2B in Jan. Our proprietary data suggests volume at AdMob is on track to grow ~120% Y/Y in 2011 ( p. 6-7). Android is seeing 400K+ activations daily, up from 300K in Dec, making it the #1 OS with 34% share. Also, GOOG recently unveiled positive innovations, such as Instant Pages, which saves ~2-5 secs / search by pre-fetching data from top results, rendering sites nearly instantaneously when clicked.
Valuation: UBS 2012 est PE (ex-cash) of ~9x an attractive entry point Our $765 PT is based on our DCF (12% WACC, 3.5% LTGR). Disclosure: Options, structured derivative products and futures are not suitable for all investors, and trading in these instruments is considered risky
and may be appropriate only for sophisticated investors. Past performance is not necessarily indicative of future results. Various theoretical explanations of the risks associated with these instruments have been published. Prior to buying or selling an option, and for the complete risks relating to options, you must receive a copy of "The Characteristics and Risks of Standardized Options." You may read the document at http://www.optionsclearing.com/about/publications/character-risks.jsp #or ask your salesperson for a copy.
Source: The content presented above reflects a front page summary of UBS Research content, UBS estimates based on a share price of US$480.22 on 26 Jun 2011 19:24 EDT
Endo Rating: Buy Target: US$50.00 Price: US$38.63 RIC: ENDP.O Prior: Unchanged Prior: Unchanged Mkt Cap: US$4.49bn BBG: ENDP US
Pharmaceuticals Analyst: Marc Goodman Tel: +1-212-713 1342
Why Endo is Our Top 2H11 Pick What’s new? We detail key catalysts and why Endo is our top 2H11 pick We have been increasingly positive on Endo over the past yr as mgt. has
continued to successfully diversify the business away from Lidoderm (now 25% of 2012E revenue). We see the approval of Opana TRF (12/13/2011 PDUFA), a positive claim construction ruling on Lidoderm (potentially Aug.), low expectations around Axomadol PIIb data (mid-year) and the early closing (and thus higher guidance) and continued execution of the AMS acquisition as positive upcoming catalysts.
Our takeaway: AMS is a strong deal; Lidoderm claim construction key Our deep dive of AMS (inside) suggests that it is a top medtech asset, with best-in-class products and market share (~80% or higher) to back it up. We have raised our 2011E EPS by $0.08 to account for the early closing. We believe 5-6% growth is conservative and anything higher is upside to our model. On Lidoderm, our lawyers expect Endo will win the key claim at issue and thus ultimately the case.
Thoughts on the stock: Under-appreciation creates opportunity With many investors seeing either risk (Lidoderm) or remaining skeptical of the new unfamiliar medtech assets, our DCF suggests the stock is implying a -9% terminal growth rate. We believe as mgt. continues to execute on the base biz, investors take the time to become familiar with key assets such as AMS and risks (e.g., Lidoderm, Opana TRF approval) are overcome, there will be significant multiple expansion in ENDP driving shares higher into next year.
Valuation: We maintain our Buy rating and PT of $50 We apply a 9x P/E multiple to our 2012E EPS of $5.60. Source: The content presented above reflects a front page summary of UBS Research content, UBS estimates based on a share price of US$38.63 on 24 Jun 2011 19:40 EDT
Apollo Group Rating: Neutral Target: US$42.00 Price: US$42.46 RIC: APOL.O Prior: Unchanged Prior: Unchanged Mkt Cap: US$6.26bn BBG: APOL US
Consumer Services Analyst: Ariel Sokol Tel: +1-212-713 8450
Q3 Preview: Very Cautious As 4Q Starts Guidance Could Disappoint Earnings on Thursday; Expecting Q3 EPS beat but weak starts the issue Expecting Q3 EPS beat (UBS $1.41 vs. consensus $1.34). However, we
believe Q4 starts guidance could fall below investor estimates of a 25-30% YoY decline (UBS: down 36% with further downside risk). In our opinion, Q4 starts guidance is more meaningful to investors because it provides insight as to the 1) inflection point of future new start growth (management guided to some point in 2012); and 2) magnitude of 2013 EPS decline (consensus $3.07 vs. UBS $2.78). 3Q11 results June 30th AMC. CC 5PM ET (877-292-6888 code: 71264066).
Industry trends deteriorating; Further company challenges as well We think the Street assumes easier YoY comps in 4Q11 (starts down 10% 4Q10 vs. up 8% 3Q10), but does not appreciate deteriorating industry trends. Stakeholders suggested to us that industry start trends remain weak, and have in some cases worsened over the past several months (driven by increased competition and changing consumer behaviour). Compensation plan could weigh on enrollment counsellor productivity, while compliance with 90/10 potentially limits associate starts.
Sell July $44 call, consider buying July $42-$38 put spread Options imply 9% earnings reaction vs. UBS view of down 5-10%. Consider selling July $44 call and also buying July $42/$38 put spread ($1.97/$0.65, respectively).
Valuation: Maintain Neutral rating with a $42 price target We base our valuation by applying a 15x multiple to our FY13 estimated EPS. Source: The content presented above reflects a front page summary of UBS Research content, UBS estimates based on a share price of US$42.46 on 23 Jun 2011 19:43 EDT
Morning Expresso - United States 27 June 2011
UBS 3
US Brokers and Universal Banks
Diversified Financial Analyst: William Tanona, CFA Tel: +1-212-713 2325
Agreement on Moderate SIFI Buffer Basel Committee announces SIFI buffer of 100 to 250 bps The Basel Committee announced Saturday that the capital buffer for SIFIs
(“Systemically Important Financial Institutions”) will range from 100 to 250 bps (an additional 100 bps could be applied to banks that materially increase their global systemic importance). According to press reports, the buffer will apply to up to 8 US banks and as many as 30 banks globally.
Requirements are largely in line with our expectations We view this announcement positively, as it relieves fears over more severe requirements. We believe the additional 100 bps surcharge may have been included to satisfy regulators who were pressing for higher requirements, and we expect the effectiveness of such an additional buffer will be dependent upon the details of how it will be enforced.
Building additional capital takes time, but implementation is gradual The capital requirements will be phased in along with Basel III requirements, becoming fully effective in Jan. 2019. We estimate that adding 1% point to Tier 1 common ratios (on a Basel III basis) requires the retention of nearly a year of earnings for companies in our coverage (88% of 2012 estimates on average).
Sector is attractive, see significant upside potential over next few years While the sector is not without its challenges, we believe the stocks have compelling risk/reward tradeoffs and we see significant upside in the group longer-term as we expect improving results to drive higher book value growth and an improvement in sector valuations. The group trades at 0.9x TBV, which we view as attractive given the potential to generate 13% ROTE, on average, in 2012.
Notes:
Source: The content presented above reflects a front page summary of UBS Research content, UBS commentary as at 26 June 2011
Hansen Natural Rating: Buy Target: US$90.00 Price: US$77.96 RIC: HANS.O Prior: Unchanged Prior: US$75.00 Mkt Cap: US$7.30bn BBG: HANS US
Soft Drinks Analyst: Kaumil S. Gajrawala Tel: +1-212-713 9318
Still See Upside Raising Price Target and Longer-Term Estimates on Margin Benefits We are raising our price target to $90 (from $75), or 24.5x our new FY’12
EPS estimate of $3.66 (from $3.57). Given Hansen’s margin performance in the face of previous adverse commodity environment, and with no large sponsorship deals in the immediate future, we believe the company’s margins are not in significant jeopardy. We are reducing our 2011 gross margin erosion estimate from 160bps to 80bps.
Opportunities Being Overlooked or Underappreciated In this note we highlight five areas of potential upside that seem to be underappreciated by the marketplace: 1) US is far from a mature market, with distribution opportunities and new product sales; 2) cost inflation concerns seem overstated as company margins have held in similar inflationary periods; 3) Hansen’s growth has come without improvements to their key demographics; 4) we estimate a more efficient capital structure could add immediate accretion of $0.21 to 2011E EPS; and 5) despite the run, valuation does not look expensive, on par with KO at roughly 12.5x forward EV/EBITDA.
International Thesis Remains Intact While not the focus of this note, we still believe the Int’l rollout is progressing well (reported +92.6% for 1Q), and are estimating 40% growth for the remainder of 2011. This growth implies Monster gains 1pp of share in its Int’l markets in ‘11.
Valuation: Increasing Price Target to $90; Reiterate Buy We are increasing our price target to $90 from $75. Our price target is derived from 15.0x our ‘12 EBITDA estimate of $526m, and is supported by our DCF analysis.
Source: The content presented above reflects a front page summary of UBS Research content, UBS estimates based on a share price of US$77.96 on 24 Jun 2011 16:13 EDT
Option Strategy: Lilly (Eli) & Co.
Strategist: Mitchell S. Revsine Tel: +1-212-713 1416
Not Expecting Much From Analyst Day Shares may lose ground without significant announcement on 6/30 Analyst Marc Goodman wrote in his 6/2 note: Over the last 2 months, we
believe LLY has run in part due to anticipation of an analyst day announcement such as a significant cut to R&D or change in M&A strategy. We do not believe there will be any change announced and expect the CEO to reiterate the current strategy of R&D focus to replace patent losses. Without such an announcement or change in strategic focus, we would expect the stock to give back some of the recent run-up.
Focus on July maturity as longer-term bearish positioning poses risks While we expect management to reiterate their current strategy on 6/30 to the disappointment of some investors who believe value can be unlocked via strategic changes, it is possible over time that management changes their view. Additionally we note shares appear cheap, trading at 8.6x UBS 2011 EPS vs. 10x for the peer group. This valuation, along with a dividend yield of 5.3%, may not only limit downside but also help shares rally in the event of future positive catalysts.
Buy July $36-35 1x1 or 1x2 put spread for $0.21/$0.06 respectively Given the trade is intended to capture a modest stock decline (3-5%), investors may wish to reduce the cost of the $36/$35 put spread. Investors who may be comfortable getting long at $34.06 due to potential future catalysts, cheap valuation and dividend yield, can consider selling an additional $35 put (for $0.15, note $36 put costs $0.36). We do not advocate selling calls beyond July based on the upside risks outlined above. Prices as of 6/24 close, exclude fees/commissions, LLY 6/24 close price is $36.76.
Disclosure: Options, structured derivative products and futures are not suitable for all investors, and trading in these instruments is considered risky and may be appropriate only for sophisticated investors. Past performance is not necessarily indicative of future results. Various theoretical explanations of the risks associated with these instruments have been published. Prior to buying or selling an option, and for the complete risks relating to options, you must receive a copy of "The Characteristics and Risks of Standardized Options." You may read the document at http://www.optionsclearing.com/about/publications/character-risks.jsp or ask your salesperson for a copy.
Source: The content presented above reflects a front page summary of UBS Research content, UBS commentary as at 26 June 2011
Morning Expresso - United States 27 June 2011
UBS 4
Buying Growth — 2011 Update
Strategist: Thomas M. Doerflinger, Ph.D. Tel: +1-212-713 2540
Forty-four M&A Candidates Six Forces Driving an Increase in M&A Activity They have changed little since our Sept. 2010 report on this topic: 1) Firms’ organic growth is
impeded by a secular slowdown in nominal GDP, prompting them to “buy growth” via M&A. 2) Firms have strong balance sheets and ample cash. 3) Interest rates are low. 4) Corporate profitability is high by historical standards. 5) Stocks are inexpensive. 6) With capacity utilization still fairly low, it often makes more sense to buy than build.
Who’s Next? We Ask the Analysts We asked UBS U.S. equity analysts which companies were plausible candidates for acquisition, as well as the likely buyers and the rationale for the deal. The results of our query are shown in Tables 1 and 3. Of the 55 stocks featured in our previous two reports on M&A, five have already been acquired and a number of other deals were in line with UBS forecasts.
M&A Is Bullish for Small and Mid-Cap Stocks The median market cap of the 44 acquisition candidates is $2.8 billion, and 30 have market caps of less than $5 billion. With many large firms “buying growth” in the stock market, deal activity should support the valuations of small and mid-cap stocks over the next few years.
List of forty-four M&A candidates Based on discussions with our analysts, we’ve updated our list of M&A candidates to now include forty-four names.
Notes:
Source: The content presented above reflects a front page summary of UBS Research content, UBS commentary as at 27 June 2011
US Daily Economic Comment
Economist: Maury N. Harris Tel: +1-212-713 2472
Decent ISM and jump in PHSI forecast Preview: Slower May consumption, moderate price increases, Dallas Fed (1) Consumption likely slowed in May (UBSe 0.0%, cons 0.1%),
dragged down by the auto component, while income probably rose solidly (UBSe 0.3%, cons 0.4%). We forecast a 0.2% rise in core PCE prices (cons 0.2%). A 0.3%m/m reading is possible, given the uptick in financial services prices that was reported in Q1 GDP revisions. (2) The Dallas Fed’s manufacturing survey for June will be released.
The week ahead: ISM est 52.5, pending regional reports. PHSI to jump. The manufacturing ISM index for June will be the major focus. We expect a modest decline to 52.5 from 53.5. Regional manufacturing measures fell to relatively lower levels but have been understating strength for some time. Actual output data through May have not suggested the same degree of deterioration. However, regional surveys reported ahead of the ISM may give reason to alter our forecast. Consumer confidence measures (Jun) probably rose marginally to still low levels. Last week’s housing data hinted at stabilization, and we expect a continuation of that theme, with a surge in the pending home sales index (May) and only a slim decline in SP/CS home prices (Apr).
Review: Capex re-acceleration in May, Q1 GDP little revised (1) Durable goods orders rose 1.9%m/m in May (cons & UBSe 1.5%, after -2.7%). Details were strong: Apr orders were generally revised up, and all broad categories of orders improved in May. Orders for nondefense capital goods ex air (capex) jumped 1.6% after -0.8%. This was a solid report, indicating resilience. Capex orders have risen at an 18.1% annual rate so far in Q2, accelerating from a 0.9% pace in Q1, and shipments have picked up to a 7.5% pace from +3.9%. Durables inventories (+1.2%m/m) continued to rise, which may, at least temporarily, assuage fears of an inventory correction. (2) Real GDP growth was revised up minimally to a 1.9% annual rate from 1.8% pace.
Notes:
Source: The content presented above reflects a front page summary of UBS Research content, UBS commentary as at 24 June 2011
Morning Expresso - United States 27 June 2011
UBS 5
MACRO AND STRATEGY RESEARCH
UBS Client Flow Watch
Strategist: Thomas M. Doerflinger, Ph.D. Tel: +1-212-713 2540
US clients net selling US Client Flow: Still net selling domestic and foreign equities Both US long-only and hedge funds reduced their net selling of US equities, but
overall, US clients continue to be net sellers. Only US corporate clients are net buying. Overseas, US hedge funds were the only client segment net selling, counterbalancing increased net buying by long-only funds, intermediaries, and corporate clients (Table 6).
Sector details of Client Flow: Turning net buyers of tech Both US and foreign clients turned net buyers of US technology. US clients turned net buyers of telecoms both domestically and overseas.
Foreign Client Flow: Sector sea change Foreign clients went from net sellers to net buyers in US materials, energy, healthcare, industrials, and technology and from net buyers to net sellers in US telecoms and utilities.
Source: The content presented above reflects a front page summary of UBS Research content, UBS commentary as at 24 June 2011
Macro Keys
Economist: Larry Hatheway Tel: +44-20-7568 4053 Why profits may be the longest surprise
The next few weeks are filled with key dates. On June 28 or possibly June 30, the Greek parliament will vote on the latest austerity package. Although we expect parliament will approve, recent political defections suggest an uncomfortably close outcome. On Friday July 1 the focus will be on the US manufacturing ISM report, where our US economists expect a further decline to 52.5 from 53.5. The following Friday (July 8) brings the US June employment report. If private sector payrolls don’t rebound from May’s anaemic 83K gain, investors are likely to be unnerved about the prospect of a more prolonged ‘soft patch’, if not outright stagnation. Lastly, on July 12 the US Q2 earnings season unofficially kicks off.
Regular readers will know that we have adopted a cautious tactical stance on markets. We remain wary of ‘buying dips’, given the considerable uncertainties about Greece and the incoming macroeconomic data.
But our near-term caution sits uncomfortably with our more constructive view on risk assets—and in particular global equities—over longer investment horizons. Valuations are one reason. The other is corporate earnings.
The latter may come as a surprise, given that earnings have already posted strong gains over the past two years and many observers are calling for a peaking of corporate profit margins. If that is right, positive earnings surprises will be harder to achieve. Also, if history is any guide, when margins peak, they roll over quickly and begin to decline.
All of which brings us to the five most dangerous words in investing—this time may be different. To see why, look at the chart on the following page. It plots US profit share in GDP on the right-hand axis and the ‘employment gap’ on the left-hand
axis. The ‘employment gap’ is simply the difference between the US natural rate of unemployment and the actual rate of unemployment. It measures, in other words cyclical slack in the US labor market. The more negative the gap, the higher the rate of cyclical joblessness.
It is pretty clear from the two lines that as the observed unemployment rate converges on the natural rate, profits rise as a share of GDP. But as soon as the observed unemployment rate falls below the natural rate (the ‘employment gap’ turns positive), profit share in GDP peaks and starts to decline.
The reasoning is pretty simple. Early in recoveries, when there is plenty of slack in the labour market, profits rise faster than sales (margins expand), as firms enjoy rising revenues without corresponding large increases in costs. In short, early in recoveries the benefits of rising cyclical productivity flow disproportionately to the bottom line.
Source: The content presented above reflects a front page summary of UBS Research content, UBS commentary as at 27 June 2011
Global Emerging Markets Fund Flows
Strategist: Nicholas Smithie Tel: +1-212-713 8679
Outflows from GEM continue Selling worsens in EMEA, LatAm Total GEM funds experienced net outflows of approximately $144 million for the four weeks ending 22nd June
2011. Three of the past four weeks exhibited net selling. These outflows were driven by the withdrawal of $251 million from EMEA and another $96 million from LatAm. Dedicated GEM funds saw inflow of $154mn. Asia ex JP also saw inflows, although small at $50 million.
ETF flows were positive Despite net outflows, ETF flows were actually positive on a 4-WMA basis. ETFs saw inflows of $136 million compared to outflows of $280 million in Non-ETF flows. ETF flow typically makes up 40% of total flow in this dataset.
Money flows out from Peru, gain for Taiwan and Mexico We also look at the biggest movers within the geographical focused funds. The top five destinations for inflows over the past week (as a percent of AUM) were Taiwan, Mexico, Egypt, Philippines and GEM. The biggest net losers of funds were Peru, South Africa, Thailand, Chile and Russia.
Net selling year to date compared to strong inflows last year Total GEM fund flows year to date amount to a withdrawal of $9.0 billion of funds. This compares to total inflows of $84.1 billion into GEM in 2010. On a cumulative basis over $160bn has flowed into GEM funds since January 2006.
Notes: Source: The content presented above reflects a front page summary of UBS Research content, UBS commentary as at 24 June 2011
Morning Expresso - United States 27 June 2011
UBS 6
US Economic Perspectives
Economist: Maury N. Harris Tel: +1-212-713 2472
A Durable(s) Recovery? Goodbye QE The FOMC put an end to QE2 and, with disinflationary pressures having faded, appeared unlikely to engage in further large scale asset
purchases. H1 growth has been disappointing, but the FOMC continues to expect re-acceleration in H2. Higher central tendency forecasts for both unemployment and inflation may complicate the Fed’s policymaking.
Oil: A sheen of support Energy prices weighed on activity earlier this year, and the recent decline in oil prices is a welcome respite. Still, oil prices remain above the $85/bbl we have been expecting for 2011; the decline does not warrant a change to our growth outlook.
The past week The durable goods report indicated strong capex orders so far in Q2, notwithstanding the recent softening in manufacturing surveys. Housing data hinted at a trough in prices and sales. Q1 real GDP growth was revised up minimally. The CBO estimated further deterioration in the long-term Federal fiscal outlook. Separately, negotiations about the budget and debt ceiling stalled.
The week ahead The manufacturing ISM index for June will be the major focus. We expect a modest decline to 52.5 from 53.5. Regional manufacturing measures fell more sharply but have been underestimating strength for some time. Actual output data through May have not suggested the same degree of deterioration. Even so, a number of regional surveys will be reported ahead of the ISM and may give reason to alter our forecast. Consumer confidence measures (June) probably rose marginally, albeit to still low levels. Last week’s housing data hinted at stabilization, and we expect a continuation of that theme, with a surge in the pending home sales index (May) and only a slim decline in the SP/CS home price index (April). Construction spending probably was little changed in May.
Notes: Source: The content presented above reflects a front page summary of UBS Research content, UBS commentary as at 24 June 2011
Morning Expresso - United States 27 June 2011
UBS 7
GLOBAL SECTOR RESEARCH UBS Global I/O®: Cement
Building Materials Analyst: Gregor Kuglitsch Tel: +44-20-7567 3553
Consolidation and pricing resilience Input: local market analysis of major cement markets The recession has led to significant drops in utilisation in a number of countries, especially in
Western Europe and the US; more consolidated markets have shown considerably more resilient pricing and profitability than equivalent fragmented markets. Examples include a significantly better resilience in the UK and France compared to Italy, Spain and the US despite similar falls in utilisation levels. In our view, this is due to the level of consolidation and the major share of global players.
Output: China should benefit from consolidation unlike e.g. India China should see a significant benefit from consolidation as the number of players is decreasing significantly, increasing the market share of leading players and resulting in enhanced pricing power. India suffers from higher capacity additions from smaller players (outside the top-5) which have the potential to destabilise pricing balances and lower utilisation. South Africa, Morocco and Egypt are all seeing new entrants to the market place.
Stock implications As a result of the expected consolidation we favour the Chinese domestic players Anhui Conch (B, Rmb46.45); CNBM (B, HK$27) and Huaxin (B, Rmb48). We like the exposure to the consolidated markets in Indonesia (Gresik, B Rp11,300) and Taiwan (Asia Cement, B NT$42). As a result of likely further fragmentation we are more cautious on the Indian domestic players ACC (S, Rs 960), Ambuja (S, Rs130), India Cement (S, Rs86) and Ultratech (S, Rs1020) and PPC (Sell, RCnt 2500) in South Africa, From the global majors we favour HeidelbergCement (B, €58) over Cemex (N; P11.50), Lafarge (N, €50) and Holcim (N, CH70).
Notes: Source: The content presented above reflects a front page summary of UBS Research content, UBS commentary as at 27 June 2011
UBS Global I/O®: Technology patent battle
Technology Hardware & Equipment Analyst: Arthur Hsieh Tel: +886-2-8722 7348
Impact from Apple’s multi-touch patent Input: Apple received multi-touch patent The US Patent and Trademark office (USPTO) has granted Apple patent rights covering multi-touch
activity without affecting other contents on the display. The multi-touch function is implemented across different applications in the portable devices which could potentially give Apple more control on the ownership of the capacitive multi-touch interface as per media reports.
Increasing uncertainties, but too early to conclude We point out that not all applications may be using the same gesture or potentially not even violate the patent. Google and Microsoft may find work-around solutions in their mobile operating systems to avoid any infringement. Meanwhile, we believe most handsets OEMs have asked the major semiconductor vendors to provide patent indemnification when they designed touch-based user interface.
Collecting royalty is not Apple’s business model While investors are worried about Apple’s potential legal war against rivals, we believe the patents on multi-touch (and more generally) are more for defensive purposes. We believe Apple's core focus is to sell hardware with initiatives such as creating new services (iCloud) and content access (iTunes, App Store, iBook store, etc) to maintain its consumer loyalty and help drive further hardware sales.
Output: Buy TPK, Apple, Samsung, HTC, MMI, Atmel and Cypress With all potential uncertainties, we believe companies with high Apple smartphone exposure such as TPK should be relatively safe. We also remain positive on Apple, Samsung, HTC, Motorola Mobility Holding Inc (MMI), Atmel, and Cypress.
Notes:
Source: The content presented above reflects a front page summary of UBS Research content, UBS commentary as at 27 June 2011
Morning Expresso - United States 27 June 2011
UBS 8
BASIC MATERIALS LyondellBasell Rating: Buy Target: US$47.00 Price: US$37.58 RIC: LYB.N Prior: Unchanged Prior: Unchanged Mkt Cap: US$21.3bn BBG: LYB UN
Chemicals, Specialty Analyst: Andrew W. Cash Tel: +1-212-713 2210
Another round of FY EPS cuts Weakening spot market plastic is now expected to impact contract prices Weakness in the Asian market back in early May appeared in the US
spot market in mid May. With our most recent channel checks in hand we now expect weakness in the mainstream contract market. A leading consultant is reporting a 3 ¢ decline in the per pound price of LLDPE from 80 ¢ to 77 ¢, with another 3 ¢ drop in July. See Tables 1-3 for changes in key assumptions to our LYB model.
We currently forecast that ethylene margins soften the impact Given the sour sentiment within the plastic selling channel we are inclined to make a bigger cut to our margins. At the present time, however, the ethylene margins are holding up rather well despite the weakness in downstream derivative products. In fact, we have increased our 2Q11 EPS estimate to reflect this. However, for 3Q and 4Q the weakness in downstream products will likely over-power the potential benefit from an integrated and fairly flexible ethylene position.
Hiccup or longer term softness? In adjusting our EPS estimates as shown in the table to the right we are beginning to worry that a portion of the weakness the industry is seeing may be of a longer term nature. Consequently, we trimmed our 2012 EPS estimate.
Valuation: intrinsic value of $47 amidst uncertainty We are maintaining our $47 target price for LyondellBasell and our Buy rating. Our target is based on our 2-stage DCF model that assumes a WACC of 8.0% and a normal EBIT of $3.0 billion (including equity income) and normal EBITDA of $3.9 billion (including equity income). The EV/ normal EBITDA est. is about 6.5x.
Notes:
Source: The content presented above reflects a front page summary of UBS Research content, UBS estimates based on a share price of US$37.58 on 24 Jun 2011 19:40 EDT
Morning Expresso - United States 27 June 2011
UBS 9
COMMUNICATION Dice Holdings Rating: Neutral Target: US$14.00 Price: US$13.51 RIC: DHX.N Prior: Unchanged Prior: US$19.00 Mkt Cap: US$0.88bn BBG: DHX US
Internet Services Analyst: John Janedis, CFA Tel: +1-212-713 1064
Tweaking ‘12 Estimates Moderating Estimates in Outer Years We continue to favour Dice’s vertical business model and expect it to post reported EBITDA growth of over
40% in 2011. However, we are tempering our growth estimates for 2012+ largely to reflect a more normalized growth rate, particularly in the financed vertical and we are lowering our price target to $14.
Tweaking 2012 Growth Estimates We are modestly lowering our ‘12 growth expectations for each segment, and now forecast revenue growth of 16%/10%/21% for the Tech/Finance/Energy segments, respectively vs. previous estimates of 17%/16%/26%, respectively. Postings in the financials vertical have slowed recently and checks suggest 2012 recruitment budgets, while still strong, could slow somewhat due to a business slowdown for the category. Our ‘12 total EBITDA est is now $82.3M vs. our prior est of $85.3M.
2Q / 2011 Estimates Unchanged We are maintaining our 2Q estimates which are in line with guidance. We forecast revenue of $43.5M (FC: $43.6M, guidance $43.5M); adjusted EBITDA of $17.5M (FC: $17.2M, guidance $17M); and EPS of $0.11 (FC: $0.10, implied guidance $0.10). Our 2011 revenue/EBITDA/EPS ests are also unchanged and roughly in line with guidance at $177M (FC: $177M)/$69M (FC: $73M)/$0.47 (FC: $0.48).
Valuation: Lowering Price Target to $14 Our new $14 price target (was $19) is based on EPS and EBITDA multiples of 24x and 11.5x on our 2012 estimates, respectively. DHX is currently trading at 23.4x and 10.8x our ’12 EPS and EBITDA estimates. We maintain our Neutral rating.
Notes: Source: The content presented above reflects a front page summary of UBS Research content, UBS estimates based on a share price of US$13.51 on 24 Jun 2011 14:42 EDT
Janedis’ Media Matters
Entertainment Analyst: John Janedis, CFA Tel: +1-212 713 1064
Reading Gannett’s Tea Leaves What’s New? What the Job Cuts Mean to Estimates Last week’s announcement by GCI that it would be laying off ~700 employees (we assume
$40-$50M in cost savings) should not have come as a complete surprise (though the furloughs are) given rev. trends and our belief that management would like to keep margins flat in the publishing segment. As recent as early May, GCI’s 10Q indicated that total co. expenses would be flat this year. Given our expectation of softer revs, our model had already assumed a 2.2% decline in expenses for ’11. Our $2.06 ’11 EPS estimate is unchanged (FC: $2.20). Top picks: CBS, VIA, IPG.
Trend Watching in Print After being up 6% through June 17th, pages at the WSJ were down 16% last week, with 5 of 6 publishing days down on a y/y basis. Google remains the 2nd largest advertiser at NYT in June, with more pages than the entire nat’l auto category.
New York Times Linage -6% in June; WSJ -1% June, linage at NYT is -7% with nat’l auto -15%, dept. stores flat, telco -58%, banks/financials -7%, tech +219% (Google/Acer) and movies -17%. Classifieds are -12%, with h/w +17%, r/e -19%, and auto -9%. June linage at the WSJ is -1% on a same days basis (+17% comp) vs. May +8% (+7% comp), April flat (+22% comp).
Valuation Large-cap media is trading at 7.8x our FTM EBITDA vs. 7.7x last week; mid-cap is trading at 9.4x vs. 9.2x; advertising is trading at 6.8x vs. 6.7x; online recruitment is trading at 9.3x vs. 8.9x; and publishing is trading at 4.4x vs. 4.5x.
Notes: Source: The content presented above reflects a front page summary of UBS Research content, UBS commentary as at 27 June 2011
Morning Expresso - United States 27 June 2011
UBS 10
CONSUMER Philip Morris Int'l Rating: Neutral Target: US$66.50 Price: US$66.17 RIC: PM.N Prior: Unchanged Prior: Unchanged Mkt Cap: US$120bn BBG: PM US
Tobacco Analyst: Jonathan Leinster Tel: +44-20-7568 4982
PMI issues statement of claim PMI initiates potential legal action PMI has now served a notice of claim against the Australian government under a bilateral ‘free trade’ treaty with
Hong Kong, in the event that the government enacts legislation requiring ‘plain packaging’ for tobacco products in Australia. The major players in Australian market; BAT, Imperial and PMI have always stated that they would pursue legal action so this will come as no surprise.
Claims on expropriating intellectual property rights PMI (Australia) is a subsidiary of PMI (Asia) based in Hong Kong. The claims appear to centre on the bilateral free trade treaty between HK and Australia which prevents the expropriation of PMI (Asia) investment in Australia, in this case the brand rights. PMI claims those rights will be substantially reduced by the implementation of ‘plain’ packaging. PMI also believes the legislation contravenes treaty provisions covering ‘fair and equitable treatment’ and ‘full protection and security’, and international intellectual property right obligations.
Legislation still likely The Australian government is currently expected to introduce the Bill on ‘plain packaging’ on tobacco products to the Federal parliament in winter 2011 for enactment on 1st Jan 2012 and full implementation on 1st July 2012. The impact of such legislation is unknown since it has not been implemented elsewhere in the world.
Valuation; Price target (PT) $66.5 The PT is based on VCAM, and implies a CY’11 PE 14.5x and c6.9% CFY. Notes:
Source: The content presented above reflects a front page summary of UBS Research content, UBS estimates based on a share price of US$66.17 on 26 Jun 2011 19:24 BST
Food Images
Food Products Analyst: David Palmer Tel: +1-212-713 9315
Navigating Uneven Food Inflation Staying on Course: Retail Prices March Higher According to the latest scanner data for the 4 weeks ending 6/11, overall sales growth across our
packaged food names continues to remain solid (+2% YOY), even as volume growth has weakened a bit. Food stocks are up an average of 16% year-to-date, which makes sense given that we have reached the price pass-through point of the food inflation cycle. However, fortunes seem to be diverging. We continue to be constructive on names such as KFT, HNZ, CAG and K.
Kraft: Gaining Momentum We are raising Kraft’s FY11e EPS from $2.20 to $2.27 (+12% YOY, $2.23 cons) and our target price to $38 from $36 to reflect accelerating top line momentum, an improving relationship between pricing and input inflation, and a currency tailwind. In our view, given: 1) Kraft’s early pricing implementation, 2) recent cost relief in some major inputs, and 3) productivity/synergy savings, the company does not seem to be as vulnerable to a reacceleration in grain-based input inflation.
Diverging Fortunes in Food It appears that companies such as ConAgra (Buy) and General Mills (Neutral) are experiencing a second wave of inflation in grain-based inputs with less of a currency boost to earnings. Meanwhile, companies like Hershey (Neutral) or Kellogg’s (Buy) seem to have strong enough brand momentum to raising prices and meet/beat EPS targets. And others, such Heinz (Buy) or Kraft (Buy), may trail Kellogg and Hershey in US sales momentum, but have aggressive pricing, cooling input costs, international business exposure, and/or productivity savings to achieve EPS goals.
Notes: Source: The content presented above reflects a front page summary of UBS Research content, UBS commentary as at 27 June 2011
Morning Expresso - United States 27 June 2011
UBS 11
ENERGY Energy Sector
Oil Companies, Major Analyst: William A. Featherston Tel: +1-212-713 9701
NYT Shale Gas Allegations Seem Exaggerated NYT article makes harsh allegations toward shale gas E&P companies Citing industry emails, public statements & analyst reports, an NYT article
alleges that natural gas producers are 1) running a “Ponzi Scheme” as shale gas economics do not work; 2) overstating EURs and understating decline rates; & 3) exaggerating shale gas resource potential. While we agree shale gas economics are certainly challenged due to low prices, we believe the story is unduly harsh, and does not address the enormous supply growth in shale gas the last few years.
We believe the article’s allegations are overstated and misleading The article did not address how shale gas development has contributed to extraordinary production and reserve growth over the past few years. In addition, we highlight that 1) the material resource potential from the gas shales are supported by studies from several independent organizations; 2) proved reserve growth is audited by independent reservoir engineers; and 3) surge in M&A in US shale gas plays attest to viability of the resource potential.
Challenged shale gas economics at current gas price levels…nothing new The allegation that shale gas economics are challenged at current price levels is certainly not new and we largely agree. With perhaps the exception of the Marcellus & core Haynesville & Fayetteville, we believe prices of $5.50-$6.00/Mcfe are required to earn attractive returns. The decline in shale gas rig count (ex- Marcellus) & shift to oily plays over the last 18 months supports this view.
We prefer oil-weighted E&Ps: Discounting $5.05/MMBtu and mid-$70/Bbl Our top E&P picks are oil-weighted APC, NBL, OXY, & APA. Notes:
Source: The content presented above reflects a front page summary of UBS Research content, UBS commentary as at 27 June 2011
Targa Resources Part Rating: Buy Target: US$38.00 Price: US$34.16 RIC: NGLS.N Prior: Unchanged Prior: US$31.00 Mkt Cap: US$2.90bn BBG: NGLS US
Pipelines Analyst: Jeremy Tonet, CFA Tel: +1-212-713 4838
Boosting PT on Favorable Outlook Ability to capitalize on favorable dynamics drives bright outlook We believe Targa enjoys a stronger NGL asset base than many peer MLPs,
allowing the partnership to capitalize on a secular upswing in energy infrastructure development. Targa’s integrated suite of midstream services differentiates NGLS from many peers that cannot offer services after the natgas processing plant tailgate. Specifically, given the tightness in the fractionation market, The partnerships significant fractionation capacity in Mont Belvieu (and ability to expand) provides a key advantage over peers.
Robust organic growth pipeline augmented by opportunistic acquisitions Relative to NGLS’ ~$3bn market cap, we believe the partnership’s ~$600mm portfolio of expansion projects will drive above average distribution growth. In addition, we expect the partnership to acquire more complimentary assets on an opportunistic basis, further boosting our growth outlook.
Raising earnings estimates and distribution growth expectations Based on our expectations that NGLS’ suite of midstream services positions the partnership to capitalize on energy infrastructure development needs, we are increasing our 2011/2012 EPU estimates to $1.60/$1.74, from $1.46/$1.41. Additionally, we now anticipate upper single digit distribution growth over the next two years, versus our prior expectations of low to mid single digit growth.
Valuation: Raising Price Target to $38 from $31 Increasing our growth assumptions and slightly reducing our discount rate due to higher coverage is driving our DDM derived price target to $38 from $31.
Notes:
Source: The content presented above reflects a front page summary of UBS Research content, UBS estimates based on a share price of US$34.16 on 24 Jun 2011 16:13 EDT
Morning Expresso - United States 27 June 2011
UBS 12
HEALTHCARE Abbott Laboratories Rating: Buy Target: US$59.00 Price: US$51.75 RIC: ABT.N Prior: Unchanged Prior: Unchanged Mkt Cap: US$80.0bn BBG: ABT US
Medical Supplies Analyst: Rajeev Jashnani, CFA Tel: +1-212-713 9127
Bardoxolone progressing to Phase 3 52-wk data confirms positive signal observed in earlier data Bardoxolone [B], which recently entered ph3 for chronic kidney disease, may be
ABT's most important pipeline drug. 52-wk ph2 data (n=227) was presented at the ERA-EDTA conference & published in NEJM on 6/24. Similar to previous data, 52-wk data showed significant improvements in eGFR vs. placebo (eGFR is a marker for kidney function). The event-driven ph3 will assess [B] w/ respect to hard clinical outcomes (onset of end-stage renal disease or cardiovascular death); data is expected in ‘13 implying ‘14-‘15 launch.
Overall, we view the 52-wk data as encouraging (Tables 1-3) eGFR improvement differentiates [B] from other CKD drugs, which only slow progression. In add’n to eGFR, improvement in other biomarkers were also observed (BUN), however, [B]-related increase in proteinuria remains an unanswered question (proteinuria is a strong prognostic indicator for CKD progression / CV events). Side effects appeared manageable. Ph2 outcomes (eg ESRD progression) were not presented, but may not be meaningful as most pts had relatively early stage 3 disease (1,600-pt ph3 will enroll sicker pts).
Market opportunity is very large if improved outcomes are shown in ph3 ABT licensed ex-US rights to [B] from Reata in 2H10 for $450M (mix of upfront + "near" upfront pymts & minority equity stake). The unmet medical need in CKD is highly substantial. ABT estimates >800k stage 4 CKD pts in W. Europe; modest 10% penetration into this pop'n yields a ≥$800M opportunity. Pricing is likely dependent on avoidance of dialysis as shown in ph3; dialysis an extremely expensive therapy associated with poor quality of life. Notably, ABT has experience in CKD through Zemplar & also has atresentan in ph2b development for CKD.
Valuation – reiterate Buy rating & $59 price target On ‘12 estimates, ABT trades at 10.4x EPS & 11% FCF yield. Our price target is derived through DCF.
Notes: Source: The content presented above reflects a front page summary of UBS Research content, UBS estimates based on a share price of US$51.75 on 24 Jun 2011 19:40 EDT
Bristol-Myers Rating: Neutral Target: US$30.00 Price: US$28.93 RIC: BMY.N Prior: Unchanged Prior: US$28.00 Mkt Cap: US$49.5bn BBG: BMY US
Pharmaceuticals Analyst: Marc Goodman Tel: +1-212-713 1342
Increasing PT and Apixaban Forecast What’s new? We have re-evaluated our Apixaban ests. post ARISTOTLE In our concurrently published note, “Apixaban Rising” we have increased
our WW forecasts for Apixaban based upon superior efficacy and safety data which Apixaban delivered versus Warfarin in the ARISTOTLE study announced on 6/22. We have built a WW patient-based model and have also conducted a survey of 25 physicians (15 cardiologists and 10 primary care) to gauge Apixaban’s uptake.
Our takeaway: Increasing WW Apixaban sales to $2.4B in 2015E We believe Apixaban can garner ~33% of the combined worldwide branded anticoagulation market (~$7.3B in est. market size) for Afib and VTE by 2015E, implying $2.4B ($2.2B risk-adj at 90%) in sales. By 2020E, we see the market growing to ~$15B with Apixaban having a 37% share. In the US, we estimate Apixaban will have ~34% share of a ~$4B 2015E market (rising to ~$8B by 2020E). See Table 1 for changes from our previous forecast.
Thoughts on the stock: Increasing PT to $30; Significant opportunity Prior to top line ARISTOTLE results, we believe consensus estimates for Apixaban were ~$1.2B in 2015E. Given the robust results, we would expect consensus to move higher throughout the summer. Our changes increase our 2015E EPS by $0.06 to $2.47 and our 2020E EPS by $0.57 to $3.43. Our 2011-2013E EPS remain unchanged as the Apixaban JV isn’t profitable until 2014E. We see the FDA panel on Dapa on 7/16 as the next key event for BMY until ESC.
Valuation: Increasing Price Target to $30 based on DCF analysis Our DCF analysis assumes a $20 for the base business and $10 for the pipeline. Source: The content presented above reflects a front page summary of UBS Research content, UBS estimates based on a share price of US$28.93 on 24 Jun 2011 19:40 EDT
Davita Rating: Buy Target: US$95.00 Price: US$84.39 RIC: DVA.N Prior: Unchanged Prior: Unchanged Mkt Cap: US$8.76bn BBG: DVA US
Healthcare Providers Analyst: Justin Lake, CFA Tel: +1-212-713 2765
FDA Releases Updated EPO Label Updated FDA label provides incremental color on EPO trajectory FDA released new EPO label which includes new Black Box warning and
dosing. That said, according to UBS biotech analyst Matt Roden, new label likely implies hemoglobin mean of ~11 g/dl (vs current 11.2 g/dL) indicating that impact on EPO dose is relatively minimal. Based on the dose-Hb dosing relationship, he estimates a qtr-gram Hb drop corresponds to ~7% lower dose, which he believes is unlikely to happen (we estimate each 1% EPO util decline = $0.03/0.5% to EPS for DVA ex price).
Next step is possible modification of QIP; potential LT AMGN contract Post FDA label, the next event here may be potential CMS modification to QIP (expected 2012). With regard to DVA-AMGN contracting, lack of clarity on FDA labeling until now likely represented the key obstacle to LT contract, with today’s release setting stage for return to typical multi-year contracts (vs more recent 6-month contract lengths). We would expect a multi-year contract to represent a positive to DVA as it would remove uncertainty & provide market with some price clarity.
UBS estimates left intact for DVA While updated FDA label may not be particularly impactful on EPO util, we see optionality here of flat-to-slightly down, w/clarity on EPO label potentially freeing DVA up for further dosing efficiencies w/regard to EPO than previously thought at Cap Markets Day. We leave our DVA estimates intact, and continue to model only modest EPO util declines in 2H’11 (-0.5% seq in Q3/Q4) and 2012 (-0.2% seq decline each qtr).
Valuation: Buy Rating, $95 Price Target Our $95 PT is based on target multiple of ~16x our FY’12 EPS estimate of $6.00. Source: The content presented above reflects a front page summary of UBS Research content, UBS estimates based on a share price of US$84.39 on 23 Jun 2011 19:43 EDT
Morning Expresso - United States 27 June 2011
UBS 13
Pfizer Rating: Buy Target: US$23.00 Price: US$20.08 RIC: PFE.N Prior: Unchanged Prior: Unchanged Mkt Cap: US$162bn BBG: PFE US
Pharmaceuticals Analyst: Marc Goodman Tel: +1-212-713 1342
Increasing Apixaban Forecast What’s new? We have re-evaluated our Apixaban ests. post ARISTOTLE In our concurrently published note, “Apixaban Rising” we have increased
our WW forecasts for Apixaban based upon superior efficacy and safety data which Apixaban delivered versus Warfarin in the ARISTOTLE study announced 6/22. We have built a WW patient based model and have also conducted a survey of 25 physicians (15 cardiologists and 10 primary care) to gauge Apixaban’s uptake.
Our takeaway: Increasing WW Apixaban sales to $2.4B in 2015E We believe Apixaban can garner ~33% of the combined worldwide branded anticoagulation market (~$7.3B in est. market size) for Afib and VTE by 2015E implying $2.4B ($2.2B risk-adj at 90%) in sales. By 2020E, we see the market growing to ~$15B with Apixaban having a 37% share. In the US, we estimate Apixaban will have ~34% share of a ~$4B 2015E market (rising to ~$8B by 2020E). See Table 9 for changes from our previous forecast.
Thoughts on the stock: Nice positive, but BMY more levered We are increasing our EPS forecasts by $0.06 to $2.62 in 2015E and by $0.08 to $3.76 in 2020E driven by higher Alliance Revs from the JV. The added Apixaban sales are worth ~$0.50 on a DCF basis. We still think PFE is undervalued based upon its strong cash flows and pipeline progress, including Apixaban, Tofacitinib, Crizotinib, Axitinib and Prevnar-13 adult. We expect regulatory approvals and communication around the strategic review in 2H to drive shares as well.
Valuation: We maintain our Buy rating and $23 PT based on our DCF The implied P/E multiple from our DCF is 10x our 2012E EPS of $2.26. Notes:
Source: The content presented above reflects a front page summary of UBS Research content, UBS estimates based on a share price of US$20.08 on 24 Jun 2011 19:40 EDT US Large Cap Pharmaceuticals
Pharmaceuticals Analyst: Marc Goodman Tel: +1-212-713 1342
Apixaban Rising What’s new? We publish our Factor Xa survey and market model We completed a survey of 25 physicians (15 cardiologists and 10 primary care)
to gauge the uptake of Pradaxa and potential market shares for Apixaban in different scenarios (superior safety, superior safety and efficacy, etc). Further, we have built both a patient and TRx-based market model for the Factor Xa market. We remain focused on detailed Apixaban data at ESC on Aug. 28 with specific interest in the details vs Warfarin and if Apixaban demonstrated a mortality benefit.
Key survey takeaways: Robust anticoagulation market & Apixaban share (1) Uptake of new agents is strong (65% of patients offered Pradaxa take it, with cost being biggest deterrent); (2) 1/3 of patients new to therapy start on Pradaxa; (3) ~15% of Afib patients are on Aspirin which physicians expect to switch to new agents; (4) Primary care physicians expect to keep more patients on Warfarin (~35%) versus cardiologists (~28%); (5) Physicians predict robust share for Apixaban in Afib (36% vs 27% for Warfarin, 25% for Pradaxa and 12% Xarelto).
Our takeaway: Increasing Apixaban 2015E sales to $2.4B We believe Apixaban can garner ~33% of the combined worldwide branded anticoagulation market (~$7.3B in est. market size) for Afib and VTE by 2015E implying $2.4B ($2.2B risk-adj at 90%) in sales. By 2020E, we see the market growing to ~$15B with Apixaban having a 37% share. In the US, we estimate Apixaban will have ~34% share of a ~$4B 2015E market (rising to ~$8B by 2020E) while J&J’s Xarelto will have ~24%, implying US 2015E sales of $975M. While we believe Apixaban will have greater 2015E share in Afib versus Xarelto (40% vs 19%), we believe Xarelto will take greater share in VTE (40% vs 15%).
Notes:
Source: The content presented above reflects a front page summary of UBS Research content, UBS commentary as at 26 June 2011
US Large Cap Pharmaceuticals
Pharmaceuticals Analyst: Marc Goodman Tel: +1-212-713 1342
More Dapa Details & Concerns at ADA What’s new? New Dapa data, incl. bladder & breast cancer imbalalnce At ADA, Bristol and AstraZeneca’s Dapagliflozin (Dapa) continued to
demonstrate robust efficacy (as previewed in the abstracts), but a new potentially concerning signal emerged. 9 out of 5,478 (0.16%) patients on Dapa were diagnosed with bladder cancer vs. 1/3,156 (0.03%) on control. However, 6/10 had blood in their urine at baseline and 5 patients were diagnosed within 1 yr from starting Dapa. Also, 9/2,223 (0.40%) women developed breast cancer vs 1/1,053 control women (0.09%). Importantly, all women were diagnosed within 1 year of starting Dapa. There was no imbalance in overall neoplasms (1.4% Dapa vs 1.3% control). Preclinical data from 2yr+ carcinogenicity studies with doses >1,000 mg/kg) did not demonstrate any signal of cancer and SGLT2 is not expressed in either the bladder or breast tissue. We expect this signal to be debated at panel.
Our takeaway: New risk for 7/19 panel, but data very mixed. Given the FDA’s safety concern (Actos, Victoza, Byetta), this signal will likely garner significant attention at panel. Nonetheless, the data presented thus far is supportive that this is just a numerical imbalance and not a signal. Specifically, (1) the fact that the tumors were diagnosed <1 year after initiation of therapy suggests it is very unlikely Dapa caused the tumors; (2) the lack of preclinical signal across ~38 different Dapa studies (Actos, Victoza and Byetta all have preclinical signals) makes causality harder to establish; (3) Dapa is highly selective for SGLT2 (poster 987-P) and SGLT2 is not expressed in the bladder or breast; (4) Dapa is a simple channel blocker, which to our knowledge, has never had a cancer associated risk. Nonetheless, we would expect this issue to raise investor skepticism around Dapa; however, with the panel less than a month away we will know FDA’s view soon.
Notes:
Source: The content presented above reflects a front page summary of UBS Research content, UBS commentary as at 27 June 2011
Morning Expresso - United States 27 June 2011
UBS 14
INDUSTRIALS U.S. Aerospace & Defense Playbook
Aerospace Analyst: David E. Strauss Tel: +1-212-713 6185
The Week Ahead What’s next for Aerospace and Defense? We will get May traffic data from IATA on Monday, which we expect to reflect mid-single digit growth given
relatively strong reports so far out of the regions. On Wednesday, we will be attending TDG’s NYC analyst day and will listen for any color on aftermarket trends during Q2 and McKechnie integration progress. SWHC will provide a read for ATK's Security & Sporting business when it reports its Q4 on Thursday. We should also get parked aircraft data early to mid-week and then used bizjets inventory data on Friday. We expect generally negative defense news flow over the near term given debt ceiling debate and as Congress marks up the FY12 appropriations bills.
Still prefer aero aftermarket Aero at a 14% premium to market is in line with similar point in prior up-cycles. We continue to favor aftermarket names over OE as we think increased utilization of out of warranty aircraft can still drive high single digit aftermarket growth in ‘11 despite high oil prices and recent capacity cuts. GR/COL/TDG are our top picks.
Risk to 2011 defense results on lower FY11-12 budgets We see risk to the companies' 2011 guidance from half-year CR and final FY11 appropriations legislation that cuts $10B in modernization funding relative to DoD request, likely followed by further cut in FY12. Valuations not overly attractive at 25% discount to market, high end of prior defense budget downturns. Our only Buy-rated defense stocks are GD/ATK.
Notes:
Source: The content presented above reflects a front page summary of UBS Research content, UBS commentary as at 27 June 2011
Morning Expresso - United States 27 June 2011
UBS 15
TECHNOLOGY Sapient Rating: Neutral Target: US$14.50 Price: US$14.03 RIC: SAPE.O Prior: Sell Prior: US$8.50 Mkt Cap: US$1.96bn BBG: SAPE US
Diversified Technology Services Analyst: Arvind Ramnani Tel: +1-212-713 3517
Upgrading to Neutral; Balanced risk/reward Upgrading SAPE to Neutral Primary reasons for our upgrade are: 1) We believe that F11 non-GAAP operating margins of 12%-14% are achievable
given pricing power (driven by strong demand for their differentiated offerings) and better pricing/utilization. 2) Solid revenue momentum (1Q revenues were up 32% y/y and 8%q/q), and a robust pipeline (in terms of number/quality of deals). 3) Strong growth driven by demand for its interactive marketing solutions.
Raising our estimates to reflect strong demand and better pricing We are raising our revenue forecast as SAPE continues to see strong demand for its services and the quality and numbers of deals continue to improve. We have increased our margin estimates due an improving pricing environment and higher utilization. However, we believe that SAPE is likely to be range bound in the term term, as it looks fully valued at current levels (28x/21x C11e/C12e EPS).
Expect multi-channel marketing solutions to drive growth We expect revenue growth to continue to be driven by demand for SAPE’s multi-channel solutions. We believe that Sapient’s Nitro business (which constitutes about 64% of overall revenues) has differentiated solution sets (i.e. interactive marketing) targeted towards the shift in traditional ad dollars to digital ad dollar.
Valuation: Raise PT to $14.50 from $8.50 We increased our ’11/’12 revenue ests from $992M/$1,149M to $1,035M/$1,231M and our ’11/’12 EPS ests from $0.44/$0.53 to $0.49/$0.68. Our new $14.50 PT is based on 20x C12e P/E (19x C11e P/E prior) and our DCF.
Notes: Source: The content presented above reflects a front page summary of UBS Research content, UBS estimates based on a share price of US$14.03 on 24 Jun 2011 15:12 EDT
Dell Rating: Buy Target: US$18.70 Price: US$15.93 RIC: DELL.O Prior: Unchanged Prior: Unchanged Mkt Cap: US$30.6bn BBG: DELL US
Computers Analyst: Maynard J. Um Tel: +1-212-713 3372
Dell Analyst Day Preview: Not Just a Shiny Box Company Anymore Expect Dell to reiterate FY12 outlook at Analyst Day on June 28/29 We expect Dell to reiterate its FY12 rev growth guidance of 5-9% y/y, provide
color on likely rev drivers, and reiterate op. inc. growth tgt of 12-18% y/y. We do not expect any explicit commentary around gross mgns though expect some commentary around business mix shift benefit & component environment. We maintain our FY12 ests of $64.3b/$1.87 which we think could prove conservative.
Focus on solutions-based offerings, which we believe are margin accretive We believe Dell will highlight the quiet transformation it is undergoing from a transactional point-product to a solutions-focused company. We expect Dell to showcase a number of solutions offerings such as InSite One, data center-in-a-box (cloud), SecureWorks, education-focused netbooks, etal that are differentiated/customized solutions, which we believe hold better margins.
Key messages likely to highlight near-term strength & long-term strategy We expect Dell to highlight generally strong demand for servers (higher ASPs), storage, & services (~30% of rev but ~50% of gross profit) as well as enterprise PCs. We expect more detail on how acquired & organic assets have positioned Dell in data center/cloud w/ key differentiators in openness (multi-vendor via Scalent acq) & simplicity. We also expect updates on M&A strategy (serial acquirer).
Valuation: Reiterate Buy Rating and $18.70 Price Target Our $18.70 price target is based on 10x our FY12 EPS estimate of $1.87. Notes:
Source: The content presented above reflects a front page summary of UBS Research content, UBS estimates based on a share price of US$15.93 on 24 Jun 2011 19:40 HKT
Juniper Networks Rating: Neutral Target: US$33.00 Price: US$30.02 RIC: JNPR.N Prior: Unchanged Prior: US$42.00 Mkt Cap: US$16.5bn BBG: JNPR US
Communications Technology Analyst: Nikos Theodosopoulos Tel: +1-212-713 3286
Lowering Estimates and Price Target 2Q Remains Challenging Our checks continue to show a more challenging qtr for JNPR with both Enterprise and SP demand lower than the
company expected entering 2Q. We believe a product transition within Switching is impacting Enterprise demand. Routing demand is relatively better, but is likely to slow following 3 very strong quarters.
New Reduced Estimates We lower our FY11/FY12 pro-forma EPS to $1.43/$1.70 (vs. prior $1.46/$1.80) and 2011-12 sales growth to 15.5% (prior ~18%). We believe JNPR sales growth will decelerate through 2011 to ~10% YoY growth in 4Q11, and re-accelerate in 1Q12 reaching ~20% by 4Q12 as new product revs become more material in 2H12.
Stock Reflecting CEO Comments Earlier this Month JNPR stock is down over 20% since the CEO commented that 2Q is a backend loaded qtr at an investor conference earlier in June. While the stock is discounting a difficult 2Q in our view, we do not believe business materially improved since the CEO’s comments. While the long term growth story of product innovation remains intact, we do not expect the stock to react positively to 2Q results.
Valuation – Maintain Neutral, Lower Target to $33 from $42 Our price target of $33 is based on ~19.5x (prior 23x) our 2012 pro-forma EPS of $1.70 (prior $1.80). JNPR’s valuation has historically ranged between 15x-25x forward EPS, depending on whether revenue is accelerating or decelerating. We believe the multiple will stay in the lower half of this range until revenue re-acceleration is more visible likely closer to 1Q12.
Notes: Source: The content presented above reflects a front page summary of UBS Research content, UBS estimates based on a share price of US$30.02 on 24 Jun 2011 19:40 EDT
Morning Expresso - United States 27 June 2011
UBS 16
Fairchild Rating: Buy Target: US$21.00 Price: US$16.51 RIC: FCS.N Prior: Unchanged Prior: Unchanged Mkt Cap: US$2.05bn BBG: FCS US
Semiconductors Analyst: Parag Agarwal Tel: +1-212-713 2563
Checks point to robust trends, potential win with Apple; Reiterate Buy Checks point to power management win on iPhone 5 Our checks into supply chain indicate that Fairchild has expanded its presence in iPhone
from MOSFETS to voltage regulators. This win points to continued momentum for Fairchild in handset power management, especially as transition to dual-core processors drive higher need for power management in smartphones. We believe that FCS should deliver strong results for remainder of 2011, & we reiterate our Buy rating and $21 price target.
Industrial related revenue strong, despite economic headwinds We further believe that FCS’ industrial business (~30% of rev) should continue to grow at a healthy clip given company’s exposure to secular growth areas of the industrial market including motor power management, although declining PMI poses a risk to industrial related revenue. Furthermore, given modest (~14%) exposure to PC market, only half of which is to commodity PCs, we don’t expect sizeable impact from soft consumer PC sales.
Upside to margins from mix and fab conversions In addition to healthy revenue growth, margins should expand driven by mix, conversion of Utah & South Korea fabs, & closure of Mountain Top facility. We forecast gross margin expansion of 200 bps in 2011 to 37.3% & 100 bps in 2012.
Valuation: Reiterate Buy and $21 price target Our PT is based on DCF (WACC 11.9%, g 2%) and equates to a NTM PE of ~12x. Notes:
Source: The content presented above reflects a front page summary of UBS Research content, UBS estimates based on a share price of US$16.51 on 24 Jun 2011 16:13 EDT
Molex Rating: Neutral Target: US$28.00 Price: US$25.91 RIC: MOLX.O Prior: Unchanged Prior: Unchanged Mkt Cap: US$4.57bn BBG: MOLX US
Electric Components & Equipment Analyst: Amitabh Passi Tel: +1-415-352 5537
Generally Constructive Tone to Meetings Hosted MOLX Management in Europe; Overall Tone Constructive We hosted MOLX mgmt in Europe for 3 days of meetings with clients. We found
the tone generally constructive, with business trends stable and Japan recovering faster than anticipated. Mgmt was most optimistic about the auto business in CY 2H11 on recovery post-Japan and low inventory levels. Inventories at Distis/VMI hubs remain normal-to-below normal. However, there are signs of excess inventory in the mobile phone (we believe higher end) and consumer (mainly TVs) markets.
14% OM Goal Intact; Though Market Forces Need to Cooperate Mgmt remains committed to its 14% OM goal and we believe there is line of sight to this goal, assuming incr. OM of 25%. However, in the short-mid-term getting to this goal will be predicated on ongoing sales growth and opex efficiencies, as we believe expanding GM will remain challenging in an environment with elevated commodity costs and Fx headwinds. Further, we believe any gains from the pricing optimization software, Vendavo, will likely play out over a longer period of time.
Capital Allocation Priorities: R&D; M&A; Dividend; Share Buy-backs Capital allocation priorities remain as follows: Re-investing in the business; M&A, with a focus on long-cycle markets such as Medical, Industrial; preserving/growing the dividend (current yield 3%), and targeting a yield at a premium to the market; and modest share buy-backs primarily to offset dilution. MOLX also continues to strive to work down inventory to 80 days from about 87 days currently.
Valuation: Maintain Neutral and Price Target of $28 PT based on VCAM: 10% WACC; 7% Rev growth; 12.5% OM (thru-cycle). Notes:
Source: The content presented above reflects a front page summary of UBS Research content, UBS estimates based on a share price of US$25.91 on 24 Jun 2011 19:40 EDT
Rubicon Technology Rating: Buy Target: US$28.00 Price: US$16.54 RIC: RBCN.O Prior: Unchanged Prior: Unchanged Mkt Cap: US$0.33bn BBG: RBCN US
Semiconductors Analyst: Stephen Chin Tel: +1-212-713 4111
Large diameter sapphire still an advantage Well positioned to lead industry shift to the larger 6-inch wafers Our checks find Rubicon’s new sapphire ingot factory in Batavia, Illinois remains
on schedule (installing the newer/bigger 85kg furnaces) and is over 50% complete. We estimate this factory will be 50% of the company’s total capacity. We believe Rubicon’s announcement last week of its first 6” customer qualification at its Malaysia facility will enable it to generate 60%+ of its 2012 sales from 6” wafers as we expect 3 other customer qualifications are possible in 2H11.
2-inch price pressure and new competition remain longer term risks Our checks find prices for 2” wafers are down 15-20% q/q to $24 at present and estimate Rubicon’s 2” core prices are around $16 which is inline with our estimate of 50% price declines by 4Q12. Our checks find 6” prices are still flattish in 2H11 vs 1H11 at $450 each and we still estimate over 50% of Rubicon’s sales will be 6” wafers by 4Q11. We still estimate Rubicon’s 2012 gross margin can be 40% with 2” product at 30% and 6” product at 50% given limited competition near term.
New applications and input materials cost savings are likely in 2012 Our checks find Military/Optical could be a modest incremental sales opportunity for larger sized products ($10M) with the industrial market and enhanced LED sapphire substrates a 2012-13 opportunity. Checks also find efforts to supply its own input material (crackle) are doing well and may lower costs by 20% in 2012.
Valuation: 12-month price target is $28 Our PT is based on applying a 12x P/E multiple our 2012 EPS of $2.30. We still expect 6” customer wins and capacity expansion updates are possible catalysts.
Notes:
Source: The content presented above reflects a front page summary of UBS Research content, UBS estimates based on a share price of US$16.54 on 24 Jun 2011 19:40 EDT
Morning Expresso - United States 27 June 2011
UBS 17
Semiconductor Equipment Industry Update
Semiconductors Analyst: Stephen Chin Tel: +1-212-713 4111
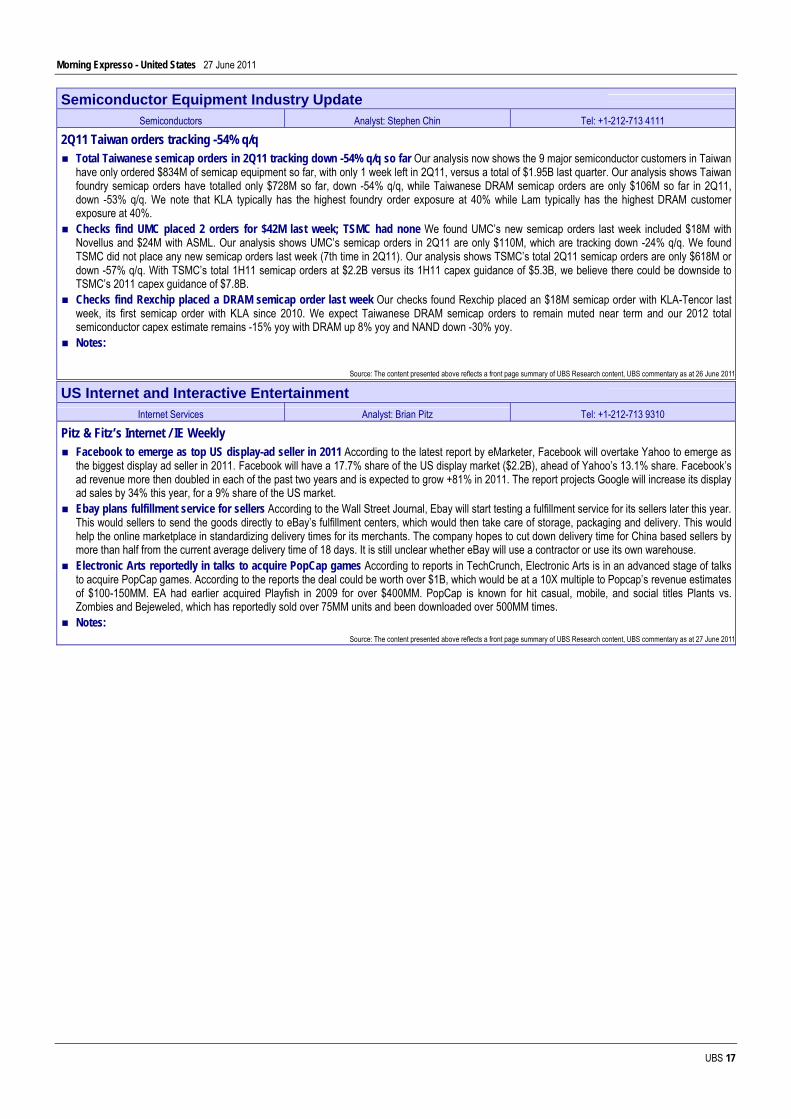
2Q11 Taiwan orders tracking -54% q/q Total Taiwanese semicap orders in 2Q11 tracking down -54% q/q so far Our analysis now shows the 9 major semiconductor customers in Taiwan
have only ordered $834M of semicap equipment so far, with only 1 week left in 2Q11, versus a total of $1.95B last quarter. Our analysis shows Taiwan foundry semicap orders have totalled only $728M so far, down -54% q/q, while Taiwanese DRAM semicap orders are only $106M so far in 2Q11, down -53% q/q. We note that KLA typically has the highest foundry order exposure at 40% while Lam typically has the highest DRAM customer exposure at 40%.
Checks find UMC placed 2 orders for $42M last week; TSMC had none We found UMC’s new semicap orders last week included $18M with Novellus and $24M with ASML. Our analysis shows UMC’s semicap orders in 2Q11 are only $110M, which are tracking down -24% q/q. We found TSMC did not place any new semicap orders last week (7th time in 2Q11). Our analysis shows TSMC’s total 2Q11 semicap orders are only $618M or down -57% q/q. With TSMC’s total 1H11 semicap orders at $2.2B versus its 1H11 capex guidance of $5.3B, we believe there could be downside to TSMC’s 2011 capex guidance of $7.8B.
Checks find Rexchip placed a DRAM semicap order last week Our checks found Rexchip placed an $18M semicap order with KLA-Tencor last week, its first semicap order with KLA since 2010. We expect Taiwanese DRAM semicap orders to remain muted near term and our 2012 total semiconductor capex estimate remains -15% yoy with DRAM up 8% yoy and NAND down -30% yoy.
Notes:
Source: The content presented above reflects a front page summary of UBS Research content, UBS commentary as at 26 June 2011
US Internet and Interactive Entertainment
Internet Services Analyst: Brian Pitz Tel: +1-212-713 9310
Pitz & Fitz’s Internet / IE Weekly Facebook to emerge as top US display-ad seller in 2011 According to the latest report by eMarketer, Facebook will overtake Yahoo to emerge as
the biggest display ad seller in 2011. Facebook will have a 17.7% share of the US display market ($2.2B), ahead of Yahoo’s 13.1% share. Facebook’s ad revenue more then doubled in each of the past two years and is expected to grow +81% in 2011. The report projects Google will increase its display ad sales by 34% this year, for a 9% share of the US market.
Ebay plans fulfillment service for sellers According to the Wall Street Journal, Ebay will start testing a fulfillment service for its sellers later this year. This would sellers to send the goods directly to eBay’s fulfillment centers, which would then take care of storage, packaging and delivery. This would help the online marketplace in standardizing delivery times for its merchants. The company hopes to cut down delivery time for China based sellers by more than half from the current average delivery time of 18 days. It is still unclear whether eBay will use a contractor or use its own warehouse.
Electronic Arts reportedly in talks to acquire PopCap games According to reports in TechCrunch, Electronic Arts is in an advanced stage of talks to acquire PopCap games. According to the reports the deal could be worth over $1B, which would be at a 10X multiple to Popcap’s revenue estimates of $100-150MM. EA had earlier acquired Playfish in 2009 for over $400MM. PopCap is known for hit casual, mobile, and social titles Plants vs. Zombies and Bejeweled, which has reportedly sold over 75MM units and been downloaded over 500MM times.
Notes: Source: The content presented above reflects a front page summary of UBS Research content, UBS commentary as at 27 June 2011
Morning Expresso - United States 27 June 2011
UBS 18
UBS Key Calls - US Live Key Call Portfolio
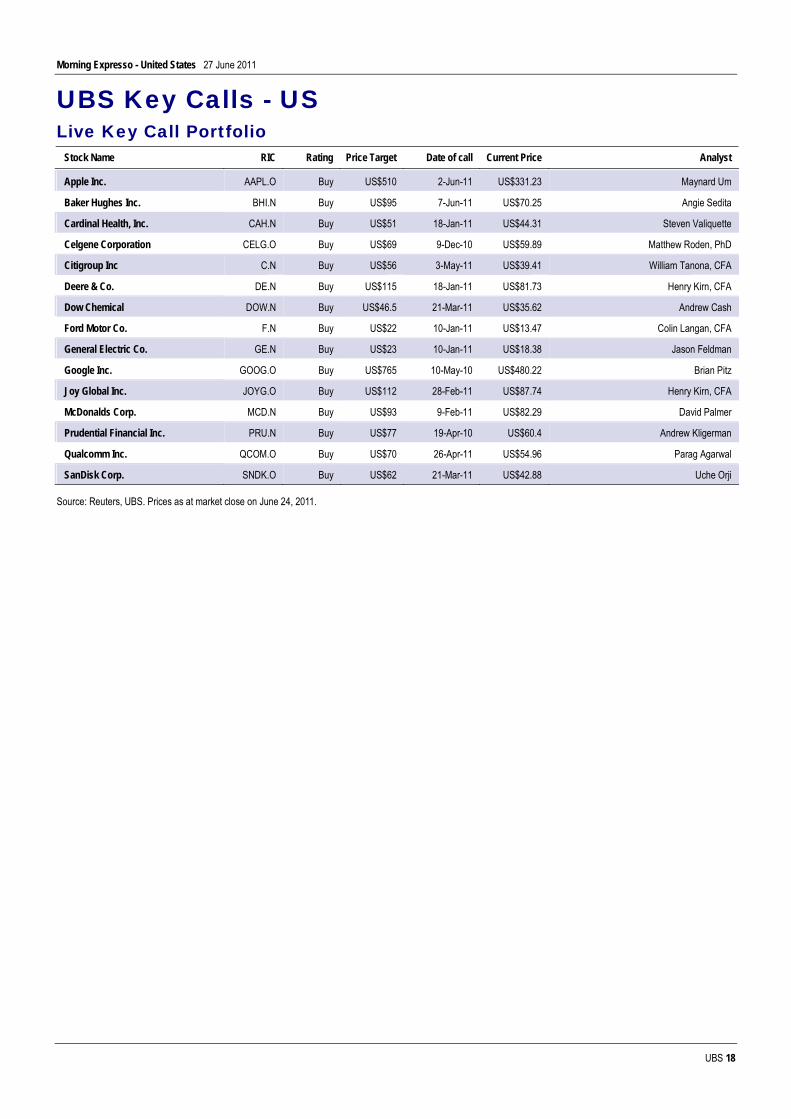
Stock Name RIC Rating Price Target Date of call Current Price Analyst Apple Inc. AAPL.O Buy US$510 2-Jun-11 US$331.23 Maynard Um
Baker Hughes Inc. BHI.N Buy US$95 7-Jun-11 US$70.25 Angie Sedita
Cardinal Health, Inc. CAH.N Buy US$51 18-Jan-11 US$44.31 Steven Valiquette
Celgene Corporation CELG.O Buy US$69 9-Dec-10 US$59.89 Matthew Roden, PhD
Citigroup Inc C.N Buy US$56 3-May-11 US$39.41 William Tanona, CFA
Deere & Co. DE.N Buy US$115 18-Jan-11 US$81.73 Henry Kirn, CFA
Dow Chemical DOW.N Buy US$46.5 21-Mar-11 US$35.62 Andrew Cash
Ford Motor Co. F.N Buy US$22 10-Jan-11 US$13.47 Colin Langan, CFA
General Electric Co. GE.N Buy US$23 10-Jan-11 US$18.38 Jason Feldman
Google Inc. GOOG.O Buy US$765 10-May-10 US$480.22 Brian Pitz
Joy Global Inc. JOYG.O Buy US$112 28-Feb-11 US$87.74 Henry Kirn, CFA
McDonalds Corp. MCD.N Buy US$93 9-Feb-11 US$82.29 David Palmer
Prudential Financial Inc. PRU.N Buy US$77 19-Apr-10 US$60.4 Andrew Kligerman
Qualcomm Inc. QCOM.O Buy US$70 26-Apr-11 US$54.96 Parag Agarwal
SanDisk Corp. SNDK.O Buy US$62 21-Mar-11 US$42.88 Uche Orji
Source: Reuters, UBS. Prices as at market close on June 24, 2011.
Morning Expresso - United States 27 June 2011
UBS 19
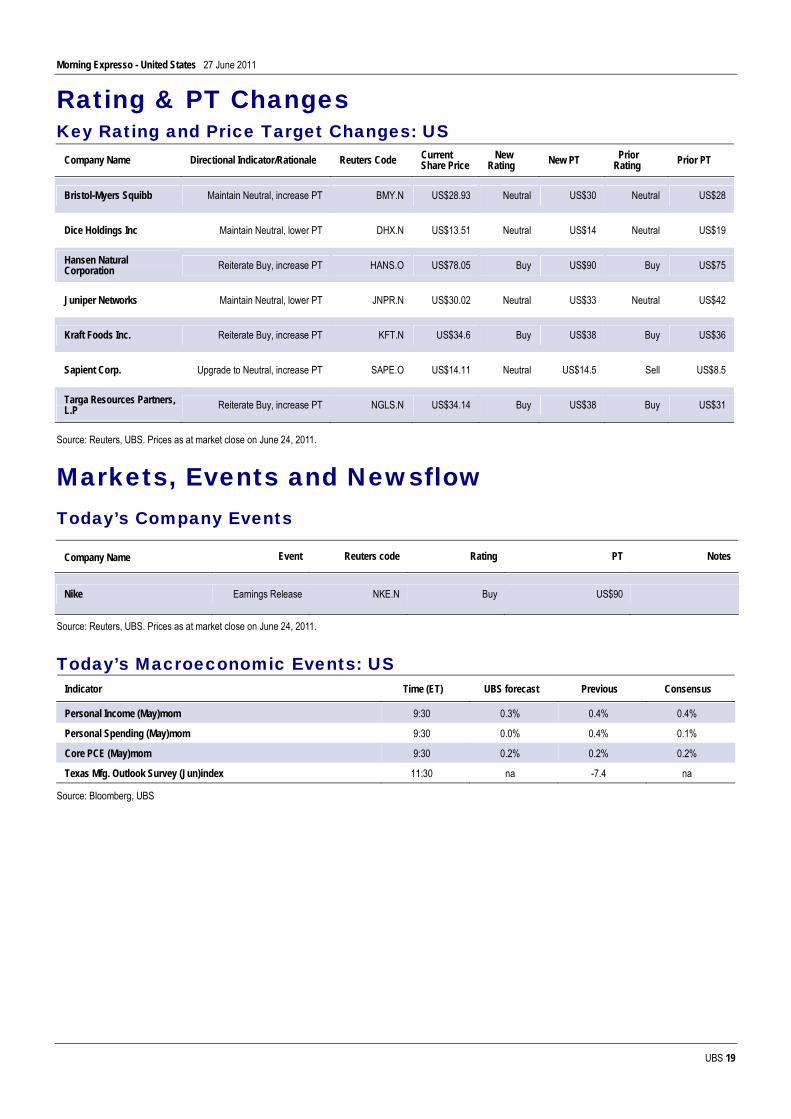
Rating & PT Changes Key Rating and Price Target Changes: US
Company Name Directional Indicator/Rationale Reuters Code Current Share Price
New Rating New PT Prior
Rating Prior PT
Bristol-Myers Squibb Maintain Neutral, increase PT BMY.N US$28.93 Neutral US$30 Neutral US$28
Dice Holdings Inc Maintain Neutral, lower PT DHX.N US$13.51 Neutral US$14 Neutral US$19
Hansen Natural Corporation Reiterate Buy, increase PT HANS.O US$78.05 Buy US$90 Buy US$75
Juniper Networks Maintain Neutral, lower PT JNPR.N US$30.02 Neutral US$33 Neutral US$42
Kraft Foods Inc. Reiterate Buy, increase PT KFT.N US$34.6 Buy US$38 Buy US$36
Sapient Corp. Upgrade to Neutral, increase PT SAPE.O US$14.11 Neutral US$14.5 Sell US$8.5
Targa Resources Partners, L.P Reiterate Buy, increase PT NGLS.N US$34.14 Buy US$38 Buy US$31
Source: Reuters, UBS. Prices as at market close on June 24, 2011.
Markets, Events and Newsflow Today’s Company Events
Company Name Event Reuters code Rating PT Notes
Nike Earnings Release NKE.N Buy US$90
Source: Reuters, UBS. Prices as at market close on June 24, 2011.
Today’s Macroeconomic Events: US
Indicator Time (ET) UBS forecast Previous Consensus
Personal Income (May)mom 9:30 0.3% 0.4% 0.4%
Personal Spending (May)mom 9:30 0.0% 0.4% 0.1%
Core PCE (May)mom 9:30 0.2% 0.2% 0.2%
Texas Mfg. Outlook Survey (Jun)index 11:30 na -7.4 na
Source: Bloomberg, UBS
Morning Expresso - United States 27 June 2011
UBS 20
Today’s UBS Hosted Corporate Roadshow: Company Event Location None
Today’s UBS Hosted Fieldtrip:
Company Event Location
None
Today’s UBS Hosted Conference:
Company Event Location
None
Morning Expresso - United States 27 June 2011
UBS 21
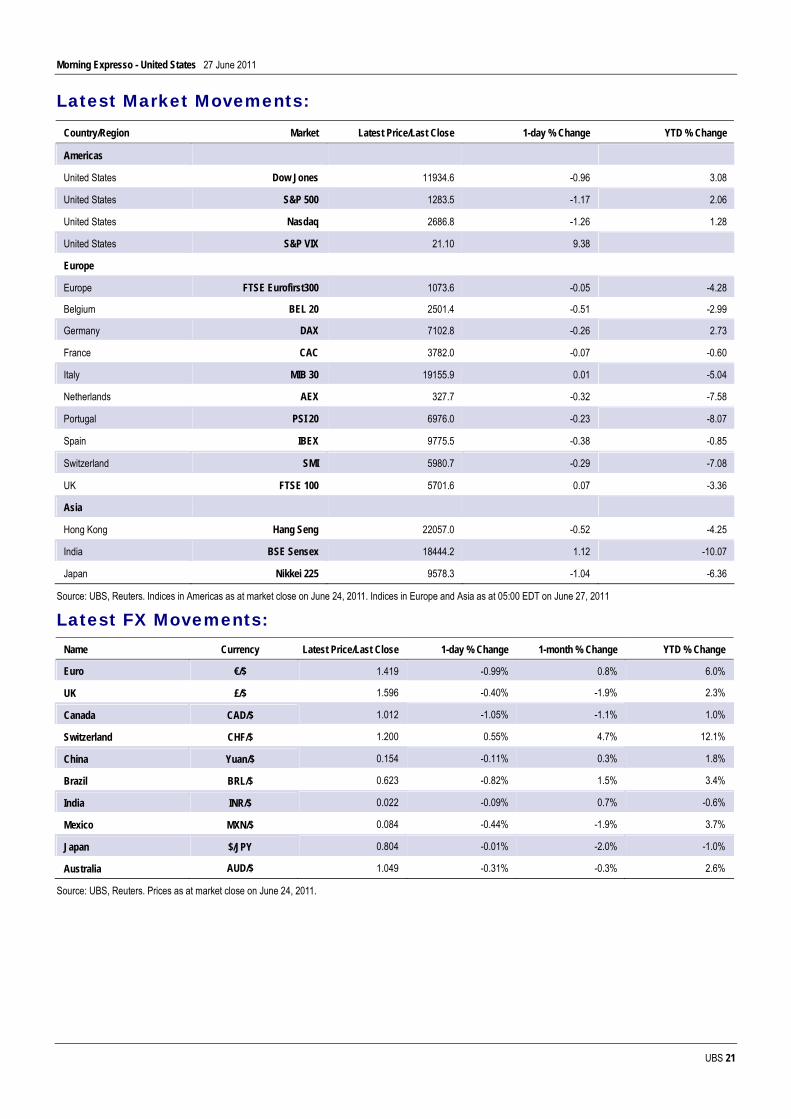
Latest Market Movements: Country/Region Market Latest Price/Last Close 1-day % Change YTD % Change
Americas
United States Dow Jones 11934.6 -0.96 3.08
United States S&P 500 1283.5 -1.17 2.06
United States Nasdaq 2686.8 -1.26 1.28
United States S&P VIX 21.10 9.38
Europe
Europe FTSE Eurofirst300 1073.6 -0.05 -4.28
Belgium BEL 20 2501.4 -0.51 -2.99
Germany DAX 7102.8 -0.26 2.73
France CAC 3782.0 -0.07 -0.60
Italy MIB 30 19155.9 0.01 -5.04
Netherlands AEX 327.7 -0.32 -7.58
Portugal PSI 20 6976.0 -0.23 -8.07
Spain IBEX 9775.5 -0.38 -0.85
Switzerland SMI 5980.7 -0.29 -7.08
UK FTSE 100 5701.6 0.07 -3.36
Asia
Hong Kong Hang Seng 22057.0 -0.52 -4.25
India BSE Sensex 18444.2 1.12 -10.07
Japan Nikkei 225 9578.3 -1.04 -6.36
Source: UBS, Reuters. Indices in Americas as at market close on June 24, 2011. Indices in Europe and Asia as at 05:00 EDT on June 27, 2011
Latest FX Movements: Name Currency Latest Price/Last Close 1-day % Change 1-month % Change YTD % Change
Euro €/$ 1.419 -0.99% 0.8% 6.0%
UK £/$ 1.596 -0.40% -1.9% 2.3%
Canada CAD/$ 1.012 -1.05% -1.1% 1.0%
Switzerland CHF/$ 1.200 0.55% 4.7% 12.1%
China Yuan/$ 0.154 -0.11% 0.3% 1.8%
Brazil BRL/$ 0.623 -0.82% 1.5% 3.4%
India INR/$ 0.022 -0.09% 0.7% -0.6%
Mexico MXN/$ 0.084 -0.44% -1.9% 3.7%
Japan $/JPY 0.804 -0.01% -2.0% -1.0%
Australia AUD/$ 1.049 -0.31% -0.3% 2.6%
Source: UBS, Reuters. Prices as at market close on June 24, 2011.
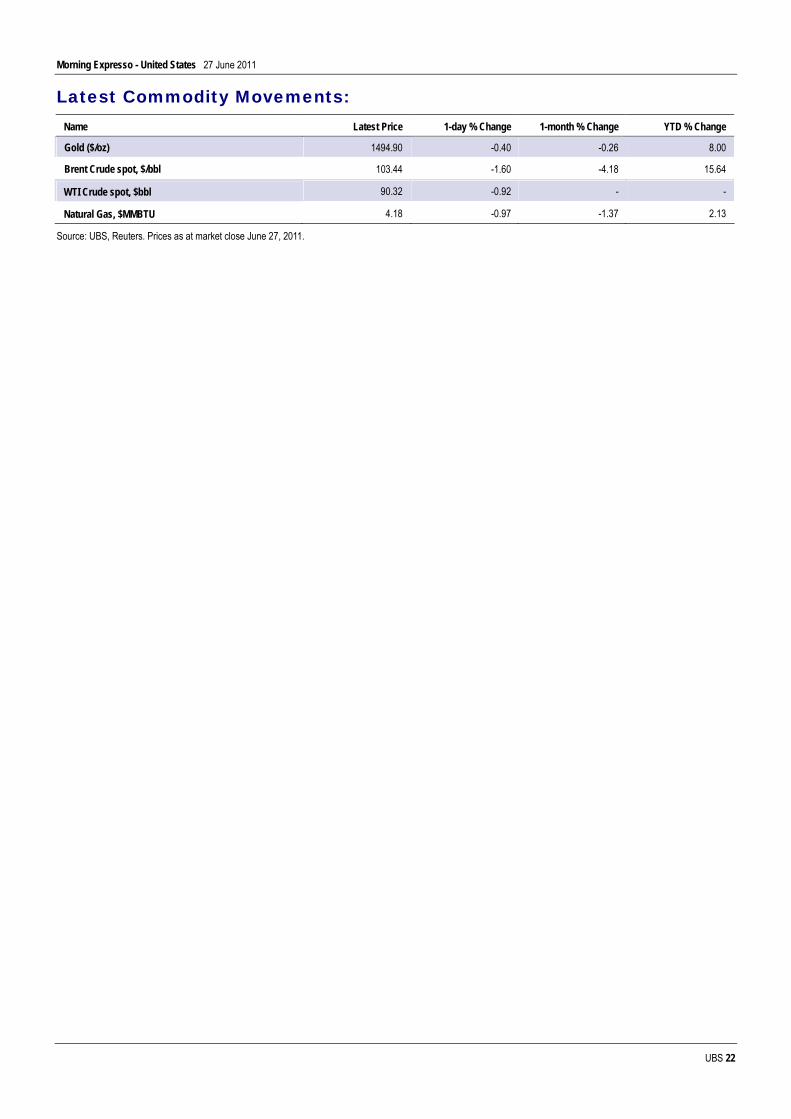
Morning Expresso - United States 27 June 2011
UBS 22
Latest Commodity Movements: Name Latest Price 1-day % Change 1-month % Change YTD % Change
Gold ($/oz) 1494.90 -0.40 -0.26 8.00
Brent Crude spot, $/bbl 103.44 -1.60 -4.18 15.64
WTI Crude spot, $bbl 90.32 -0.92 - -
Natural Gas, $MMBTU 4.18 -0.97 -1.37 2.13
Source: UBS, Reuters. Prices as at market close June 27, 2011.
Morning Expresso - United States 27 June 2011
UBS 23
Forthcoming UBS Event
ab
Expert Conference Call
Private Builder Conference Call Series: Spring Selling Season - Carolinas
Host:
David Goldberg UBS Building & Building Products Analyst
Guest Speaker: Bernard Helm
Market Opportunity Research Enterprise
Date & Time: Thursday June 30, 2011 // 11:00am ET
Dial-in Details:
Toll Free: 800-667-9916 Toll: 303-223-4395 Code: 21526500#
Replay Details:
Toll Free: 800-633-8284 Toll: 402-977-9140
Replay Code: 21526500#
Morning Expresso - United States 27 June 2011
UBS 24
Forthcoming UBS Event
ab
Expert Access Conference Call
2011 Food Cost Outlook Series
Dairy with Jerry Dryer of Dairy Market Analyst
Host: David Palmer
UBS Restaurants and Packaged Food Analyst
Date & Time: Thursday, July 7, 2011, 2PM ET
Dial-in Details:
Toll Free: 800-772-8907 Toll: 212-231-2922
Code: 21529085

Morning Expresso - United States 27 June 2011
UBS 25
Forthcoming UBS Event
ab
Expert Access Conference Call
2011 Food Cost Outlook Series
Wheat, Corn and Sugar with Jim Sullivan of Informa Economics
Host:
David Palmer UBS Restaurants and Packaged Food Analyst
Date & Time:
Friday, July 8, 2011, 10 AM ET
Dial-in Details: Toll Free: 800-772-8907
Toll: 212-231-2922 Code: 21529090

Morning Expresso - United States 27 June 2011
UBS 26
Forthcoming UBS Event
ab
Expert Access Conference Call
2011 Food Cost Outlook Series
Beef and Chicken with Kevin Good of CattleFax
Host: David Palmer
UBS Restaurants and Packaged Food Analyst
Date & Time: Monday, July 11, 2011, 2 PM
Dial-in Details:
Toll Free: 800-772-8907 Toll: 212-231-2922
Code: 21529091
Morning Expresso - United States 27 June 2011
UBS 27
Further Information
Morning Expresso – United States Welcome to the Morning Expresso, an early morning summary of the key ideas and issues presented from UBS for the day ahead. Its contents include:
- key items from UBS’ United States Morning Meeting
- highlighted recommendation and price target changes
- today’s anticipated company, sector and macro-economic catalysts from the US Contextual Diary
- company and client events, conferences and conference calls from UBS
- overnight global market, forex and commodity movements
Morning Expresso is designed to give you all that you ‘need to know’ each morning.
Data presented is accurate as at 06:00 EDT on Monday, June 27, 2011.
Contacts & Feedback For further details concerning today’s Morning Expresso – United States note, please visit www.ubs.com/investmentresearch or speak to your UBS contact. This note is not intended to be static and it will evolve over time. Feedback welcomed on email to
Statement of Risk
Forecasting earnings and corporate financial behavior is difficult because it is affected by a wide range of economic, financial, accounting and regulatory trends, as well as changes in tax policy.
Morning Expresso - United States 27 June 2011
UBS 28
Analyst Certification
Each research analyst primarily responsible for the content of this research report, in whole or in part, certifies that with respect to each security or issuer that the analyst covered in this report: (1) all of the views expressed accurately reflect his or her personal views about those securities or issuers and were prepared in an independent manner, including with respect to UBS, and (2) no part of his or her compensation was, is, or will be, directly or indirectly, related to the specific recommendations or views expressed by that research analyst in the research report.
Morning Expresso - United States 27 June 2011
UBS 29
Required Disclosures This report has been prepared by UBS Securities LLC, an affiliate of UBS AG. UBS AG, its subsidiaries, branches and affiliates are referred to herein as UBS.
For information on the ways in which UBS manages conflicts and maintains independence of its research product; historical performance information; and certain additional disclosures concerning UBS research recommendations, please visit www.ubs.com/disclosures. The figures contained in performance charts refer to the past; past performance is not a reliable indicator of future results. Additional information will be made available upon request. UBS Securities Co. Limited is licensed to conduct securities investment consultancy businesses by the China Securities Regulatory Commission.
UBS Investment Research: Global Equity Rating Allocations
UBS 12-Month Rating Rating Category Coverage1 IB Services2
Buy Buy 52% 41%Neutral Hold/Neutral 40% 37%Sell Sell 8% 20%UBS Short-Term Rating Rating Category Coverage3 IB Services4
Buy Buy less than 1% 30%Sell Sell less than 1% 17%
1:Percentage of companies under coverage globally within the 12-month rating category. 2:Percentage of companies within the 12-month rating category for which investment banking (IB) services were provided within the past 12 months. 3:Percentage of companies under coverage globally within the Short-Term rating category. 4:Percentage of companies within the Short-Term rating category for which investment banking (IB) services were provided within the past 12 months. Source: UBS. Rating allocations are as of 31 March 2011. UBS Investment Research: Global Equity Rating Definitions
UBS 12-Month Rating Definition Buy FSR is > 6% above the MRA. Neutral FSR is between -6% and 6% of the MRA. Sell FSR is > 6% below the MRA. UBS Short-Term Rating Definition
Buy Buy: Stock price expected to rise within three months from the time the rating was assigned because of a specific catalyst or event.
Sell Sell: Stock price expected to fall within three months from the time the rating was assigned because of a specific catalyst or event.
Morning Expresso - United States 27 June 2011
UBS 30
KEY DEFINITIONS Forecast Stock Return (FSR) is defined as expected percentage price appreciation plus gross dividend yield over the next 12 months. Market Return Assumption (MRA) is defined as the one-year local market interest rate plus 5% (a proxy for, and not a forecast of, the equity risk premium). Under Review (UR) Stocks may be flagged as UR by the analyst, indicating that the stock's price target and/or rating are subject to possible change in the near term, usually in response to an event that may affect the investment case or valuation. Short-Term Ratings reflect the expected near-term (up to three months) performance of the stock and do not reflect any change in the fundamental view or investment case. Equity Price Targets have an investment horizon of 12 months. EXCEPTIONS AND SPECIAL CASES UK and European Investment Fund ratings and definitions are: Buy: Positive on factors such as structure, management, performance record, discount; Neutral: Neutral on factors such as structure, management, performance record, discount; Sell: Negative on factors such as structure, management, performance record, discount. Core Banding Exceptions (CBE): Exceptions to the standard +/-6% bands may be granted by the Investment Review Committee (IRC). Factors considered by the IRC include the stock's volatility and the credit spread of the respective company's debt. As a result, stocks deemed to be very high or low risk may be subject to higher or lower bands as they relate to the rating. When such exceptions apply, they will be identified in the Company Disclosures table in the relevant research piece. Research analysts contributing to this report who are employed by any non-US affiliate of UBS Securities LLC are not registered/qualified as research analysts with the NASD and NYSE and therefore are not subject to the restrictions contained in the NASD and NYSE rules on communications with a subject company, public appearances, and trading securities held by a research analyst account. The name of each affiliate and analyst employed by that affiliate contributing to this report, if any, follows.
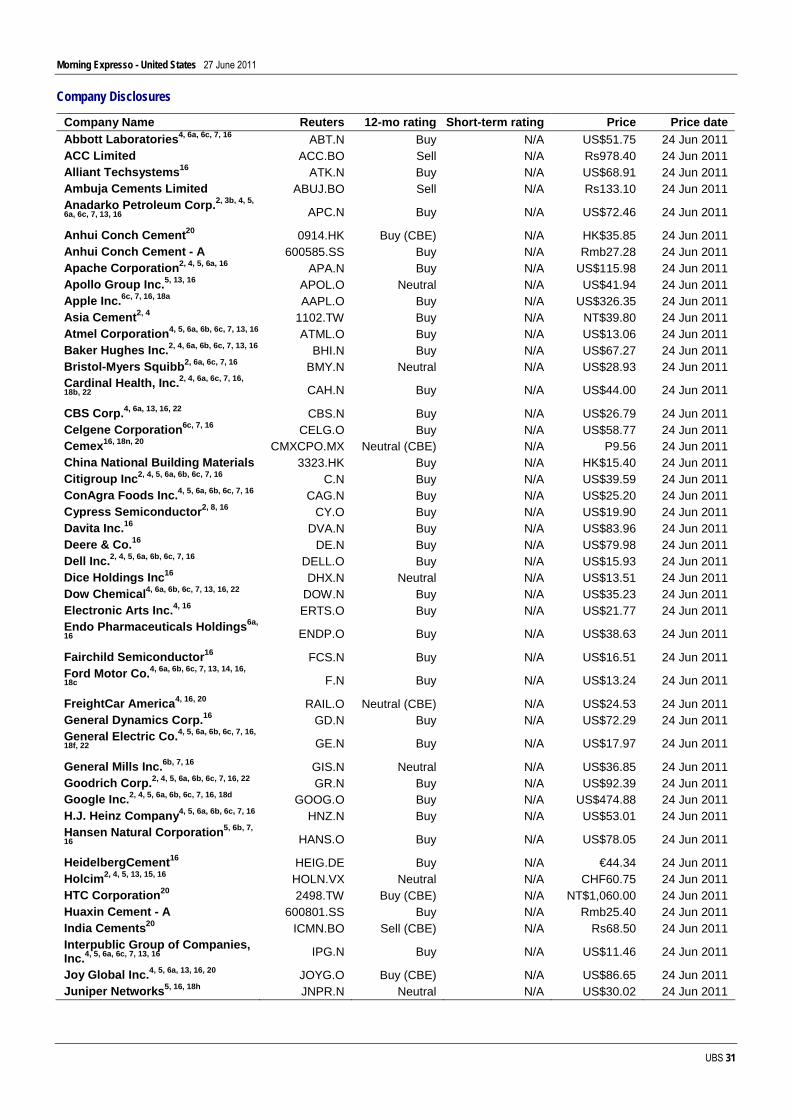
Morning Expresso - United States 27 June 2011
UBS 31
Company Disclosures
Company Name Reuters 12-mo rating Short-term rating Price Price date Abbott Laboratories4, 6a, 6c, 7, 16 ABT.N Buy N/A US$51.75 24 Jun 2011 ACC Limited ACC.BO Sell N/A Rs978.40 24 Jun 2011 Alliant Techsystems16 ATK.N Buy N/A US$68.91 24 Jun 2011 Ambuja Cements Limited ABUJ.BO Sell N/A Rs133.10 24 Jun 2011 Anadarko Petroleum Corp.2, 3b, 4, 5,
6a, 6c, 7, 13, 16 APC.N Buy N/A US$72.46 24 Jun 2011
Anhui Conch Cement20 0914.HK Buy (CBE) N/A HK$35.85 24 Jun 2011 Anhui Conch Cement - A 600585.SS Buy N/A Rmb27.28 24 Jun 2011 Apache Corporation2, 4, 5, 6a, 16 APA.N Buy N/A US$115.98 24 Jun 2011 Apollo Group Inc.5, 13, 16 APOL.O Neutral N/A US$41.94 24 Jun 2011 Apple Inc.6c, 7, 16, 18a AAPL.O Buy N/A US$326.35 24 Jun 2011 Asia Cement2, 4 1102.TW Buy N/A NT$39.80 24 Jun 2011 Atmel Corporation4, 5, 6a, 6b, 6c, 7, 13, 16 ATML.O Buy N/A US$13.06 24 Jun 2011 Baker Hughes Inc.2, 4, 6a, 6b, 6c, 7, 13, 16 BHI.N Buy N/A US$67.27 24 Jun 2011 Bristol-Myers Squibb2, 6a, 6c, 7, 16 BMY.N Neutral N/A US$28.93 24 Jun 2011 Cardinal Health, Inc.2, 4, 6a, 6c, 7, 16,
18b, 22 CAH.N Buy N/A US$44.00 24 Jun 2011
CBS Corp.4, 6a, 13, 16, 22 CBS.N Buy N/A US$26.79 24 Jun 2011 Celgene Corporation6c, 7, 16 CELG.O Buy N/A US$58.77 24 Jun 2011 Cemex16, 18n, 20 CMXCPO.MX Neutral (CBE) N/A P9.56 24 Jun 2011 China National Building Materials 3323.HK Buy N/A HK$15.40 24 Jun 2011 Citigroup Inc2, 4, 5, 6a, 6b, 6c, 7, 16 C.N Buy N/A US$39.59 24 Jun 2011 ConAgra Foods Inc.4, 5, 6a, 6b, 6c, 7, 16 CAG.N Buy N/A US$25.20 24 Jun 2011 Cypress Semiconductor2, 8, 16 CY.O Buy N/A US$19.90 24 Jun 2011 Davita Inc.16 DVA.N Buy N/A US$83.96 24 Jun 2011 Deere & Co.16 DE.N Buy N/A US$79.98 24 Jun 2011 Dell Inc.2, 4, 5, 6a, 6b, 6c, 7, 16 DELL.O Buy N/A US$15.93 24 Jun 2011 Dice Holdings Inc16 DHX.N Neutral N/A US$13.51 24 Jun 2011 Dow Chemical4, 6a, 6b, 6c, 7, 13, 16, 22 DOW.N Buy N/A US$35.23 24 Jun 2011 Electronic Arts Inc.4, 16 ERTS.O Buy N/A US$21.77 24 Jun 2011 Endo Pharmaceuticals Holdings6a,
16 ENDP.O Buy N/A US$38.63 24 Jun 2011
Fairchild Semiconductor16 FCS.N Buy N/A US$16.51 24 Jun 2011 Ford Motor Co.4, 6a, 6b, 6c, 7, 13, 14, 16, 18c F.N Buy N/A US$13.24 24 Jun 2011
FreightCar America4, 16, 20 RAIL.O Neutral (CBE) N/A US$24.53 24 Jun 2011 General Dynamics Corp.16 GD.N Buy N/A US$72.29 24 Jun 2011 General Electric Co.4, 5, 6a, 6b, 6c, 7, 16,
18f, 22 GE.N Buy N/A US$17.97 24 Jun 2011
General Mills Inc.6b, 7, 16 GIS.N Neutral N/A US$36.85 24 Jun 2011 Goodrich Corp.2, 4, 5, 6a, 6b, 6c, 7, 16, 22 GR.N Buy N/A US$92.39 24 Jun 2011 Google Inc.2, 4, 5, 6a, 6b, 6c, 7, 16, 18d GOOG.O Buy N/A US$474.88 24 Jun 2011 H.J. Heinz Company4, 5, 6a, 6b, 6c, 7, 16 HNZ.N Buy N/A US$53.01 24 Jun 2011 Hansen Natural Corporation5, 6b, 7,
16 HANS.O Buy N/A US$78.05 24 Jun 2011
HeidelbergCement16 HEIG.DE Buy N/A €44.34 24 Jun 2011 Holcim2, 4, 5, 13, 15, 16 HOLN.VX Neutral N/A CHF60.75 24 Jun 2011 HTC Corporation20 2498.TW Buy (CBE) N/A NT$1,060.00 24 Jun 2011 Huaxin Cement - A 600801.SS Buy N/A Rmb25.40 24 Jun 2011 India Cements20 ICMN.BO Sell (CBE) N/A Rs68.50 24 Jun 2011 Interpublic Group of Companies, Inc.4, 5, 6a, 6c, 7, 13, 16 IPG.N Buy N/A US$11.46 24 Jun 2011
Joy Global Inc.4, 5, 6a, 13, 16, 20 JOYG.O Buy (CBE) N/A US$86.65 24 Jun 2011 Juniper Networks5, 16, 18h JNPR.N Neutral N/A US$30.02 24 Jun 2011
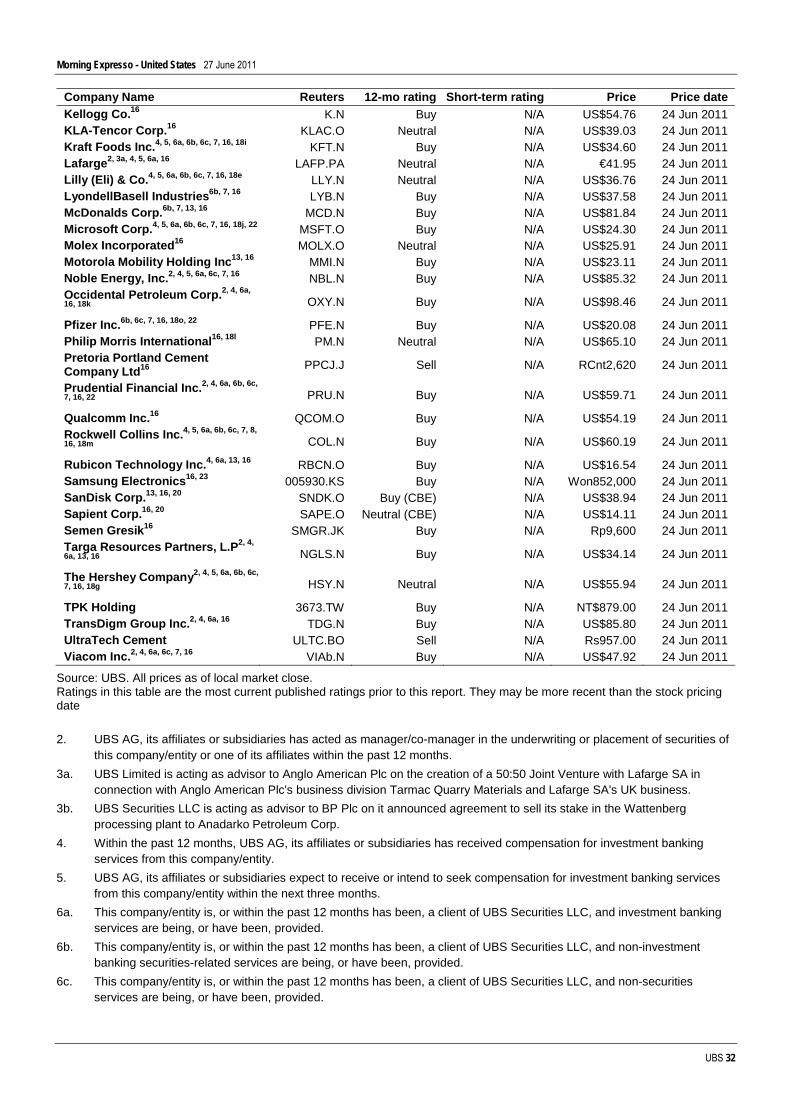
Morning Expresso - United States 27 June 2011
UBS 32
Company Name Reuters 12-mo rating Short-term rating Price Price date Kellogg Co.16 K.N Buy N/A US$54.76 24 Jun 2011 KLA-Tencor Corp.16 KLAC.O Neutral N/A US$39.03 24 Jun 2011 Kraft Foods Inc.4, 5, 6a, 6b, 6c, 7, 16, 18i KFT.N Buy N/A US$34.60 24 Jun 2011 Lafarge2, 3a, 4, 5, 6a, 16 LAFP.PA Neutral N/A €41.95 24 Jun 2011 Lilly (Eli) & Co.4, 5, 6a, 6b, 6c, 7, 16, 18e LLY.N Neutral N/A US$36.76 24 Jun 2011 LyondellBasell Industries6b, 7, 16 LYB.N Buy N/A US$37.58 24 Jun 2011 McDonalds Corp.6b, 7, 13, 16 MCD.N Buy N/A US$81.84 24 Jun 2011 Microsoft Corp.4, 5, 6a, 6b, 6c, 7, 16, 18j, 22 MSFT.O Buy N/A US$24.30 24 Jun 2011 Molex Incorporated16 MOLX.O Neutral N/A US$25.91 24 Jun 2011 Motorola Mobility Holding Inc13, 16 MMI.N Buy N/A US$23.11 24 Jun 2011 Noble Energy, Inc.2, 4, 5, 6a, 6c, 7, 16 NBL.N Buy N/A US$85.32 24 Jun 2011 Occidental Petroleum Corp.2, 4, 6a,
16, 18k OXY.N Buy N/A US$98.46 24 Jun 2011
Pfizer Inc.6b, 6c, 7, 16, 18o, 22 PFE.N Buy N/A US$20.08 24 Jun 2011 Philip Morris International16, 18l PM.N Neutral N/A US$65.10 24 Jun 2011 Pretoria Portland Cement Company Ltd16 PPCJ.J Sell N/A RCnt2,620 24 Jun 2011
Prudential Financial Inc.2, 4, 6a, 6b, 6c,
7, 16, 22 PRU.N Buy N/A US$59.71 24 Jun 2011
Qualcomm Inc.16 QCOM.O Buy N/A US$54.19 24 Jun 2011 Rockwell Collins Inc.4, 5, 6a, 6b, 6c, 7, 8,
16, 18m COL.N Buy N/A US$60.19 24 Jun 2011
Rubicon Technology Inc.4, 6a, 13, 16 RBCN.O Buy N/A US$16.54 24 Jun 2011 Samsung Electronics16, 23 005930.KS Buy N/A Won852,000 24 Jun 2011 SanDisk Corp.13, 16, 20 SNDK.O Buy (CBE) N/A US$38.94 24 Jun 2011 Sapient Corp.16, 20 SAPE.O Neutral (CBE) N/A US$14.11 24 Jun 2011 Semen Gresik16 SMGR.JK Buy N/A Rp9,600 24 Jun 2011 Targa Resources Partners, L.P2, 4,
6a, 13, 16 NGLS.N Buy N/A US$34.14 24 Jun 2011
The Hershey Company2, 4, 5, 6a, 6b, 6c,
7, 16, 18g HSY.N Neutral N/A US$55.94 24 Jun 2011
TPK Holding 3673.TW Buy N/A NT$879.00 24 Jun 2011 TransDigm Group Inc.2, 4, 6a, 16 TDG.N Buy N/A US$85.80 24 Jun 2011 UltraTech Cement ULTC.BO Sell N/A Rs957.00 24 Jun 2011 Viacom Inc.2, 4, 6a, 6c, 7, 16 VIAb.N Buy N/A US$47.92 24 Jun 2011
Source: UBS. All prices as of local market close. Ratings in this table are the most current published ratings prior to this report. They may be more recent than the stock pricing date 2. UBS AG, its affiliates or subsidiaries has acted as manager/co-manager in the underwriting or placement of securities of
this company/entity or one of its affiliates within the past 12 months. 3a. UBS Limited is acting as advisor to Anglo American Plc on the creation of a 50:50 Joint Venture with Lafarge SA in
connection with Anglo American Plc's business division Tarmac Quarry Materials and Lafarge SA's UK business. 3b. UBS Securities LLC is acting as advisor to BP Plc on it announced agreement to sell its stake in the Wattenberg
processing plant to Anadarko Petroleum Corp. 4. Within the past 12 months, UBS AG, its affiliates or subsidiaries has received compensation for investment banking
services from this company/entity. 5. UBS AG, its affiliates or subsidiaries expect to receive or intend to seek compensation for investment banking services
from this company/entity within the next three months. 6a. This company/entity is, or within the past 12 months has been, a client of UBS Securities LLC, and investment banking
services are being, or have been, provided. 6b. This company/entity is, or within the past 12 months has been, a client of UBS Securities LLC, and non-investment
banking securities-related services are being, or have been, provided. 6c. This company/entity is, or within the past 12 months has been, a client of UBS Securities LLC, and non-securities
services are being, or have been, provided.
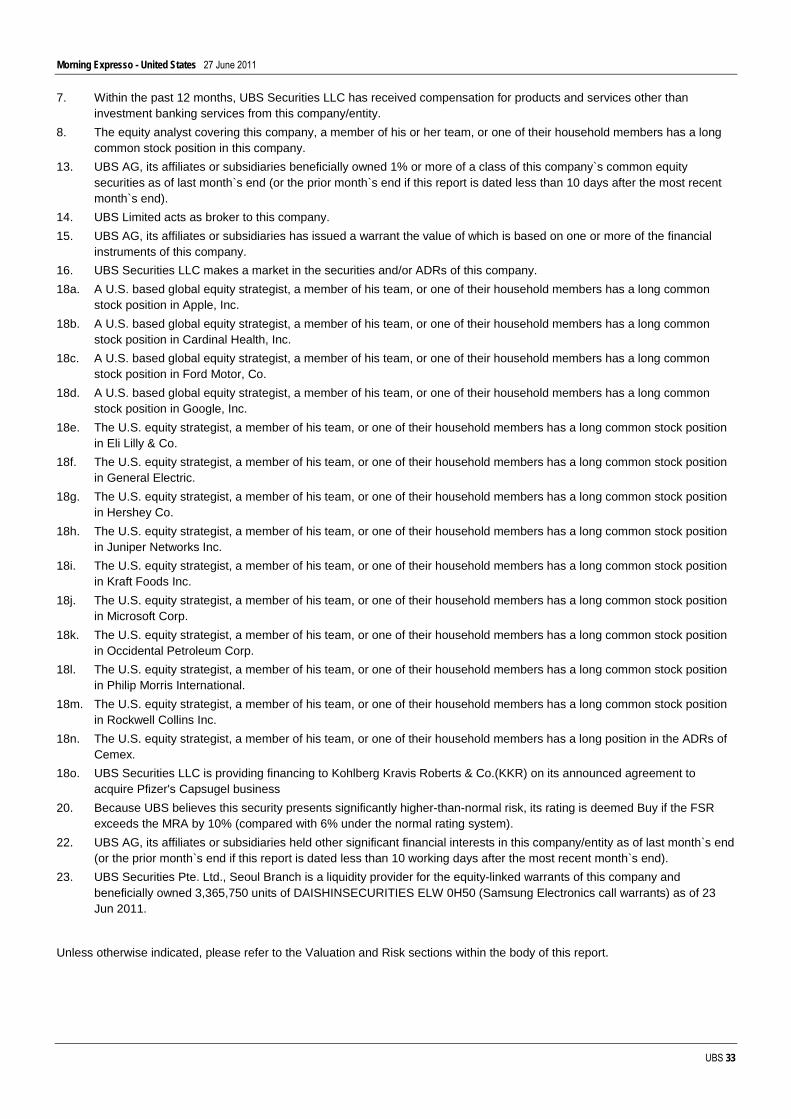
Morning Expresso - United States 27 June 2011
UBS 33
7. Within the past 12 months, UBS Securities LLC has received compensation for products and services other than investment banking services from this company/entity.
8. The equity analyst covering this company, a member of his or her team, or one of their household members has a long common stock position in this company.
13. UBS AG, its affiliates or subsidiaries beneficially owned 1% or more of a class of this company`s common equity securities as of last month`s end (or the prior month`s end if this report is dated less than 10 days after the most recent month`s end).
14. UBS Limited acts as broker to this company. 15. UBS AG, its affiliates or subsidiaries has issued a warrant the value of which is based on one or more of the financial
instruments of this company. 16. UBS Securities LLC makes a market in the securities and/or ADRs of this company. 18a. A U.S. based global equity strategist, a member of his team, or one of their household members has a long common
stock position in Apple, Inc. 18b. A U.S. based global equity strategist, a member of his team, or one of their household members has a long common
stock position in Cardinal Health, Inc. 18c. A U.S. based global equity strategist, a member of his team, or one of their household members has a long common
stock position in Ford Motor, Co. 18d. A U.S. based global equity strategist, a member of his team, or one of their household members has a long common
stock position in Google, Inc. 18e. The U.S. equity strategist, a member of his team, or one of their household members has a long common stock position
in Eli Lilly & Co. 18f. The U.S. equity strategist, a member of his team, or one of their household members has a long common stock position
in General Electric. 18g. The U.S. equity strategist, a member of his team, or one of their household members has a long common stock position
in Hershey Co. 18h. The U.S. equity strategist, a member of his team, or one of their household members has a long common stock position
in Juniper Networks Inc. 18i. The U.S. equity strategist, a member of his team, or one of their household members has a long common stock position
in Kraft Foods Inc. 18j. The U.S. equity strategist, a member of his team, or one of their household members has a long common stock position
in Microsoft Corp. 18k. The U.S. equity strategist, a member of his team, or one of their household members has a long common stock position
in Occidental Petroleum Corp. 18l. The U.S. equity strategist, a member of his team, or one of their household members has a long common stock position
in Philip Morris International. 18m. The U.S. equity strategist, a member of his team, or one of their household members has a long common stock position
in Rockwell Collins Inc. 18n. The U.S. equity strategist, a member of his team, or one of their household members has a long position in the ADRs of
Cemex. 18o. UBS Securities LLC is providing financing to Kohlberg Kravis Roberts & Co.(KKR) on its announced agreement to
acquire Pfizer's Capsugel business 20. Because UBS believes this security presents significantly higher-than-normal risk, its rating is deemed Buy if the FSR
exceeds the MRA by 10% (compared with 6% under the normal rating system). 22. UBS AG, its affiliates or subsidiaries held other significant financial interests in this company/entity as of last month`s end
(or the prior month`s end if this report is dated less than 10 working days after the most recent month`s end). 23. UBS Securities Pte. Ltd., Seoul Branch is a liquidity provider for the equity-linked warrants of this company and
beneficially owned 3,365,750 units of DAISHINSECURITIES ELW 0H50 (Samsung Electronics call warrants) as of 23 Jun 2011.
Unless otherwise indicated, please refer to the Valuation and Risk sections within the body of this report.
Morning Expresso - United States 27 June 2011
UBS 34
For a complete set of disclosure statements associated with the companies discussed in this report, including information on valuation and risk, please contact UBS Securities LLC, 1285 Avenue of Americas, New York, NY 10019, USA, Attention: Publishing Administration. Additional Prices: Nike Inc., US$81.18 (24 Jun 2011); Source: UBS. All prices as of local market close.
Morning Expresso - United States 27 June 2011
UBS 35
Global Disclaimer This report has been prepared by UBS Securities LLC, an affiliate of UBS AG. UBS AG, its subsidiaries, branches and affiliates are referred to herein as UBS. In certain countries, UBS AG is referred to as UBS SA. This report is for distribution only under such circumstances as may be permitted by applicable law. Nothing in this report constitutes a representation that any investment strategy or recommendation contained herein is suitable or appropriate to a recipient’s individual circumstances or otherwise constitutes a personal recommendation. It is published solely for information purposes, it does not constitute an advertisement and is not to be construed as a solicitation or an offer to buy or sell any securities or related financial instruments in any jurisdiction. No representation or warranty, either express or implied, is provided in relation to the accuracy, completeness or reliability of the information contained herein, except with respect to information concerning UBS AG, its subsidiaries and affiliates, nor is it intended to be a complete statement or summary of the securities, markets or developments referred to in the report. UBS does not undertake that investors will obtain profits, nor will it share with investors any investment profits nor accept any liability for any investment losses. Investments involve risks and investors should exercise prudence in making their investment decisions. The report should not be regarded by recipients as a substitute for the exercise of their own judgement. Past performance is not necessarily a guide to future performance. The value of any investment or income may go down as well as up and you may not get back the full amount invested. Any opinions expressed in this report are subject to change without notice and may differ or be contrary to opinions expressed by other business areas or groups of UBS as a result of using different assumptions and criteria. Research will initiate, update and cease coverage solely at the discretion of UBS Investment Bank Research Management. The analysis contained herein is based on numerous assumptions. Different assumptions could result in materially different results. The analyst(s) responsible for the preparation of this report may interact with trading desk personnel, sales personnel and other constituencies for the purpose of gathering, synthesizing and interpreting market information. UBS is under no obligation to update or keep current the information contained herein. UBS relies on information barriers to control the flow of information contained in one or more areas within UBS, into other areas, units, groups or affiliates of UBS. The compensation of the analyst who prepared this report is determined exclusively by research management and senior management (not including investment banking). Analyst compensation is not based on investment banking revenues, however, compensation may relate to the revenues of UBS Investment Bank as a whole, of which investment banking, sales and trading are a part. The securities described herein may not be eligible for sale in all jurisdictions or to certain categories of investors. Options, derivative products and futures are not suitable for all investors, and trading in these instruments is considered risky. Mortgage and asset-backed securities may involve a high degree of risk and may be highly volatile in response to fluctuations in interest rates and other market conditions. Past performance is not necessarily indicative of future results. Foreign currency rates of exchange may adversely affect the value, price or income of any security or related instrument mentioned in this report. For investment advice, trade execution or other enquiries, clients should contact their local sales representative. Neither UBS nor any of its affiliates, nor any of UBS' or any of its affiliates, directors, employees or agents accepts any liability for any loss or damage arising out of the use of all or any part of this report. For financial instruments admitted to trading on an EU regulated market: UBS AG, its affiliates or subsidiaries (excluding UBS Securities LLC and/or UBS Capital Markets LP) acts as a market maker or liquidity provider (in accordance with the interpretation of these terms in the UK) in the financial instruments of the issuer save that where the activity of liquidity provider is carried out in accordance with the definition given to it by the laws and regulations of any other EU jurisdictions, such information is separately disclosed in this research report. UBS and its affiliates and employees may have long or short positions, trade as principal and buy and sell in instruments or derivatives identified herein. Any prices stated in this report are for information purposes only and do not represent valuations for individual securities or other instruments. There is no representation that any transaction can or could have been effected at those prices and any prices do not necessarily reflect UBS's internal books and records or theoretical model-based valuations and may be based on certain assumptions. Different assumptions, by UBS or any other source, may yield substantially different results. United Kingdom and the rest of Europe: Except as otherwise specified herein, this material is communicated by UBS Limited, a subsidiary of UBS AG, to persons who are eligible counterparties or professional clients and is only available to such persons. The information contained herein does not apply to, and should not be relied upon by, retail clients. UBS Limited is authorised and regulated by the Financial Services Authority (FSA). UBS research complies with all the FSA requirements and laws concerning disclosures and these are indicated on the research where applicable. France: Prepared by UBS Limited and distributed by UBS Limited and UBS Securities France SA. UBS Securities France S.A. is regulated by the Autorité des Marchés Financiers (AMF). Where an analyst of UBS Securities France S.A. has contributed to this report, the report is also deemed to have been prepared by UBS Securities France S.A. Germany: Prepared by UBS Limited and distributed by UBS Limited and UBS Deutschland AG. UBS Deutschland AG is regulated by the Bundesanstalt fur Finanzdienstleistungsaufsicht (BaFin). Spain: Prepared by UBS Limited and distributed by UBS Limited and UBS Securities España SV, SA. UBS Securities España SV, SA is regulated by the Comisión Nacional del Mercado de Valores (CNMV). Turkey: Prepared by UBS Menkul Degerler AS on behalf of and distributed by UBS Limited. Russia: Prepared and distributed by UBS Securities CJSC. Switzerland: Distributed by UBS AG to persons who are institutional investors only. Italy: Prepared by UBS Limited and distributed by UBS Limited and UBS Italia Sim S.p.A.. UBS Italia Sim S.p.A. is regulated by the Bank of Italy and by the Commissione Nazionale per le Società e la Borsa (CONSOB). Where an analyst of UBS Italia Sim S.p.A. has contributed to this report, the report is also deemed to have been prepared by UBS Italia Sim S.p.A.. South Africa: UBS South Africa (Pty) Limited (Registration No. 1995/011140/07) is a member of the JSE Limited, the South African Futures Exchange and the Bond Exchange of South Africa. UBS South Africa (Pty) Limited is an authorised Financial Services Provider. Details of its postal and physical address and a list of its directors are available on request or may be accessed at http:www.ubs.co.za. United States: Distributed to US persons by either UBS Securities LLC or by UBS Financial Services Inc., subsidiaries of UBS AG; or by a group, subsidiary or affiliate of UBS AG that is not registered as a US broker-dealer (a 'non-US affiliate'), to major US institutional investors only. UBS Securities LLC or UBS Financial Services Inc. accepts responsibility for the content of a report prepared by another non-US affiliate when distributed to US persons by UBS Securities LLC or UBS Financial Services Inc. All transactions by a US person in the securities mentioned in this report must be effected through UBS Securities LLC or UBS Financial Services Inc., and not through a non-US affiliate. Canada: Distributed by UBS Securities Canada Inc., a subsidiary of UBS AG and a member of the principal Canadian stock exchanges & CIPF. A statement of its financial condition and a list of its directors and senior officers will be provided upon request. Hong Kong: Distributed by UBS Securities Asia Limited. Singapore: Distributed by UBS Securities Pte. Ltd [mica (p) 039/11/2009 and Co. Reg. No.: 198500648C] or UBS AG, Singapore Branch. Please contact UBS Securities Pte Ltd, an exempt financial advisor under the Singapore Financial Advisers Act (Cap. 110); or UBS AG Singapore branch, an exempt financial adviser under the Singapore Financial Advisers Act (Cap. 110) and a wholesale bank licensed under the Singapore Banking Act (Cap. 19) regulated by the Monetary Authority of Singapore, in respect of any matters arising from, or in connection with, the analysis or report. The recipient of this report represent and warrant that they are accredited and institutional investors as defined in the Securities and Futures Act (Cap. 289). Japan: Distributed by UBS Securities Japan Ltd to institutional investors only. Where this report has been prepared by UBS Securities Japan Ltd, UBS Securities Japan Ltd is the author, publisher and distributor of the report. Australia: Distributed by UBS AG (Holder of Australian Financial Services License No. 231087) and UBS Securities Australia Ltd (Holder of Australian Financial Services License No. 231098) only to 'Wholesale' clients as defined by s761G of the Corporations Act 2001. New Zealand: Distributed by UBS New Zealand Ltd. An investment adviser and investment broker disclosure statement is available on request and free of charge by writing to PO Box 45, Auckland, NZ. Dubai: The research prepared and distributed by UBS AG Dubai Branch, is intended for Professional Clients only and is not for further distribution within the United Arab Emirates. Korea: Distributed in Korea by UBS Securities Pte. Ltd., Seoul Branch. This report may have been edited or contributed to from time to time by affiliates of UBS Securities Pte. Ltd., Seoul Branch. Malaysia: This material is authorized to be distributed in Malaysia by UBS Securities Malaysia Sdn. Bhd (253825-x).India : Prepared by UBS Securities India Private Ltd. 2/F,2 North Avenue, Maker Maxity, Bandra Kurla Complex, Bandra (East), Mumbai (India) 400051. Phone: +912261556000 SEBI Registration Numbers: NSE (Capital Market Segment): INB230951431 , NSE (F&O Segment) INF230951431, BSE (Capital Market Segment) INB010951437. The disclosures contained in research reports produced by UBS Limited shall be governed by and construed in accordance with English law. UBS specifically prohibits the redistribution of this material in whole or in part without the written permission of UBS and UBS accepts no liability whatsoever for the actions of third parties in this respect. Images may depict objects or elements which are protected by third party copyright, trademarks and other intellectual property rights. © UBS 2011. The key symbol and UBS are among the registered and unregistered trademarks of UBS. All rights reserved.
ab