financial overview linn-benton community college august 2, 2010
Post on 22-Dec-2015
218 views
TRANSCRIPT
Financial OverviewFinancial Overview
Linn-Benton Community Linn-Benton Community CollegeCollege
August 2, 2010August 2, 2010
Community College FinanceCommunity College Finance
More students = less $$ per studentMore students = less $$ per student How a 3% increase in taxes can How a 3% increase in taxes can
equal no additional fundsequal no additional funds 3+5=4+43+5=4+4 National and Oregon economies slow National and Oregon economies slow
recovery = A new normalrecovery = A new normal

Micro EconomicsMicro Economics
Cows –B/E 3 yearsCows –B/E 3 years Pigs – B/E 2 yearsPigs – B/E 2 years Sheep- B/E 1 yearSheep- B/E 1 year OptionsOptions
Stay sameStay same Finance growth Finance growth
“pay as you go”“pay as you go” Finance growth Finance growth
with borrowingwith borrowing

Micro Economics-The CommonsMicro Economics-The Commons

Macro Economics- Macro Economics- The CommonsThe Commons
Macro FinanceMacro Finance

Distribution formulaDistribution formulaThe CCSF “Commons”The CCSF “Commons”
A B C
Calculation of Amount Available per FTE:
CC Support Fund
Available = $218,864,080.24
Property Taxes Available
= $135,465,104.00
Total Available = $354,329,184.24
Total Amount for Base = $14,064,684.73
Available for FTE
Distribution = $340,264,499.51
Equity Available per FTE
= $3664.99
TOTAL Available per
FTE = $3,664.99
Base Amount = $720.00

Distribution formulaDistribution formulaA B C F G I J
CollegeWeighted
Average FTE Preliminary
Base Payment
Final College Size
Factor
Final Base Payment with
Size Adjustment
Factor
Prelim TPR (W/out Base) at 100%
EquityPrelim Total TPR (W/Base)
at 100% Equity
Blue Mountain 2,090.95 $792,000.00 1.1347 $898,682.40 $7,663,311.57 $8,561,993.97
Central 4,254.76 $792,000.00 1.0027 $794,138.40 $15,593,675.44 $16,387,813.84
Chemeketa 10,962.02 $792,000.00 1.0000 $792,000.00 $40,175,734.83 $40,967,734.83
Clackamas 7,489.32 $792,000.00 1.0000 $792,000.00 $27,448,288.74 $28,240,288.74
Clatsop 1,360.89 $792,000.00 1.2062 $955,310.40 $4,987,657.96 $5,942,968.36
Columbia Gorge 995.86 $754,510.39 1.2784 $964,566.08 $3,649,827.71 $4,614,393.79
Klamath 1,404.09 $792,000.00 1.2062 $955,310.40 $5,145,995.94 $6,101,306.34
Lane 11,798.39 $792,000.00 1.0000 $792,000.00 $43,241,005.69 $44,033,005.69
Linn Benton 6,563.69 $792,000.00 1.0000 $792,000.00 $24,055,892.58 $24,847,892.58
Mt. Hood 8,725.18 $792,000.00 1.0000 $792,000.00 $31,977,738.42 $32,769,738.42
Oregon Coast 442.60 $555,334.29 1.3513 $750,423.23 $1,622,108.42 $2,372,531.65
Portland 23,489.59 $792,000.00 1.0000 $792,000.00 $86,089,175.17 $86,881,175.17
Rogue 4,537.65 $792,000.00 1.0027 $794,138.40 $16,630,463.74 $17,424,602.14
Southwestern 3,068.13 $792,000.00 1.0108 $800,553.60 $11,244,660.98 $12,045,214.58
Tillamook Bay 344.01 $519,843.28 1.3513 $702,464.22 $1,260,790.89 $1,963,255.11 Treasure Valley 1,829.47 $792,000.00 1.1347 $898,682.40 $6,704,988.68 $7,603,671.08
Umpqua 3,485.19 $792,000.00 1.0081 $798,415.20 $12,773,182.75 $13,571,597.95
Totals 92,841.79 $12,917,687.96 $14,064,684.73 $340,264,499.51 $354,329,184.24
Back to the FarmBack to the Farm
New assumptions-growth has over New assumptions-growth has over utilized the commonsutilized the commons
Not enough grass to feed everyone's Not enough grass to feed everyone's herdsherds
What was once thought to be a What was once thought to be a drought is now “climate change”drought is now “climate change”
Response must changeResponse must change

Macro FinanceMacro Finance

TPR per FTETPR per FTE
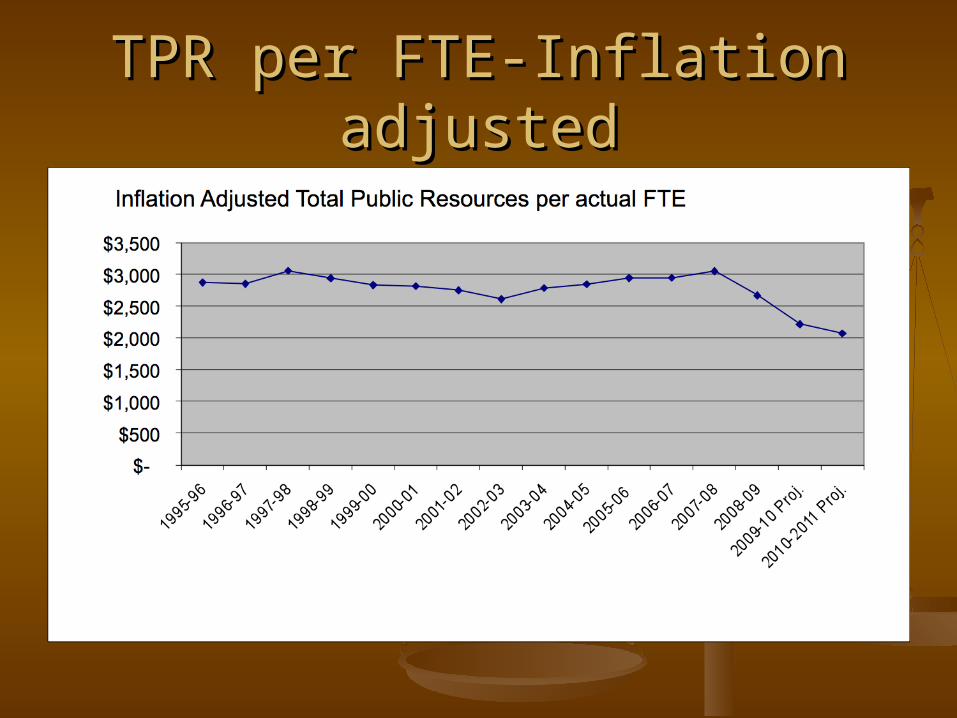
TPR per FTE-Inflation adjustedTPR per FTE-Inflation adjusted

Two sides of the coinTwo sides of the coin
Public good – Private GoodPublic good – Private Good
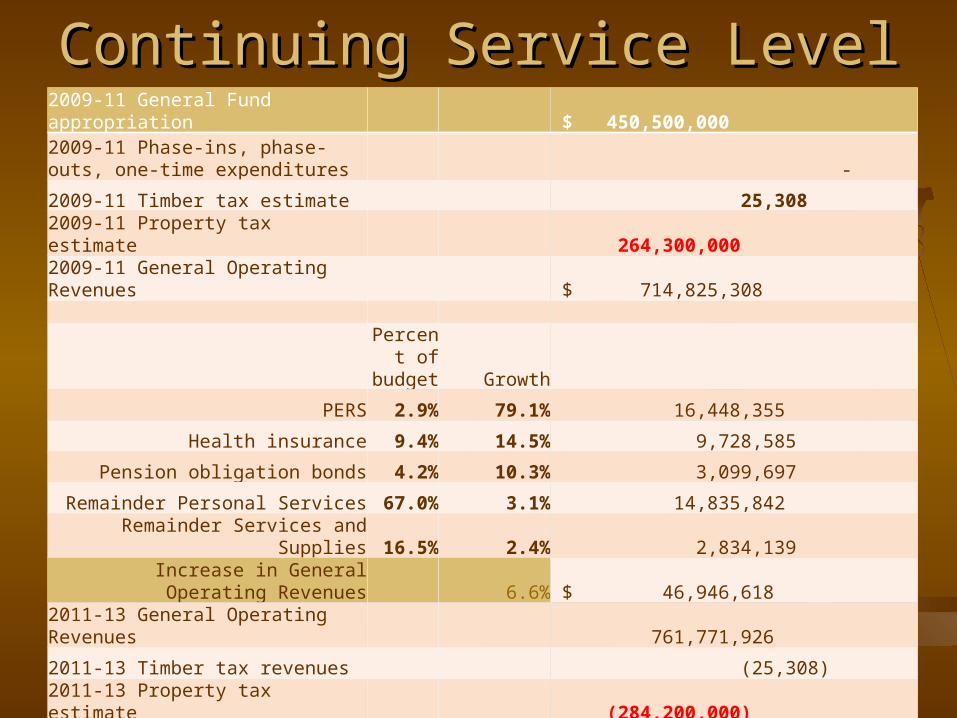
Continuing Service LevelContinuing Service Level2009-11 General Fund appropriation $ 450,500,000 2009-11 Phase-ins, phase-outs, one-time expenditures -
2009-11 Timber tax estimate 25,308
2009-11 Property tax estimate 264,300,000
2009-11 General Operating Revenues $ 714,825,308
Percent of budget Growth
PERS 2.9% 79.1% 16,448,355
Health insurance 9.4% 14.5% 9,728,585
Pension obligation bonds 4.2% 10.3% 3,099,697
Remainder Personal Services 67.0% 3.1% 14,835,842
Remainder Services and Supplies 16.5% 2.4% 2,834,139
Increase in General Operating Revenues 6.6% $ 46,946,618
2011-13 General Operating Revenues 761,771,926
2011-13 Timber tax revenues (25,308)
2011-13 Property tax estimate (284,200,000)
2011-13 Current Service Level $ 477,546,618 Increase in General Fund from 2009-11
LAB 6.0%

What is the budget?What is the budget?
General FundGeneral Fund Auxiliary FundAuxiliary Fund Special Revenue FundSpecial Revenue Fund DebtDebt Capital Projects/ReservesCapital Projects/Reserves Financial AidFinancial Aid EnterpriseEnterprise

All Funds BudgetAll Funds Budget

What about General Fund What about General Fund budget?budget?
State Community College Support State Community College Support FundFund
Property TaxesProperty Taxes TuitionTuition OtherOther
InterestInterest Transfers-InTransfers-In MiscellaneousMiscellaneous

General Fund Budget-General Fund Budget-RevenuesRevenues

General Fund Budget-General Fund Budget-ResourcesResources
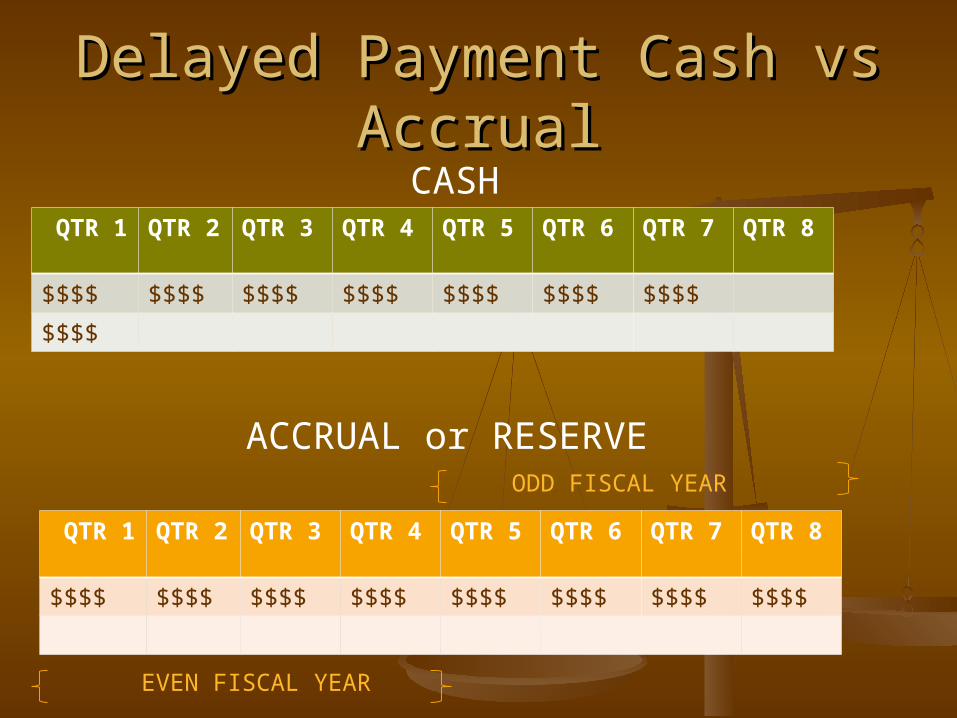
Delayed Payment Cash vs Delayed Payment Cash vs AccrualAccrual
QTR 1
QTR 2
QTR 3 QTR 4 QTR 5 QTR 6 QTR 7 QTR 8
$$$$ $$$$ $$$$ $$$$ $$$$ $$$$ $$$$ $$$$
QTR 1
QTR 2
QTR 3 QTR 4 QTR 5 QTR 6 QTR 7 QTR 8
$$$$ $$$$ $$$$ $$$$ $$$$ $$$$ $$$$
$$$$
CASH
ACCRUAL or RESERVE
EVEN FISCAL YEAR
ODD FISCAL YEAR
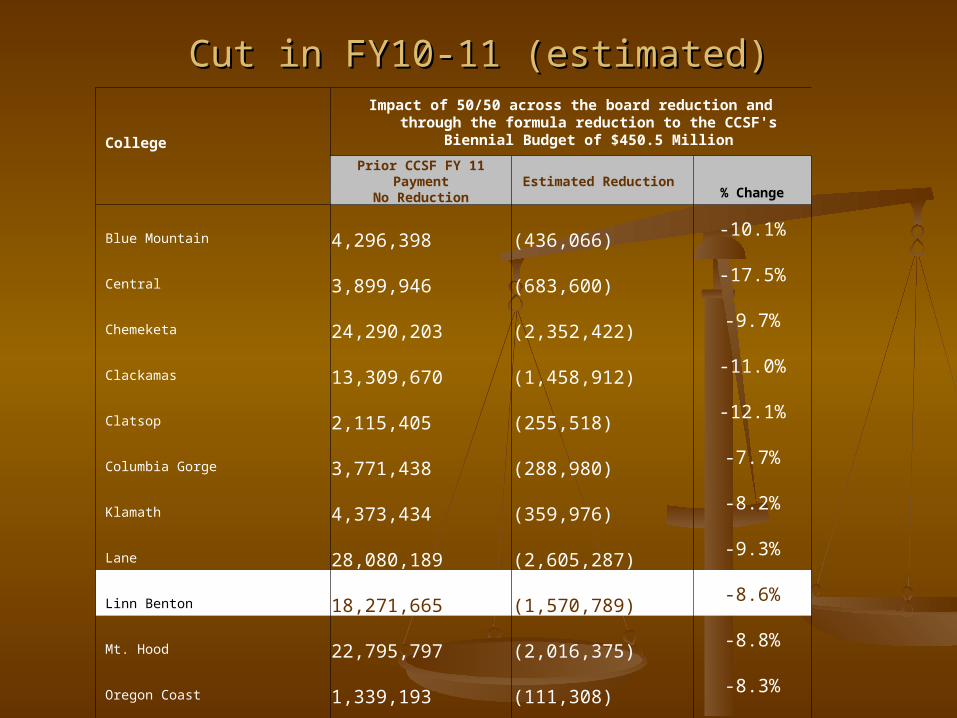
Cut in FY10-11 (estimated)Cut in FY10-11 (estimated)
College
Impact of 50/50 across the board reduction and through the formula reduction to the CCSF's Biennial Budget of $450.5
Million
Prior CCSF FY 11 Payment
No ReductionEstimated Reduction
% Change
Blue Mountain 4,296,398 (436,066) -10.1%
Central 3,899,946 (683,600) -17.5%
Chemeketa 24,290,203 (2,352,422) -9.7%
Clackamas 13,309,670 (1,458,912) -11.0%
Clatsop 2,115,405 (255,518) -12.1%Columbia Gorge 3,771,438 (288,980) -7.7%
Klamath 4,373,434 (359,976) -8.2%
Lane 28,080,189 (2,605,287) -9.3%Linn Benton 18,271,665 (1,570,789) -8.6%
Mt. Hood 22,795,797 (2,016,375) -8.8%
Oregon Coast 1,339,193 (111,308) -8.3%
Portland 60,537,114 (5,400,500) -8.9%
Rogue 6,262,662 (809,022) -12.9%
Southwestern Oregon 6,923,937 (662,975) -9.6%
Tillamook Bay 893,350 (79,163) -8.9%
Treasure Valley 5,869,440 (476,649) -8.1%
Umpqua 10,664,595 (880,579) -8.3%
Total 217,694,437 $ (20,448,120) -9.4%

August 2008 PlanningAugust 2008 Planning
Revenues (Excluding Beginning Balance) and ExpendituresENDING FUND BALANCE
0
4,000,000
8,000,000
12,000,000
16,000,000
20,000,000
24,000,000
28,000,000
32,000,000
36,000,000
40,000,000
44,000,000
48,000,000
52,000,000
2003-04
2004-05
2005-06
2006-07
2007-08
2008-09
2009-10
2010-11
2011-12
2012-13
REVENUE
EXPENDITURES
ENDING FUND BALANCE

Why the “New Normal”Why the “New Normal”
National unemployment National unemployment Reported Reported 9.5%9.5% Estimated when adding discouraged Estimated when adding discouraged 16%16%
Labor ForceLabor Force Grows Grows 120,000120,000 per month per month Private Sector adding Private Sector adding 140,00140,000 jobs a month0 jobs a month Gap between peak and today Gap between peak and today 11,000,00011,000,000 If If 200,000200,000 jobs added per month- jobs added per month- 12 year 12 year
recoveryrecovery If jobs were added at pace of 1990’s- If jobs were added at pace of 1990’s- 4 years4 years
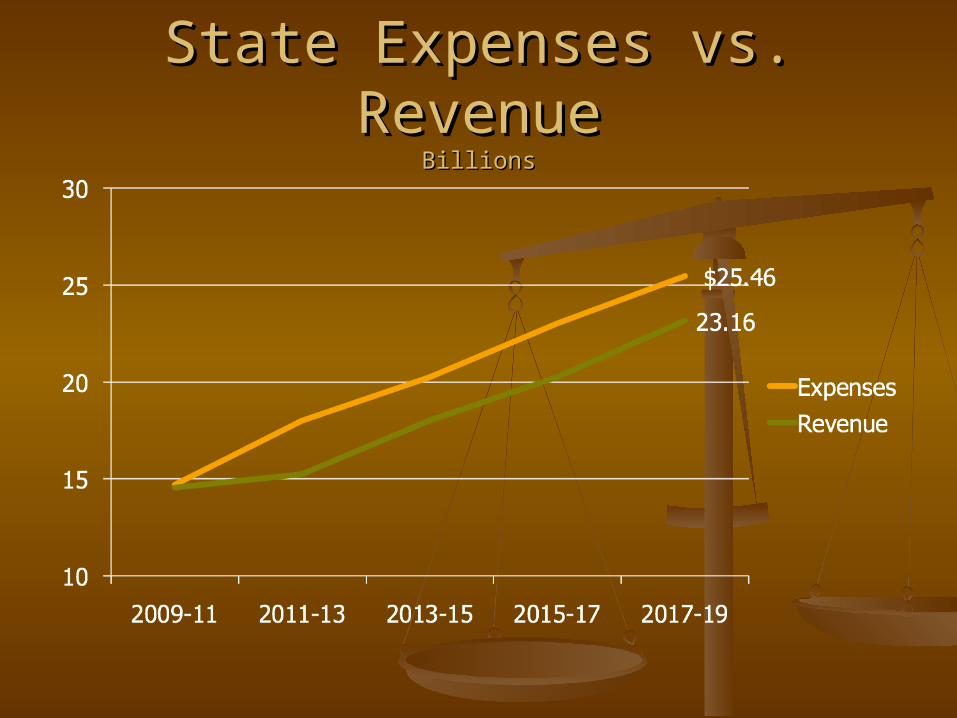
State Expenses vs. RevenueState Expenses vs. RevenueBillionsBillions

Values, Commitments and Values, Commitments and Strategic planStrategic plan
Create opportunities for Create opportunities for success-success-ValueValue
Ability to respond to Ability to respond to emerging needs-emerging needs-Strategic Strategic PlanPlan
ResultsResults Ability to respond to Ability to respond to
opportunitiesopportunities Flexibility & shifting Flexibility & shifting
resourcesresources
Excess budget capacityExcess budget capacity Dedicated to Growth-Dedicated to Growth-
Instruction-Instruction-paypay as you as you gogo
Designated Contingency-Designated Contingency-General Fund-General Fund-oneone time time $1.1M FY1011$1.1M FY1011
Auxiliary Revenue Auxiliary Revenue Program-Program-paypay as you goas you go
Special Revenue Special Revenue Program- Program- pay as you gopay as you go

Values, Commitments and Values, Commitments and Strategic planStrategic plan Create fiscal, physical, and Create fiscal, physical, and
social environments that social environments that support student success support student success and a positive workplace and a positive workplace climate.-climate.-CommitmentCommitment
Diversify and expand Diversify and expand revenue sources, while revenue sources, while maintaining conservative maintaining conservative spending practices.spending practices.--Strategic PlanStrategic Plan
ResultsResults PhysicalPhysical
Madrone HallMadrone Hall White Oak HallWhite Oak Hall Parking ImprovementsParking Improvements
FiscalFiscal Overall decline in General Overall decline in General
Fund and grant revenuesFund and grant revenues Spent over 100% of GF Spent over 100% of GF
salary budget in FY10salary budget in FY10 Shift of cost from state to Shift of cost from state to
studentstudent Drew down reservesDrew down reserves Cost per FTE is declining Cost per FTE is declining
BubbleBubble

Grant and Contracts RevenueGrant and Contracts Revenue

Grant and contract RevenuesGrant and contract RevenuesDiversify SourcesDiversify Sources
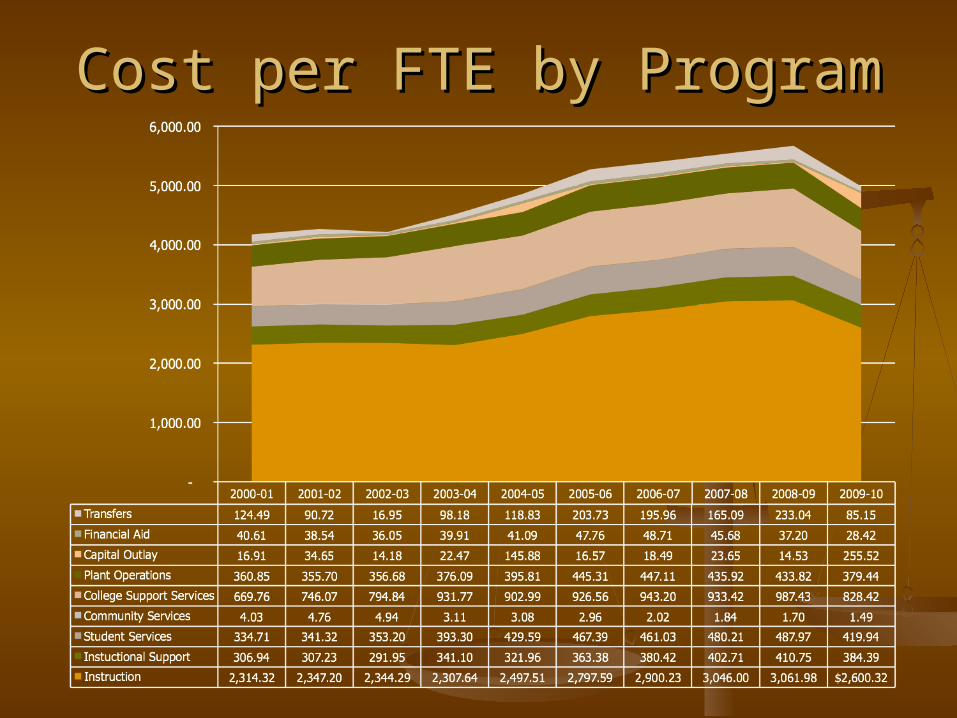
Cost per FTE by ProgramCost per FTE by Program

Values, Commitments and Values, Commitments and Strategic planStrategic plan Any available resources Any available resources
should first be invested in should first be invested in efforts related to the efforts related to the strategic plan.strategic plan.
ResultsResults
FY10-11 InvestmentsFY10-11 Investments Learners Learners -$100K-$100K
First year experienceFirst year experience AdvisingAdvising AssessmentAssessment Special accreditationSpecial accreditation
EnrollmentEnrollment On-line services On-line services
improvement improvement -$150K-$150K RevenueRevenue
Bond election planning Bond election planning and architectural and architectural development development -$100K-$100K