financial management: lecture 7 free cash flows in finance calculate future cash flows
TRANSCRIPT
Financial management: lecture 7
Free Cash Flows in Finance
Calculate future cash flows
Financial management: lecture 7
Today’s agenda
Review what we have learned in the last week
How to calculate the cash flows in the future
Financial management: lecture 7
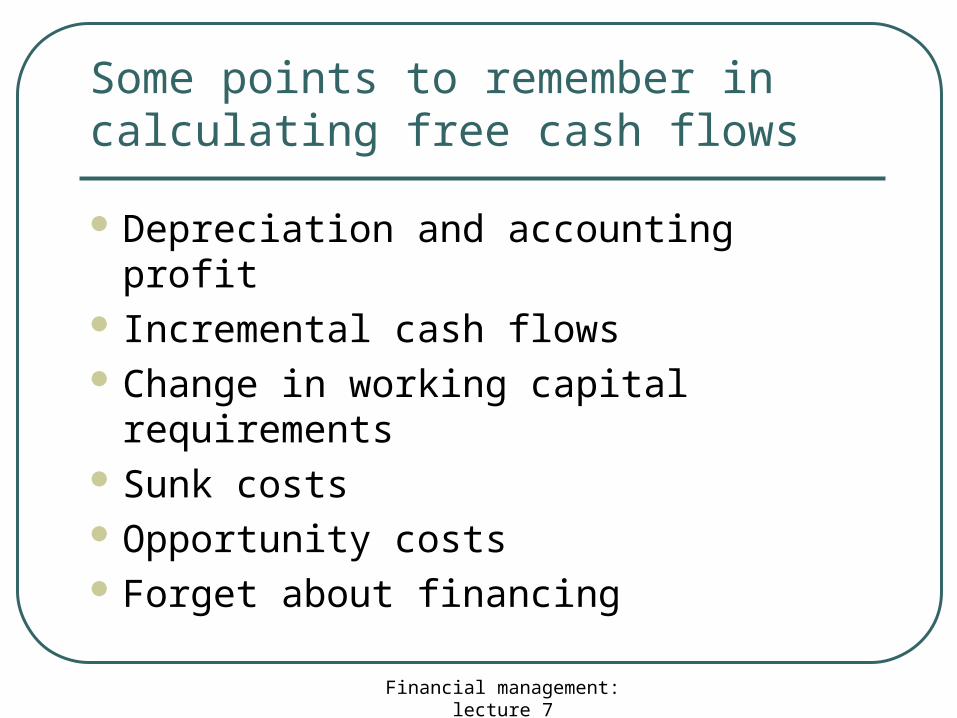
Some points to remember in calculating free cash flows
Depreciation and accounting profit Incremental cash flows Change in working capital requirements Sunk costs Opportunity costs Forget about financing
Financial management: lecture 7
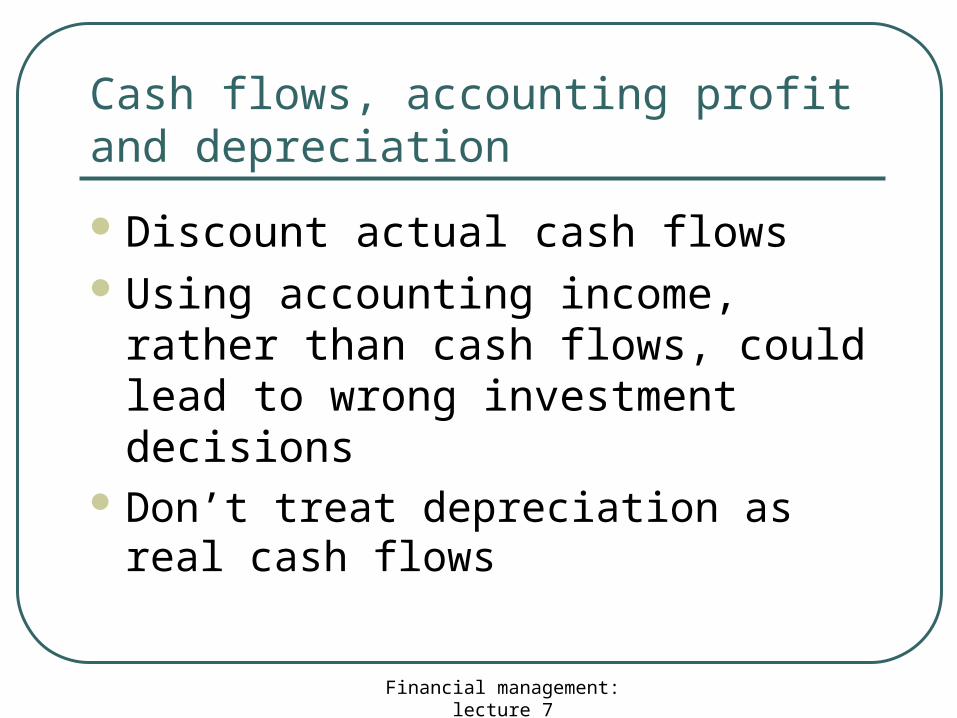
Cash flows, accounting profit and depreciation
Discount actual cash flows Using accounting income, rather than
cash flows, could lead to wrong investment decisions
Don’t treat depreciation as real cash flows
Financial management: lecture 7
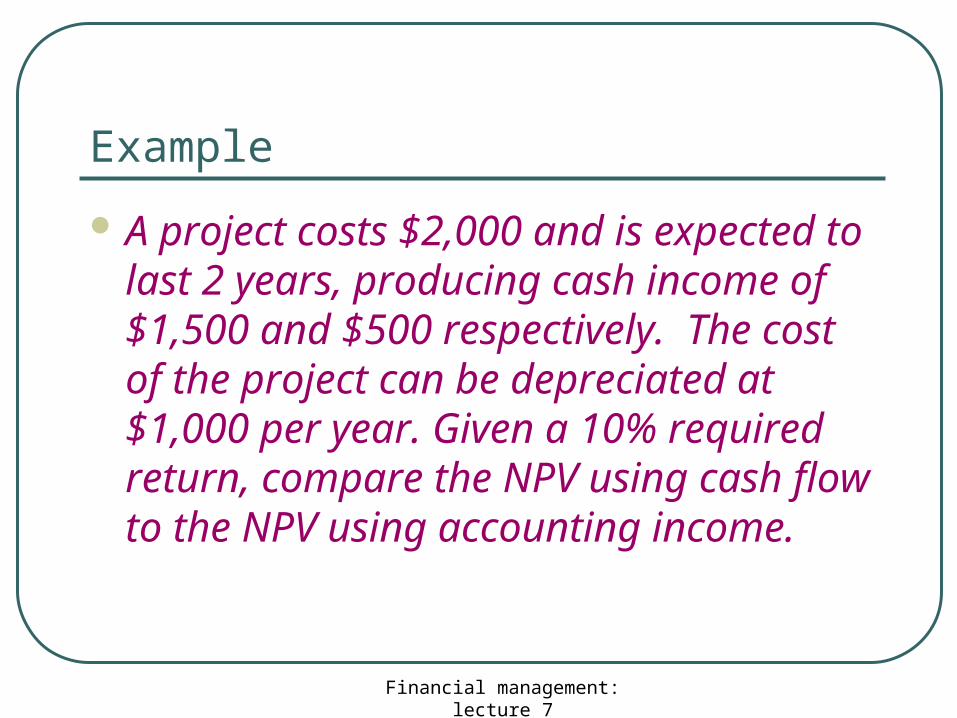
Example
A project costs $2,000 and is expected to last 2 years, producing cash income of $1,500 and $500 respectively. The cost of the project can be depreciated at $1,000 per year. Given a 10% required return, compare the NPV using cash flow to the NPV using accounting income.
Financial management: lecture 7
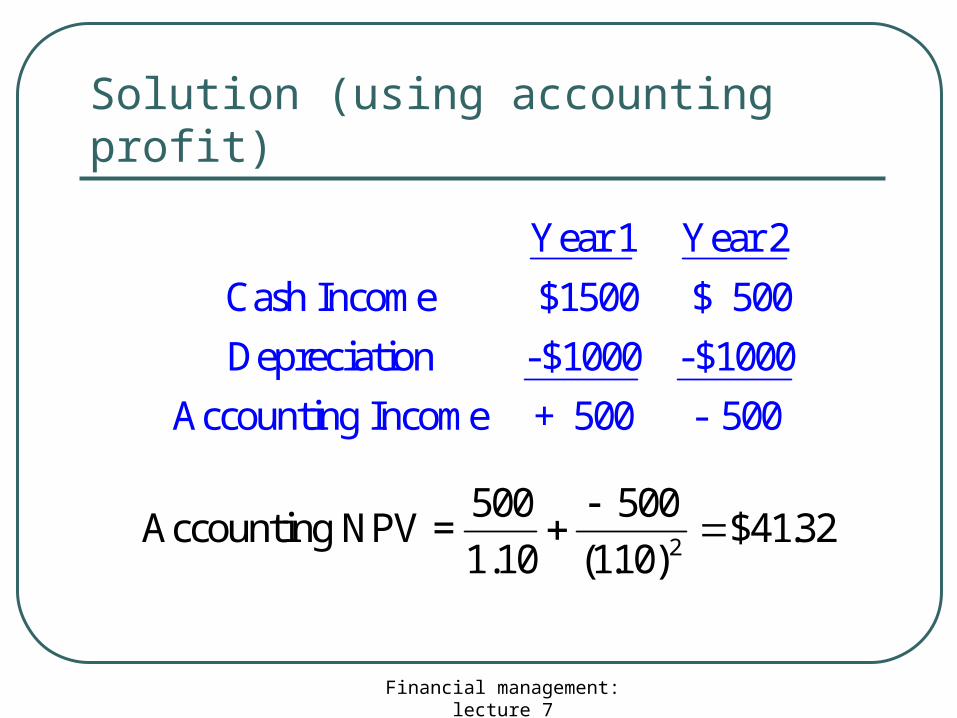
Solution (using accounting profit)
Year 1 Year 2
Cash Income $1500 $ 500
Depreciation -$1000 -$1000
Accounting Income + 500 - 500
Accounting NPV =500
1.10
500
11032
2( . )$41.
Financial management: lecture 7
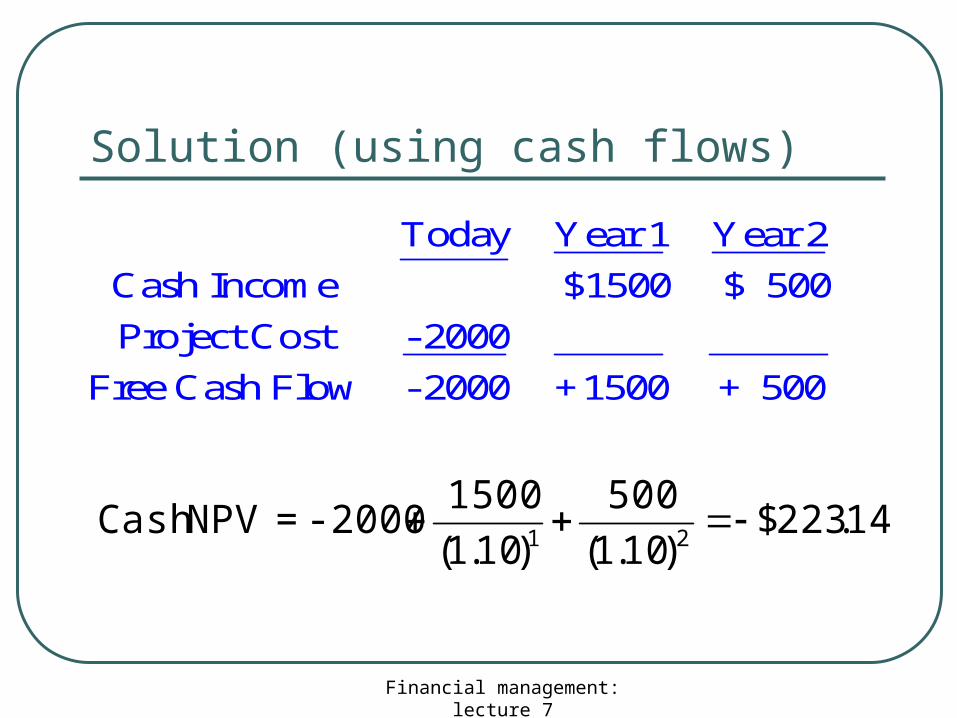
Solution (using cash flows)
Today Year 1 Year 2
Cash Income $1500 $ 500
Project Cost - 2000
Free Cash Flow - 2000 +1500 + 500
14.223$)10.1(
500
)10.1(
1500-2000=NPVCash
21
Financial management: lecture 7
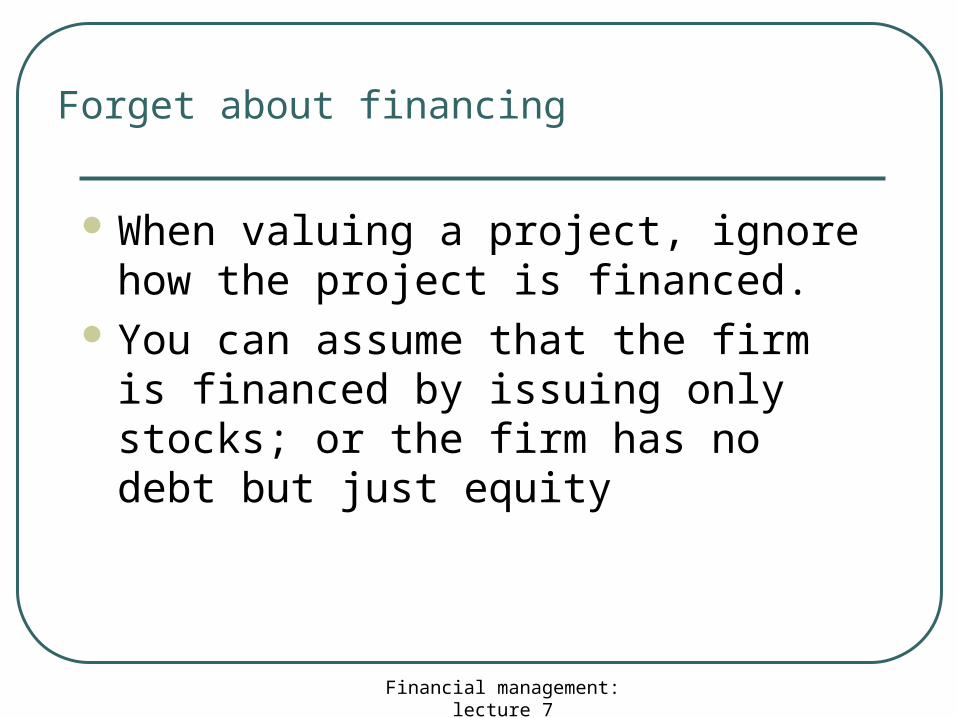
Forget about financing
When valuing a project, ignore how the project is financed.
You can assume that the firm is financed by issuing only stocks; or the firm has no debt but just equity
Financial management: lecture 7
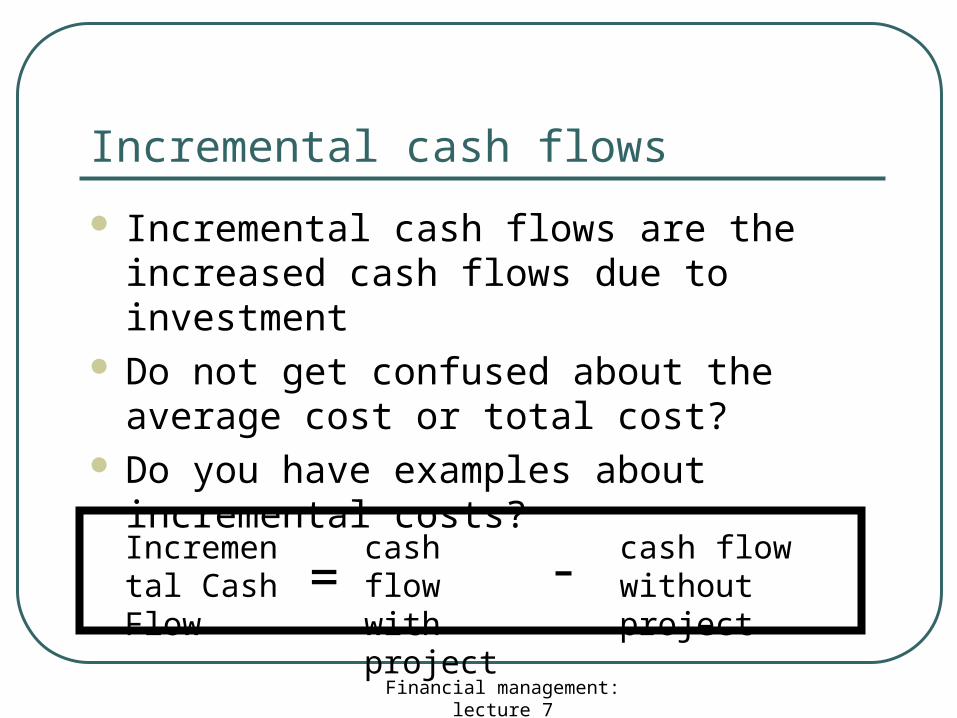
Incremental cash flows
Incremental cash flows are the increased cash flows due to investment
Do not get confused about the average cost or total cost?
Do you have examples about incremental costs?
Incremental Cash Flow
cash flow with project
cash flow without project= -
Financial management: lecture 6
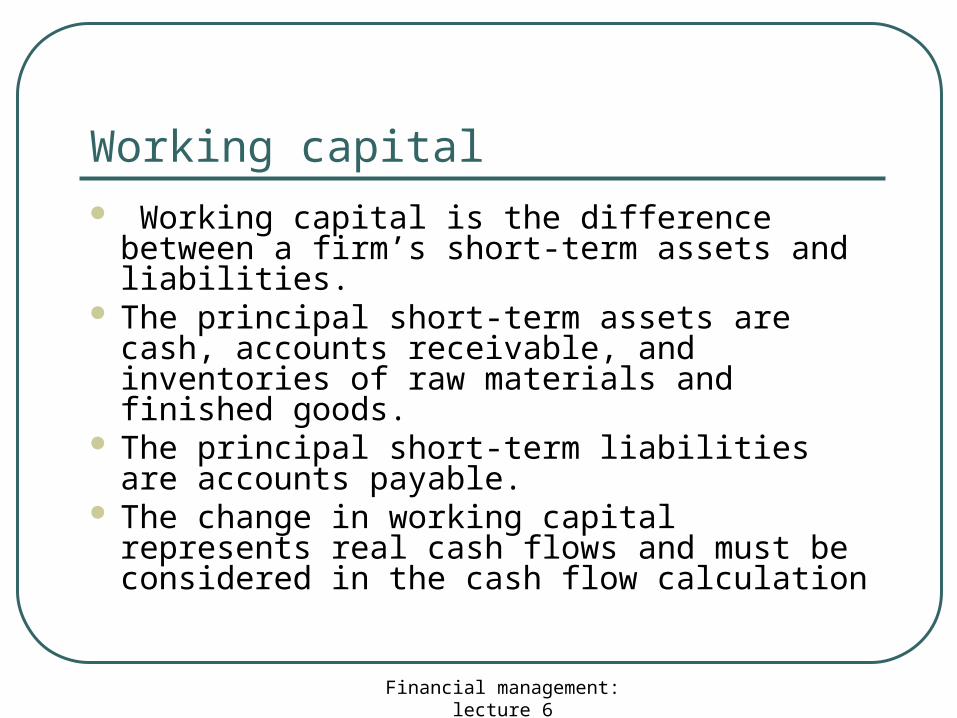
Working capital Working capital is the difference between a
firm’s short-term assets and liabilities. The principal short-term assets are cash,
accounts receivable, and inventories of raw materials and finished goods.
The principal short-term liabilities are accounts payable.
The change in working capital represents real cash flows and must be considered in the cash flow calculation
Financial management: lecture 7
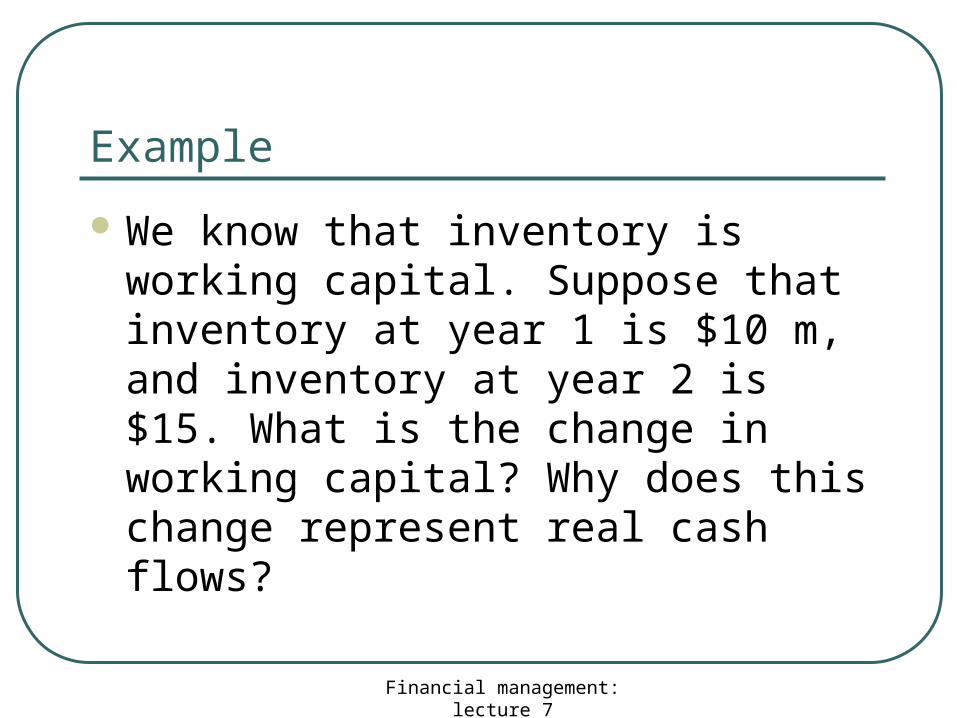
Example
We know that inventory is working capital. Suppose that inventory at year 1 is $10 m, and inventory at year 2 is $15. What is the change in working capital? Why does this change represent real cash flows?
Financial management: lecture 7
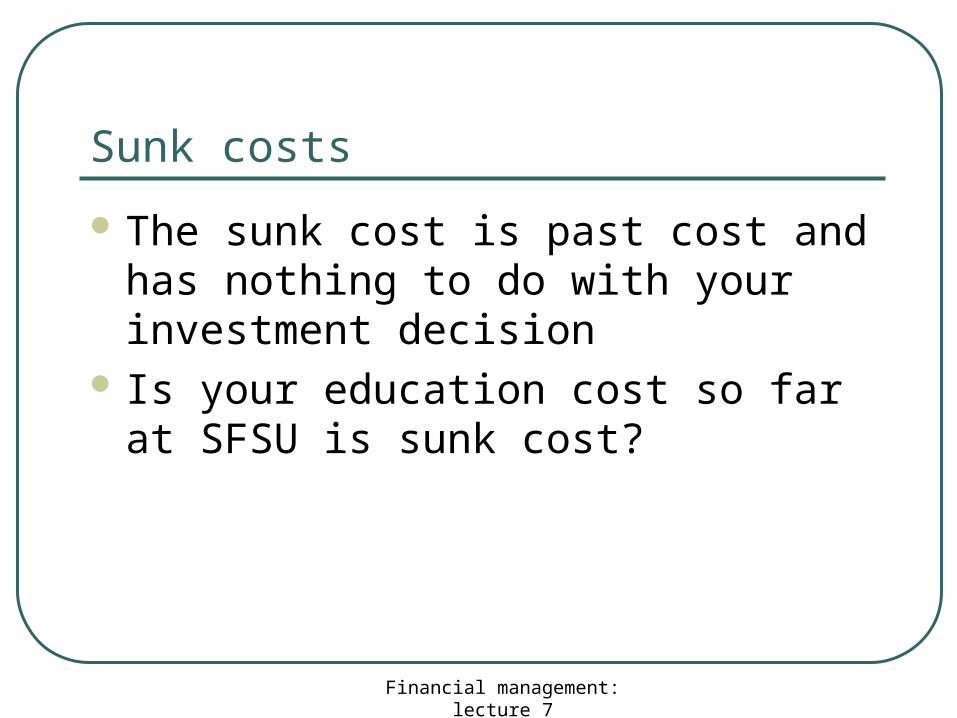
Sunk costs
The sunk cost is past cost and has nothing to do with your investment decision
Is your education cost so far at SFSU is sunk cost?
Financial management: lecture 7
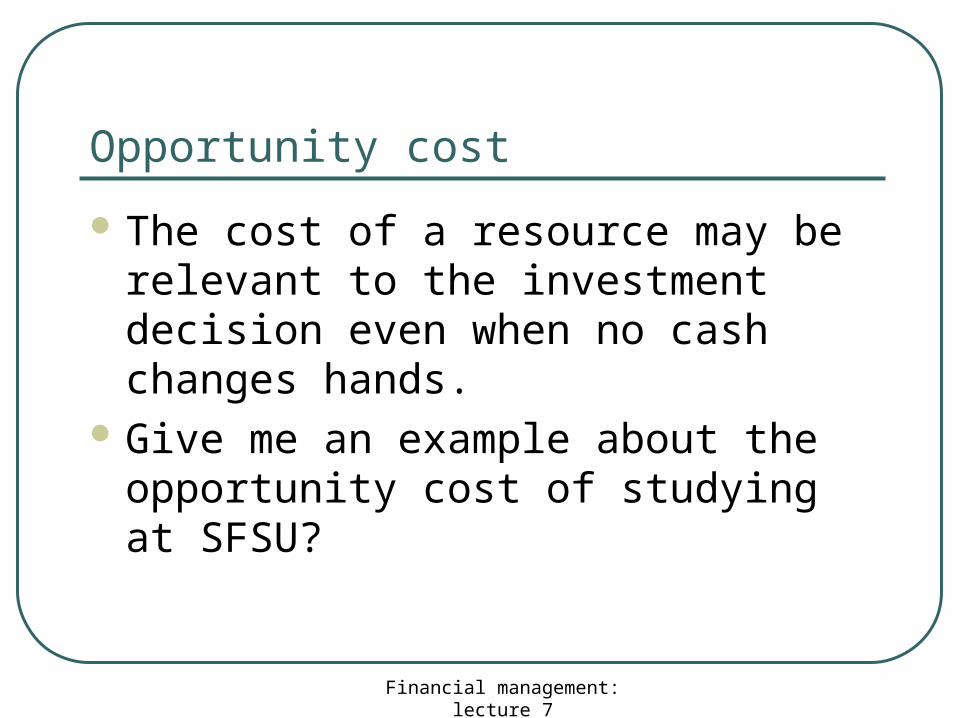
Opportunity cost
The cost of a resource may be relevant to the investment decision even when no cash changes hands.
Give me an example about the opportunity cost of studying at SFSU?
Financial management: lecture 7
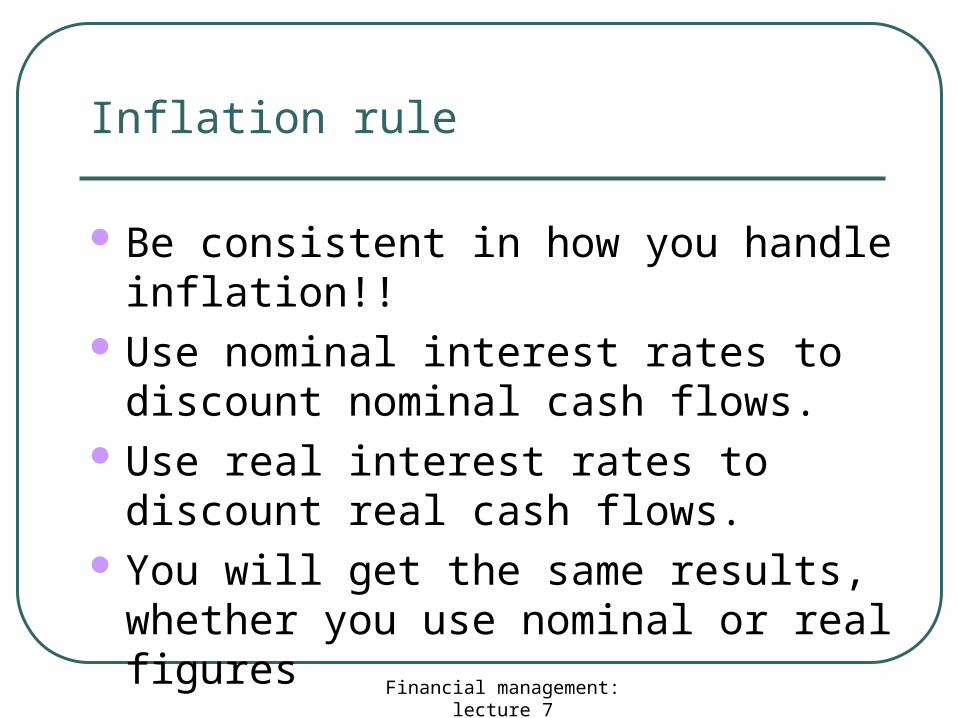
Be consistent in how you handle inflation!! Use nominal interest rates to discount
nominal cash flows. Use real interest rates to discount real cash
flows. You will get the same results, whether you
use nominal or real figures
Inflation rule
Financial management: lecture 7
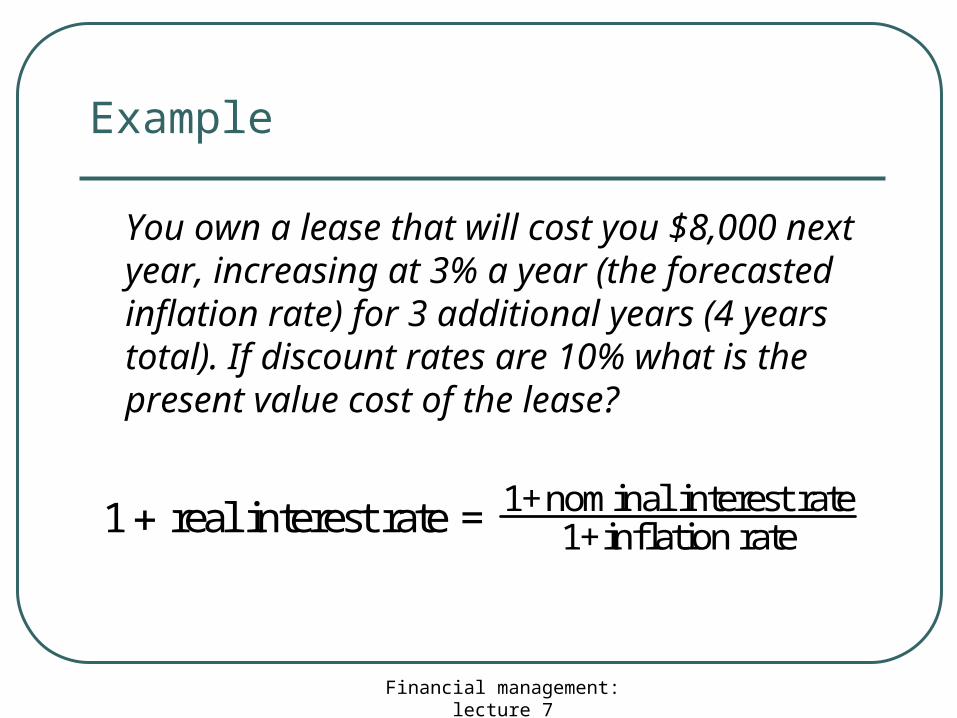
Example
You own a lease that will cost you $8,000 next year, increasing at 3% a year (the forecasted inflation rate) for 3 additional years (4 years total). If discount rates are 10% what is the present value cost of the lease?
1 real interest rate = 1+nominal interest rate1+inflation rate
Financial management: lecture 7
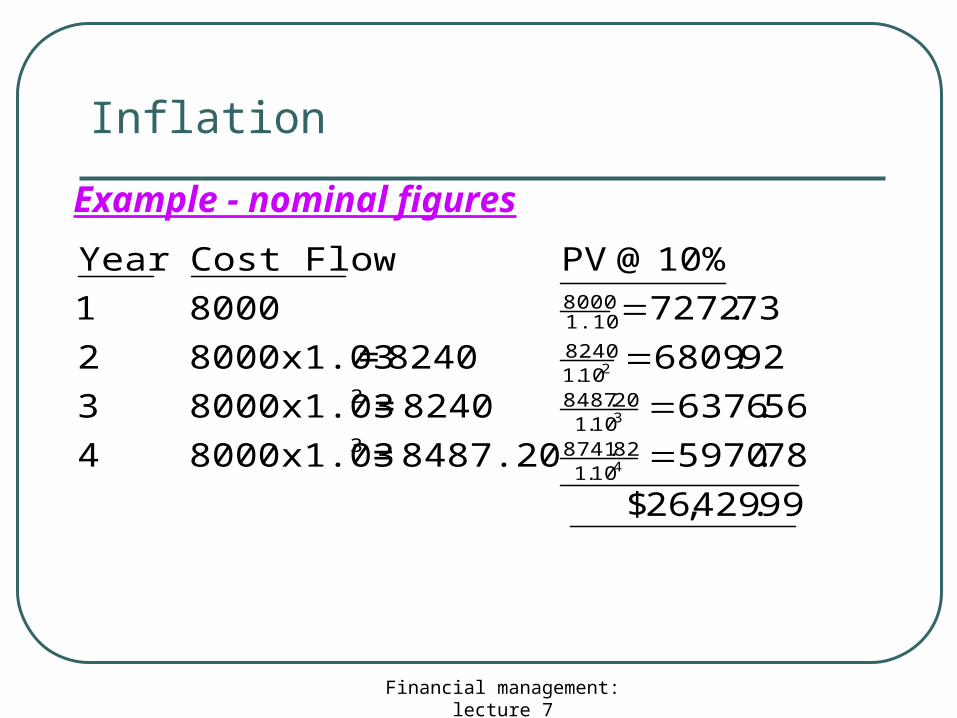
Inflation
Example - nominal figures
99.429,26$
78.59708487.20=8000x1.034
56.63768240=8000x1.033
92.68098240=8000x1.032
73.727280001
10% @ PVCost FlowYear
4
3
2
10.182.87413
10.120.84872
10.18240
1.108000
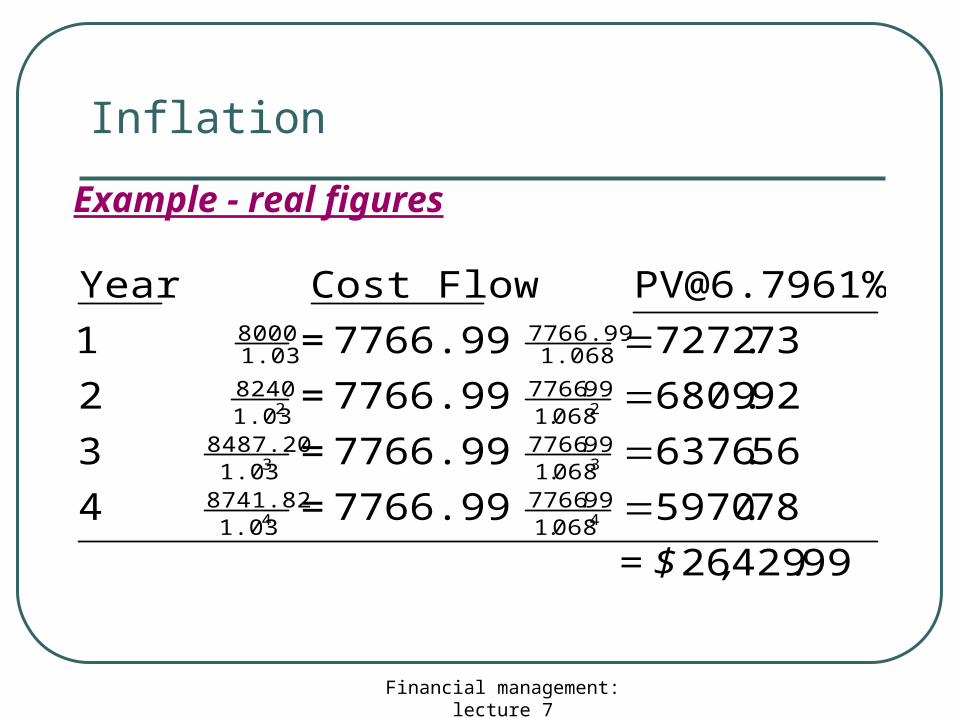
Financial management: lecture 7
Inflation
Example - real figures
9942926
78.59707766.99=4
56.63767766.99=3
92.68097766.99=2
73.72727766.99=1
[email protected]%Cost FlowYear
44
33
22
068.199.7766
1.038741.82
068.199.7766
1.038487.20
068.199.7766
1.038240
1.0687766.99
1.038000
.,= $
Financial management: lecture 7
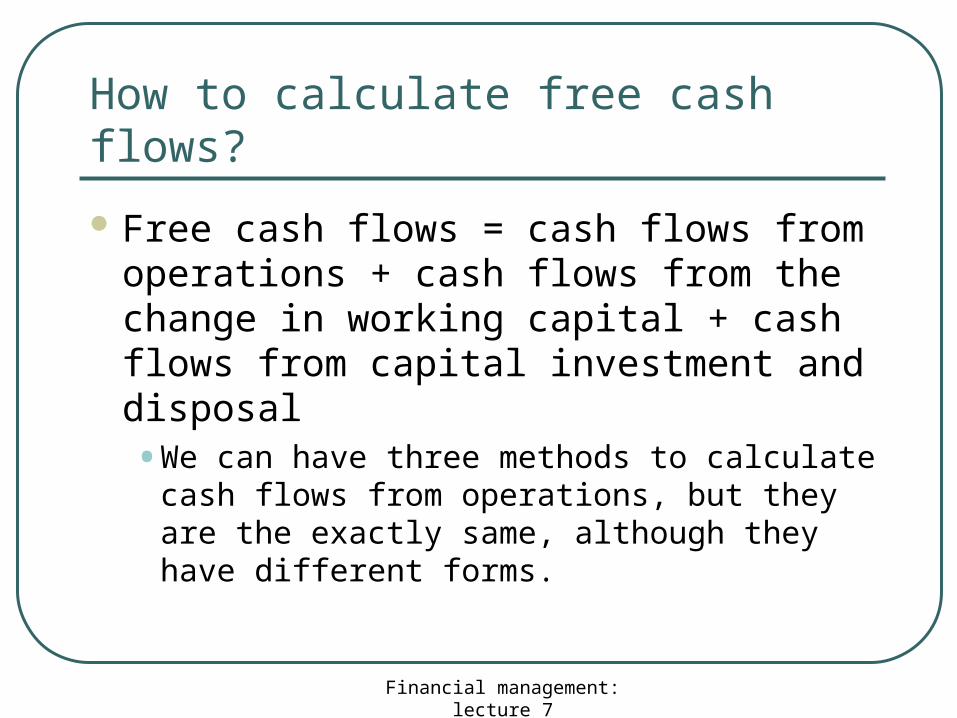
How to calculate free cash flows?
Free cash flows = cash flows from operations + cash flows from the change in working capital + cash flows from capital investment and disposal• We can have three methods to calculate cash
flows from operations, but they are the exactly same, although they have different forms.
Financial management: lecture 7
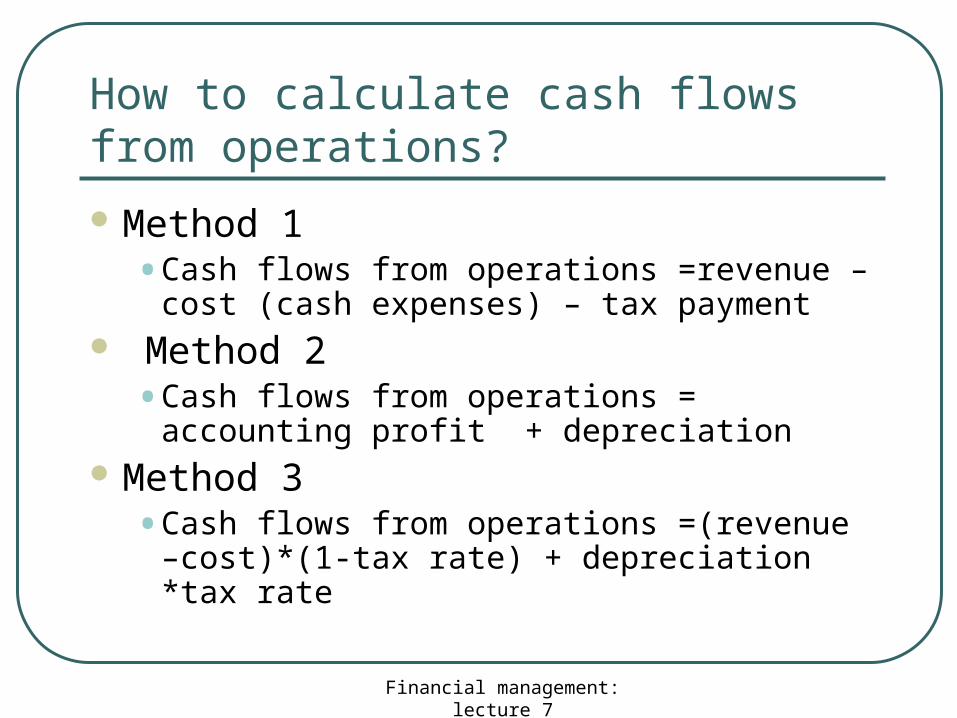
How to calculate cash flows from operations?
Method 1• Cash flows from operations =revenue –cost
(cash expenses) – tax payment Method 2
• Cash flows from operations = accounting profit + depreciation
Method 3• Cash flows from operations =(revenue –
cost)*(1-tax rate) + depreciation *tax rate
Financial management: lecture 7
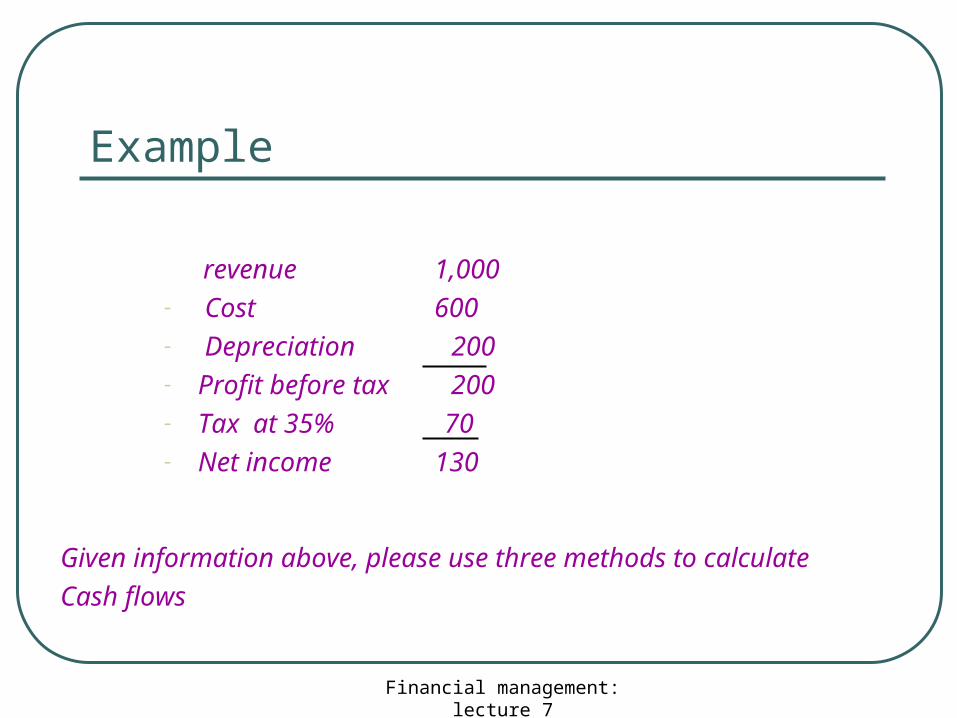
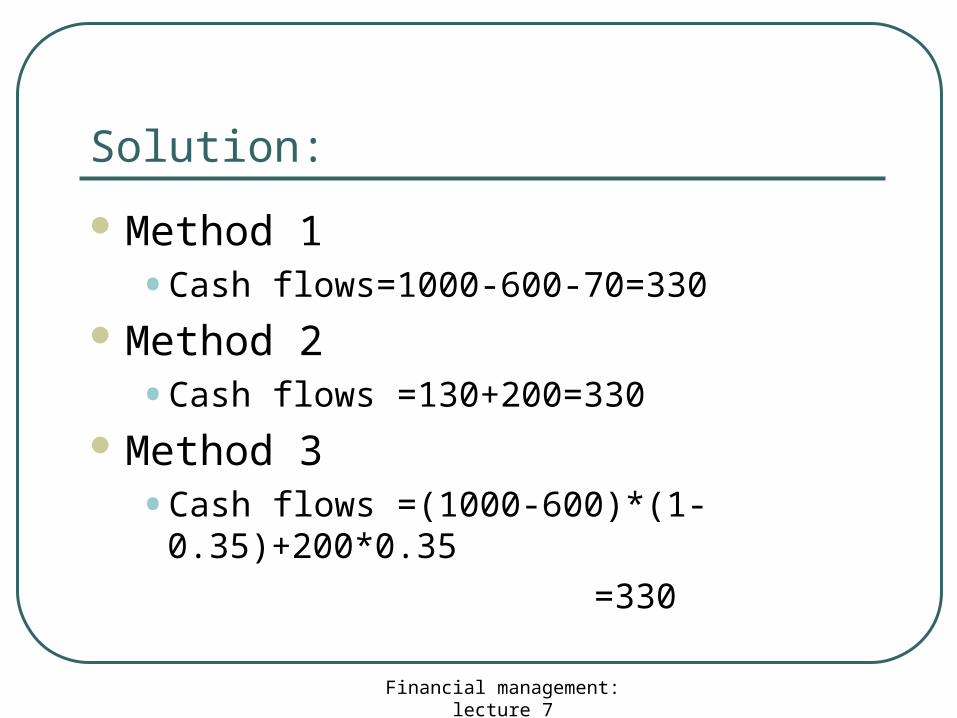
Example
revenue 1,000- Cost 600- Depreciation 200- Profit before tax 200- Tax at 35% 70 - Net income 130
Given information above, please use three methods to calculate
Cash flows
Financial management: lecture 7
Solution:
Method 1• Cash flows=1000-600-70=330
Method 2• Cash flows =130+200=330
Method 3• Cash flows =(1000-600)*(1-0.35)+200*0.35
=330
Financial management: lecture 7
A summary example ( Blooper)
Now we can apply what we have learned about how to calculate cash flows to the Blooper example, whose information is given in the following slide.
Financial management: lecture 7
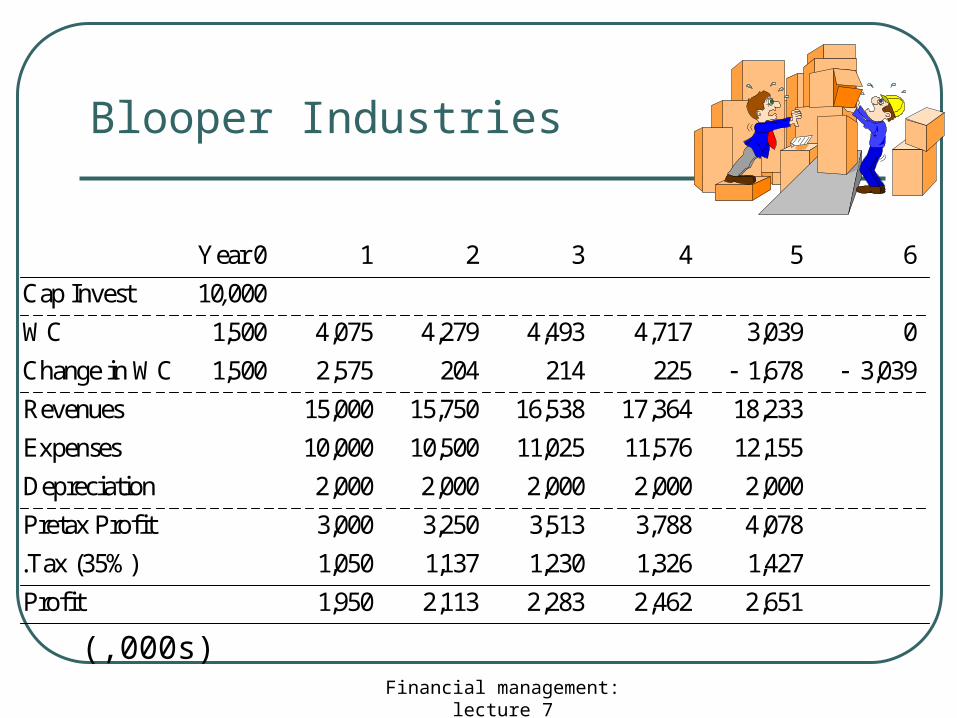
Blooper Industries
Year 0 1 2 3 4 5 6
Cap Invest
WC
Change in WC
Revenues
Expenses
Depreciation
Pretax Profit
.Tax (35%)
Profit
10 000
1 500 4 075 4 279 4 493 4 717 3 039 0
1 500 2 575 204 214 225 1 678 3 039
15 000 15 750 16 538 17 364 18 233
10 000 10 500 11 025 11 576 12 155
2 000 2 000 2 000 2 000 2 000
3 000 3 250 3 513 3 788 4 078
1 050 1137 1 230 1 326 1 427
1 950 2 113 2
,
, , , , , ,
, , , ,
, , , , ,
, , , , ,
, , , , ,
, , , , ,
, , , , ,
, ,
, , ,283 2 462 2 651
(,000s)
Financial management: lecture 7
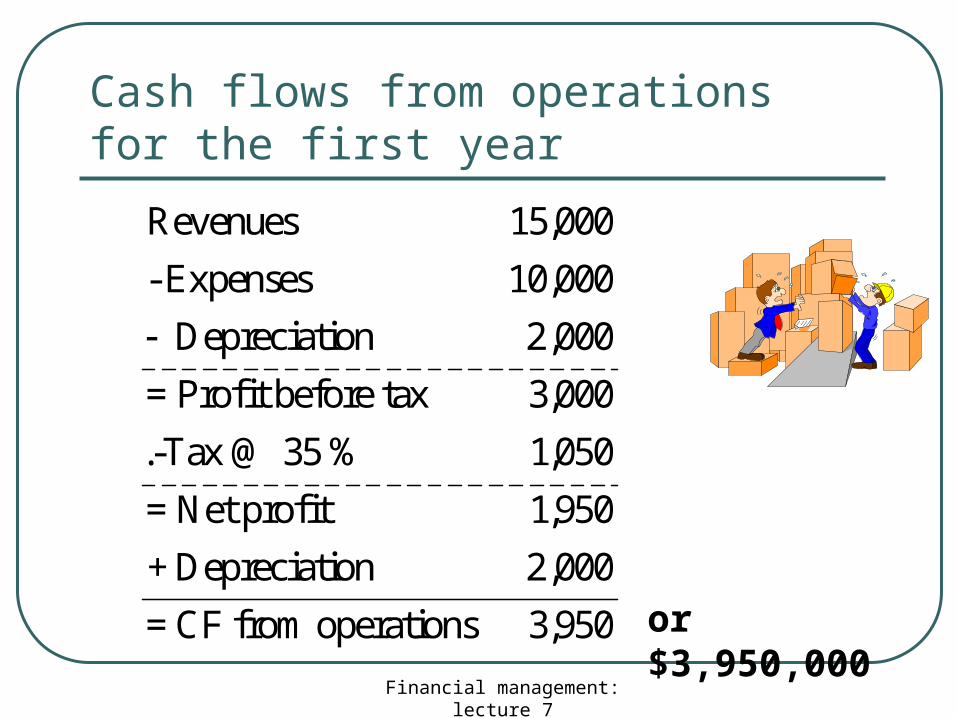
Cash flows from operations for the first year
Revenues
- Expenses
Depreciation
= Profit before tax
.-Tax @ 35 %
= Net profit
+ Depreciation
= CF from operations
15 000
10 000
2 000
3 000
1 050
1 950
2 000
3 950
,
,
,
,
,
,
,
,
or $3,950,000
Financial management: lecture 7
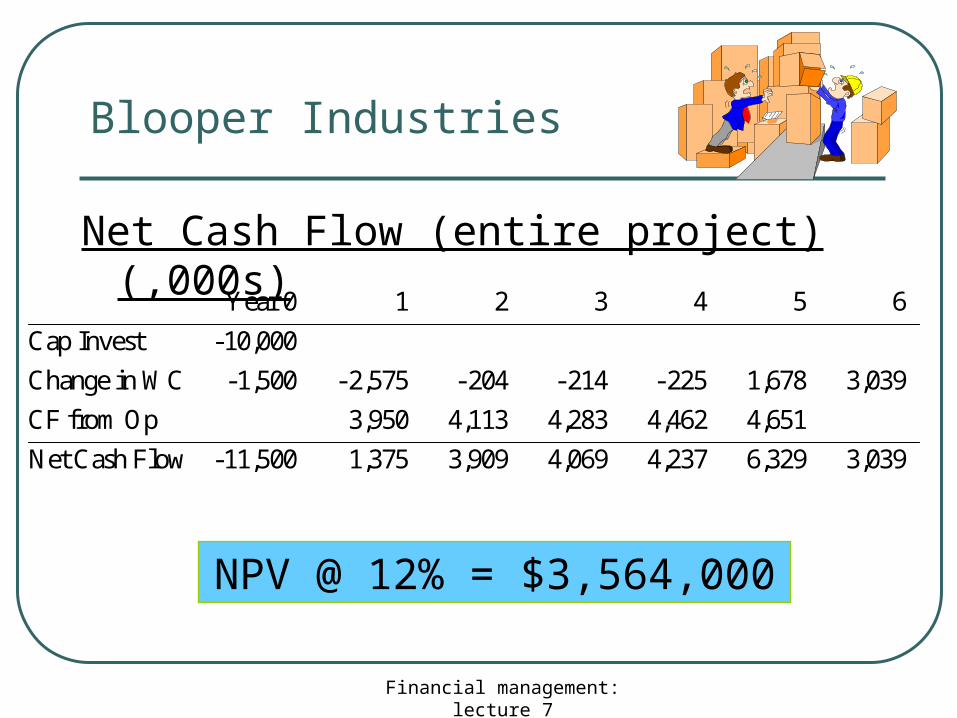
Blooper Industries
Net Cash Flow (entire project) (,000s)
Year 0 1 2 3 4 5 6
Cap Invest -10,000
Change in WC -1,500 - 2,575 - 204 - 214 - 225 1,678 3,039
CF from Op 3,950 4,113 4,283 4,462 4,651
Net Cash Flow -11,500 1,375 3,909 4,069 4,237 6,329 3,039
NPV @ 12% = $3,564,000