financial information as of 31 august 2019, unless ... investor presentationvf.pdfnb private equity...
TRANSCRIPT
NB Private Equity Partners: Overview PresentationFinancial Information as of 31 August 2019, Unless Otherwise Noted
October 2019
2NB PRIVATE EQUITY PARTNERS INVESTOR UPDATE
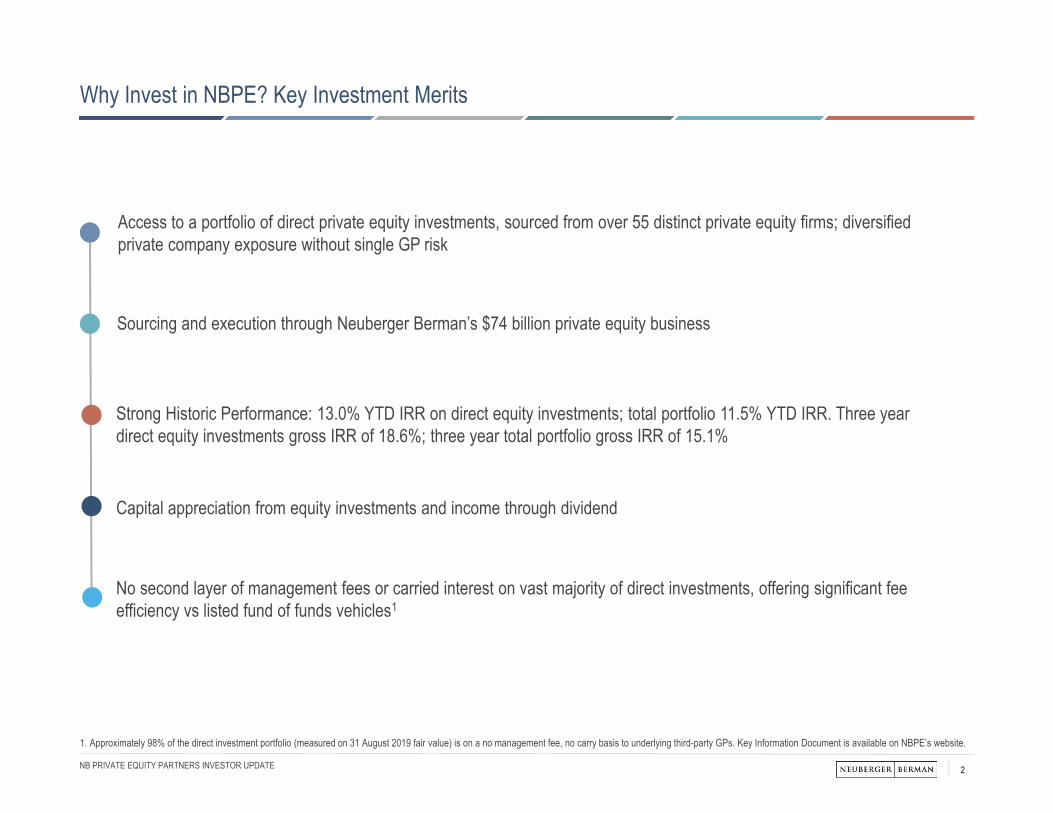
Why Invest in NBPE? Key Investment Merits
Access to a portfolio of direct private equity investments, sourced from over 55 distinct private equity firms; diversified private company exposure without single GP risk
Sourcing and execution through Neuberger Berman’s $74 billion private equity business
Capital appreciation from equity investments and income through dividend
Strong Historic Performance: 13.0% YTD IRR on direct equity investments; total portfolio 11.5% YTD IRR. Three year direct equity investments gross IRR of 18.6%; three year total portfolio gross IRR of 15.1%
No second layer of management fees or carried interest on vast majority of direct investments, offering significant fee efficiency vs listed fund of funds vehicles1
1. Approximately 98% of the direct investment portfolio (measured on 31 August 2019 fair value) is on a no management fee, no carry basis to underlying third-party GPs. Key Information Document is available on NBPE’s website.
3NB PRIVATE EQUITY PARTNERS INVESTOR UPDATE
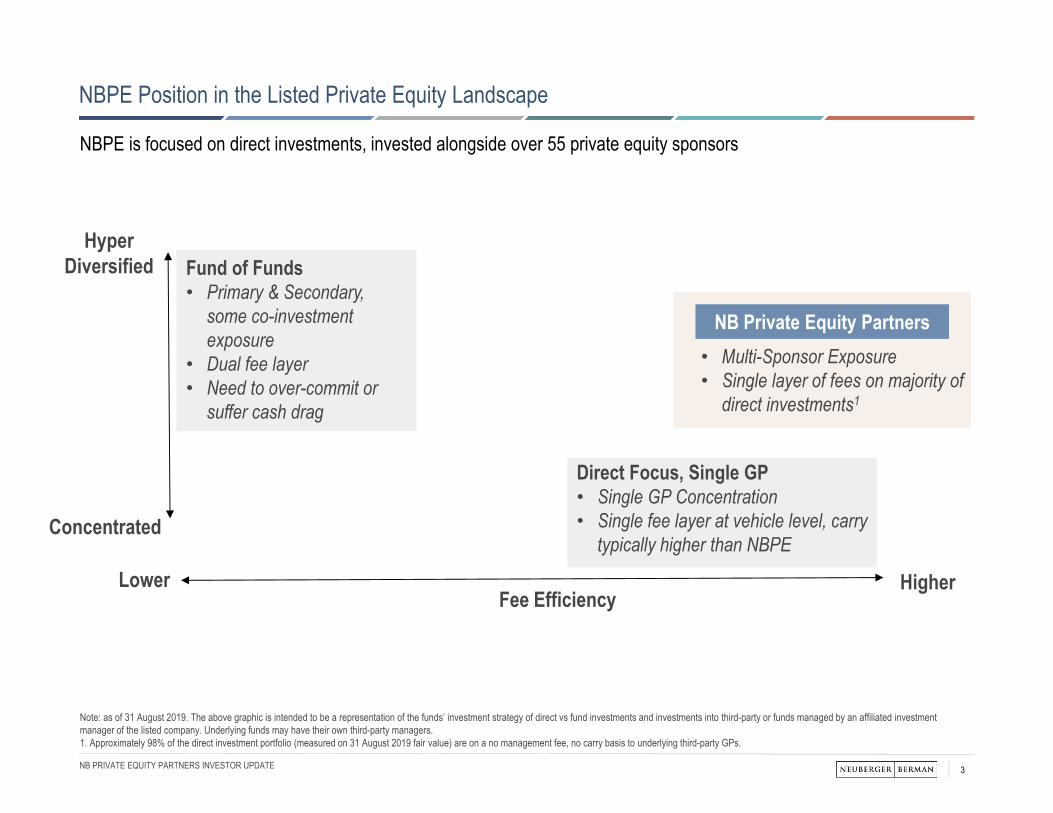
Direct Focus, Single GP• Single GP Concentration• Single fee layer at vehicle level, carry
typically higher than NBPE
HigherLower
NB Private Equity Partners• Multi-Sponsor Exposure• Single layer of fees on majority of
direct investments1
Fund of Funds• Primary & Secondary,
some co-investment exposure
• Dual fee layer• Need to over-commit or
suffer cash drag
Concentrated
Fee Efficiency
HyperDiversified
Note: as of 31 August 2019. The above graphic is intended to be a representation of the funds’ investment strategy of direct vs fund investments and investments into third-party or funds managed by an affiliated investment manager of the listed company. Underlying funds may have their own third-party managers. 1. Approximately 98% of the direct investment portfolio (measured on 31 August 2019 fair value) are on a no management fee, no carry basis to underlying third-party GPs.
NBPE Position in the Listed Private Equity Landscape
NBPE is focused on direct investments, invested alongside over 55 private equity sponsors
4NB PRIVATE EQUITY PARTNERS INVESTOR UPDATE
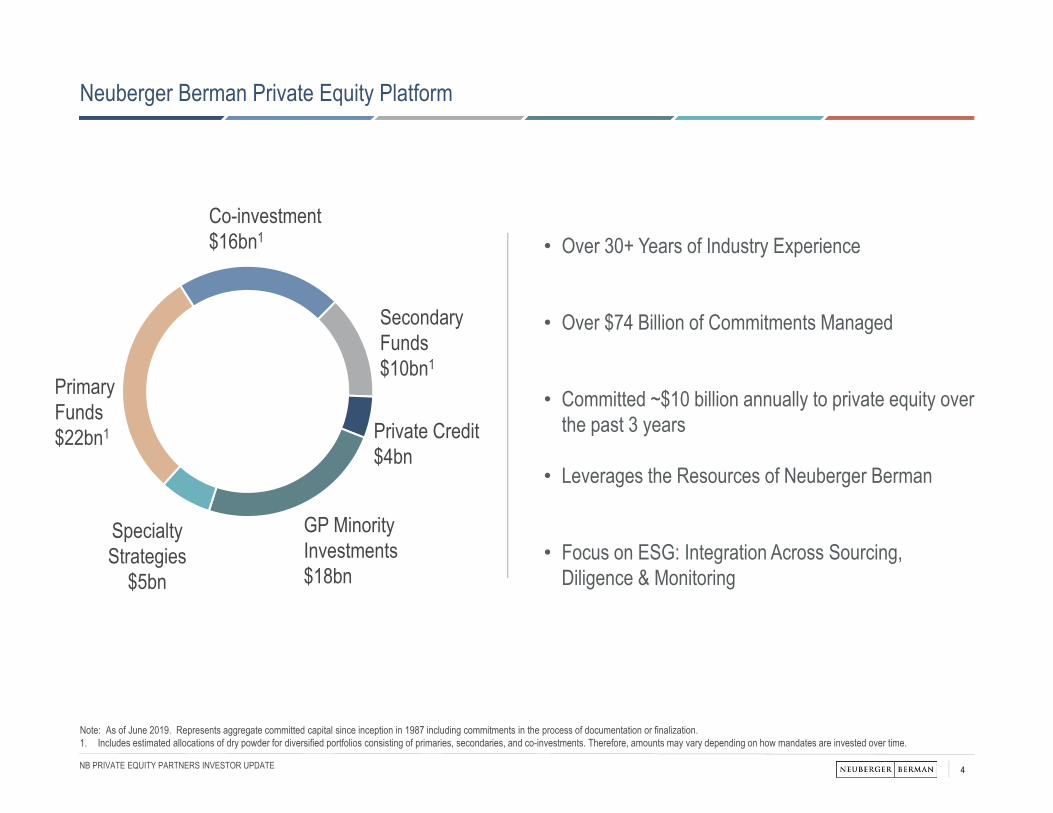
Note: As of June 2019. Represents aggregate committed capital since inception in 1987 including commitments in the process of documentation or finalization. 1. Includes estimated allocations of dry powder for diversified portfolios consisting of primaries, secondaries, and co-investments. Therefore, amounts may vary depending on how mandates are invested over time.
Secondary Funds $10bn1
PrimaryFunds$22bn1
Co-investment$16bn1
Specialty Strategies
$5bn
Private Credit$4bn
• Over 30+ Years of Industry Experience
• Over $74 Billion of Commitments Managed
• Committed ~$10 billion annually to private equity over the past 3 years
• Leverages the Resources of Neuberger Berman
• Focus on ESG: Integration Across Sourcing, Diligence & Monitoring
GP Minority Investments$18bn
Neuberger Berman Private Equity Platform
5NB PRIVATE EQUITY PARTNERS INVESTOR UPDATE
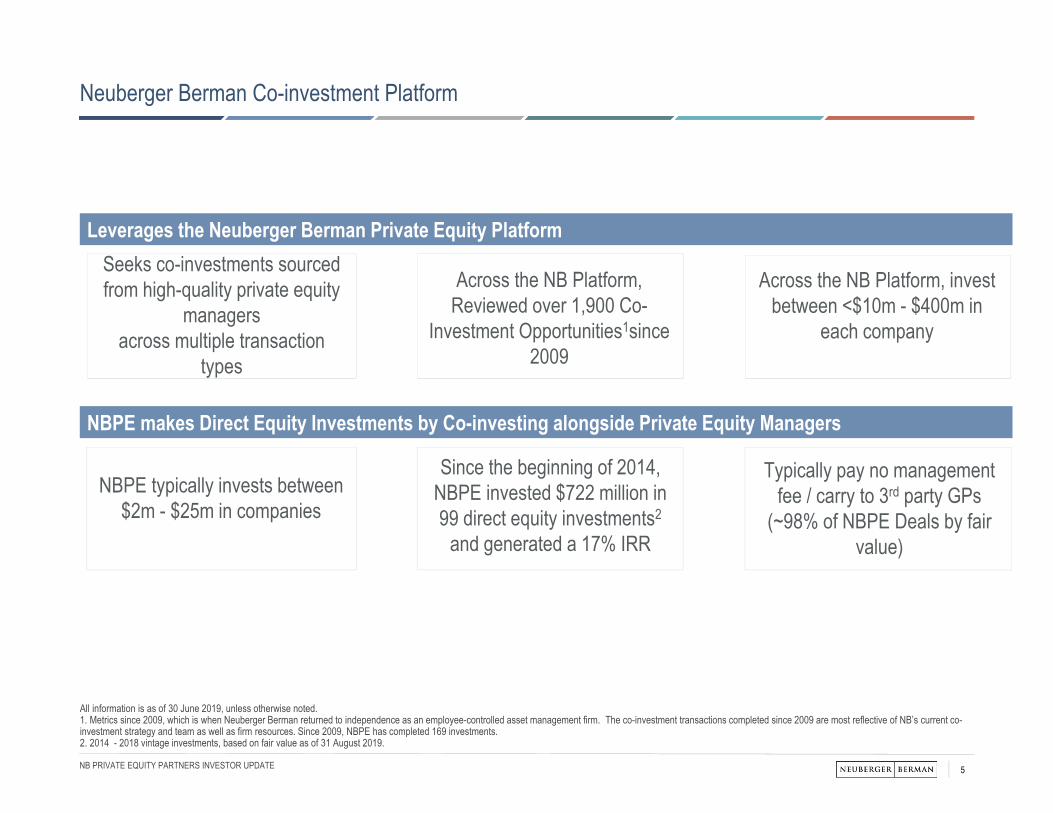
All information is as of 30 June 2019, unless otherwise noted.1. Metrics since 2009, which is when Neuberger Berman returned to independence as an employee-controlled asset management firm. The co-investment transactions completed since 2009 are most reflective of NB’s current co-investment strategy and team as well as firm resources. Since 2009, NBPE has completed 169 investments.2. 2014 - 2018 vintage investments, based on fair value as of 31 August 2019.
NBPE typically invests between $2m - $25m in companies
Seeks co-investments sourced from high-quality private equity
managers across multiple transaction
types
Across the NB Platform, invest between <$10m - $400m in
each company
Typically pay no management fee / carry to 3rd party GPs
(~98% of NBPE Deals by fair value)
Across the NB Platform, Reviewed over 1,900 Co-
Investment Opportunities1since 2009
Since the beginning of 2014,NBPE invested $722 million in 99 direct equity investments2
and generated a 17% IRR
Leverages the Neuberger Berman Private Equity Platform
NBPE makes Direct Equity Investments by Co-investing alongside Private Equity Managers
Neuberger Berman Co-investment Platform
6NB PRIVATE EQUITY PARTNERS INVESTOR UPDATE
NBPE Invests Alongside Leading GPs
As of June 2019. Includes one undisclosed sponsor due to confidentiality provisions. Represents private equity sponsors of investments made over the last two years.
7NB PRIVATE EQUITY PARTNERS INVESTOR UPDATE
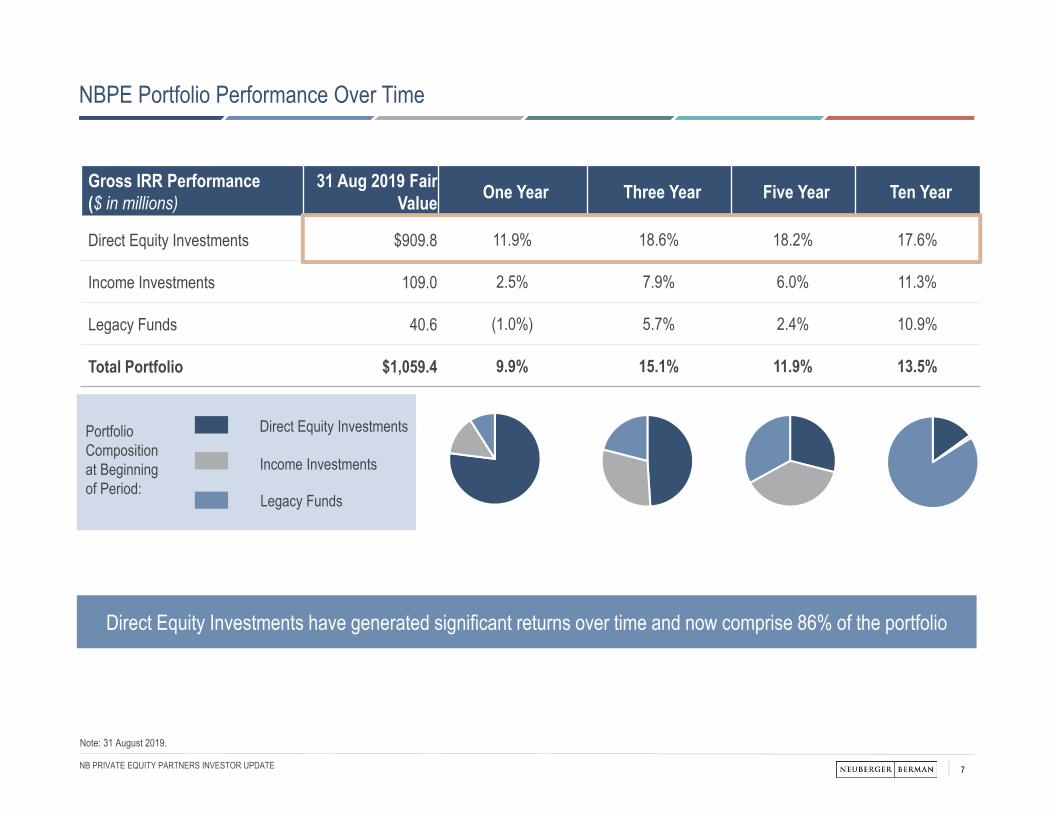
Gross IRR Performance($ in millions)
31 Aug 2019 Fair Value One Year Three Year Five Year Ten Year
Direct Equity Investments $909.8 11.9% 18.6% 18.2% 17.6%
Income Investments 109.0 2.5% 7.9% 6.0% 11.3%
Legacy Funds 40.6 (1.0%) 5.7% 2.4% 10.9%
Total Portfolio $1,059.4 9.9% 15.1% 11.9% 13.5%
Direct Equity Investments have generated significant returns over time and now comprise 86% of the portfolio
Portfolio Composition at Beginning of Period:
Income Investments
Direct Equity Investments
Legacy Funds
Note: 31 August 2019.
NBPE Portfolio Performance Over Time
8NB PRIVATE EQUITY PARTNERS INVESTOR UPDATE
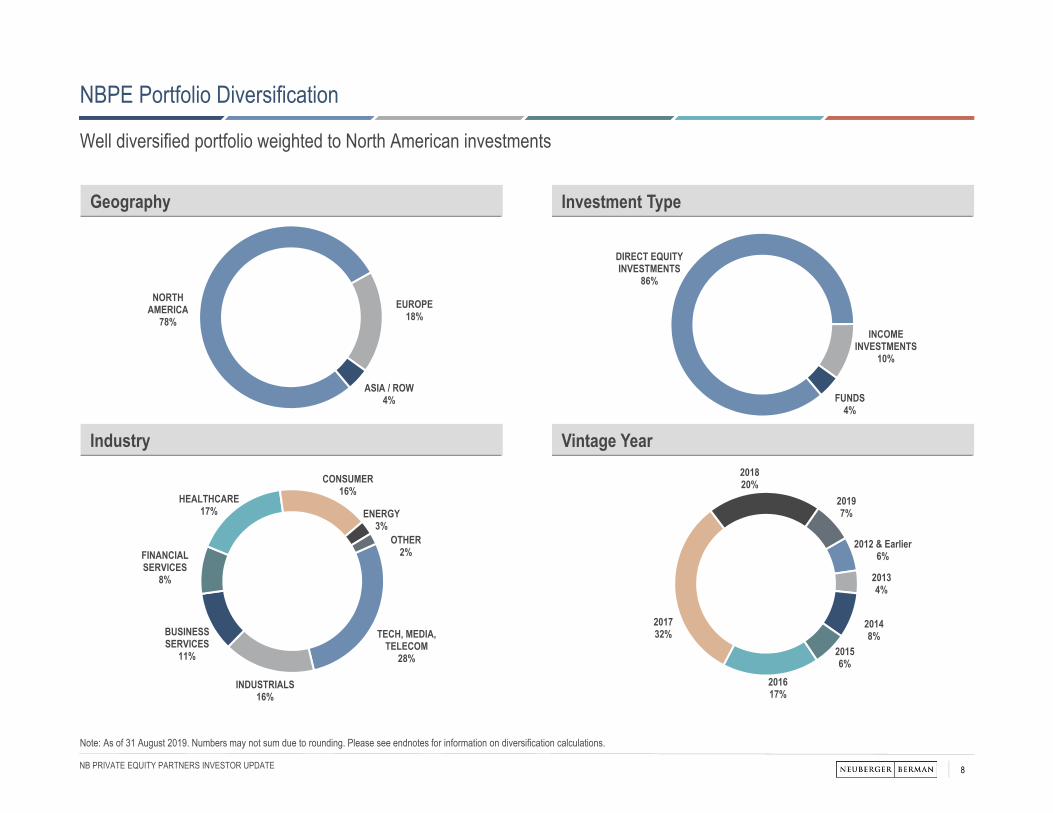
NBPE Portfolio Diversification
Well diversified portfolio weighted to North American investments
Note: As of 31 August 2019. Numbers may not sum due to rounding. Please see endnotes for information on diversification calculations.
Investment TypeGeography
Vintage YearIndustry
NORTH AMERICA
78%EUROPE
18%
ASIA / ROW4%
DIRECT EQUITY INVESTMENTS
86%
INCOME INVESTMENTS
10%
FUNDS4%
TECH, MEDIA, TELECOM
28%
INDUSTRIALS16%
BUSINESS SERVICES
11%
FINANCIAL SERVICES
8%
HEALTHCARE17%
CONSUMER16%
ENERGY3%
OTHER2%
2012 & Earlier6%
20134%
20148%
20156%
201617%
201732%
201820%
20197%
9NB PRIVATE EQUITY PARTNERS INVESTOR UPDATE
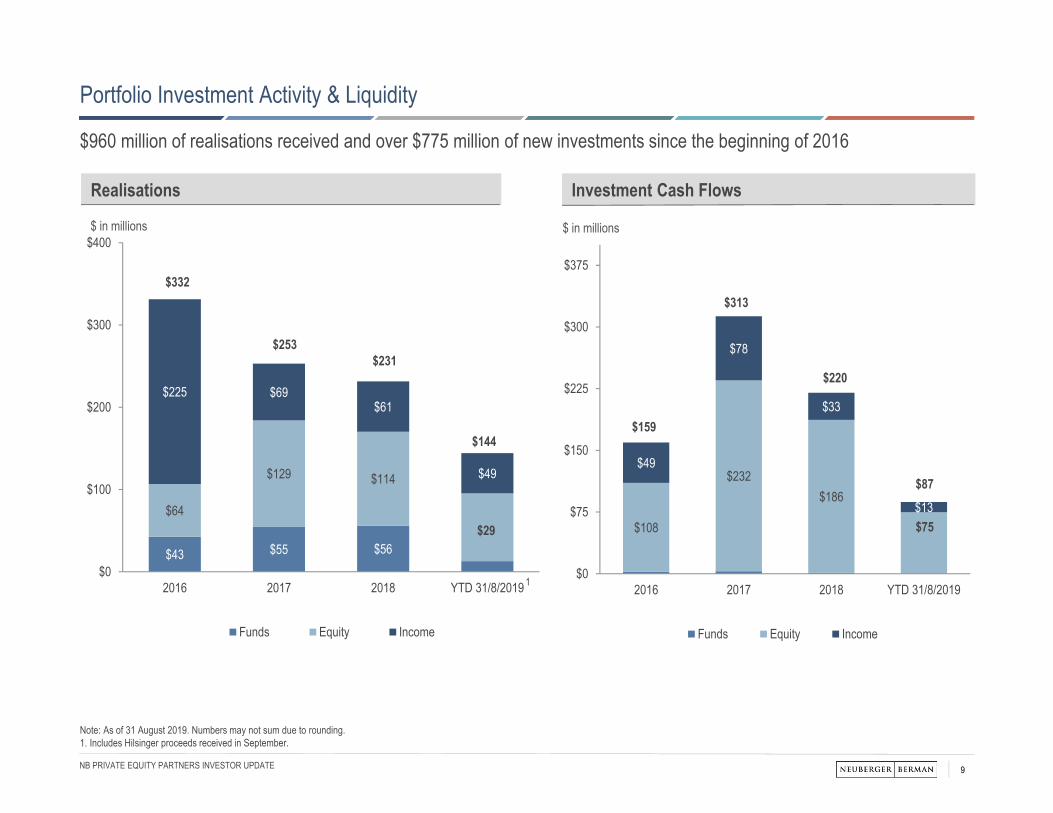
Portfolio Investment Activity & Liquidity
$960 million of realisations received and over $775 million of new investments since the beginning of 2016
Note: As of 31 August 2019. Numbers may not sum due to rounding.1. Includes Hilsinger proceeds received in September.
Realisations
$43 $55 $56
$64
$129 $114
$225 $69$61
$49
$0
$100
$200
$300
$400
2016 2017 2018 YTD 31/8/2019
Funds Equity Income
$332
$253$231
$29 $108
$232$186
$49
$78
$33
$13
$0
$75
$150
$225
$300
$375
2016 2017 2018 YTD 31/8/2019
Funds Equity Income
$159
$313
$220
$75
$ in millions $ in millions
Investment Cash Flows
$144
$87
1
10NB PRIVATE EQUITY PARTNERS INVESTOR UPDATE
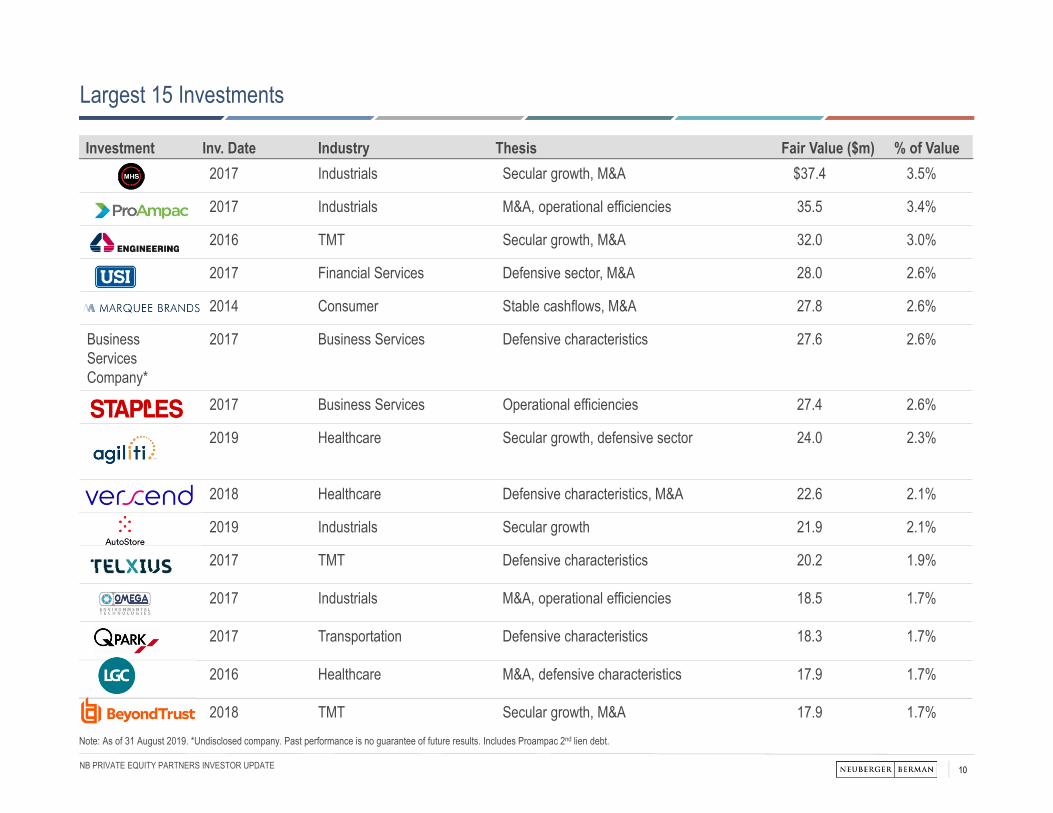
Investment Inv. Date Industry Thesis Fair Value ($m) % of Value2017 Industrials Secular growth, M&A $37.4 3.5%
2017 Industrials M&A, operational efficiencies 35.5 3.4%
2016 TMT Secular growth, M&A 32.0 3.0%
2017 Financial Services Defensive sector, M&A 28.0 2.6%
2014 Consumer Stable cashflows, M&A 27.8 2.6%
Business Services Company*
2017 Business Services Defensive characteristics 27.6 2.6%
2017 Business Services Operational efficiencies 27.4 2.6%
2019 Healthcare Secular growth, defensive sector 24.0 2.3%
2018 Healthcare Defensive characteristics, M&A 22.6 2.1%
2019 Industrials Secular growth 21.9 2.1%
2017 TMT Defensive characteristics 20.2 1.9%
2017 Industrials M&A, operational efficiencies 18.5 1.7%
2017 Transportation Defensive characteristics 18.3 1.7%
2016 Healthcare M&A, defensive characteristics 17.9 1.7%
2018 TMT Secular growth, M&A 17.9 1.7%Note: As of 31 August 2019. *Undisclosed company. Past performance is no guarantee of future results. Includes Proampac 2nd lien debt.
Largest 15 Investments
11NB PRIVATE EQUITY PARTNERS INVESTOR UPDATE
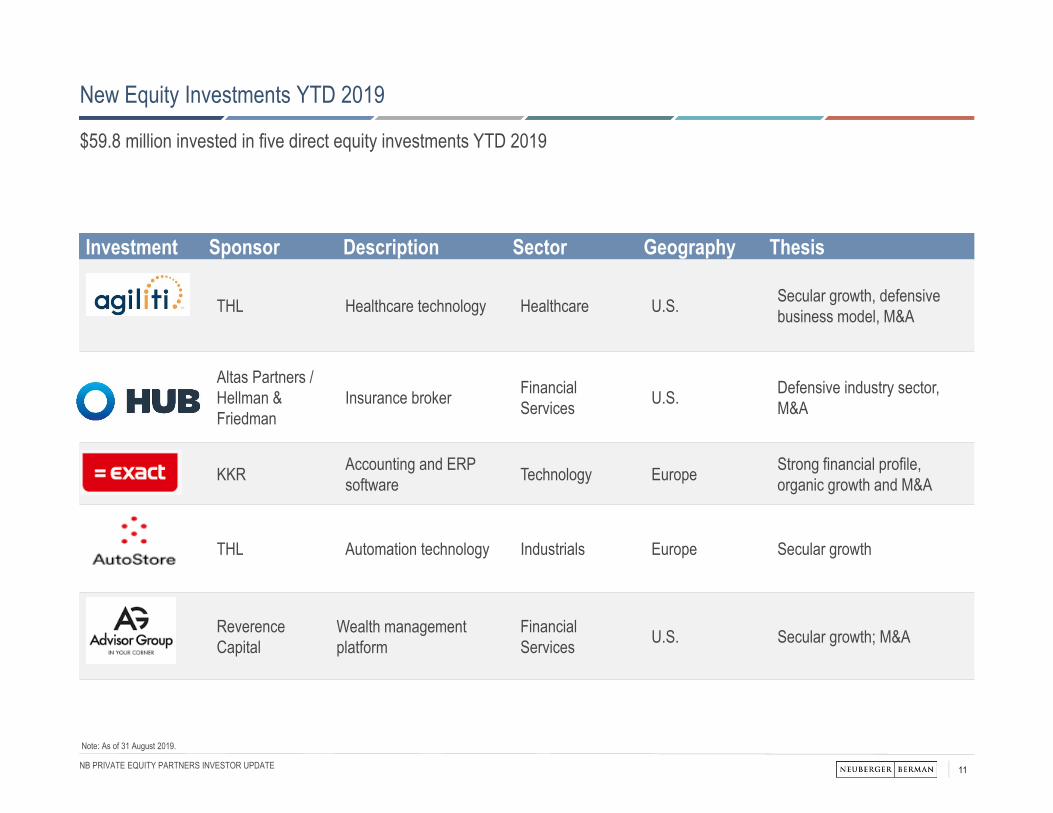
Investment Sponsor Description Sector Geography Thesis
THL Healthcare technology Healthcare U.S. Secular growth, defensive business model, M&A
Altas Partners / Hellman & Friedman
Insurance broker Financial Services U.S. Defensive industry sector,
M&A
KKR Accounting and ERP software Technology Europe Strong financial profile,
organic growth and M&A
THL Automation technology Industrials Europe Secular growth
Reverence Capital
Wealth management platform
Financial Services U.S. Secular growth; M&A
Note: As of 31 August 2019.
New Equity Investments YTD 2019
$59.8 million invested in five direct equity investments YTD 2019
12NB PRIVATE EQUITY PARTNERS INVESTOR UPDATE
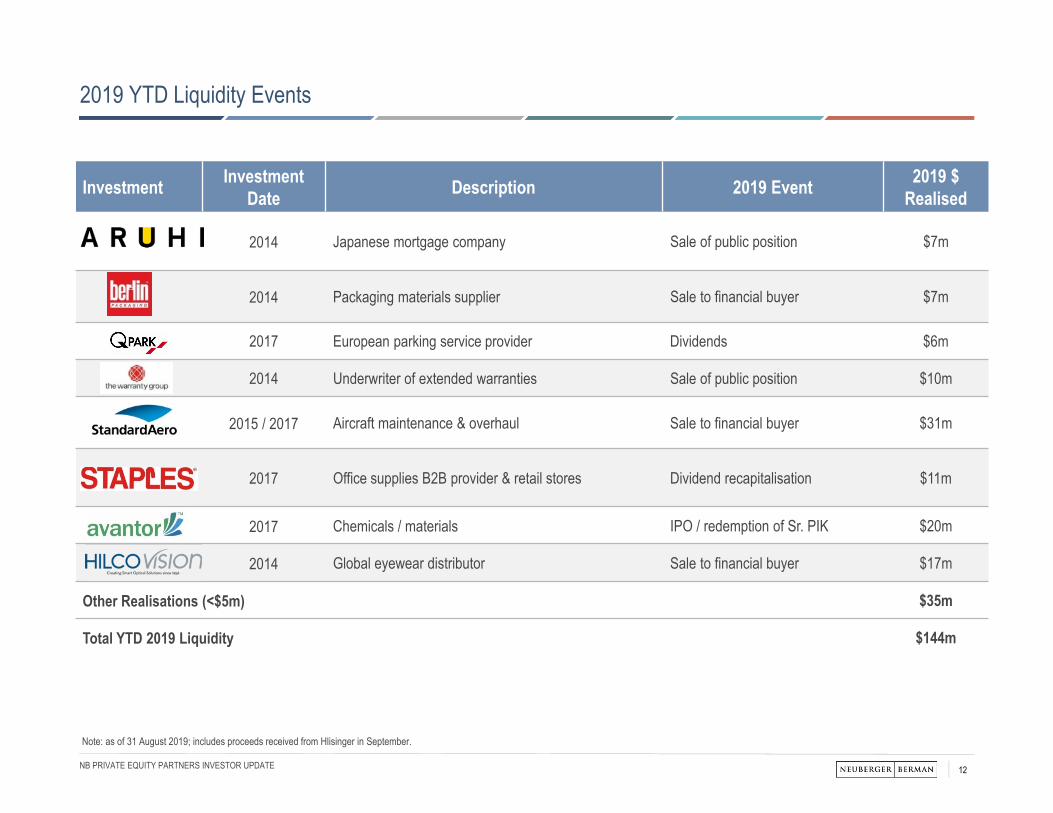
Investment InvestmentDate Description 2019 Event 2019 $
Realised
2014 Japanese mortgage company Sale of public position $7m
2014 Packaging materials supplier Sale to financial buyer $7m
2017 European parking service provider Dividends $6m
2014 Underwriter of extended warranties Sale of public position $10m
2015 / 2017 Aircraft maintenance & overhaul Sale to financial buyer $31m
2017 Office supplies B2B provider & retail stores Dividend recapitalisation $11m
2017 Chemicals / materials IPO / redemption of Sr. PIK $20m
2014 Global eyewear distributor Sale to financial buyer $17m
Other Realisations (<$5m) $35m
Total YTD 2019 Liquidity $144m
Note: as of 31 August 2019; includes proceeds received from Hlisinger in September.
2019 YTD Liquidity Events
13NB PRIVATE EQUITY PARTNERS INVESTOR UPDATE
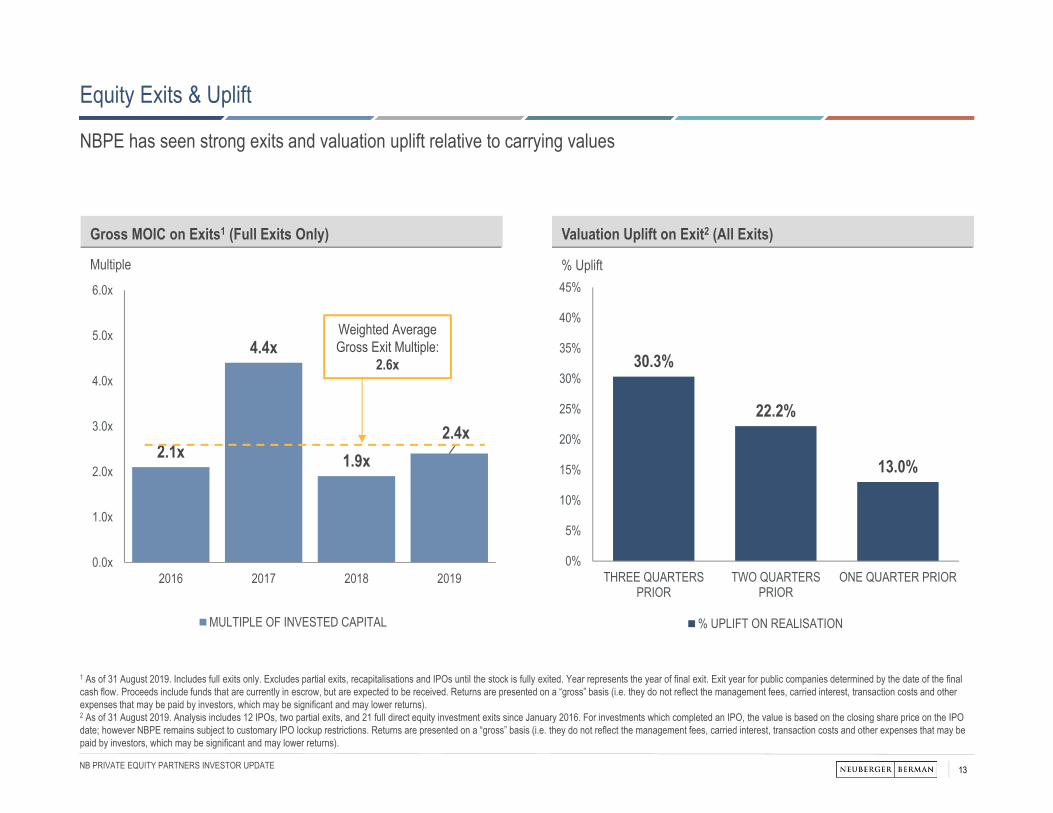
Equity Exits & Uplift
NBPE has seen strong exits and valuation uplift relative to carrying values
1 As of 31 August 2019. Includes full exits only. Excludes partial exits, recapitalisations and IPOs until the stock is fully exited. Year represents the year of final exit. Exit year for public companies determined by the date of the final cash flow. Proceeds include funds that are currently in escrow, but are expected to be received. Returns are presented on a “gross” basis (i.e. they do not reflect the management fees, carried interest, transaction costs and other expenses that may be paid by investors, which may be significant and may lower returns).2 As of 31 August 2019. Analysis includes 12 IPOs, two partial exits, and 21 full direct equity investment exits since January 2016. For investments which completed an IPO, the value is based on the closing share price on the IPO date; however NBPE remains subject to customary IPO lockup restrictions. Returns are presented on a “gross” basis (i.e. they do not reflect the management fees, carried interest, transaction costs and other expenses that may be paid by investors, which may be significant and may lower returns).
2.1x
4.4x
1.9x2.4x
0.0x
1.0x
2.0x
3.0x
4.0x
5.0x
6.0x
2016 2017 2018 2019
MULTIPLE OF INVESTED CAPITAL
Weighted Average Gross Exit Multiple:
2.6x
Multiple % Uplift
30.3%
22.2%
13.0%
0%
5%
10%
15%
20%
25%
30%
35%
40%
45%
THREE QUARTERSPRIOR
TWO QUARTERSPRIOR
ONE QUARTER PRIOR
% UPLIFT ON REALISATION
Valuation Uplift on Exit2 (All Exits)Gross MOIC on Exits1 (Full Exits Only)
14NB PRIVATE EQUITY PARTNERS INVESTOR UPDATE
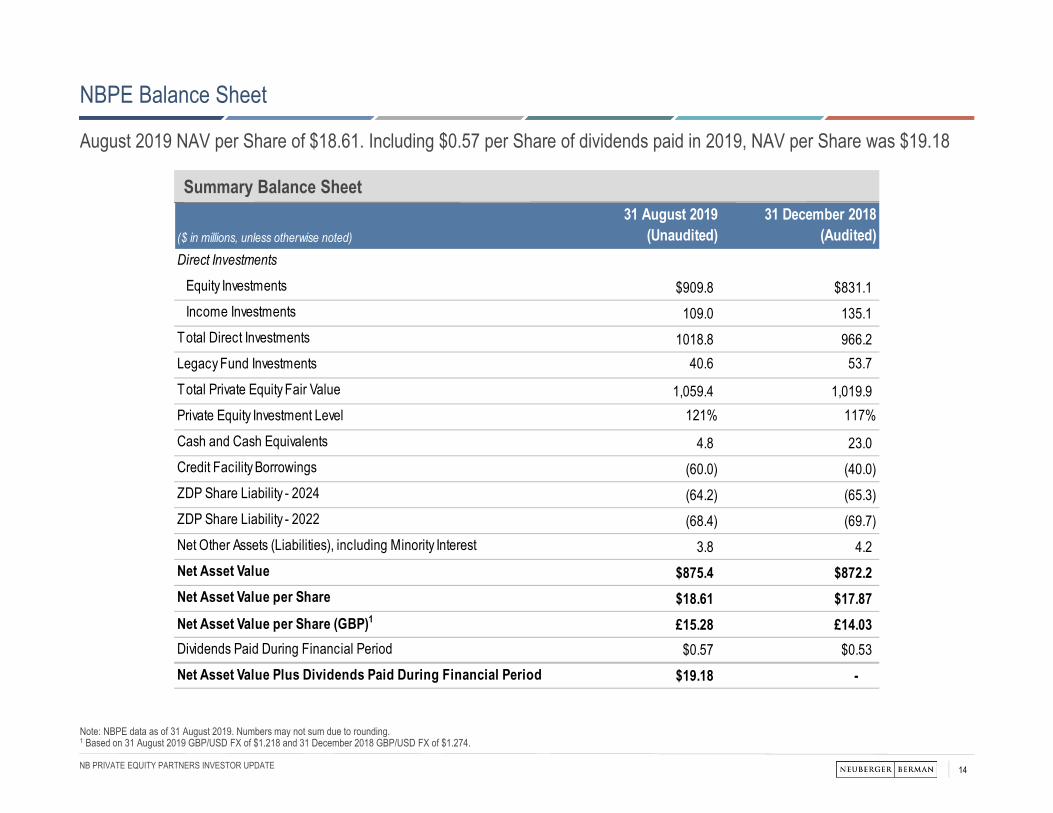
NBPE Balance Sheet
August 2019 NAV per Share of $18.61. Including $0.57 per Share of dividends paid in 2019, NAV per Share was $19.18
Note: NBPE data as of 31 August 2019. Numbers may not sum due to rounding.1 Based on 31 August 2019 GBP/USD FX of $1.218 and 31 December 2018 GBP/USD FX of $1.274.
Summary Balance Sheet
($ in millions, unless otherwise noted)
31 August 2019 (Unaudited)
31 December 2018 (Audited)
Direct Investments
Equity Investments $909.8 $831.1Income Investments 109.0 135.1
Total Direct Investments 1018.8 966.2Legacy Fund Investments 40.6 53.7Total Private Equity Fair Value 1,059.4 1,019.9Private Equity Investment Level 121% 117%Cash and Cash Equivalents 4.8 23.0Credit Facility Borrowings (60.0) (40.0)ZDP Share Liability - 2024 (64.2) (65.3)ZDP Share Liability - 2022 (68.4) (69.7) Net Other Assets (Liabilities), including Minority Interest 3.8 4.2Net Asset Value $875.4 $872.2Net Asset Value per Share $18.61 $17.87Net Asset Value per Share (GBP)1 15.28£ 14.03£ Dividends Paid During Financial Period $0.57 $0.53Net Asset Value Plus Dividends Paid During Financial Period $19.18 -
15NB PRIVATE EQUITY PARTNERS INVESTOR UPDATE
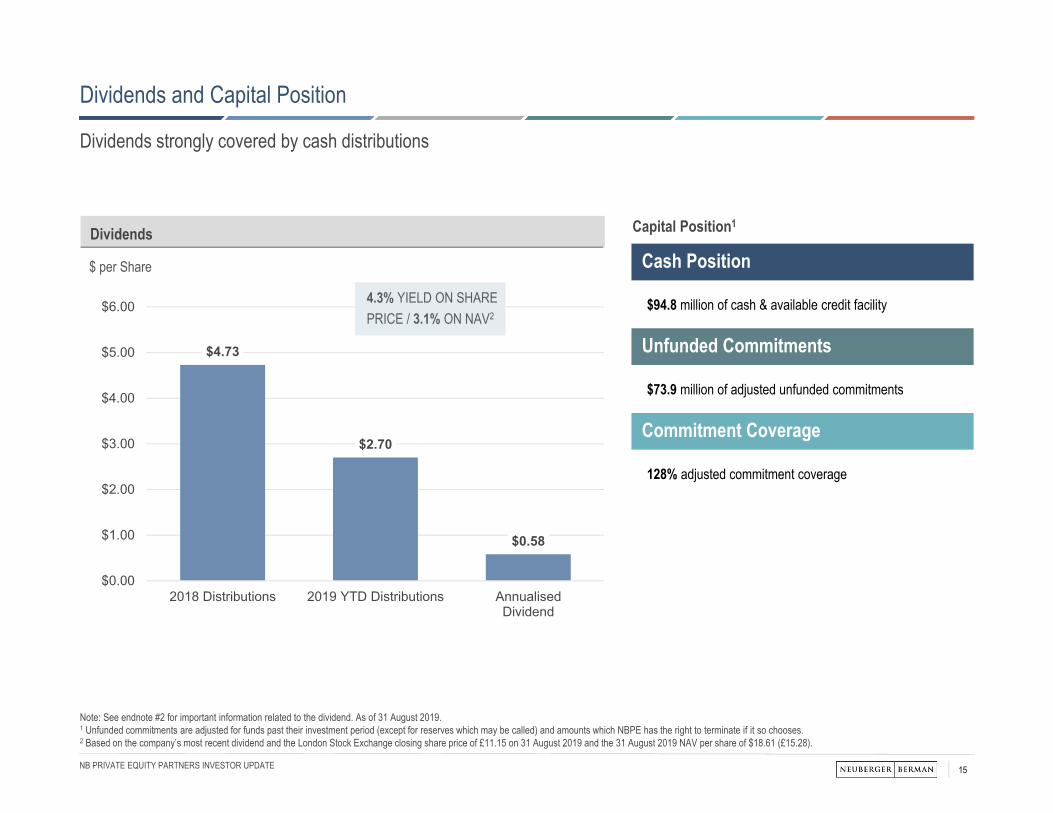
Dividends and Capital Position
Dividends strongly covered by cash distributions
Note: See endnote #2 for important information related to the dividend. As of 31 August 2019.1 Unfunded commitments are adjusted for funds past their investment period (except for reserves which may be called) and amounts which NBPE has the right to terminate if it so chooses.2 Based on the company’s most recent dividend and the London Stock Exchange closing share price of £11.15 on 31 August 2019 and the 31 August 2019 NAV per share of $18.61 (£15.28).
Cash Position
Unfunded Commitments
Commitment Coverage
$4.73
$2.70
$0.58
$0.00
$1.00
$2.00
$3.00
$4.00
$5.00
$6.00
2018 Distributions 2019 YTD Distributions AnnualisedDividend
$ per Share
$94.8 million of cash & available credit facility
$73.9 million of adjusted unfunded commitments
128% adjusted commitment coverage
4.3% YIELD ON SHARE PRICE / 3.1% ON NAV2
Capital Position1Dividends
16NB PRIVATE EQUITY PARTNERS INVESTOR UPDATE
0%
50%
100%
150%
200%
250%
300%
Year to Date One Year Three Year Five Year Ten Year
USD Total Return GBP Total Return
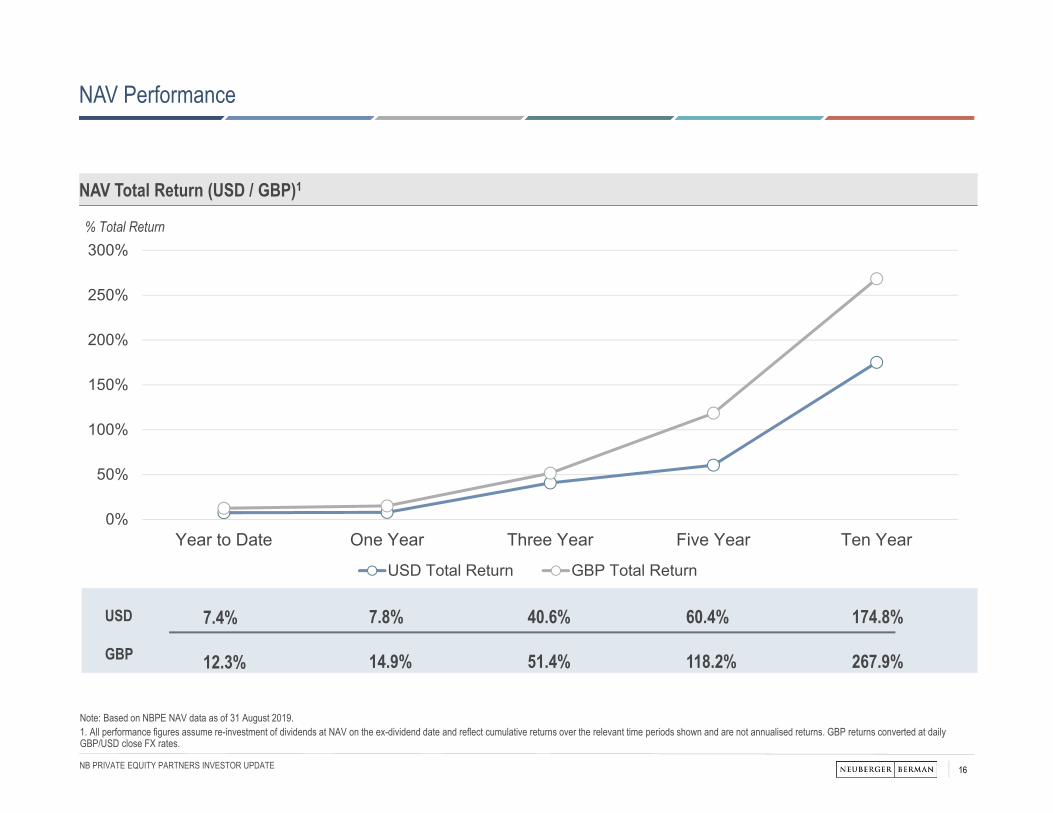
NAV Total Return (USD / GBP)1
% Total Return
USD
GBP
7.4%
12.3%
7.8%
14.9%
40.6%
51.4%
60.4%
118.2%
174.8%
267.9%
Note: Based on NBPE NAV data as of 31 August 2019. 1. All performance figures assume re-investment of dividends at NAV on the ex-dividend date and reflect cumulative returns over the relevant time periods shown and are not annualised returns. GBP returns converted at daily GBP/USD close FX rates.
NAV Performance
17NB PRIVATE EQUITY PARTNERS INVESTOR UPDATE
-50%0%
50%100%150%200%250%300%350%400%450%
Year to Date One Year Three Year Five Year Ten Year
USD Total Return GBP Total Return
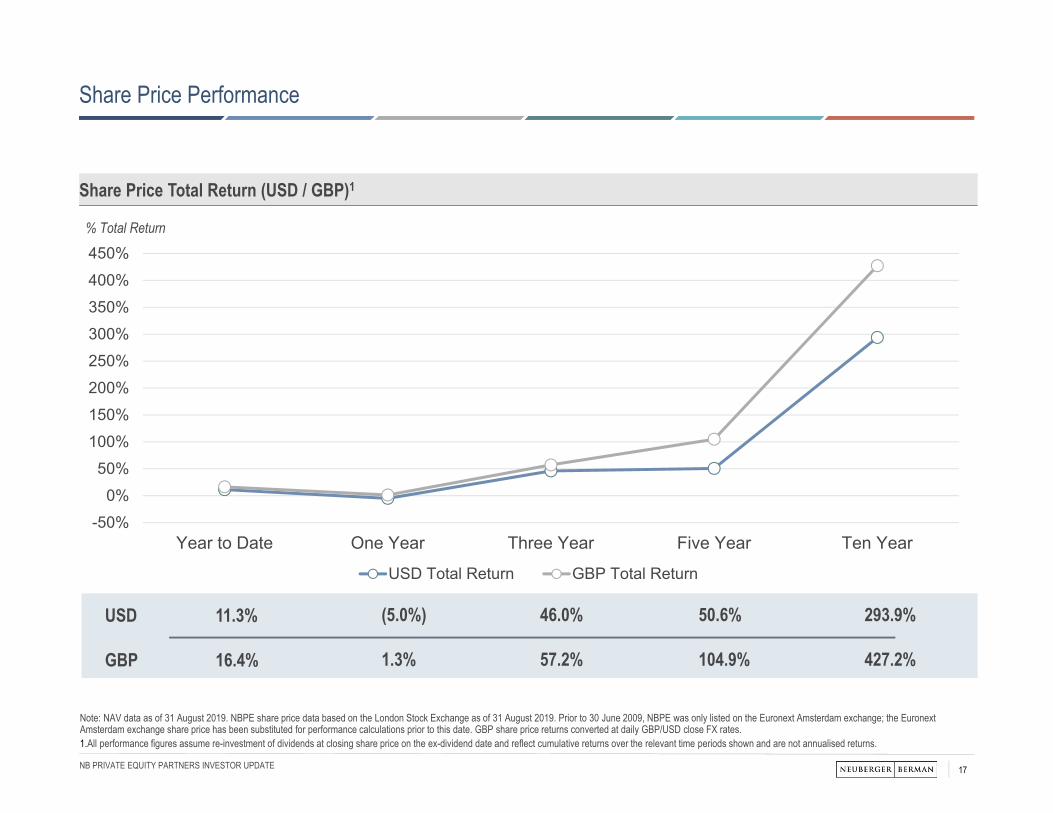
Share Price Total Return (USD / GBP)1
% Total Return
USD
GBP
11.3%
16.4%
(5.0%)
1.3%
46.0%
57.2%
50.6%
104.9%
293.9%
427.2%
Note: NAV data as of 31 August 2019. NBPE share price data based on the London Stock Exchange as of 31 August 2019. Prior to 30 June 2009, NBPE was only listed on the Euronext Amsterdam exchange; the Euronext Amsterdam exchange share price has been substituted for performance calculations prior to this date. GBP share price returns converted at daily GBP/USD close FX rates. 1.All performance figures assume re-investment of dividends at closing share price on the ex-dividend date and reflect cumulative returns over the relevant time periods shown and are not annualised returns.
Share Price Performance
18NB PRIVATE EQUITY PARTNERS INVESTOR UPDATE
0%
5%
10%
15%
20%
25%
30%
35%
40%
31-Aug-16 30-Nov-16 28-Feb-17 31-May-17 31-Aug-17 30-Nov-17 28-Feb-18 31-May-18 31-Aug-18 30-Nov-18 28-Feb-19 31-May-19 31-Aug-19Discount
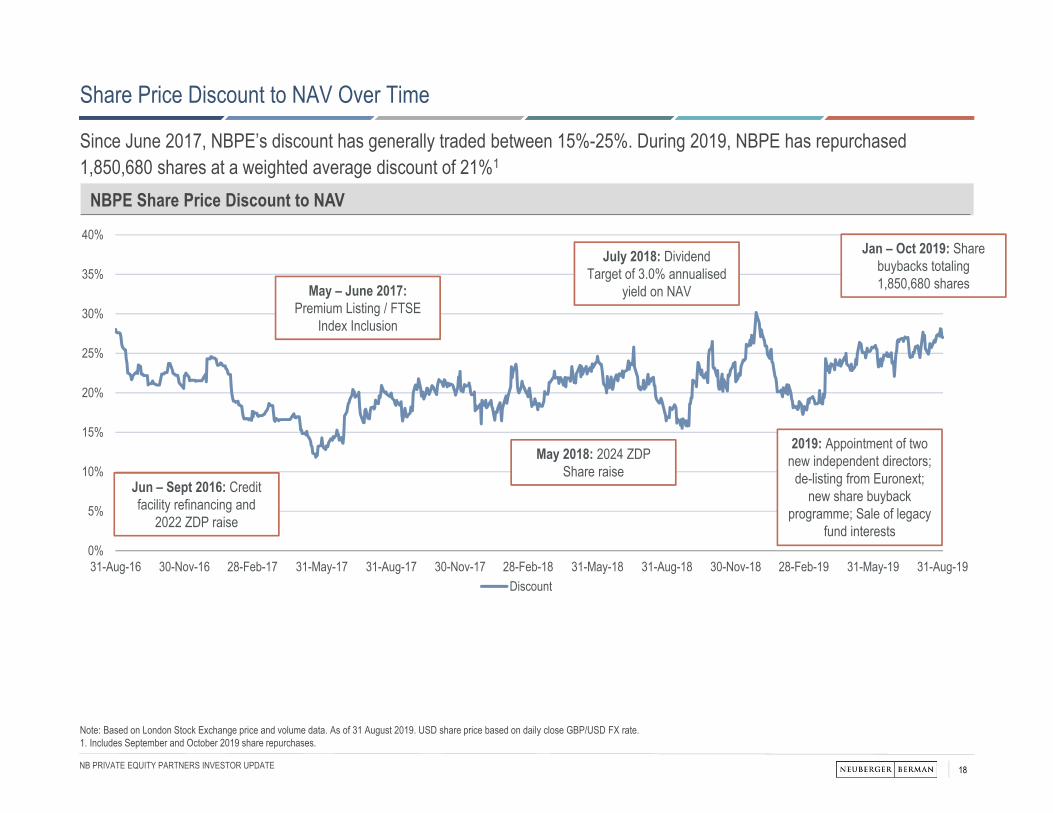
Share Price Discount to NAV Over Time
Since June 2017, NBPE’s discount has generally traded between 15%-25%. During 2019, NBPE has repurchased 1,850,680 shares at a weighted average discount of 21%1
Note: Based on London Stock Exchange price and volume data. As of 31 August 2019. USD share price based on daily close GBP/USD FX rate.1. Includes September and October 2019 share repurchases.
Jun – Sept 2016: Credit facility refinancing and
2022 ZDP raise
NBPE Share Price Discount to NAV
May – June 2017: Premium Listing / FTSE
Index Inclusion
May 2018: 2024 ZDP Share raise
July 2018: Dividend Target of 3.0% annualised
yield on NAV
2019: Appointment of two new independent directors;
de-listing from Euronext; new share buyback
programme; Sale of legacy fund interests
Jan – Oct 2019: Share buybacks totaling 1,850,680 shares
19NB PRIVATE EQUITY PARTNERS INVESTOR UPDATE
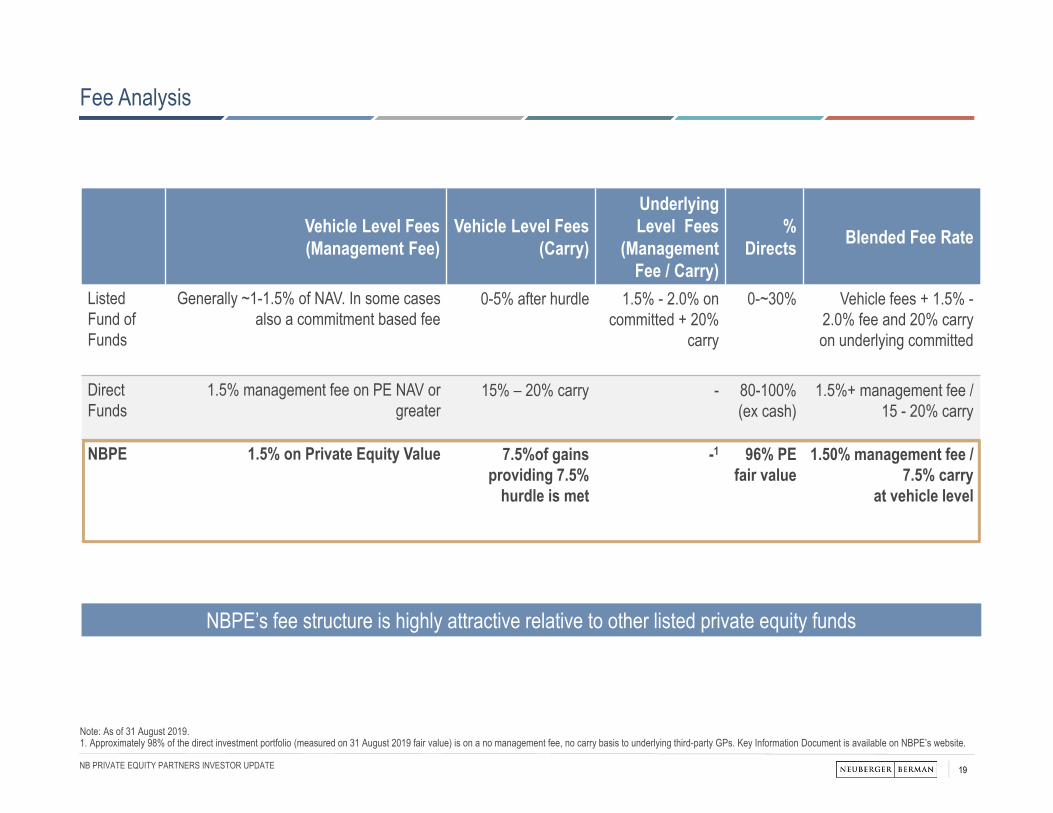
Fee Analysis
Vehicle Level Fees (Management Fee)
Vehicle Level Fees (Carry)
Underlying Level Fees
(Management Fee / Carry)
% Directs Blended Fee Rate
Listed Fund of Funds
Generally ~1-1.5% of NAV. In some cases also a commitment based fee
0-5% after hurdle 1.5% - 2.0% on committed + 20%
carry
0-~30% Vehicle fees + 1.5% -2.0% fee and 20% carry on underlying committed
Direct Funds
1.5% management fee on PE NAV or greater
15% – 20% carry - 80-100%(ex cash)
1.5%+ management fee / 15 - 20% carry
NBPE 1.5% on Private Equity Value 7.5%of gains providing 7.5%
hurdle is met
-1 96% PE fair value
1.50% management fee / 7.5% carry
at vehicle level
NBPE’s fee structure is highly attractive relative to other listed private equity funds
Note: As of 31 August 2019.1. Approximately 98% of the direct investment portfolio (measured on 31 August 2019 fair value) is on a no management fee, no carry basis to underlying third-party GPs. Key Information Document is available on NBPE’s website.
20NB PRIVATE EQUITY PARTNERS INVESTOR UPDATE
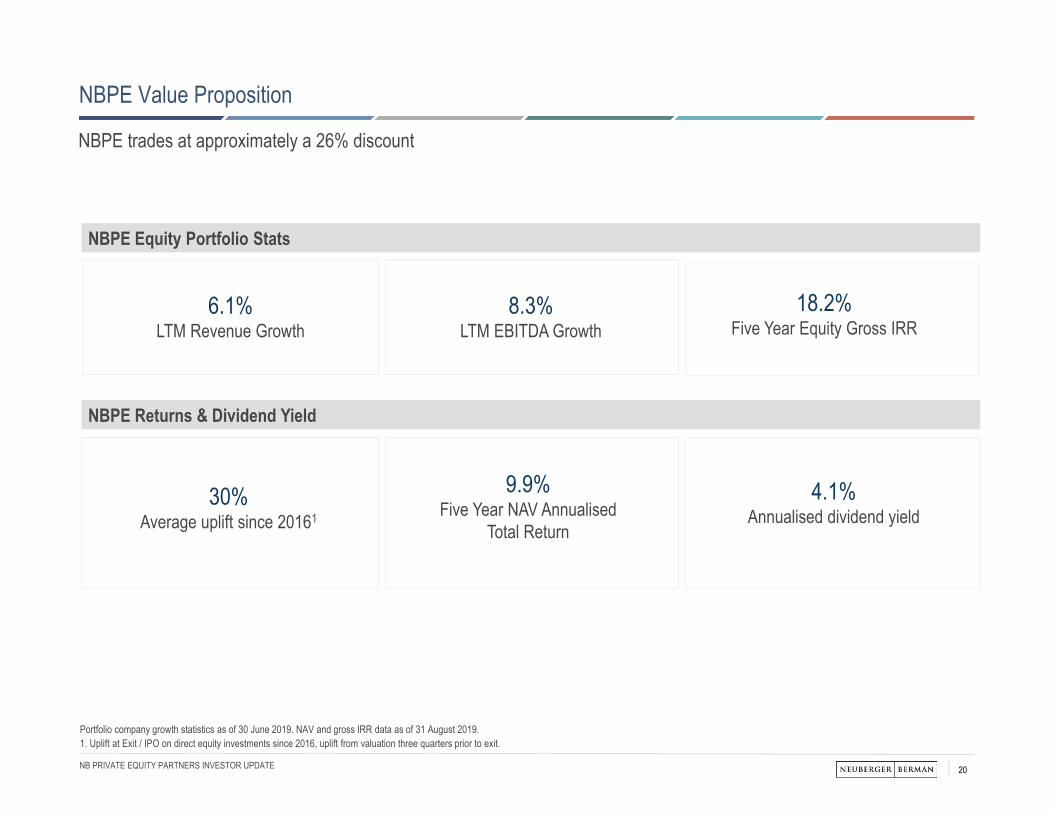
NBPE Value Proposition
9.9%Five Year NAV Annualised
Total Return
6.1%LTM Revenue Growth
30%Average uplift since 20161
4.1% Annualised dividend yield
8.3%LTM EBITDA Growth
18.2%Five Year Equity Gross IRR
NBPE Equity Portfolio Stats
NBPE Returns & Dividend Yield
Portfolio company growth statistics as of 30 June 2019. NAV and gross IRR data as of 31 August 2019. 1. Uplift at Exit / IPO on direct equity investments since 2016, uplift from valuation three quarters prior to exit.
NBPE trades at approximately a 26% discount

Appendix

Additional Portfolio Detail
23NB PRIVATE EQUITY PARTNERS INVESTOR UPDATE
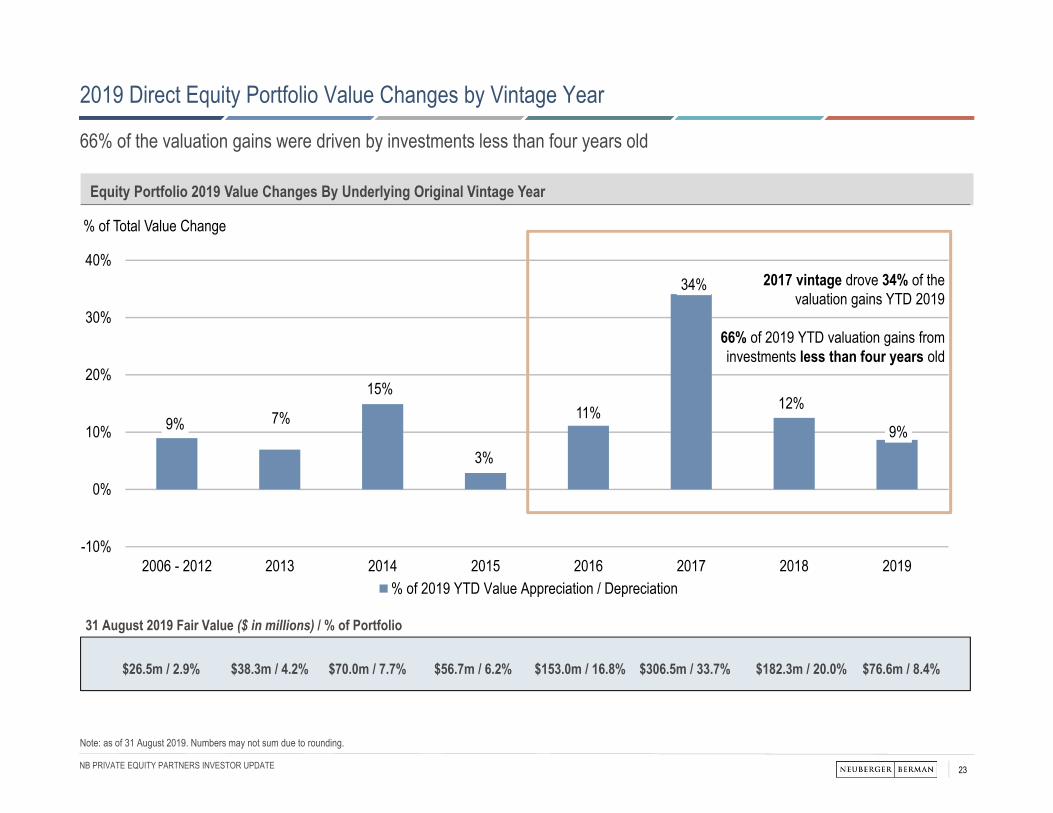
9% 7%
15%
3%
11%
34%
12%
9%
-10%
0%
10%
20%
30%
40%
2006 - 2012 2013 2014 2015 2016 2017 2018 2019
% of Total Value Change
% of 2019 YTD Value Appreciation / Depreciation
2017 vintage drove 34% of the valuation gains YTD 2019
66% of 2019 YTD valuation gains from investments less than four years old
31 August 2019 Fair Value ($ in millions) / % of Portfolio
$26.5m / 2.9% $38.3m / 4.2% $70.0m / 7.7% $56.7m / 6.2% $153.0m / 16.8% $306.5m / 33.7% $182.3m / 20.0% $76.6m / 8.4%
2019 Direct Equity Portfolio Value Changes by Vintage Year
66% of the valuation gains were driven by investments less than four years old
Note: as of 31 August 2019. Numbers may not sum due to rounding.
Equity Portfolio 2019 Value Changes By Underlying Original Vintage Year
24NB PRIVATE EQUITY PARTNERS INVESTOR UPDATE
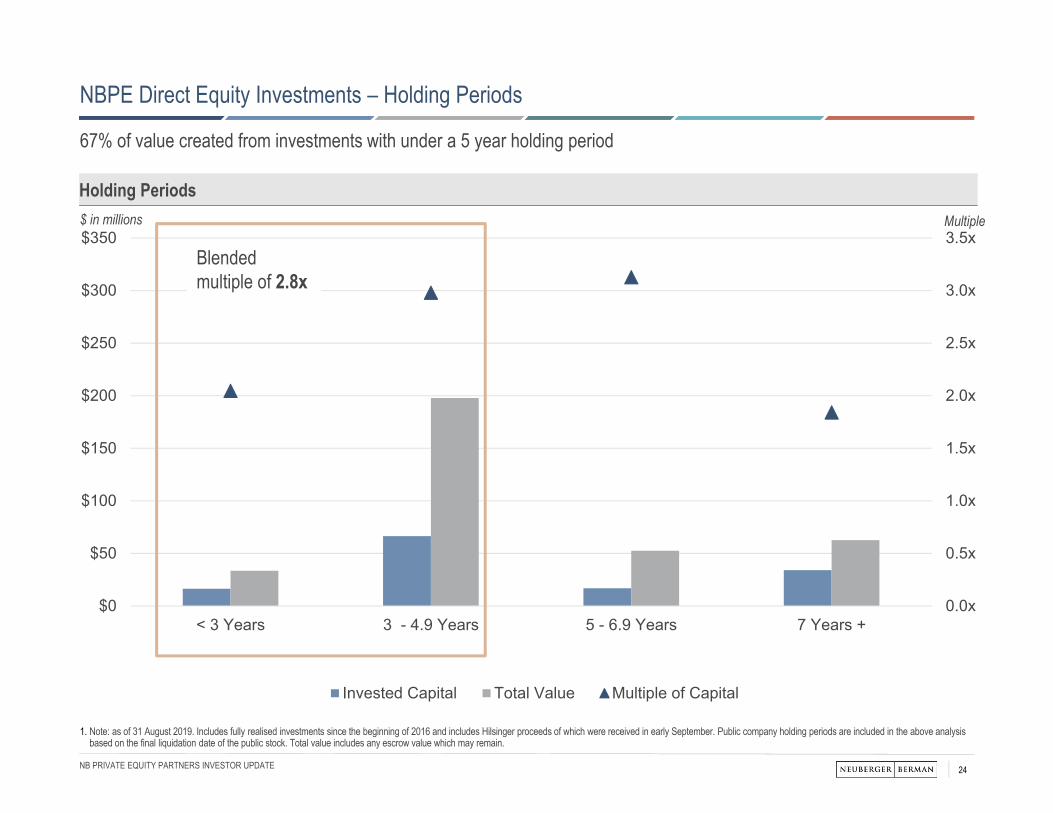
0.0x
0.5x
1.0x
1.5x
2.0x
2.5x
3.0x
3.5x
$0
$50
$100
$150
$200
$250
$300
$350
< 3 Years 3 - 4.9 Years 5 - 6.9 Years 7 Years +
Invested Capital Total Value Multiple of Capital
Holding Periods$ in millions Multiple
Blended multiple of 2.8x
1. Note: as of 31 August 2019. Includes fully realised investments since the beginning of 2016 and includes Hilsinger proceeds of which were received in early September. Public company holding periods are included in the above analysis based on the final liquidation date of the public stock. Total value includes any escrow value which may remain.
NBPE Direct Equity Investments – Holding Periods
67% of value created from investments with under a 5 year holding period
25NB PRIVATE EQUITY PARTNERS INVESTOR UPDATE
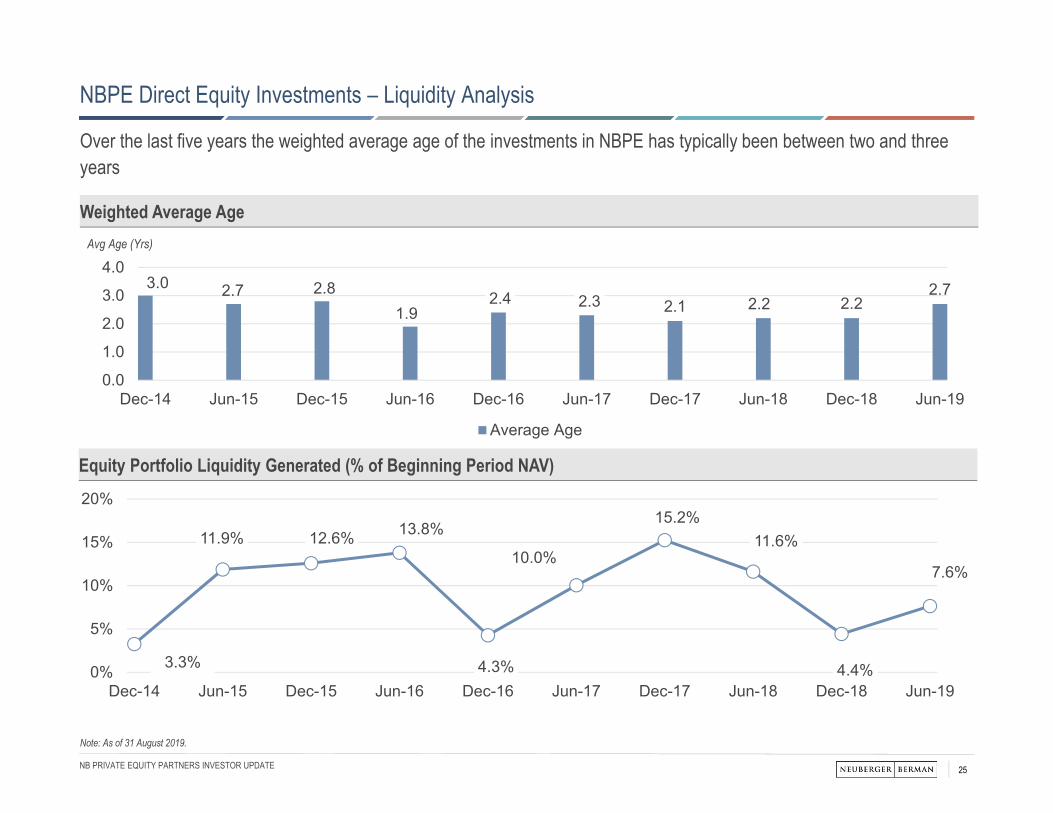
Weighted Average Age
3.0 2.7 2.81.9
2.4 2.3 2.1 2.2 2.22.7
0.0
1.0
2.0
3.0
4.0
Dec-14 Jun-15 Dec-15 Jun-16 Dec-16 Jun-17 Dec-17 Jun-18 Dec-18 Jun-19
Average Age
Avg Age (Yrs)
Equity Portfolio Liquidity Generated (% of Beginning Period NAV)
3.3%
11.9% 12.6% 13.8%
4.3%
10.0%
15.2%11.6%
4.4%
7.6%
0%
5%
10%
15%
20%
Dec-14 Jun-15 Dec-15 Jun-16 Dec-16 Jun-17 Dec-17 Jun-18 Dec-18 Jun-19
NBPE Direct Equity Investments – Liquidity Analysis
Over the last five years the weighted average age of the investments in NBPE has typically been between two and three years
Note: As of 31 August 2019.
26NB PRIVATE EQUITY PARTNERS INVESTOR UPDATE
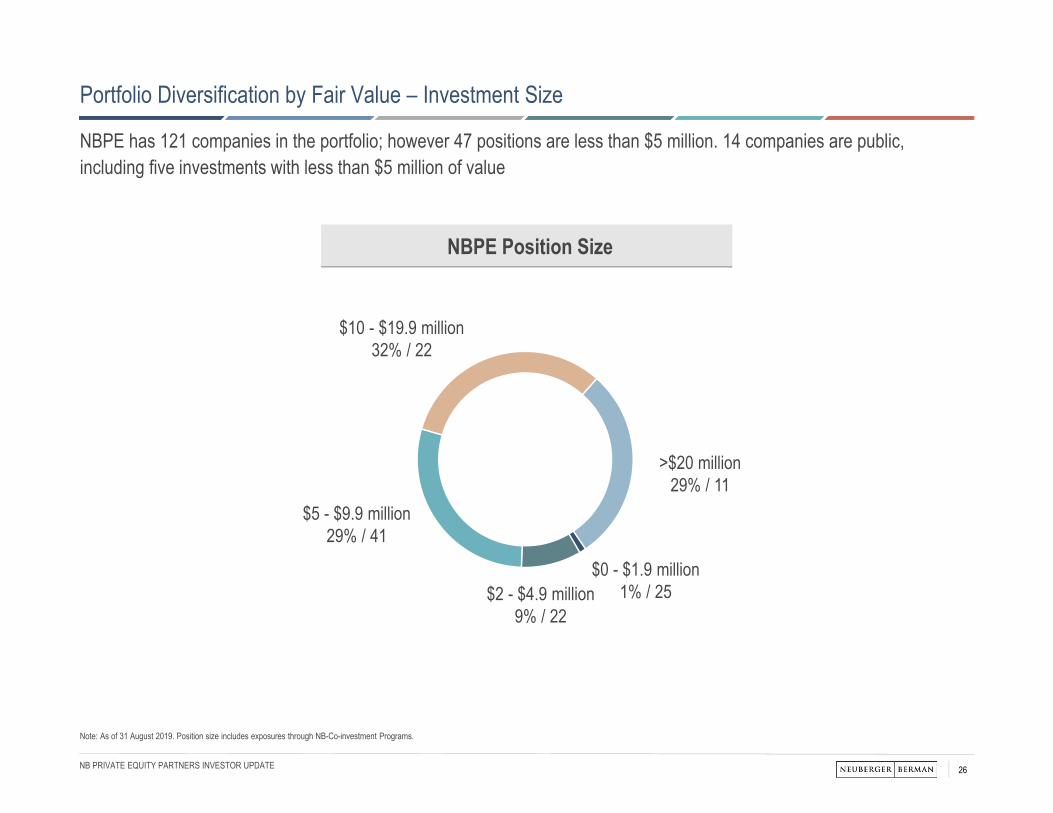
Note: As of 31 August 2019. Position size includes exposures through NB-Co-investment Programs.
NBPE Position Size
$0 - $1.9 million 1% / 25$2 - $4.9 million
9% / 22
$5 - $9.9 million 29% / 41
$10 - $19.9 million 32% / 22
>$20 million 29% / 11
NBPE has 121 companies in the portfolio; however 47 positions are less than $5 million. 14 companies are public, including five investments with less than $5 million of value
Portfolio Diversification by Fair Value – Investment Size
27NB PRIVATE EQUITY PARTNERS INVESTOR UPDATE
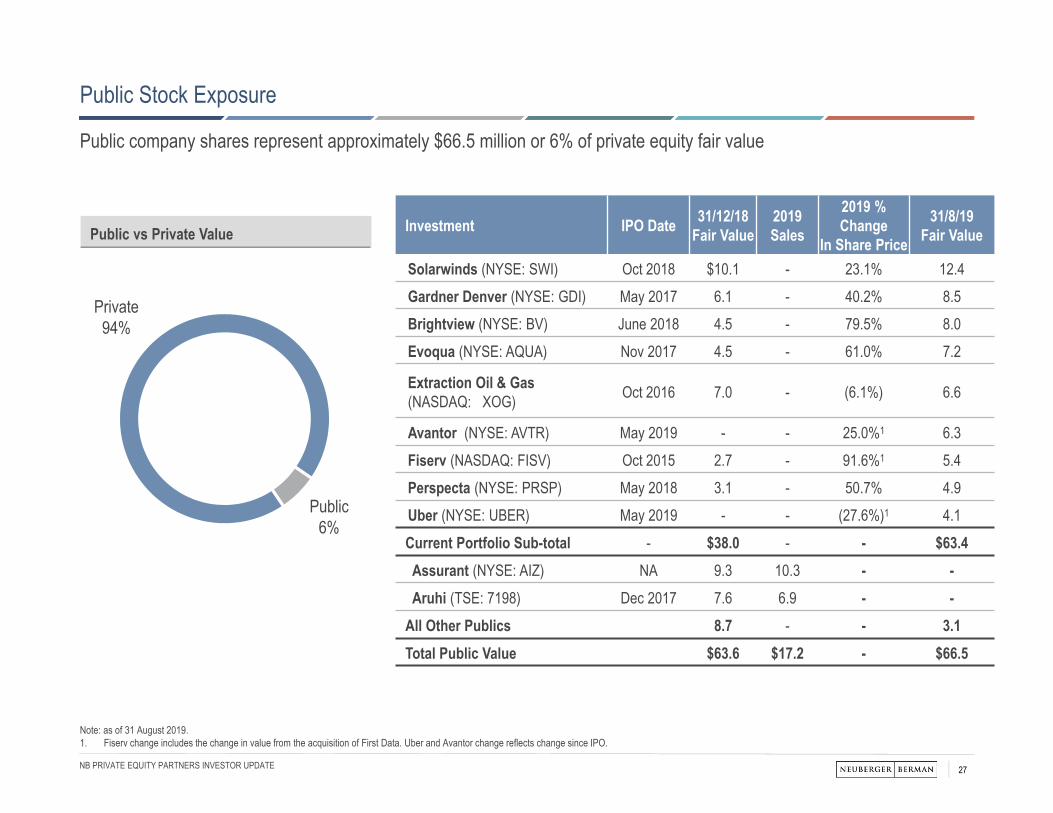
Public Stock Exposure
Public company shares represent approximately $66.5 million or 6% of private equity fair value
Note: as of 31 August 2019.1. Fiserv change includes the change in value from the acquisition of First Data. Uber and Avantor change reflects change since IPO.
Investment IPO Date 31/12/18Fair Value
2019 Sales
2019 % Change
In Share Price
31/8/19Fair Value
Solarwinds (NYSE: SWI) Oct 2018 $10.1 - 23.1% 12.4Gardner Denver (NYSE: GDI) May 2017 6.1 - 40.2% 8.5Brightview (NYSE: BV) June 2018 4.5 - 79.5% 8.0Evoqua (NYSE: AQUA) Nov 2017 4.5 - 61.0% 7.2
Extraction Oil & Gas (NASDAQ: XOG) Oct 2016 7.0 - (6.1%) 6.6
Avantor (NYSE: AVTR) May 2019 - - 25.0%1 6.3Fiserv (NASDAQ: FISV) Oct 2015 2.7 - 91.6%1 5.4Perspecta (NYSE: PRSP) May 2018 3.1 - 50.7% 4.9Uber (NYSE: UBER) May 2019 - - (27.6%)1 4.1Current Portfolio Sub-total - $38.0 - - $63.4Assurant (NYSE: AIZ) NA 9.3 10.3 - -Aruhi (TSE: 7198) Dec 2017 7.6 6.9 - -
All Other Publics 8.7 - - 3.1Total Public Value $63.6 $17.2 - $66.5
Public vs Private Value
Private94%
Public 6%
28NB PRIVATE EQUITY PARTNERS INVESTOR UPDATE
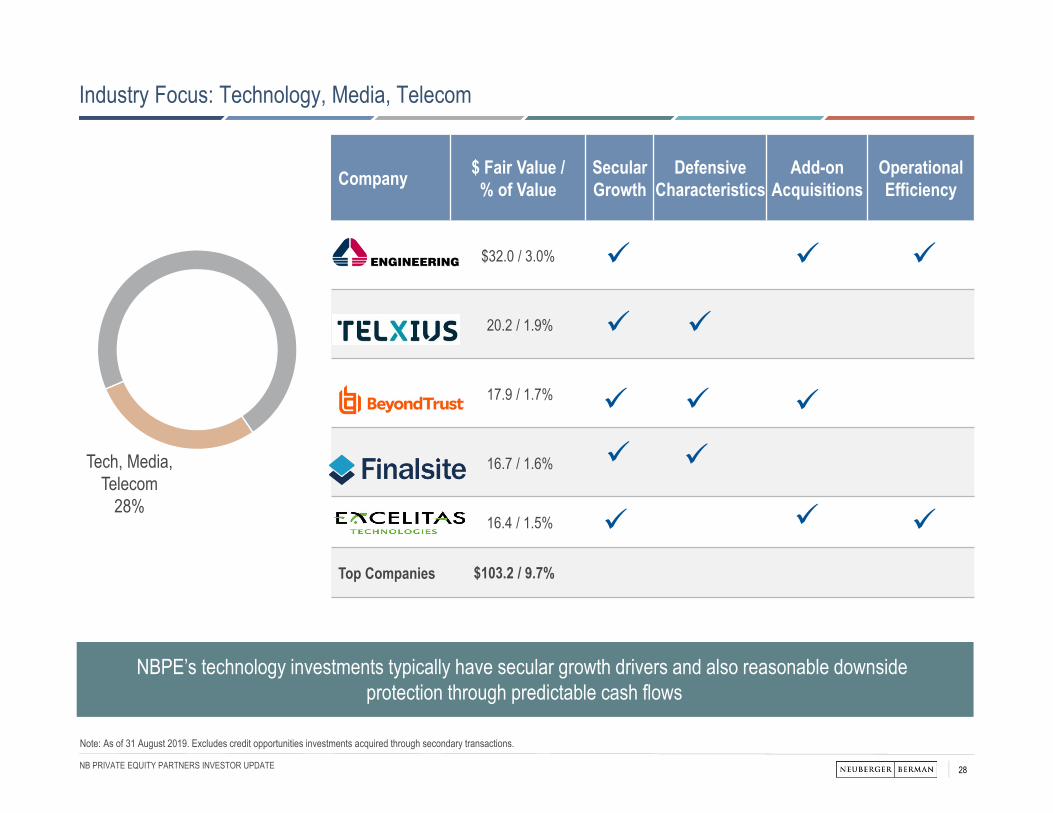
Industry Focus: Technology, Media, Telecom
Tech, Media, Telecom
28%
Note: As of 31 August 2019. Excludes credit opportunities investments acquired through secondary transactions.
NBPE’s technology investments typically have secular growth drivers and also reasonable downside protection through predictable cash flows
Company $ Fair Value / % of Value
Secular Growth
DefensiveCharacteristics
Add-onAcquisitions
OperationalEfficiency
$32.0 / 3.0%
20.2 / 1.9%
17.9 / 1.7%
16.7 / 1.6%
16.4 / 1.5%
Top Companies $103.2 / 9.7%
29NB PRIVATE EQUITY PARTNERS INVESTOR UPDATE
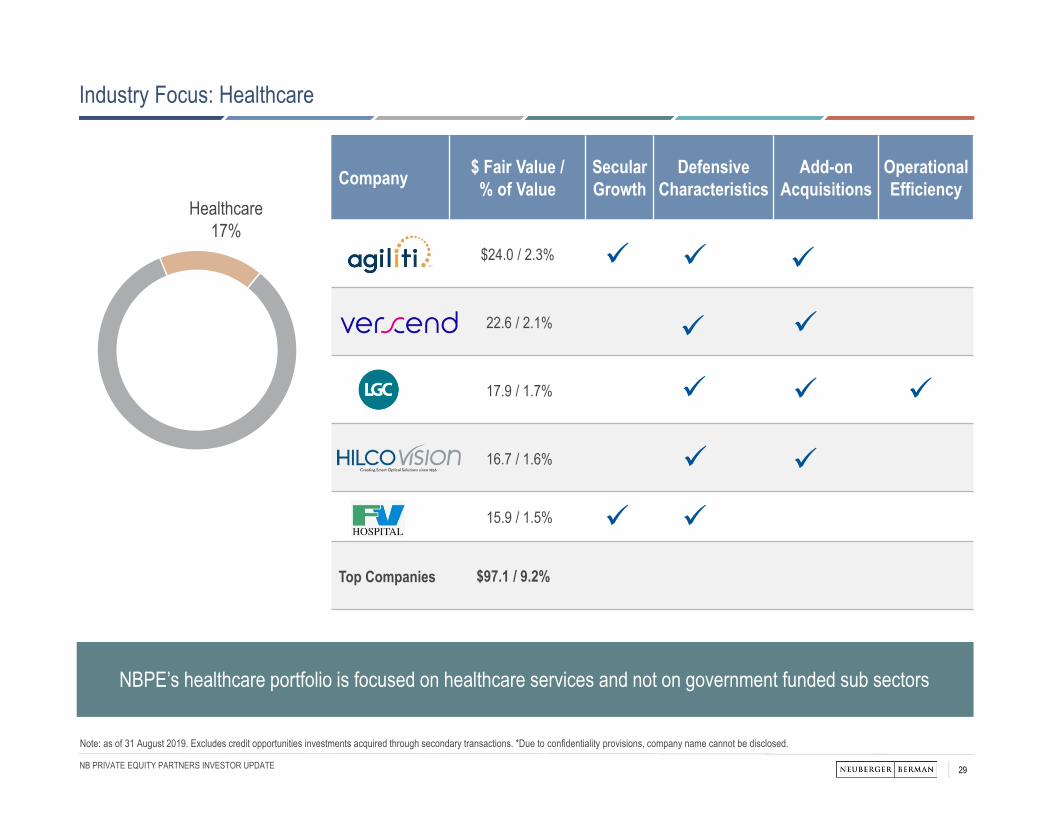
Industry Focus: Healthcare
Note: as of 31 August 2019. Excludes credit opportunities investments acquired through secondary transactions. *Due to confidentiality provisions, company name cannot be disclosed.
Healthcare17%
NBPE’s healthcare portfolio is focused on healthcare services and not on government funded sub sectors
Company $ Fair Value / % of Value
Secular Growth
DefensiveCharacteristics
Add-onAcquisitions
OperationalEfficiency
$24.0 / 2.3%
22.6 / 2.1%
17.9 / 1.7%
16.7 / 1.6%
15.9 / 1.5%
Top Companies $97.1 / 9.2%
30NB PRIVATE EQUITY PARTNERS INVESTOR UPDATE
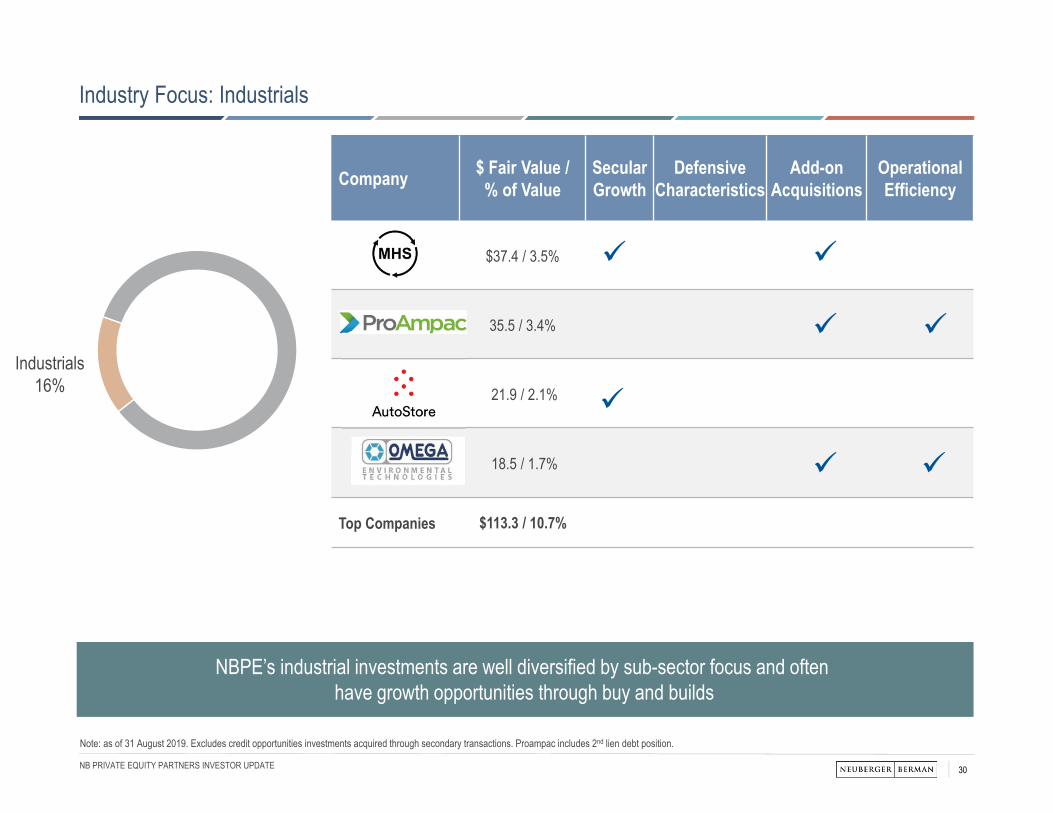
Industry Focus: Industrials
Industrials16%
Note: as of 31 August 2019. Excludes credit opportunities investments acquired through secondary transactions. Proampac includes 2nd lien debt position.
NBPE’s industrial investments are well diversified by sub-sector focus and often have growth opportunities through buy and builds
Company $ Fair Value / % of Value
Secular Growth
DefensiveCharacteristics
Add-onAcquisitions
OperationalEfficiency
$37.4 / 3.5%
35.5 / 3.4%
21.9 / 2.1%
18.5 / 1.7%
Top Companies $113.3 / 10.7%
31NB PRIVATE EQUITY PARTNERS INVESTOR UPDATE
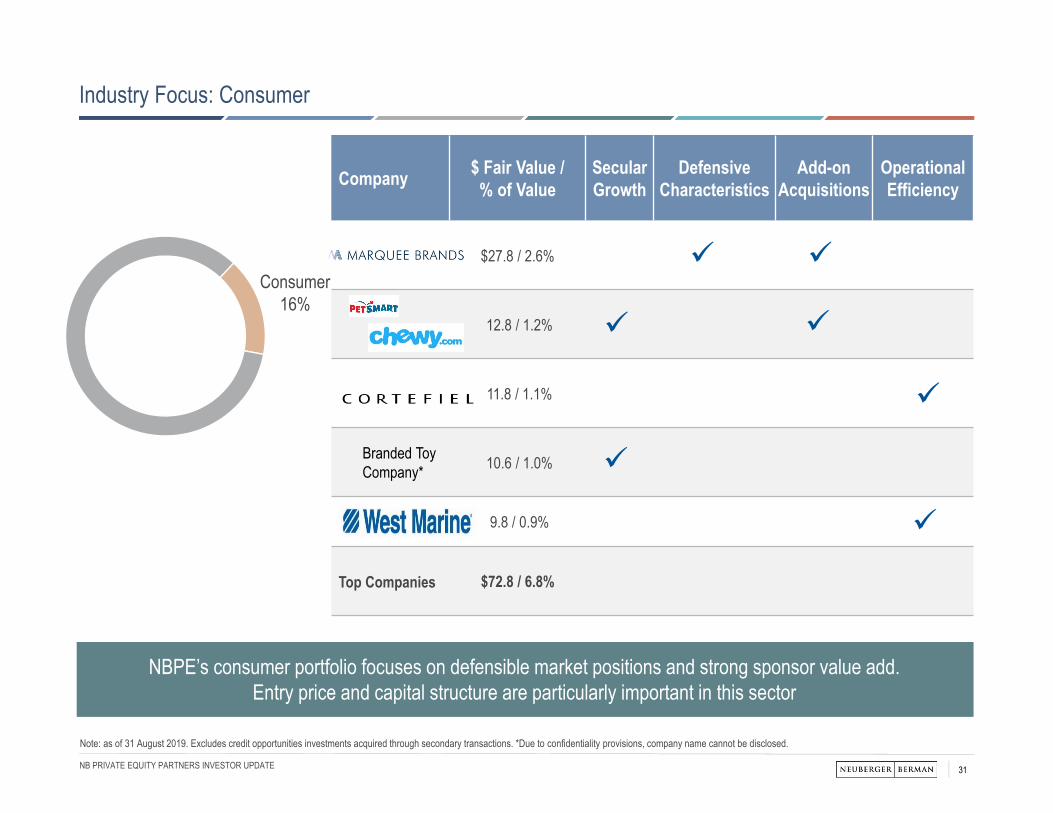
Industry Focus: Consumer
Note: as of 31 August 2019. Excludes credit opportunities investments acquired through secondary transactions. *Due to confidentiality provisions, company name cannot be disclosed.
Consumer16%
NBPE’s consumer portfolio focuses on defensible market positions and strong sponsor value add.Entry price and capital structure are particularly important in this sector
Company $ Fair Value / % of Value
Secular Growth
DefensiveCharacteristics
Add-onAcquisitions
OperationalEfficiency
$27.8 / 2.6%
12.8 / 1.2%
11.8 / 1.1%
10.6 / 1.0%
9.8 / 0.9%
Top Companies $72.8 / 6.8%
Branded Toy Company*
32NB PRIVATE EQUITY PARTNERS INVESTOR UPDATE
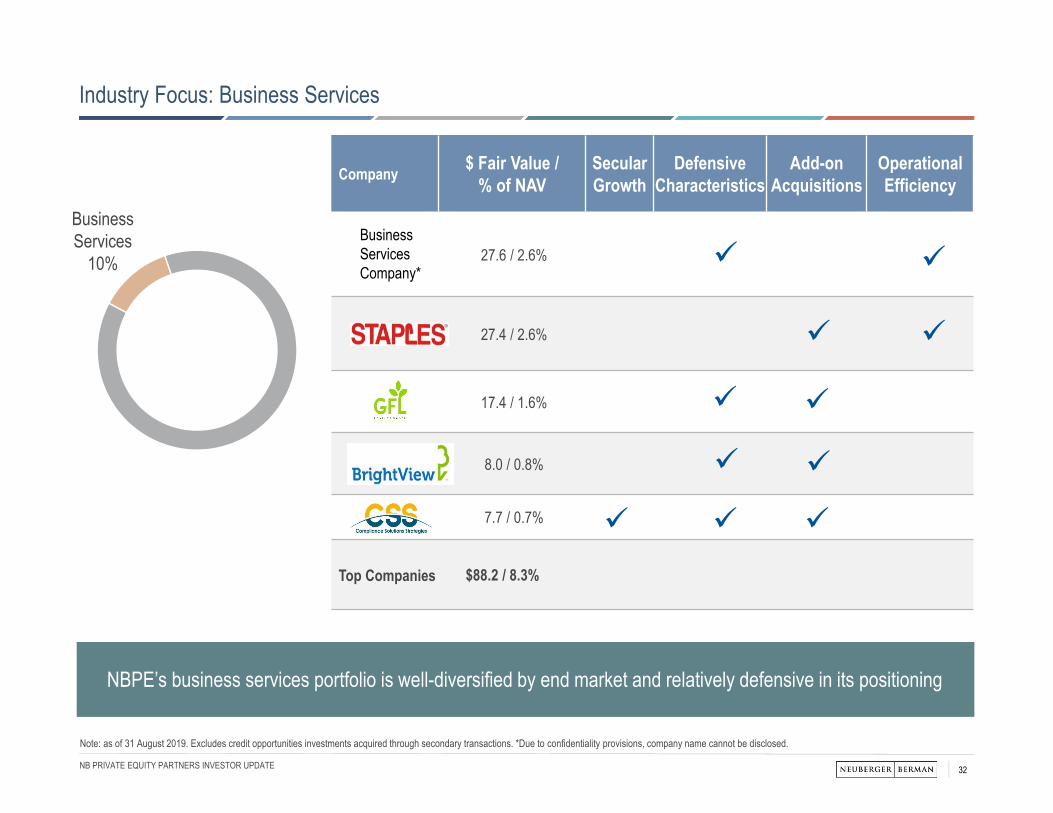
Industry Focus: Business Services
Business Services
10%
Note: as of 31 August 2019. Excludes credit opportunities investments acquired through secondary transactions. *Due to confidentiality provisions, company name cannot be disclosed.
NBPE’s business services portfolio is well-diversified by end market and relatively defensive in its positioning
Company $ Fair Value / % of NAV
Secular Growth
DefensiveCharacteristics
Add-onAcquisitions
OperationalEfficiency
27.6 / 2.6%
27.4 / 2.6%
17.4 / 1.6%
8.0 / 0.8%
7.7 / 0.7%
Top Companies $88.2 / 8.3%
Business Services Company*
Private Equity Market Overview
34NB PRIVATE EQUITY PARTNERS INVESTOR UPDATE
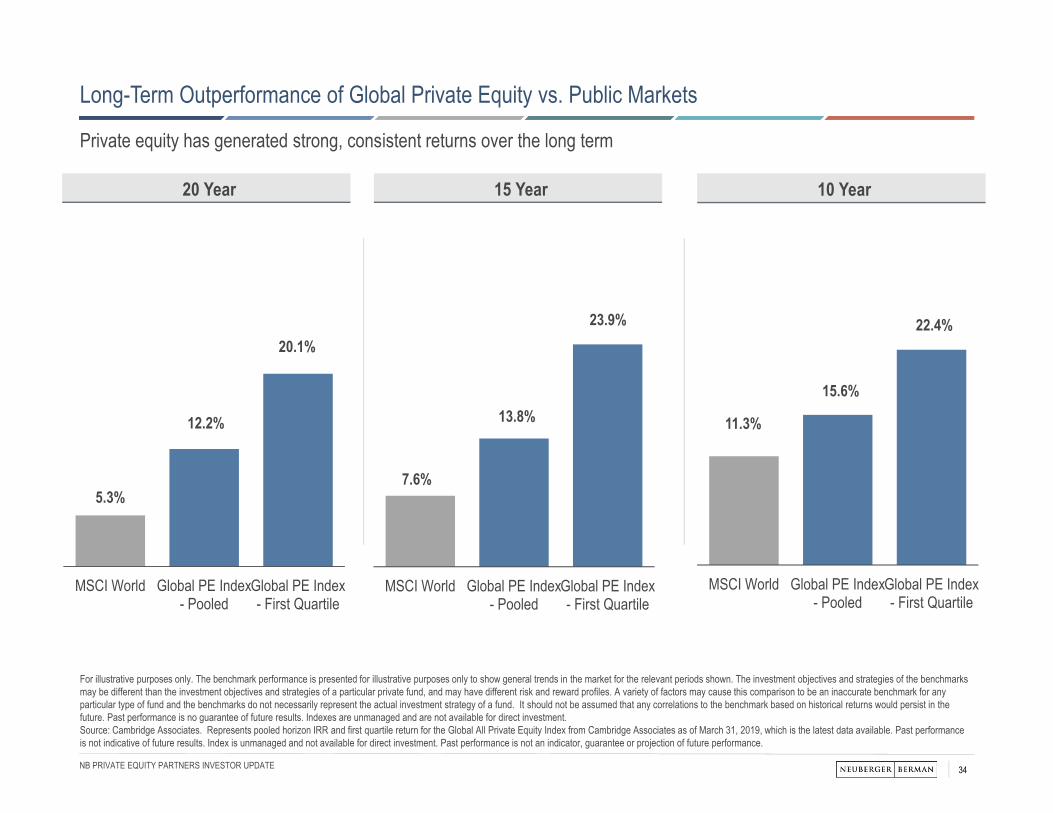
15 Year20 Year 10 Year
Private equity has generated strong, consistent returns over the long term
11.3%
15.6%
22.4%
MSCI World Global PE Index- Pooled
Global PE Index- First Quartile
7.6%
13.8%
23.9%
MSCI World Global PE Index- Pooled
Global PE Index- First Quartile
5.3%
12.2%
20.1%
MSCI World Global PE Index- Pooled
Global PE Index- First Quartile
For illustrative purposes only. The benchmark performance is presented for illustrative purposes only to show general trends in the market for the relevant periods shown. The investment objectives and strategies of the benchmarks may be different than the investment objectives and strategies of a particular private fund, and may have different risk and reward profiles. A variety of factors may cause this comparison to be an inaccurate benchmark for any particular type of fund and the benchmarks do not necessarily represent the actual investment strategy of a fund. It should not be assumed that any correlations to the benchmark based on historical returns would persist in the future. Past performance is no guarantee of future results. Indexes are unmanaged and are not available for direct investment. Source: Cambridge Associates. Represents pooled horizon IRR and first quartile return for the Global All Private Equity Index from Cambridge Associates as of March 31, 2019, which is the latest data available. Past performance is not indicative of future results. Index is unmanaged and not available for direct investment. Past performance is not an indicator, guarantee or projection of future performance.
Long-Term Outperformance of Global Private Equity vs. Public Markets
35NB PRIVATE EQUITY PARTNERS INVESTOR UPDATE
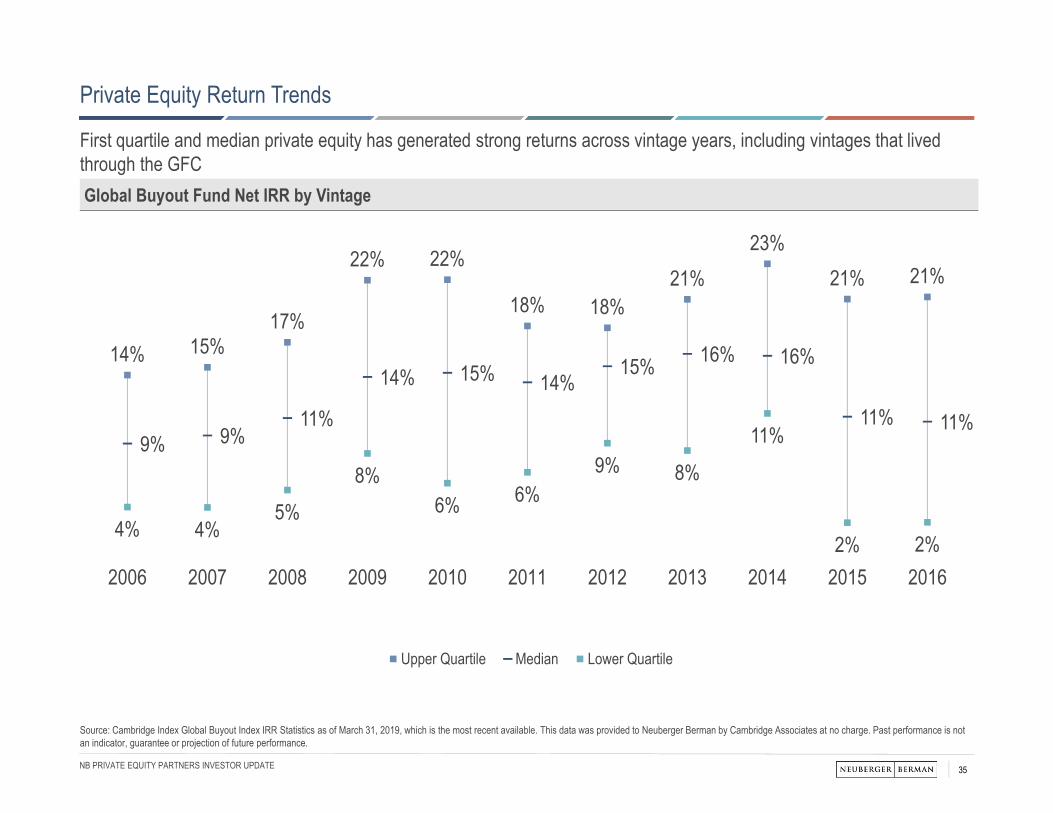
Global Buyout Fund Net IRR by Vintage
14% 15%17%
22% 22%
18% 18%21%
23%21% 21%
9% 9%11%
14% 15% 14%15% 16% 16%
11% 11%
4% 4%5%
8%6% 6%
9% 8%
11%
2% 2%2006 2007 2008 2009 2010 2011 2012 2013 2014 2015 2016
Upper Quartile Median Lower Quartile
First quartile and median private equity has generated strong returns across vintage years, including vintages that lived through the GFC
Source: Cambridge Index Global Buyout Index IRR Statistics as of March 31, 2019, which is the most recent available. This data was provided to Neuberger Berman by Cambridge Associates at no charge. Past performance is not an indicator, guarantee or projection of future performance.
Private Equity Return Trends
36NB PRIVATE EQUITY PARTNERS INVESTOR UPDATE
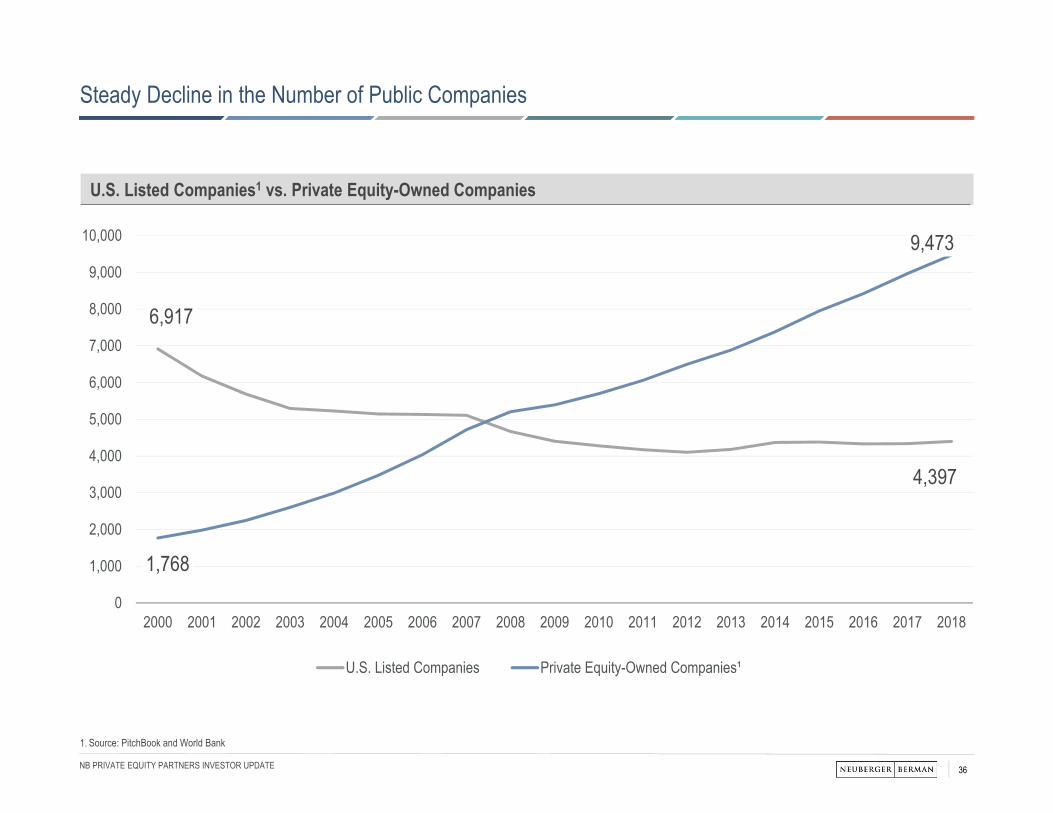
Steady Decline in the Number of Public Companies
1. Source: PitchBook and World Bank
6,917
4,397
1,768
9,473
0
1,000
2,000
3,000
4,000
5,000
6,000
7,000
8,000
9,000
10,000
2000 2001 2002 2003 2004 2005 2006 2007 2008 2009 2010 2011 2012 2013 2014 2015 2016 2017 2018
U.S. Listed Companies Private Equity-Owned Companies¹
U.S. Listed Companies1 vs. Private Equity-Owned Companies
37NB PRIVATE EQUITY PARTNERS INVESTOR UPDATE
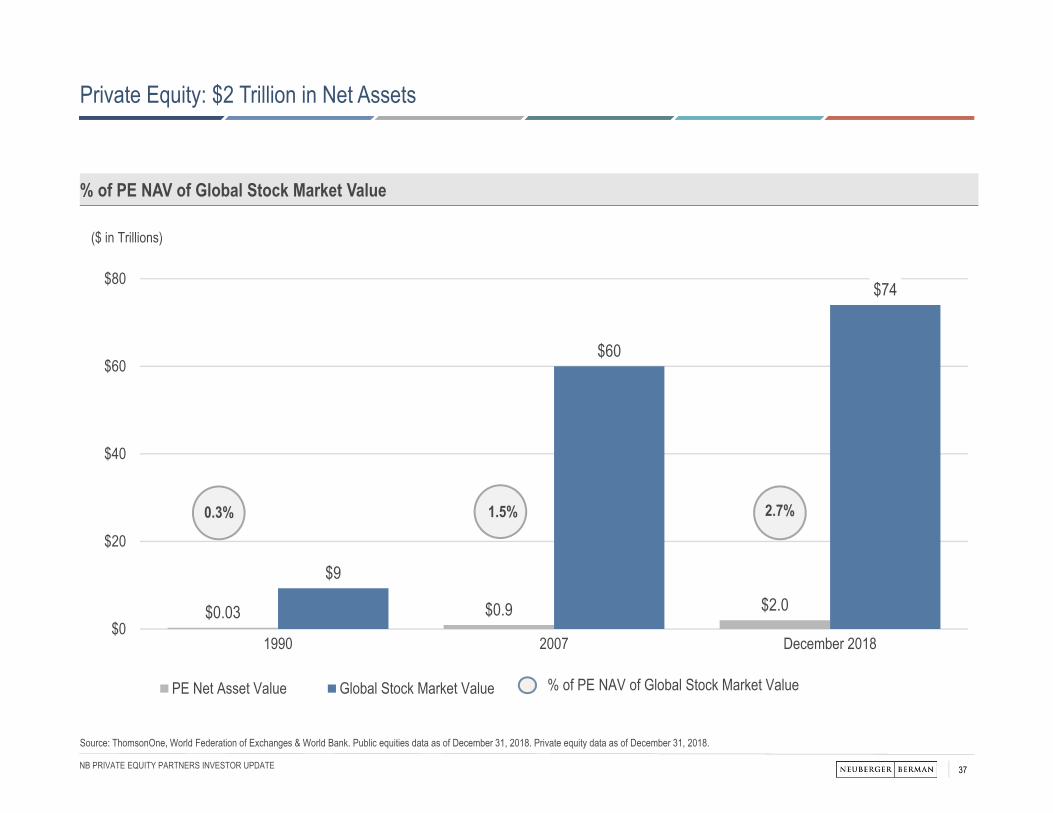
$0.03 $0.9 $2.0
$9
$60
$74
$0
$20
$40
$60
$80
1990 2007 December 2018
PE Net Asset Value Global Stock Market Value % of PE NAV of Global Stock Market Value
% of PE NAV of Global Stock Market Value
($ in Trillions)
0.3% 1.5% 2.7%
Source: ThomsonOne, World Federation of Exchanges & World Bank. Public equities data as of December 31, 2018. Private equity data as of December 31, 2018.
Private Equity: $2 Trillion in Net Assets
38NB PRIVATE EQUITY PARTNERS INVESTOR UPDATE
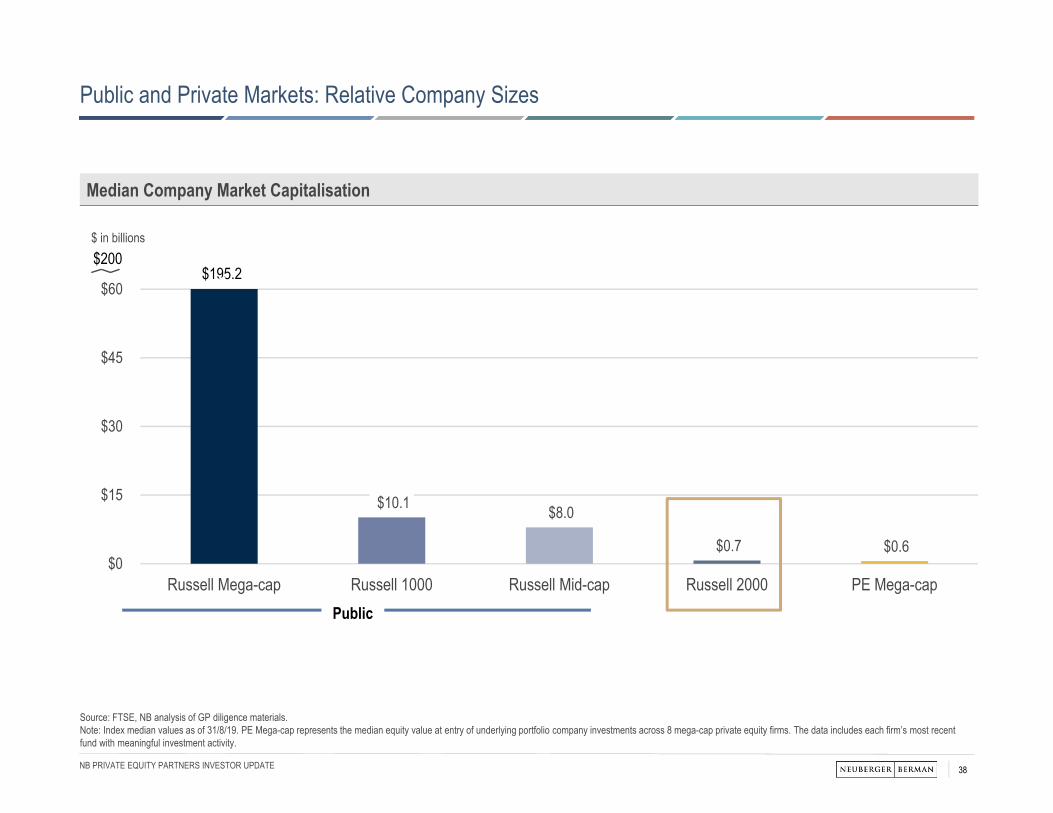
$10.1 $8.0
$0.7 $0.6 $0
$15
$30
$45
$60
Russell Mega-cap Russell 1000 Russell Mid-cap Russell 2000 PE Mega-cap
$ in billions
Public
$195.2$200
Median Company Market Capitalisation
Source: FTSE, NB analysis of GP diligence materials.Note: Index median values as of 31/8/19. PE Mega-cap represents the median equity value at entry of underlying portfolio company investments across 8 mega-cap private equity firms. The data includes each firm’s most recent fund with meaningful investment activity.
Public and Private Markets: Relative Company Sizes
39NB PRIVATE EQUITY PARTNERS INVESTOR UPDATE
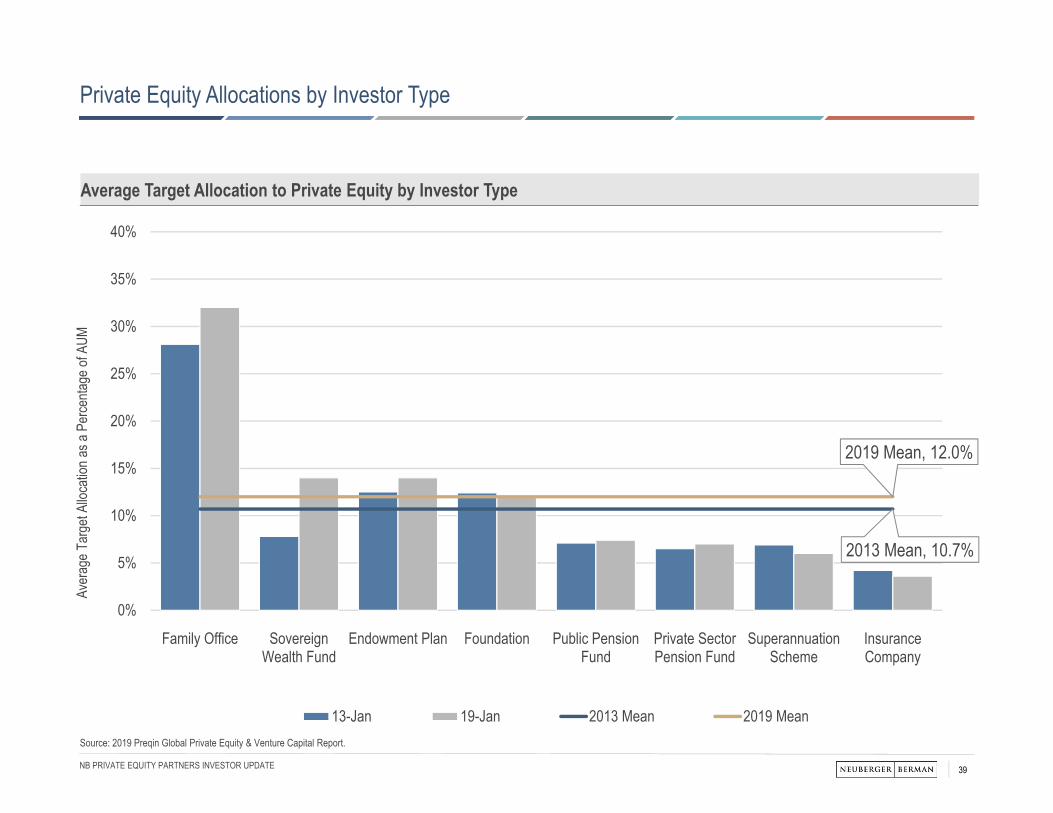
Average Target Allocation to Private Equity by Investor Type
2013 Mean, 10.7%
2019 Mean, 12.0%
0%
5%
10%
15%
20%
25%
30%
35%
40%
Family Office SovereignWealth Fund
Endowment Plan Foundation Public PensionFund
Private SectorPension Fund
SuperannuationScheme
InsuranceCompany
13-Jan 19-Jan 2013 Mean 2019 Mean
Aver
age T
arge
t Allo
catio
n as a
Per
centa
ge of
AUM
Source: 2019 Preqin Global Private Equity & Venture Capital Report.
Private Equity Allocations by Investor Type
40NB PRIVATE EQUITY PARTNERS INVESTOR UPDATE
$114 $81 $104$168
$232
$381
$638
$1,043
$453
$163
$316$391 $398
$489
$629
$791
$683$744 $790
$228
$727
$0
$200
$400
$600
$800
$1,000
$1,200
2000 2001 2002 2003 2004 2005 2006 2007 2008 2009 2010 2011 2012 2013 2014 2015 2016 2017 2018 1H2019
Total Capital Invested (Billions) 5 Year Average
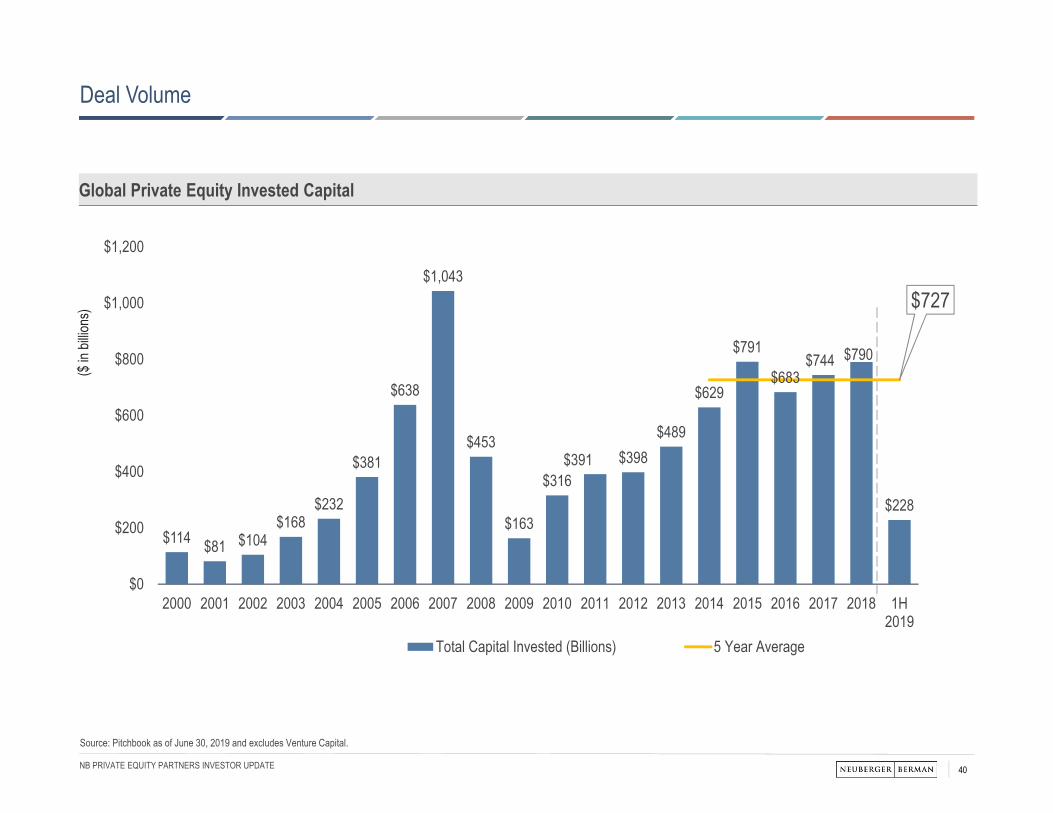
Global Private Equity Invested Capital
($ in
billio
ns)
Source: Pitchbook as of June 30, 2019 and excludes Venture Capital.
Deal Volume
41NB PRIVATE EQUITY PARTNERS INVESTOR UPDATE
8.8x 9.3x 8.7x9.7x
9.2x10.0x
10.3x 10.9x
9.7x
7.2x 7.5x8.5x
9.3x
10.6x 10.5x 10.0x9.6x
9.4x
0x
2x
4x
6x
8x
10x
12x
14x
2011 2012 2013 2014 2015 2016 2017 2018 1H2019
Europe New Private Transactions Europe Public
8.8x 8… 8.8x
9.7x 10.3x10.0x10.6x 10.6x
11.2x
8.4x 8.2x
9.1x10.0x
10.5x11.1x12.2x 12.6x 12.3x
0x
2x
4x
6x
8x
10x
12x
14x
2011 2012 2013 2014 2015 2016 2017 2018 1H2019
U.S. New Private Transactions U.S. Public
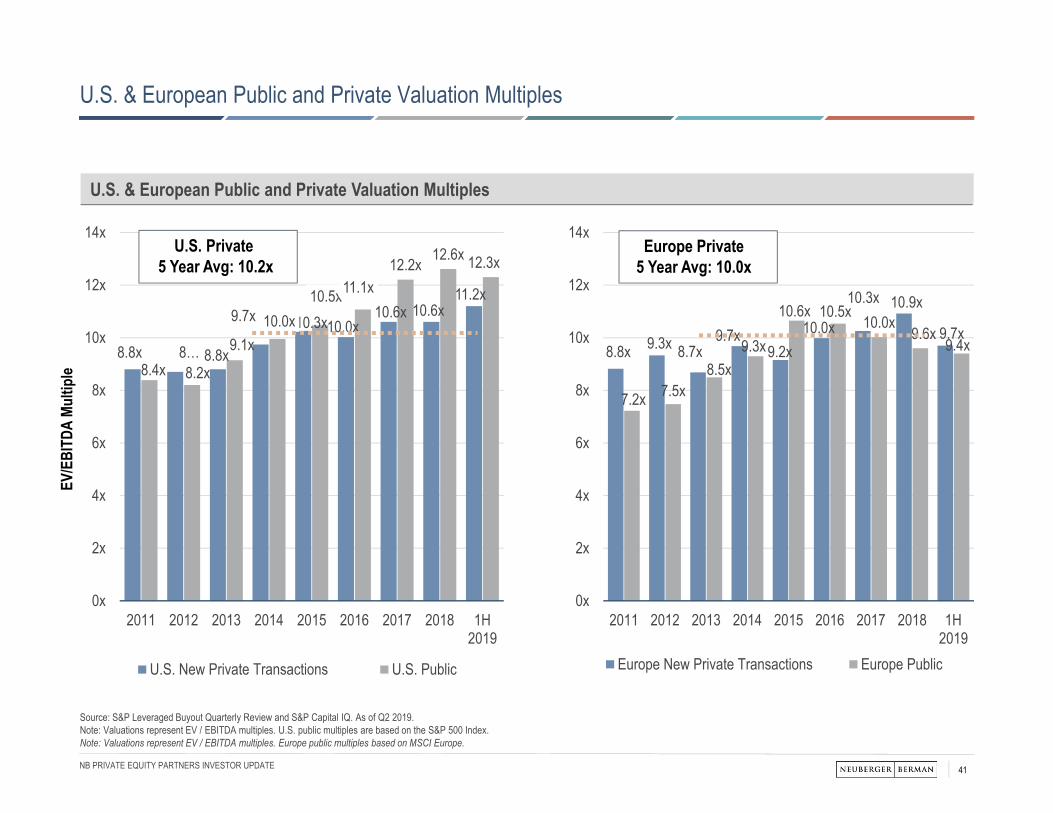
U.S. & European Public and Private Valuation Multiples
Source: S&P Leveraged Buyout Quarterly Review and S&P Capital IQ. As of Q2 2019. Note: Valuations represent EV / EBITDA multiples. U.S. public multiples are based on the S&P 500 Index.Note: Valuations represent EV / EBITDA multiples. Europe public multiples based on MSCI Europe.
U.S. & European Public and Private Valuation Multiples
EV/E
BITD
A Mu
ltipl
e
Europe Private 5 Year Avg: 10.0x
U.S. Private5 Year Avg: 10.2x
42NB PRIVATE EQUITY PARTNERS INVESTOR UPDATE
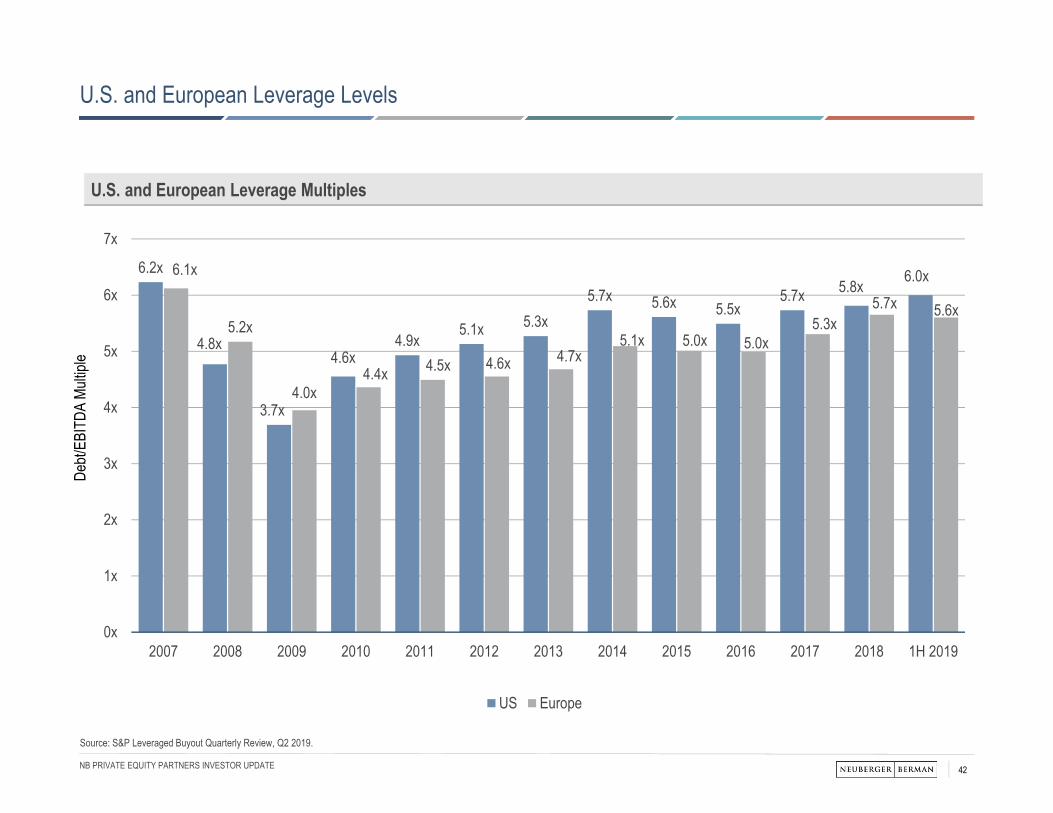
U.S. and European Leverage Multiples
Debt/
EBIT
DA M
ultipl
e
6.2x
4.8x
3.7x
4.6x4.9x
5.1x 5.3x5.7x 5.6x 5.5x
5.7x 5.8x 6.0x6.1x
5.2x
4.0x4.4x 4.5x 4.6x 4.7x
5.1x 5.0x 5.0x5.3x
5.7x 5.6x
0x
1x
2x
3x
4x
5x
6x
7x
2007 2008 2009 2010 2011 2012 2013 2014 2015 2016 2017 2018 1H 2019
US Europe
Source: S&P Leveraged Buyout Quarterly Review, Q2 2019.
U.S. and European Leverage Levels
43NB PRIVATE EQUITY PARTNERS INVESTOR UPDATE
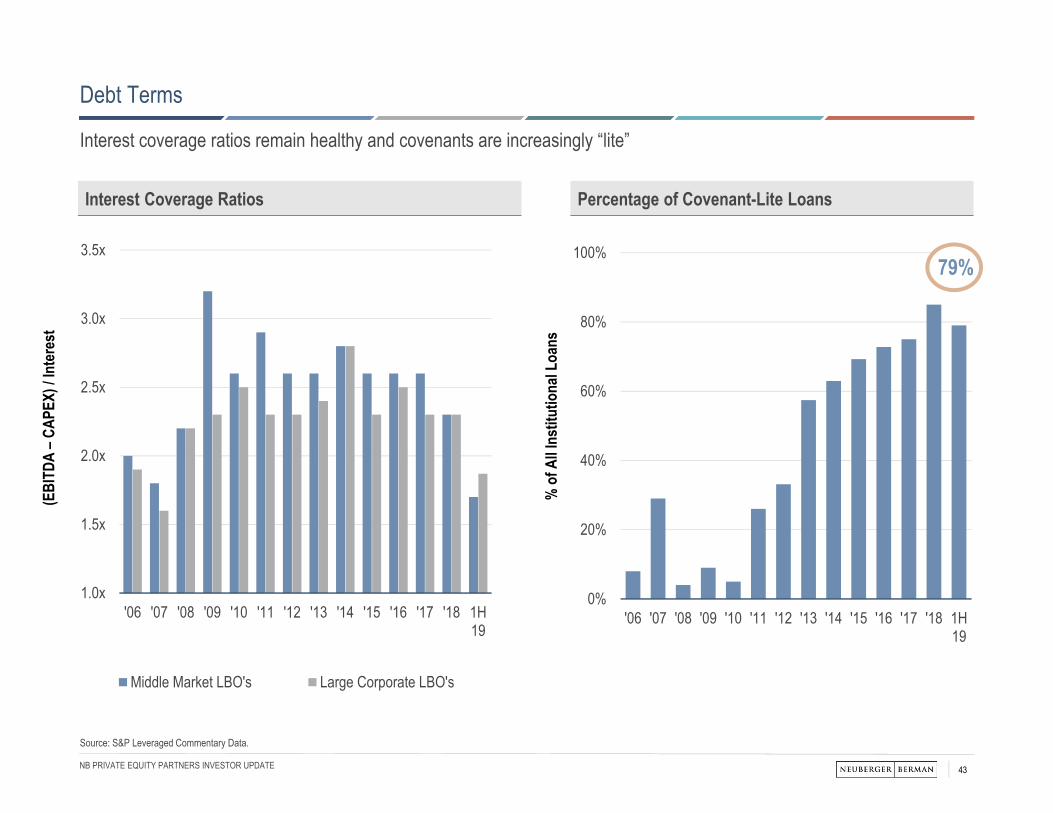
Debt Terms
Source: S&P Leveraged Commentary Data.
1.0x
1.5x
2.0x
2.5x
3.0x
3.5x
'06 '07 '08 '09 '10 '11 '12 '13 '14 '15 '16 '17 '18 1H19
Middle Market LBO's Large Corporate LBO's
0%
20%
40%
60%
80%
100%
'06 '07 '08 '09 '10 '11 '12 '13 '14 '15 '16 '17 '18 1H19
(EBI
TDA
–CAP
EX) /
Inte
rest
% o
f All I
nstit
utio
nal L
oans
Interest Coverage Ratios Percentage of Covenant-Lite Loans
79%
Interest coverage ratios remain healthy and covenants are increasingly “lite”
44NB PRIVATE EQUITY PARTNERS INVESTOR UPDATE
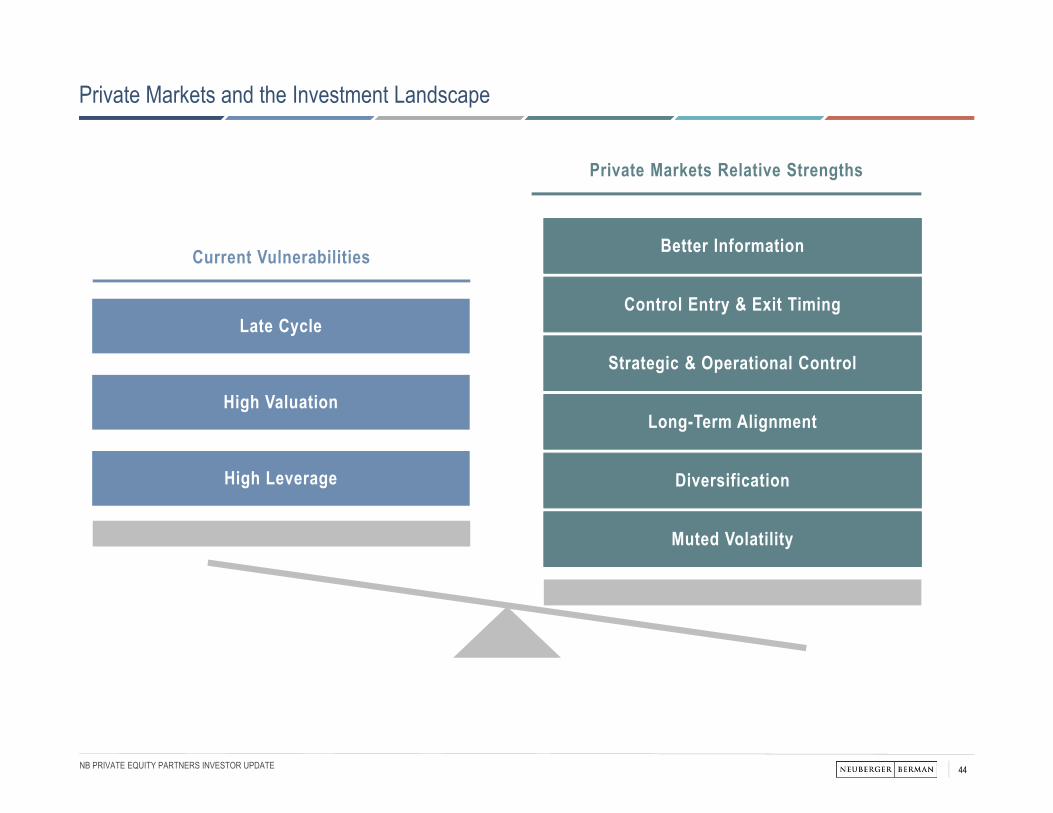
Private Markets and the Investment Landscape
Current Vulnerabilities
Private Markets Relative Strengths
Late Cycle
High Valuation
High Leverage
Better Information
Control Entry & Exit Timing
Strategic & Operational Control
Long-Term Alignment
Diversification
Muted Volatility

Schedules of Investments and Disclaimers
46NB PRIVATE EQUITY PARTNERS INVESTOR UPDATE
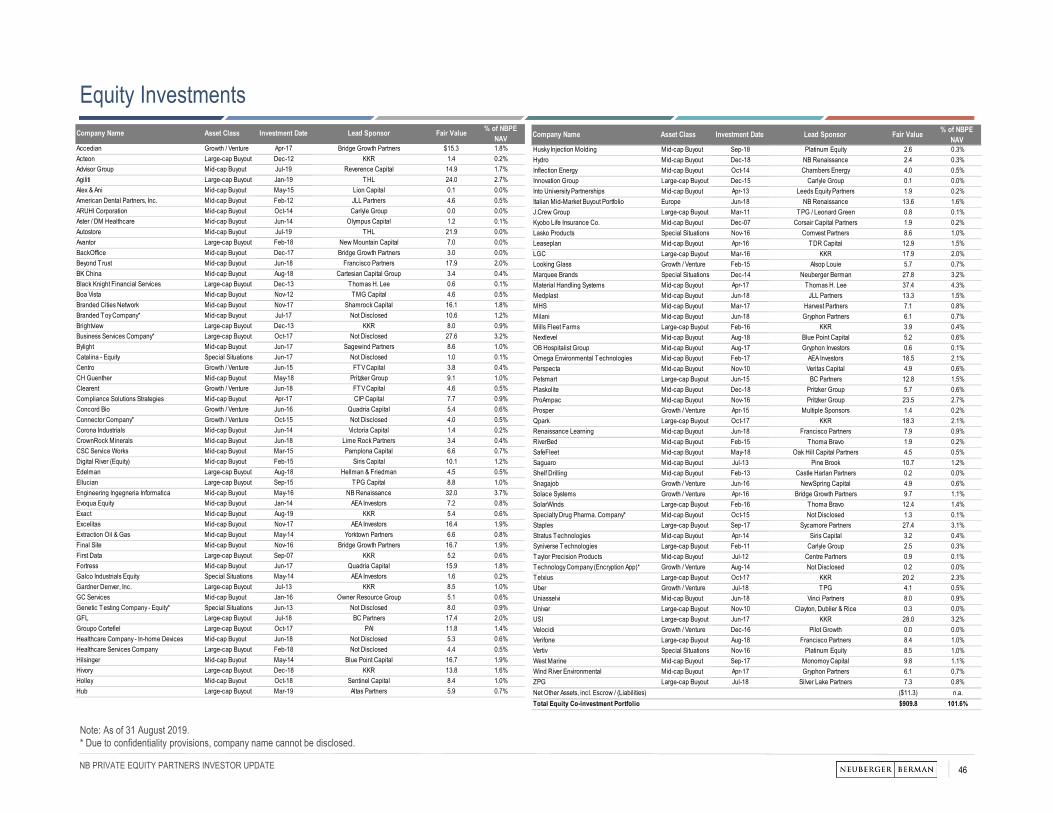
Equity Investments
Note: As of 31 August 2019.* Due to confidentiality provisions, company name cannot be disclosed.
Company Name Asset Class Investment Date Lead Sponsor Fair Value % of NBPE NAV
Husky Injection Molding Mid-cap Buyout Sep-18 Platinum Equity 2.6 0.3%Hydro Mid-cap Buyout Dec-18 NB Renaissance 2.4 0.3%Inflection Energy Mid-cap Buyout Oct-14 Chambers Energy 4.0 0.5%Innovation Group Large-cap Buyout Dec-15 Carlyle Group 0.1 0.0%Into University Partnerships Mid-cap Buyout Apr-13 Leeds Equity Partners 1.9 0.2%Italian Mid-Market Buyout Portfolio Europe Jun-18 NB Renaissance 13.6 1.6%J.Crew Group Large-cap Buyout Mar-11 TPG / Leonard Green 0.8 0.1%Kyobo Life Insurance Co. Mid-cap Buyout Dec-07 Corsair Capital Partners 1.9 0.2%Lasko Products Special Situations Nov-16 Comvest Partners 8.6 1.0%Leaseplan Mid-cap Buyout Apr-16 TDR Capital 12.9 1.5%LGC Large-cap Buyout Mar-16 KKR 17.9 2.0%Looking Glass Growth / Venture Feb-15 Alsop Louie 5.7 0.7%Marquee Brands Special Situations Dec-14 Neuberger Berman 27.8 3.2%Material Handling Systems Mid-cap Buyout Apr-17 Thomas H. Lee 37.4 4.3%Medplast Mid-cap Buyout Jun-18 JLL Partners 13.3 1.5%MHS Mid-cap Buyout Mar-17 Harvest Partners 7.1 0.8%Milani Mid-cap Buyout Jun-18 Gryphon Partners 6.1 0.7%Mills Fleet Farms Large-cap Buyout Feb-16 KKR 3.9 0.4%Nextlevel Mid-cap Buyout Aug-18 Blue Point Capital 5.2 0.6%OB Hospitalist Group Mid-cap Buyout Aug-17 Gryphon Investors 0.6 0.1%Omega Environmental Technologies Mid-cap Buyout Feb-17 AEA Investors 18.5 2.1%Perspecta Mid-cap Buyout Nov-10 Veritas Capital 4.9 0.6%Petsmart Large-cap Buyout Jun-15 BC Partners 12.8 1.5%Plaskolite Mid-cap Buyout Dec-18 Pritzker Group 5.7 0.6%ProAmpac Mid-cap Buyout Nov-16 Pritzker Group 23.5 2.7%Prosper Growth / Venture Apr-15 Multiple Sponsors 1.4 0.2%Qpark Large-cap Buyout Oct-17 KKR 18.3 2.1%Renaissance Learning Mid-cap Buyout Jun-18 Francisco Partners 7.9 0.9%RiverBed Mid-cap Buyout Feb-15 Thoma Bravo 1.9 0.2%SafeFleet Mid-cap Buyout May-18 Oak Hill Capital Partners 4.5 0.5%Saguaro Mid-cap Buyout Jul-13 Pine Brook 10.7 1.2%Shelf Drilling Mid-cap Buyout Feb-13 Castle Harlan Partners 0.2 0.0%Snagajob Growth / Venture Jun-16 NewSpring Capital 4.9 0.6%Solace Systems Growth / Venture Apr-16 Bridge Growth Partners 9.7 1.1%SolarWinds Large-cap Buyout Feb-16 Thoma Bravo 12.4 1.4%Specialty Drug Pharma. Company* Mid-cap Buyout Oct-15 Not Disclosed 1.3 0.1%Staples Large-cap Buyout Sep-17 Sycamore Partners 27.4 3.1%Stratus Technologies Mid-cap Buyout Apr-14 Siris Capital 3.2 0.4%Syniverse Technologies Large-cap Buyout Feb-11 Carlyle Group 2.5 0.3%Taylor Precision Products Mid-cap Buyout Jul-12 Centre Partners 0.9 0.1%Technology Company (Encryption App)* Growth / Venture Aug-14 Not Disclosed 0.2 0.0%Telxius Large-cap Buyout Oct-17 KKR 20.2 2.3%Uber Growth / Venture Jul-18 TPG 4.1 0.5%Uniasselvi Mid-cap Buyout Jun-18 Vinci Partners 8.0 0.9%Univar Large-cap Buyout Nov-10 Clayton, Dublier & Rice 0.3 0.0%USI Large-cap Buyout Jun-17 KKR 28.0 3.2%Velocidi Growth / Venture Dec-16 Pilot Growth 0.0 0.0%Verifone Large-cap Buyout Aug-18 Francisco Partners 8.4 1.0%Vertiv Special Situations Nov-16 Platinum Equity 8.5 1.0%West Marine Mid-cap Buyout Sep-17 Monomoy Capital 9.8 1.1%Wind River Environmental Mid-cap Buyout Apr-17 Gryphon Partners 6.1 0.7%ZPG Large-cap Buyout Jul-18 Silver Lake Partners 7.3 0.8%Net Other Assets, incl. Escrow / (Liabilities) ($11.3) n.a.Total Equity Co-investment Portfolio $909.8 101.6%
Company Name Asset Class Investment Date Lead Sponsor Fair Value % of NBPE NAV
Accedian Growth / Venture Apr-17 Bridge Growth Partners $15.3 1.8%Acteon Large-cap Buyout Dec-12 KKR 1.4 0.2%Advisor Group Mid-cap Buyout Jul-19 Reverence Capital 14.9 1.7%Agiliti Large-cap Buyout Jan-19 THL 24.0 2.7%Alex & Ani Mid-cap Buyout May-15 Lion Capital 0.1 0.0%American Dental Partners, Inc. Mid-cap Buyout Feb-12 JLL Partners 4.6 0.5%ARUHI Corporation Mid-cap Buyout Oct-14 Carlyle Group 0.0 0.0%Aster / DM Healthcare Mid-cap Buyout Jun-14 Olympus Capital 1.2 0.1%Autostore Mid-cap Buyout Jul-19 THL 21.9 0.0%Avantor Large-cap Buyout Feb-18 New Mountain Capital 7.0 0.0%BackOffice Mid-cap Buyout Dec-17 Bridge Growth Partners 3.0 0.0%Beyond Trust Mid-cap Buyout Jun-18 Francisco Partners 17.9 2.0%BK China Mid-cap Buyout Aug-18 Cartesian Capital Group 3.4 0.4%Black Knight Financial Services Large-cap Buyout Dec-13 Thomas H. Lee 0.6 0.1%Boa Vista Mid-cap Buyout Nov-12 TMG Capital 4.6 0.5%Branded Cities Network Mid-cap Buyout Nov-17 Shamrock Capital 16.1 1.8%Branded Toy Company* Mid-cap Buyout Jul-17 Not Disclosed 10.6 1.2%Brightview Large-cap Buyout Dec-13 KKR 8.0 0.9%Business Services Company* Large-cap Buyout Oct-17 Not Disclosed 27.6 3.2%Bylight Mid-cap Buyout Jun-17 Sagewind Partners 8.6 1.0%Catalina - Equity Special Situations Jun-17 Not Disclosed 1.0 0.1%Centro Growth / Venture Jun-15 FTV Capital 3.8 0.4%CH Guenther Mid-cap Buyout May-18 Pritzker Group 9.1 1.0%Clearent Growth / Venture Jun-18 FTV Capital 4.6 0.5%Compliance Solutions Strategies Mid-cap Buyout Apr-17 CIP Capital 7.7 0.9%Concord Bio Growth / Venture Jun-16 Quadria Capital 5.4 0.6%Connector Company* Growth / Venture Oct-15 Not Disclosed 4.0 0.5%Corona Industrials Mid-cap Buyout Jun-14 Victoria Capital 1.4 0.2%CrownRock Minerals Mid-cap Buyout Jun-18 Lime Rock Partners 3.4 0.4%CSC Service Works Mid-cap Buyout Mar-15 Pamplona Capital 6.6 0.7%Digital River (Equity) Mid-cap Buyout Feb-15 Siris Capital 10.1 1.2%Edelman Large-cap Buyout Aug-18 Hellman & Friedman 4.5 0.5%Ellucian Large-cap Buyout Sep-15 TPG Capital 8.8 1.0%Engineering Ingegneria Informatica Mid-cap Buyout May-16 NB Renaissance 32.0 3.7%Evoqua Equity Mid-cap Buyout Jan-14 AEA Investors 7.2 0.8%Exact Mid-cap Buyout Aug-19 KKR 5.4 0.6%Excelitas Mid-cap Buyout Nov-17 AEA Investors 16.4 1.9%Extraction Oil & Gas Mid-cap Buyout May-14 Yorktown Partners 6.6 0.8%Final Site Mid-cap Buyout Nov-16 Bridge Growth Partners 16.7 1.9%First Data Large-cap Buyout Sep-07 KKR 5.2 0.6%Fortress Mid-cap Buyout Jun-17 Quadria Capital 15.9 1.8%Galco Industrials Equity Special Situations May-14 AEA Investors 1.6 0.2%Gardner Denver, Inc. Large-cap Buyout Jul-13 KKR 8.5 1.0%GC Services Mid-cap Buyout Jan-16 Owner Resource Group 5.1 0.6%Genetic Testing Company - Equity* Special Situations Jun-13 Not Disclosed 8.0 0.9%GFL Large-cap Buyout Jul-18 BC Partners 17.4 2.0%Groupo Cortefiel Large-cap Buyout Oct-17 PAI 11.8 1.4%Healthcare Company - In-home Devices Mid-cap Buyout Jun-18 Not Disclosed 5.3 0.6%Healthcare Services Company Large-cap Buyout Feb-18 Not Disclosed 4.4 0.5%Hilsinger Mid-cap Buyout May-14 Blue Point Capital 16.7 1.9%Hivory Large-cap Buyout Dec-18 KKR 13.8 1.6%Holley Mid-cap Buyout Oct-18 Sentinel Capital 8.4 1.0%Hub Large-cap Buyout Mar-19 Altas Partners 5.9 0.7%
47NB PRIVATE EQUITY PARTNERS INVESTOR UPDATE
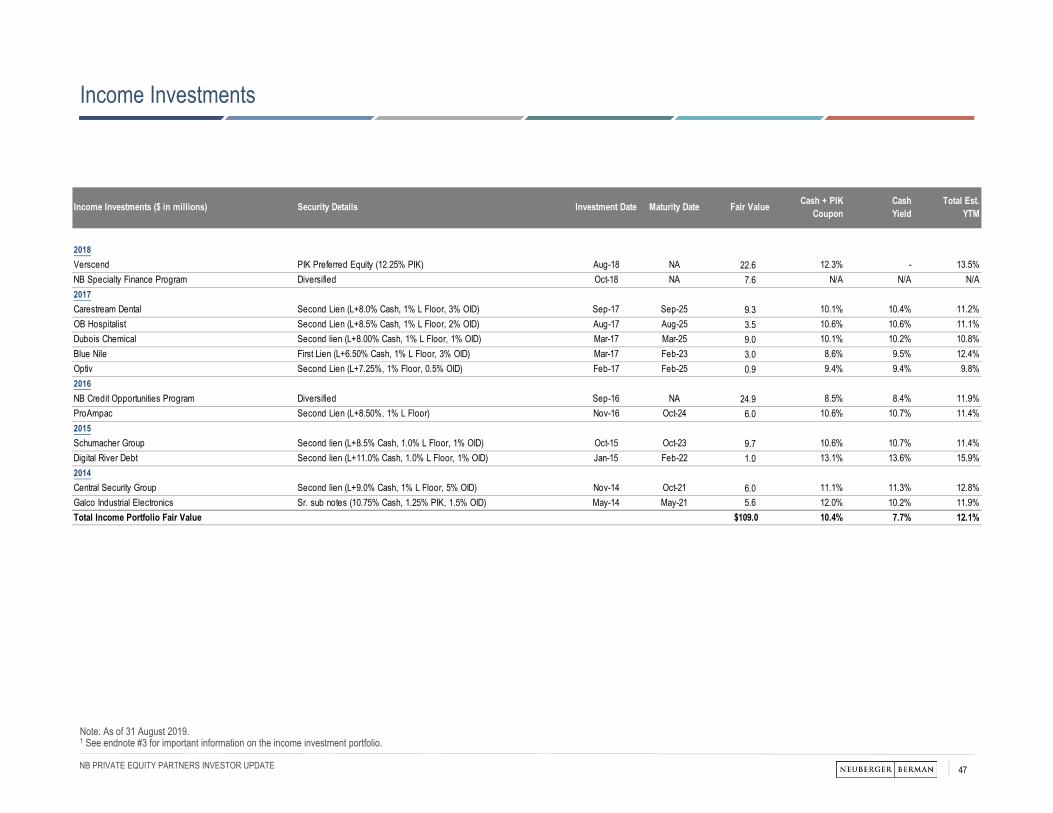
Income Investments
Note: As of 31 August 2019.1 See endnote #3 for important information on the income investment portfolio.
Income Investments ($ in millions) Security Details Investment Date Maturity Date Fair Value Cash + PIK Coupon
Cash Yield
Total Est. YTM
2018Verscend PIK Preferred Equity (12.25% PIK) Aug-18 NA 22.6 12.3% - 13.5%NB Specialty Finance Program Diversified Oct-18 NA 7.6 N/A N/A N/A2017Carestream Dental Second Lien (L+8.0% Cash, 1% L Floor, 3% OID) Sep-17 Sep-25 9.3 10.1% 10.4% 11.2%OB Hospitalist Second Lien (L+8.5% Cash, 1% L Floor, 2% OID) Aug-17 Aug-25 3.5 10.6% 10.6% 11.1%Dubois Chemical Second lien (L+8.00% Cash, 1% L Floor, 1% OID) Mar-17 Mar-25 9.0 10.1% 10.2% 10.8%Blue Nile First Lien (L+6.50% Cash, 1% L Floor, 3% OID) Mar-17 Feb-23 3.0 8.6% 9.5% 12.4%Optiv Second Lien (L+7.25%, 1% Floor, 0.5% OID) Feb-17 Feb-25 0.9 9.4% 9.4% 9.8%2016NB Credit Opportunities Program Diversified Sep-16 NA 24.9 8.5% 8.4% 11.9%ProAmpac Second Lien (L+8.50%, 1% L Floor) Nov-16 Oct-24 6.0 10.6% 10.7% 11.4%2015Schumacher Group Second lien (L+8.5% Cash, 1.0% L Floor, 1% OID) Oct-15 Oct-23 9.7 10.6% 10.7% 11.4%Digital River Debt Second lien (L+11.0% Cash, 1.0% L Floor, 1% OID) Jan-15 Feb-22 1.0 13.1% 13.6% 15.9%2014Central Security Group Second lien (L+9.0% Cash, 1% L Floor, 5% OID) Nov-14 Oct-21 6.0 11.1% 11.3% 12.8%Galco Industrial Electronics Sr. sub notes (10.75% Cash, 1.25% PIK, 1.5% OID) May-14 May-21 5.6 12.0% 10.2% 11.9%Total Income Portfolio Fair Value $109.0 10.4% 7.7% 12.1%
48NB PRIVATE EQUITY PARTNERS INVESTOR UPDATE
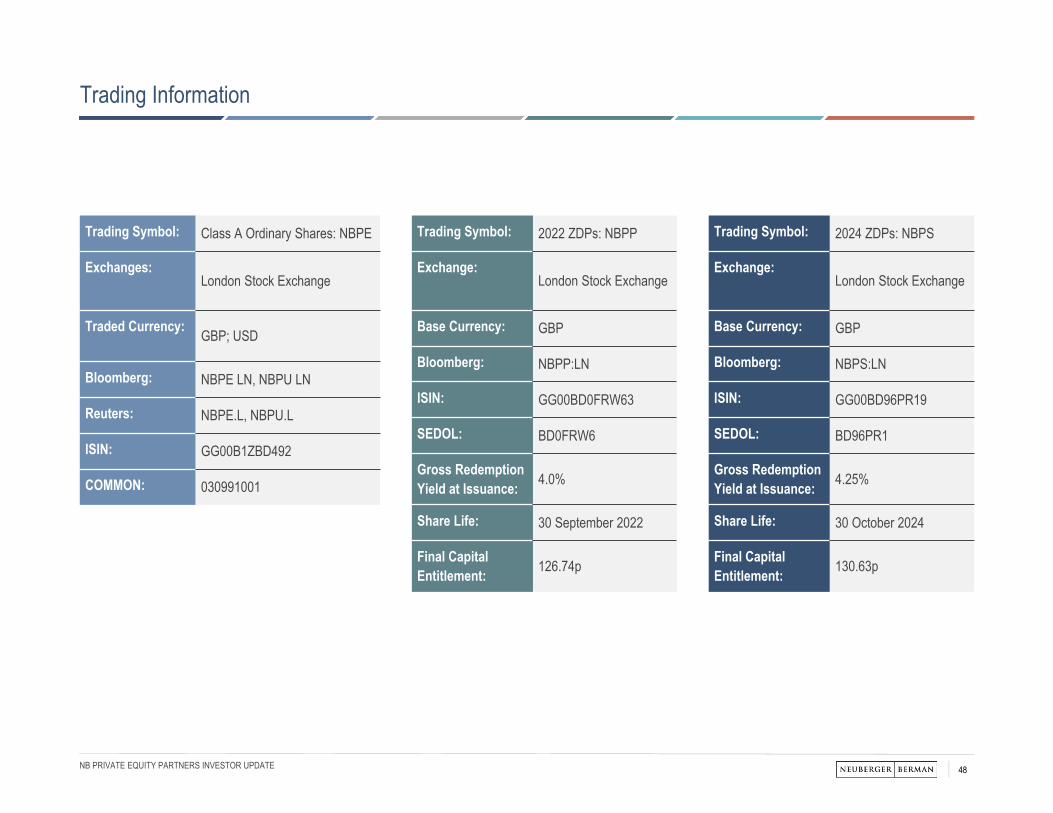
Trading Information
Trading Symbol: Class A Ordinary Shares: NBPE
Exchanges:London Stock Exchange
Traded Currency: GBP; USD
Bloomberg: NBPE LN, NBPU LN
Reuters: NBPE.L, NBPU.L
ISIN: GG00B1ZBD492
COMMON: 030991001
Trading Symbol: 2022 ZDPs: NBPP
Exchange:London Stock Exchange
Base Currency: GBP
Bloomberg: NBPP:LN
ISIN: GG00BD0FRW63
SEDOL: BD0FRW6
Gross Redemption Yield at Issuance: 4.0%
Share Life: 30 September 2022
Final Capital Entitlement: 126.74p
Trading Symbol: 2024 ZDPs: NBPS
Exchange:London Stock Exchange
Base Currency: GBP
Bloomberg: NBPS:LN
ISIN: GG00BD96PR19
SEDOL: BD96PR1
Gross Redemption Yield at Issuance: 4.25%
Share Life: 30 October 2024
Final Capital Entitlement: 130.63p
49NB PRIVATE EQUITY PARTNERS INVESTOR UPDATE
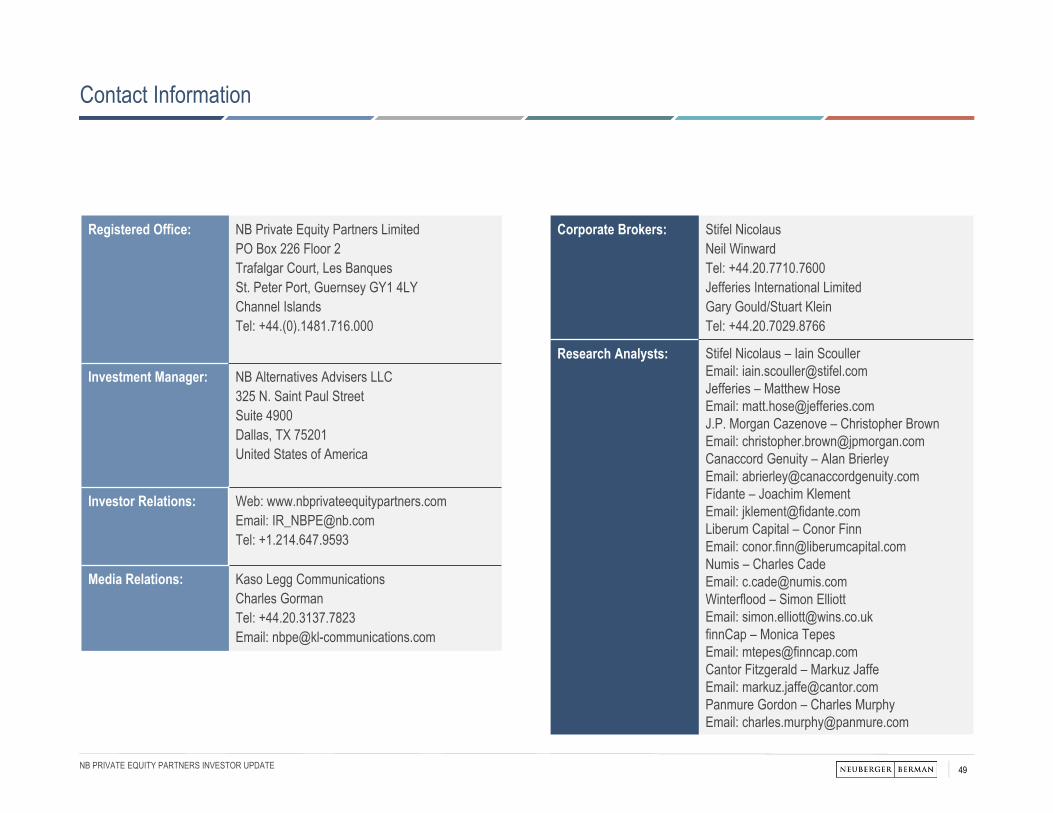
Contact Information
Registered Office: NB Private Equity Partners LimitedPO Box 226 Floor 2Trafalgar Court, Les BanquesSt. Peter Port, Guernsey GY1 4LYChannel IslandsTel: +44.(0).1481.716.000
Investment Manager: NB Alternatives Advisers LLC325 N. Saint Paul StreetSuite 4900Dallas, TX 75201United States of America
Investor Relations: Web: www.nbprivateequitypartners.comEmail: [email protected]: +1.214.647.9593
Media Relations: Kaso Legg CommunicationsCharles GormanTel: +44.20.3137.7823Email: [email protected]
Corporate Brokers: Stifel NicolausNeil WinwardTel: +44.20.7710.7600Jefferies International LimitedGary Gould/Stuart KleinTel: +44.20.7029.8766
Research Analysts: Stifel Nicolaus – Iain ScoullerEmail: [email protected] – Matthew HoseEmail: [email protected]. Morgan Cazenove – Christopher BrownEmail: [email protected] Genuity – Alan BrierleyEmail: [email protected] – Joachim KlementEmail: [email protected] Capital – Conor FinnEmail: [email protected] – Charles Cade Email: [email protected] – Simon ElliottEmail: [email protected] – Monica TepesEmail: [email protected] Fitzgerald – Markuz JaffeEmail: [email protected] Gordon – Charles MurphyEmail: [email protected]
50NB PRIVATE EQUITY PARTNERS INVESTOR UPDATE
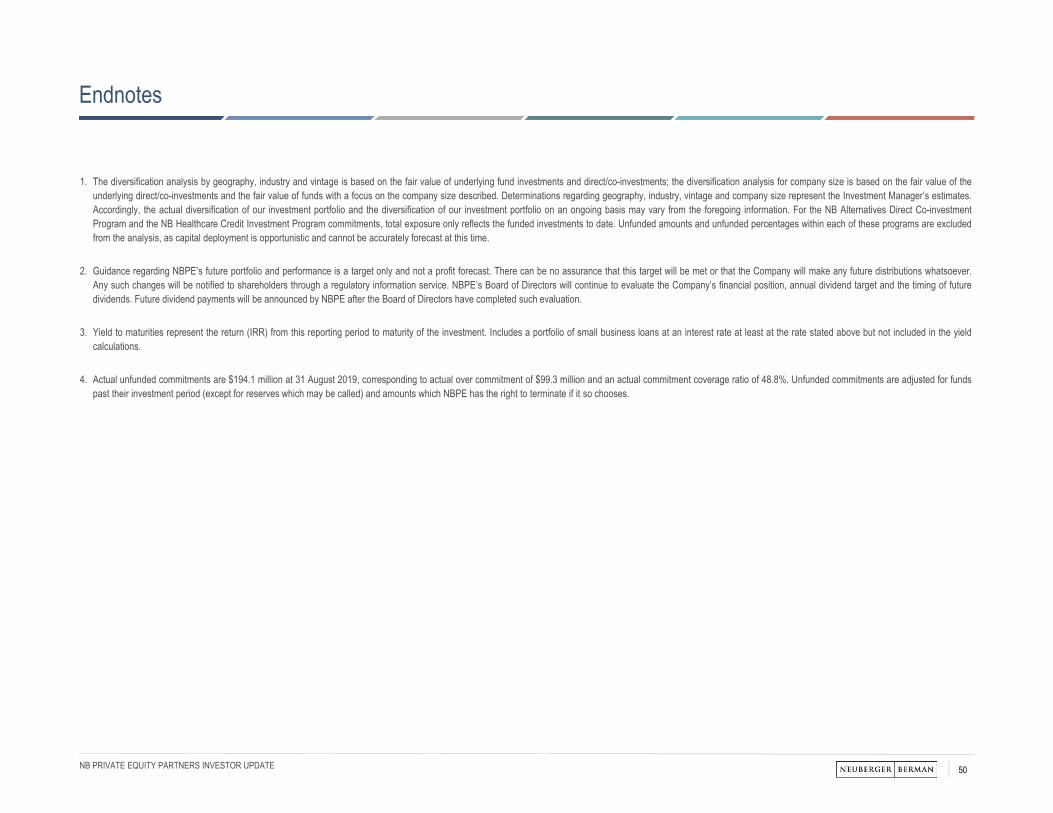
Endnotes
1. The diversification analysis by geography, industry and vintage is based on the fair value of underlying fund investments and direct/co-investments; the diversification analysis for company size is based on the fair value of theunderlying direct/co-investments and the fair value of funds with a focus on the company size described. Determinations regarding geography, industry, vintage and company size represent the Investment Manager’s estimates.Accordingly, the actual diversification of our investment portfolio and the diversification of our investment portfolio on an ongoing basis may vary from the foregoing information. For the NB Alternatives Direct Co-investmentProgram and the NB Healthcare Credit Investment Program commitments, total exposure only reflects the funded investments to date. Unfunded amounts and unfunded percentages within each of these programs are excludedfrom the analysis, as capital deployment is opportunistic and cannot be accurately forecast at this time.
2. Guidance regarding NBPE’s future portfolio and performance is a target only and not a profit forecast. There can be no assurance that this target will be met or that the Company will make any future distributions whatsoever.Any such changes will be notified to shareholders through a regulatory information service. NBPE’s Board of Directors will continue to evaluate the Company’s financial position, annual dividend target and the timing of futuredividends. Future dividend payments will be announced by NBPE after the Board of Directors have completed such evaluation.
3. Yield to maturities represent the return (IRR) from this reporting period to maturity of the investment. Includes a portfolio of small business loans at an interest rate at least at the rate stated above but not included in the yieldcalculations.
4. Actual unfunded commitments are $194.1 million at 31 August 2019, corresponding to actual over commitment of $99.3 million and an actual commitment coverage ratio of 48.8%. Unfunded commitments are adjusted for fundspast their investment period (except for reserves which may be called) and amounts which NBPE has the right to terminate if it so chooses.
51NB PRIVATE EQUITY PARTNERS INVESTOR UPDATE
Legal Disclaimer
THIS DOCUMENT, ANY PRESENTATION MADE IN CONJUNCTION WITH THIS DOCUMENT AND ANY ACCOMPANYING MATERIALS (THE "INVESTOR MATERIALS") ARE STRICTLY CONFIDENTIAL AND MAY NOT BECOPIED, DISTRIBUTED, PUBLISHED OR REPRODUCED IN WHOLE OR IN PART, OR DISCLOSED OR DISTRIBUTED BY RECIPIENTS TO ANY OTHER PERSON. ANY RECIPIENT OF THE INVESTOR MATERIALSAGREES TO KEEP PERMANENTLY CONFIDENTIAL ALL INFORMATION THEREIN NOT ALREADY IN THE PUBLIC DOMAIN.The Investor Materials are not for release, publication or distribution (directly or indirectly) in or into the United States, Canada, Australia, Japan, the Republic of South Africa or to any "US person" as defined in Regulation S underthe United States Securities Act of 1933, as amended (the "Securities Act") or into any other jurisdiction where applicable laws prohibit their release, distribution or publication. They do not constitute an offer of securities for saleanywhere in the world, including in or into the United States, Canada, Australia Japan or the Republic of South Africa. No recipient may distribute, or make available, the Investor Materials(directly or indirectly) to any other person.Recipients of the Investor Materials should inform themselves about and observe any applicable legal requirements in their jurisdictions. In particular, the distribution of the Investor Materials may in certain jurisdictions be restrictedby law. Accordingly, recipients represent that they are able to receive the Investor Materials without contravention of any applicable legal or regulatory restrictions in the jurisdiction in which they reside or conduct business.The Investor Materials have been prepared by NB Private Equity Partners Limited ("NBPE") and NB Alternatives Advisers LLC (the "Investment Manager"). No member of the Neuberger Berman Group nor any of their respectivedirectors, officers, employees, advisors, representatives, or other agents makes or has been authorised to make any representation or warranties (express or implied) in relation to NBPE or as to the truth, accuracy or completenessof the Investor Materials, or any other written or oral statement provided, or any information on which the Investor Materials is based (including, without limitation, information obtained from third parties) or any other information orrepresentations supplied or made in connection with the Investor Materials or as to the reasonableness of any projections which the Investor Materials contain. The aforementioned persons disclaim any and all responsibility andliability whatsoever, whether arising in tort, contract or otherwise, for any errors, omissions or inaccuracies in such information or opinions or for any loss, cost or damage suffered or incurred howsoever arising, directly or indirectly,from any use of the Investor Materials or their contents by the recipient or any other person or otherwise in connection with the Investor Materials. Persons receiving or reviewing the Investor Materials must make all trading andinvestment decisions in reliance on their own judgement. No statement in the Investor Materials is intended to be nor may be construed as a profit forecast.In particular, no representation or warranty is given as to the achievement or reasonableness of, and no reliance should be placed on any projections, targets, estimates or forecasts contained in the Investor Materials and nothing inthe Investor Materials is or should be relied on as a promise or representation as to the future. The name "Neuberger Berman" is used interchangeably throughout these materials for a number of entities that are part of, or areassociated with, the Neuberger Berman Group and when used in this notice includes all such entities.This Investor Materials do not constitute a prospectus or offering memorandum or an offer in respect of any securities and are not intended to provide the basis for any decision in respect of NBPE or other evaluation of anysecurities of NBPE or any other entity and should not be considered as a recommendation that any investor should subscribe for or purchase any such securities or engage in any investment activity (as defined in the FinancialServices and Markets Act 2000 (“FSMA”)) in any jurisdiction nor shall they, or any part of them, or the fact of their distribution in any manner whatsoever form the basis of, or be relied on in connection with, any contract orinvestment decision whatsoever, in any jurisdiction. Neither the issue of the Investor Materials nor any part of their contents constitutes an offer to sell or invitation to purchase any securities of NBPE or any other entity or anypersons holding securities of NBPE and no information set out in the Investor Materials or referred to in other written or oral information is intended to form the basis of any contract of sale, investment decision or any decision topurchase any securities referred to in it.The information contained in the Investor Materials is given as at the date of its publication (unless otherwise marked) and is subject to updating, revision and amendment. No reliance may be placed for any purpose whatsoever onthe information of opinions contained in the Investor Materials or on their completeness, accuracy or fairness. The contents of the Investor Materials have not been approved by any competent regulatory or supervisory authority. TheInvestor Materials are not intended to be complete or to constitute all of the information necessary to adequately evaluate the consequences of investing in NBPE. The contents of the Investor Materials have not been verified andthe Investor Materials have not been approved (in whole or any part) by any competent regulatory or supervisory authority.The Investor Materials are made available for information purposes only. The Investor Materials, which are not a prospectus or listing particulars or an admission document, do not contain any representations, do not constitute orform part of any offer or invitation to sell or transfer, or to underwrite, subscribe for or acquire, any shares or other securities, and do not constitute or form any part of any solicitation of any such offer or invitation, nor shall they areor any part of them or the fact of their distribution form the basis of or be relied upon in connection with any contract therefore, and do not constitute a recommendation regarding the securities of NBPE.Neither NBPE nor Neuberger Berman gives any undertaking to provide the recipient with access to any additional information, or to update the Investor Materials or any additional information, or to correct any inaccuracies in themwhich may become apparent and the distribution of the Investor Materials shall not be deemed to be any form of commitment on the part of NBPE, the Investment Manager or Neuberger Berman to proceed with any transaction.
52NB PRIVATE EQUITY PARTNERS INVESTOR UPDATE
Legal Disclaimer
THE PROMOTION OF NBPE AND THE DISTRIBUTION OF THE INVESTOR MATERIALS IN THE UNITED KINGDOM IS RESTRICTED BY LAW. ACCORDINGLY, THIS COMMUNICATION IS DIRECTED ONLY AT (I) PERSONS OUTSIDE THE UNITED KINGDOM TO WHOM IT IS LAWFUL TO COMMUNICATE TO, OR (II) PERSONS HAVING PROFESSIONAL EXPERIENCE IN MATTERS RELATING TO INVESTMENTS WHO FALL WITHIN THE DEFINITION OF "INVESTMENT PROFESSIONALS" IN ARTICLE 19(5) OF THE FINANCIAL SERVICES AND MARKETS ACT 2000 (FINANCIAL PROMOTION) ORDER 2005 (AS AMENDED), OR (III) HIGH NET WORTH COMPANIES, UNINCORPORATED ASSOCIATIONS AND PARTNERSHIPS AND TRUSTEES OF HIGH VALUE TRUSTS AS DESCRIBED IN ARTICLE 49(2) OF THE FINANCIAL SERVICES AND MARKETS ACT 2000 (FINANCIAL PROMOTION) ORDER 2005 (AS AMENDED); PROVIDED THAT IN THE CASE OF PERSONS FALLING INTO CATEGORIES (II) OR (III), THE COMMUNICATION IS ONLY DIRECTED AT PERSONS WHO ARE ALSO "QUALIFIED INVESTORS" AS DEFINED IN SECTION 86 OF THE FINANCIAL SERVICES AND MARKETS ACT 2000 (EACH A "RELEVANT PERSON"). ANY INVESTMENT OR INVESTMENT ACTIVITY TO WHICH THIS COMMUNICATION RELATES IS AVAILABLE ONLY TO AND WILL BE ENGAGED IN ONLY WITH SUCH RELEVANT PERSONS. PERSONS WITHIN THE UNITED KINGDOM WHO RECEIVE THIS COMMUNICATION (OTHER THAN PERSONS FALLING WITHIN (II) AND (III) ABOVE) SHOULD NOT RELY ON OR ACT UPON THIS COMMUNICATION. YOU REPRESENT AND AGREE THAT YOU ARE A RELEVANT PERSON.NBPE HAS NOT BEEN, AND HAS NO INTENTION TO BE, REGISTERED UNDER THE U.S. INVESTMENT COMPANY ACT OF 1940, AS AMENDED (THE "INVESTMENT COMPANY ACT") AND INVESTORS ARE NOT AND WILL NOT BE ENTITLED TO THE BENEFITS OF THAT ACT. THE SECURITIES DESCRIBED IN THIS DOCUMENT HAVE NOT BEEN AND WILL NOT BE REGISTERED UNDER THE SECURITIES ACT OR THE LAWS OF ANY STATE OF THE UNITED STATES. CONSEQUENTLY, SUCH SECURITIES MAY NOT BE OFFERED OR SOLD IN THE UNITED STATES OR TO U.S. PERSONS (AS SUCH TERM IS DEFINED IN REGULATION S UNDER THE SECURITIES ACT) UNLESS SUCH SECURITIES ARE REGISTERED UNDER THE SECURITIES ACT OR AN EXEMPTION FROM THE REGISTRATION REQUIREMENT OF THE SECURITIES ACT IS AVAILABLE. NO PUBLIC OFFERING OF THE SECURITIES IS BEING MADE IN THE UNITED STATES.PROSPECTIVE INVESTORS SHOULD TAKE NOTE THAT ANY SECURITIES MAY NOT BE ACQUIRED BY INVESTORS USING ASSETS OF ANY RETIREMENT PLAN OR PENSION PLAN THAT IS SUBJECT TO PART 4 OF SUBTITLE B OF TITLE I OF THE UNITED STATES EMPLOYEE RETIREMENT INCOME SECURITY ACT OF 1974, AS AMENDED ("ERISA") OR SECTION 4975 OF THE UNITED STATES INTERNAL REVENUE CODE OF 1986, AS AMENDED (THE "CODE"), ENTITIES WHOSE UNDERLYING ASSETS ARE CONSIDERED TO INCLUDE "PLAN ASSETS" OF ANY SUCH RETIREMENT PLAN OR PENSION PLAN, OR ANY GOVERNMENTAL PLAN, CHURCH PLAN, NON-U.S. PLAN OR OTHER INVESTOR SUBJECT TO ANY STATE, LOCAL, NON-U.S. OR OTHER LAWS OR REGULATIONS SIMILAR TO TITLE I OR ERISA OR SECTION 4975 OF THE CODE OR THAT WOULD HAVE THE EFFECT OF THE REGULATIONS ISSUED BY THE UNITED STATES DEPARTMENT OF LABOR SET FORTH AT 29 CFR SECTION 2510.3-101, AS MODIFIED BY SECTION 3(42) OF ERISA.THE MERITS OR SUITABILITY OF ANY SECURITIES MUST BE INDEPENDENTLY DETERMINED BY THE RECIPIENT ON THE BASIS OF ITS OWN INVESTIGATION AND EVALUATION OF NBPE, THE INVESTMENT MANAGER, AND NEUBERGER BERMAN. ANY SUCH DETERMINATION SHOULD INVOLVE, AMONG OTHER THINGS, AN ASSESSMENT OF THE LEGAL, TAX, ACCOUNTING, REGULATORY, FINANCIAL, CREDIT AND OTHER RELATED ASPECTS OF THE SECURITIES. RECIPIENTS OF THIS DOCUMENT AND THE PRESENTATION ARE RECOMMENDED TO SEEK THEIR OWN INDEPENDENT LEGAL, TAX, FINANCIAL AND OTHER ADVICE AND SHOULD RELY SOLELY ON THEIR OWN JUDGMENT, REVIEW AND ANALYSIS IN EVALUATING NBPE, THE INVESTMENT MANAGER, AND NEUBERGER BERMAN, AND THEIR BUSINESS AND AFFAIRS.THIS INVESTOR MATERIALS MAY CONTAIN CERTAIN FORWARD-LOOKING STATEMENTS. FORWARD-LOOKING STATEMENTS RELATE TO EXPECTATIONS, BELIEFS, PROJECTIONS, FUTURE PLANS AND STRATEGIES, ANTICIPATED EVENTS OR TRENDS AND SIMILAR EXPRESSIONS CONCERNING MATTERS THAT ARE NOT HISTORICAL FACTS. IN SOME CASES, FORWARD-LOOKING STATEMENTS CAN BE INDENTIFIED BY TERMS SUCH AS "ANTICIPATE", BELIEVE", "COULD", "ESTIMATE", "EXPECT", "INTEND", "MAY", "PLAN", "POTENTIAL", "SHOULD", "WILL", AND "WOULD", OR THE NEGATIVE OF THOSE TERMS OR OTHER COMPARABLE TERMINOLOGY. THE FORWARD- LOOKING STATEMENTS ARE BASED ON NBPE’S AND/OR NEUBERGER BERMAN'S BELIEFS, ASSUMPTIONS AND EXPECTATIONS OF FUTURE PERFORMANCE AND MARKET DEVELOPMENTS, TAKING INTO ACCOUNT ALL INFORMATION CURRENTLY AVAILABLE AND ARE INTENDED ONLY TO ILLUSTRATE HYPOTHETICAL RESULTS UNDER THOSE BELIEFS, ASSUMPTIONS AND EXPECTATIONS (NOT ALL OF WHICH WILL BE SPECIFIED HEREIN), NOT ALL RELEVANT EVENTS OR CONDITIONS MAY HAVE BEEN CONSIDERED IN DEVELOPING SUCH BELIEFS, ASSUMPTIONS AND EXPECTATIONS. THESE BELIEFS, ASSUMPTIONS, AND EXPECTATIONS CAN CHANGE AS A RESULT OF MANY POSSIBLE EVENTS OR FACTORS, NOT ALL OF WHICH ARE KNOWN OR ARE WITHIN NBPE’S OR NEUBERGER BERMAN’S CONTROL. IF A CHANGE OCCURS, NBPE’S BUSINESS, FINANCIAL CONDITION, LIQUIDITY AND RESULTS OF OPERATIONS MAY VARY MATERIALLY FROM THOSE EXPRESSED IN FORWARD-LOOKING STATEMENTS. SOME OF THE FACTORS THAT COULD CAUSE ACTUAL RESULTS TO VARY FROM THOSE EXPRESSED IN FORWARD-LOOKING STATEMENTS, INCLUDE, BUT ARE NOT LIMITED TO: THE FACTORS DESCRIBED IN THE INVESTOR MATERIALS; THE RATE AT WHICH NBPE DEPLOYS ITS CAPITAL IN INVESTMENTS AND ACHIEVES EXPECTED RATES OF RETURN; NBPE’S AND THE INVESTMENT MANAGER’S ABILITY TO EXECUTE NBPE'S INVESTMENT STRATEGY, INCLUDING THROUGH THE IDENTIFICATION OF A SUFFICIENT NUMBER OF APPROPRIATE INVESTMENTS; THE CONTINUATION OF THE INVESTMENT MANAGER AS MANAGER OF NBPE'S INVESTMENTS, THE CONTINUED AFFILIATION WITH NEUBERGER BERMAN OF ITS KEY INVESTMENT PROFESSIONALS; NBPE’S FINANCIAL CONDITION AND LIQUIDITY; CHANGES IN THE VALUES OF OR RETURNS ON INVESTMENTS THAT THE NBPE MAKES; CHANGES IN FINANCIAL MARKETS, INTEREST RATES OR INDUSTRY, GENERAL ECONOMIC OR POLITICAL CONDITIONS; AND THE GENERAL VOLATILITY OF THE CAPITAL MARKETS AND THE MARKET PRICE OF NBPE’S SHARES.BY THEIR NATURE, FORWARD-LOOKING STATEMENTS INVOLVE KNOWN AND UNKNOWN RISKS AND UNCERTAINTIES BECAUSE THEY RELATE TO EVENTS, AND DEPEND ON CIRCUMSTANCES THAT MAY OR MAY NOT OCCUR IN THE FUTURE. FORWARD-LOOKING STATEMENTS ARE NOT GUARANTEES OF FUTURE PERFORMANCE. ANY FORWARD-LOOKING STATEMENTS ARE ONLY MADE AS AT THE DATE OF THE INVESTOR MATERIALS, AND NEITHER NBPE NOR THE INVESTMENT MANAGER ASSUMES ANY OBLIGATION TO UPDATE FORWARD-LOOKING STATEMENTS SET FORTH IN THE INVESTOR MATERIALS WHETHER AS A RESULT OF NEW INFORMATION, FUTURE EVENTS, OR OTHERWISE, EXCEPT AS REQUIRED BY LAW OR OTHER APPLICABLE REGULATION. IN LIGHT OF THESE RISKS, UNCERTAINTIES, AND ASSUMPTIONS, THE EVENTS DESCRIBED BY ANY SUCH FORWARD-LOOKING STATEMENTS MIGHT NOT OCCUR. NBPE QUALIFIES ANY AND ALL OF THEIR FORWARD-LOOKING STATEMENTS BY THESE CAUTIONARY FACTORS. PLEASE KEEP THIS CAUTIONARY NOTE IN MIND WHILE CONSIDERING THE INVESTOR MATERIALS.
53NB PRIVATE EQUITY PARTNERS INVESTOR UPDATE
Legal Disclaimer
BY ACCEPTING AND READING THIS DOCUMENT AND/OR ATTENDING THE PRESENTATION TO WHICH THIS DOCUMENT RELATES YOU WILL BE DEEMED TO HAVE REPRESENTED, WARRANTED AND UNDERTAKEN FOR THE BENEFIT OF NBPE, THE INVESTMENT MANAGER, NEUBERGER BERMAN AND OTHERS THAT (A) YOU ARE OUTSIDE OF THE UNITED STATES AND ARE AN "INVESTMENT PROFESSIONAL" (AS DEFINED ABOVE), (B) YOU HAVE READ AND AGREE TO COMPLY WITH THE CONTENTS OF THIS NOTICE, YOU WILL KEEP THE INFORMATION IN THE INVESTOR MATERIALS AND DELIVERED DURING ANY PRESENTATION OR CONTAINTED IN ANY ACCOMPANYING DOCUMENT AND ALL INFORMATION ABOUT NEUBERGER BERMAN CONFIDENTIAL, AND WILL NOT REPRODUCE OR DISTRIBUTE, IN WHOLE OR IN PART, (DIRECTLY OR INDIRECTLY) ANY SUCH INFORMATION, UNTIL SUCH INFORMATION HAS BEEN MADE PUBLICLY AVAILABLE AND TAKE ALL REASONABLE STEPS TO PRESERVE SUCH CONFIDENTIALITY, AND (C) YOU ARE PERMITTED, IN ACCORDANCE WITH APPLICABLE LAWS, TO RECEIVE SUCH INFORMATION.NBPE IS ESTABLISHED AS A CLOSED-END INVESTMENT COMPANY DOMICILED IN GUERNSEY. NBPE HAS RECEIVED THE NECESSARY CONSENT OF THE GUERNSEY FINANCIAL SERVICES COMMISSION. PAST PERFORMANCE IS NOT INDICATIVE OF, OR A GUARANTEE OF, FUTURE PERFORMANCE. PROSPECTIVE INVESTORS ARE ADVISED TO SEEK EXPERT LEGAL, FINANCIAL, TAX AND OTHER PROFESSIONAL ADVICE BEFORE MAKING ANY INVESTMENT DECISION. THE VALUE OF INVESTMENTS MAY FLUCTUATE. RESULTS ACHIEVED IN THE PAST NOT INDICATIVE OF, OR A GUARANTEE OF, FUTURE RESULTS..ANY OF OUR OPINIONS EXPRESSED HEREIN ARE OUR CURRENT OPINIONS ONLY AND MAY BE SUBJECT TO CHANGE. STATEMENTS MADE HEREIN ARE AS OF THE DATE OF THIS DOCUMENT AND SHOULD NOT BE RELIED UPON AS OF ANY SUBSEQUENT DATE. PAST PERFORMANCE IS NOT INDICATIVE OF, OR A GUARANTEE OF, FUTURE PERFORMANCE.THIS DOCUMENT IS ISSUED BY NBPE WHOSE REGISTERED ADDRESS IS AT PO BOX 226 FLOOR 2 TRAFALGAR COURT, LES BANQUES ST. PETER PORT, GUERNSEY GY1 4LY. NB ALTERNATIVES ADVISERS LLC IS A REGISTERED INVESTMENT ADVISER IN THE UNITED STATES. NEUBERGER BERMAN IS A REGISTERED TRADEMARK. ALL RIGHTS RESERVED. ©2019 NB ALTERNATIVES ADVISERS LLC.