financial globalization and economic development -...
TRANSCRIPT
Financial Globalization and Economic DevelopmentFriends or Foes?
Andrea F. PresbiteroE–mail: [email protected]
Pagina web: http://utenti.dea.univpm.it/presbitero/EMI.html
1Universita Politecnica delle Marche
2Money and Finance Research group (MoFiR)
Economia monetaria internazionale, Ancona, Marzo 2010
Presbitero (Univpm) Financial Globalization EMI, UNIVPM 1 / 51
1 Introduction
2 International Financial Integration: Facts and Figures
3 Financial integration: determinants and consequencesBenefits of financial globalizationCounter-arguments
4 New arguments in favor of financial globalization
5 An alternative interpretation (Rodrik and Subramanian)
Presbitero (Univpm) Financial Globalization EMI, UNIVPM 2 / 51
Financial globalization
Financial globalization — rising cross-border financial flows — is often blamed forthe string of damaging economic crises that rocked a number of emerging marketsin the late 1980s and in the 1990s.
The market turmoil and resulting bankruptcies prompted a rash of finger-pointingby those who suggested that developing countries had dismantled capital controlstoo hastily, leaving themselves vulnerable to the harsh dictates of rapid capitalmovements and market herd effects.
In contrast to the growing consensus that trade liberalization is beneficial for both
industrial and developing economies, debate rages about the costs and benefits of
financial globalization:
1 Some economists view unfettered capital flows as disruptive to globalfinancial stability, leading to calls for capital controls and other curbs oninternational asset trade.
2 Others argue that increased openness to capital flows has, in general, provedessential for countries seeking to growth and that it has strengthenedstability among industrial countries.
Presbitero (Univpm) Financial Globalization EMI, UNIVPM 3 / 51
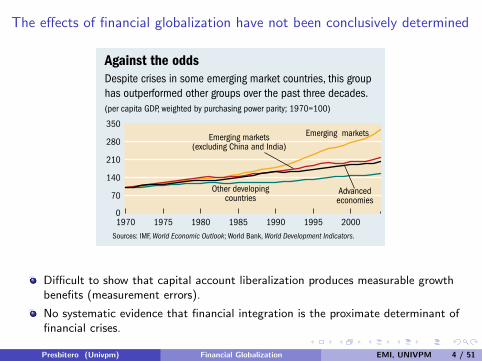
The effects of financial globalization have not been conclusively determined
Unanswered questionsThe recent wave of financial globalization began in earnest in the mid-1980s, spurred by the liberalization of capital con-trols in many countries in anticipation of the better growth outcomes and increased stability of consumption that cross-border flows would bring. it was presumed that these bene-fits would be large, especially for developing countries, which tend to be more capital-poor and have more volatile income growth than other countries.
Emerging market economies, the group of developing coun-tries that have actively participated in financial globalization, have clearly registered better growth outcomes, on average, than those countries that have not participated (see chart 1). Yet the majority of studies using cross-country growth regres-sions to analyze the relationship between growth and financial openness have been unable to show that capital account liber-alization produces measurable growth benefits. One reason may be traced to the difficulty of measuring financial open-ness. For example, widely used measures of capital controls (restrictions on capital account transactions) fail to capture how effectively countries enforce those controls and do not always reflect the actual degree of an economy’s integration with international capital markets. in recent years, consider-able progress has been made on developing better measures of capital controls and better data on flows and stocks of inter-national assets and liabilities. Studies that are based on these improved measures of financial integration are beginning to find evidence of positive growth effects of financial integra-tion. The evidence, however, is still far from conclusive.
nor is there systematic evidence that financial integra-tion is the proximate determinant of financial crises. authors who have looked at different manifestations of such crises— including sudden stops of capital inflows, current account reversals, and banking crises—have found no evidence that countries that are more open to financial flows tend to have a higher incidence of crises than those that are less open. although crisis episodes receive most of the attention, they are just particularly sharp manifestations of the more general phenomenon of macroeconomic volatility. On that score, the results are less favorable: financial globalization has not deliv-ered on the promised benefit of improved international risk
sharing and reduced volatility of consumption for developing countries.
in sum, the effects of financial globalization have not been conclusively determined. although there is little for-mal empirical evidence to support the oft-cited claims that financial globalization has caused the financial crises that the world has seen over the past three decades, the existence of robust macroeconomic evidence of the benefits of financial globalization is elusive, too. Given the shortcomings of cross-country growth regressions, is there another approach that can shed light on the effects of financial globalization?
Not created equalan alternative perspective on the growth and volatility effects of financial globalization is based on differentiating among various types of capital flows. This is particularly relevant because the composition of international financial flows has changed markedly over time.
Foreign direct investment (FDi) has now become the dominant source of private capital flows to emerging mar-ket economies (see chart 2); equity flows have also risen in importance, whereas debt flows have declined. FDi and portfolio equity flows are presumed to be more stable and less prone to reversals and are believed to bring with them many of the indirect benefits of financial globalization, such as transfers of managerial and technological expertise. Debt flows, by contrast, are widely accepted as being riskier; in particular, the fact that they are procyclical and highly vol-atile can magnify the adverse impact of negative shocks on economic growth.
The increasing importance of portfolio equity flows to emerging markets has motivated a number of studies examining the growth effects of equity market liberaliza-tions. These papers uniformly suggest that these liberaliza-tions have a significant, positive impact on output growth. Whether the estimated growth effects could be picking up the effects of other factors—especially other reforms that tend to accompany these liberalizations—remains, in our view, an open question. On the other hand, the body of
10 Finance & Development March 2007
Chart 2
On the riseEmerging markets now attract more FDI than other types of flows.(composition of gross flows to emerging markets, percent of total)
Source: External Wealth of Nations database from Philip R. Lane and Gian Maria Milesi-Ferretti, “The External Wealth of Nations Mark II: Revised and Extended Estimates of Foreign Assets and Liabilities, 1970–2004,” IMF Working Paper No. 06/69 (Washington: International Monetary Fund, 2006).
Author: RogoffDate: 1/5/07
Foreign directinvestment
Equity Debt0
20
40
60
80
100
2000–04
1990–94
1980–84
Chart 1
Against the oddsDespite crises in some emerging market countries, this group has outperformed other groups over the past three decades.(per capita GDP, weighted by purchasing power parity; 1970=100)
Sources: IMF, World Economic Outlook; World Bank, World Development Indicators.
Author: RogoffDate: 1/23/07
0
70
140
210
280
350
2000199519901985198019751970
Emerging markets
Other developingcountries
Emerging markets(excluding China and India)
Advancedeconomies
Difficult to show that capital account liberalization produces measurable growthbenefits (measurement errors).
No systematic evidence that financial integration is the proximate determinant offinancial crises.
Presbitero (Univpm) Financial Globalization EMI, UNIVPM 4 / 51
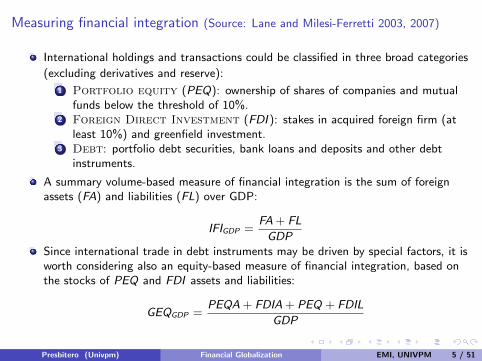
Measuring financial integration (Source: Lane and Milesi-Ferretti 2003, 2007)
International holdings and transactions could be classified in three broad categories
(excluding derivatives and reserve):
1 Portfolio equity (PEQ): ownership of shares of companies and mutualfunds below the threshold of 10%.
2 Foreign Direct Investment (FDI ): stakes in acquired foreign firm (atleast 10%) and greenfield investment.
3 Debt: portfolio debt securities, bank loans and deposits and other debtinstruments.
A summary volume-based measure of financial integration is the sum of foreignassets (FA) and liabilities (FL) over GDP:
IFIGDP =FA + FL
GDPSince international trade in debt instruments may be driven by special factors, it isworth considering also an equity-based measure of financial integration, based onthe stocks of PEQ and FDI assets and liabilities:
GEQGDP =PEQA + FDIA + PEQ + FDIL
GDP
Presbitero (Univpm) Financial Globalization EMI, UNIVPM 5 / 51
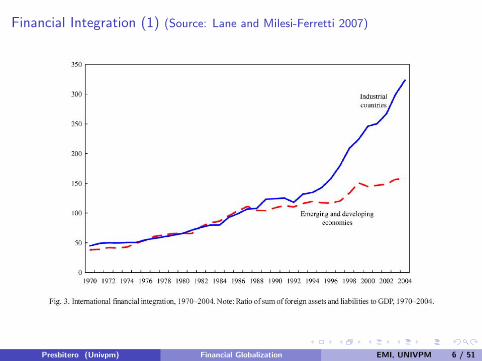
Financial Integration (1) (Source: Lane and Milesi-Ferretti 2007)
Presbitero (Univpm) Financial Globalization EMI, UNIVPM 6 / 51
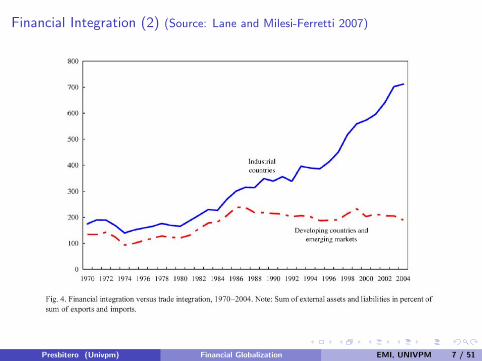
Financial Integration (2) (Source: Lane and Milesi-Ferretti 2007)
Presbitero (Univpm) Financial Globalization EMI, UNIVPM 7 / 51
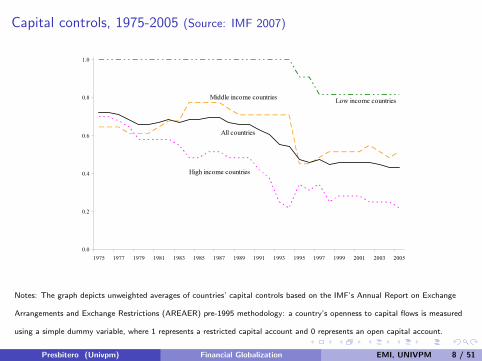
Capital controls, 1975-2005 (Source: IMF 2007)
11
Figure 3. Capital Controls by Financial Openness and Income Group, 1975–2005
0.0
0.2
0.4
0.6
0.8
1.0
1975 1977 1979 1981 1983 1985 1987 1989 1991 1993 1995 1997 1999 2001 2003 2005
Non-liberalized countries
Liberalized countries
All countries
0.0
0.2
0.4
0.6
0.8
1.0
1975 1977 1979 1981 1983 1985 1987 1989 1991 1993 1995 1997 1999 2001 2003 2005
All countries
High income countries
Middle income countries Low income countries
Source: Annual Report on Exchange Arrangements and Exchange Restrictions (AREAER), IMF; and staff calculations. Notes: Based on a sample of 74 countries for which data on de facto globalization and de jure capital controls are available for the entire sample period. The graph depicts unweighted averages of countries’ capital controls, using the IMF’s binary capital controls indicator (based on the AREAER’s pre-1995 methodology). Countries in the top panel are categorized according to the 1975-2005 mean of their capital controls variable: the cutoff for liberalized versus non-liberalized is the sample mean. Countries in the bottom panel are grouped according to the World Bank definition (see Appendix Table 1).
Notes: The graph depicts unweighted averages of countries’ capital controls based on the IMF’s Annual Report on Exchange
Arrangements and Exchange Restrictions (AREAER) pre-1995 methodology: a country’s openness to capital flows is measured
using a simple dummy variable, where 1 represents a restricted capital account and 0 represents an open capital account.
Presbitero (Univpm) Financial Globalization EMI, UNIVPM 8 / 51
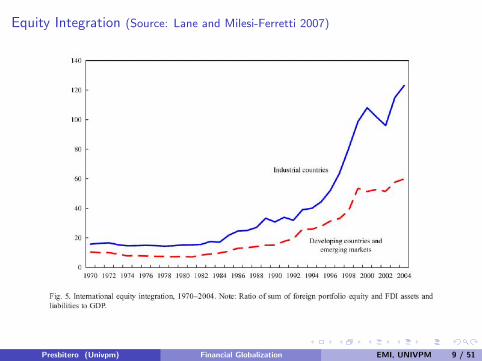
Equity Integration (Source: Lane and Milesi-Ferretti 2007)
Presbitero (Univpm) Financial Globalization EMI, UNIVPM 9 / 51
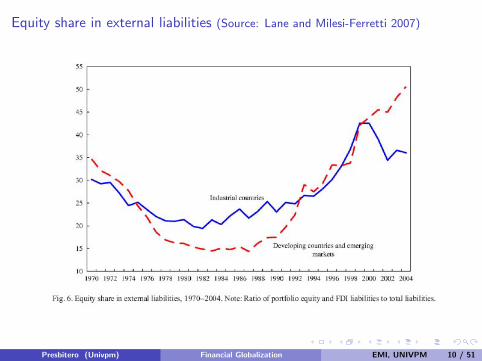
Equity share in external liabilities (Source: Lane and Milesi-Ferretti 2007)
Presbitero (Univpm) Financial Globalization EMI, UNIVPM 10 / 51
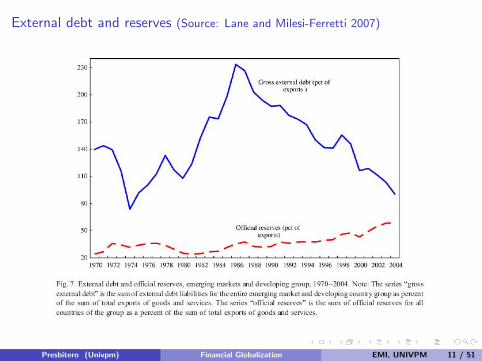
External debt and reserves (Source: Lane and Milesi-Ferretti 2007)
Presbitero (Univpm) Financial Globalization EMI, UNIVPM 11 / 51
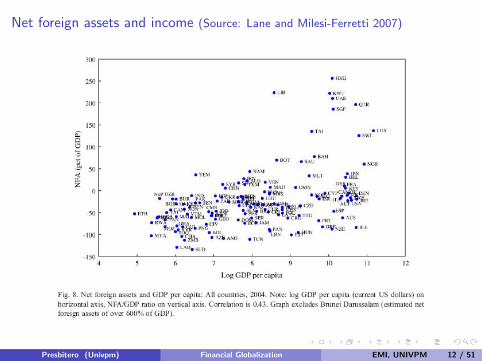
Net foreign assets and income (Source: Lane and Milesi-Ferretti 2007)
Presbitero (Univpm) Financial Globalization EMI, UNIVPM 12 / 51
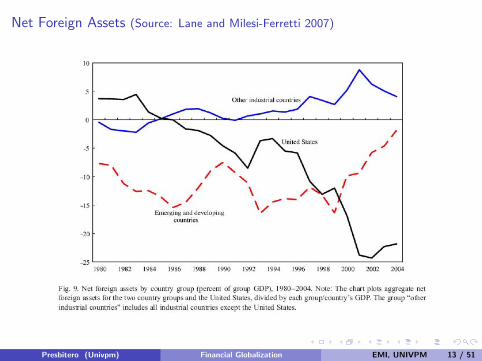
Net Foreign Assets (Source: Lane and Milesi-Ferretti 2007)
Presbitero (Univpm) Financial Globalization EMI, UNIVPM 13 / 51
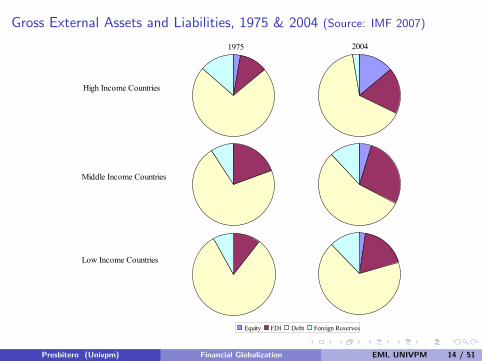
Gross External Assets and Liabilities, 1975 & 2004 (Source: IMF 2007)
10
Figure 2. Composition of Gross External Assets and Liabilities, 1975 and 2004
Source: Lane and Milesi-Ferretti (2006). Notes: Based on a sample of 32 high-income, 31 middle-income, and 11 low-income countries. For each year and income group, the pie charts depict the shares of each type of external assets plus liabilities in total external assets plus liabilities. Group averages are unweighted. decades, most countries have relaxed de jure controls on the capital account, though the process of liberalization has slowed since the mid-1990s. This broad trend is apparent for both the relatively liberalized and the relatively non-liberalized countries, though liberalization efforts took place somewhat earlier in the former group than in the latter group (Figure 3, top panel). About one half of the countries in the sample are currently considered fully open to capital flows, up from under a third in 1975. While liberalizations were the dominant trend over the period, about ten percent of the countries in the sample tightened their controls, often in response to crises. The capital controls index developed in this paper indicates that
1975
Equity FDI Debt Foreign Reserves
2004
High Income Countries
Middle Income Countries
Low Income Countries
Presbitero (Univpm) Financial Globalization EMI, UNIVPM 14 / 51
Some comments (Source: Lane and Milesi-Ferretti 2003, 2007)
International financial integration has significantly increased over the last decadesas a result of reductions in capital account restrictions and other barriers toinvesting overseas.
Financial integration followed a similar track in industrial and developing countriesuntil the early nineties. From then on, the acceleration in cross-border asset tradewas much faster in industrial countries.
Equity liabilities continued to grow in importance, reflecting the increase in FDI.
The decline in the relative weight of debt in the external portfolio of developingand emerging countries went hand in hand with a rapid accumulation of reserves.
There is a positive correlation between NFA and national income: the net externalposition is generally positive (negative) in industrial (developing) countries. Intime, NFA worsened in the US, but improved in developing countries.
Cross-country differences in the composition of external portfolios show that manyindustrial countries are short debt, long equity, while emerging and developingcountries are short equity, with many having net liabilities in both debt and equity.
Presbitero (Univpm) Financial Globalization EMI, UNIVPM 15 / 51
Standard “old” theory
Hypothesis1 Low savings and weak financial markets at home were first-order constraints on
economic growth and development;
2 Greater access to investible funds from abroad and improved financialintermediation would provide a powerful boost to domestic investment and growthalong with better consumption smoothing.
The case for financial globalization (Mishkin)1 Developing nations need foreign capital to grow ;
2 But foreign capital can be risky if they do not pursue prudent macroeconomicpolicies and appropriate prudential regulation;
3 So developing countries must become ever more vigilant on those fronts as theyopen themselves up to capital flows.
Presbitero (Univpm) Financial Globalization EMI, UNIVPM 16 / 51
The direction of flows
In the benchmark neoclassical model, with decreasing returns and frictionlessmarkets, capital should flow from rich countries that have relatively highcapital-to-labor ratios to poor countries which have relatively low ratios.
Yet, Lucas (1990) points out that, contrary to the model’s predictions, capitalflows from poor to rich countries.
What can explain this paradox?
1 Fundamentals: missing factors of production (human capital, land),institutions (political risk), government policies, low TFP
2 Capital market imperfections: informational frictions, history of serialdefaults and sovereign risk.
Two recent papers show that, during the period 19702000, poor institutions, suchas weak protection of property rights, legal inefficiency, and a high risk ofexpropriation, are the leading explanation for the Lucas Paradox (Alfaro et al.2008; Papaioannou 2009).
Presbitero (Univpm) Financial Globalization EMI, UNIVPM 17 / 51
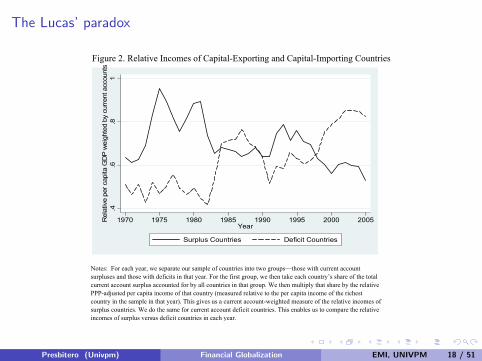
The Lucas’ paradox
Notes: For each year, we separate our sample of countries into two groups—those with current account surpluses and those with deficits in that year. For the first group, we then take each country’s share of the total current account surplus accounted for by all countries in that group. We then multiply that share by the relative PPP-adjusted per capita income of that country (measured relative to the per capita income of the richest country in the sample in that year). This gives us a current account-weighted measure of the relative incomes of surplus countries. We do the same for current account deficit countries. This enables us to compare the relative incomes of surplus versus deficit countries in each year.
Figure 2. Relative Incomes of Capital-Exporting and Capital-Importing Countries
.4.6
.81
Rel
ativ
e pe
r cap
ita G
DP
wei
ghte
d by
cur
rent
acc
ount
s
1970 1975 1980 1985 1990 1995 2000 2005Year
Surplus Countries Deficit Countries
34
Presbitero (Univpm) Financial Globalization EMI, UNIVPM 18 / 51
Determinants of financial globalization
Persistent country characteristics (institutional quality, human capital) are likely tobe key drivers of a country’s de facto international financial integration.
Capital controls, institutional quality, trade openness, and level of economicdevelopment are all significantly correlated with total external liabilities as well astheir components.
Country pairs characterized by historical links (common language, colonial history,and common legal systems) are found to have larger bilateral holdings.
Countries that are further apart geographically and that do not share a borderhave significantly lower bilateral financial integration. Distance is a proxy forinformational frictions
Presbitero (Univpm) Financial Globalization EMI, UNIVPM 19 / 51
Risk sharing
By making it possible for a country’s residents to hold financial assets whosereturns are linked to output performance abroad, financial openness providesopportunities to enjoy relatively stable consumption streams despite fluctuations indomestic output.
The potential risk-sharing benefits (reduction in consumption volatility) from fullfinancial integration with the rest of the world are substantial for every country.
The potential gains from financial globalization are larger for countries whoseeconomies are more volatile because they are subject to more frequent andrelatively damaging idiosyncratic shocks (small, less diversified countries) orbecause their ability to smooth such shocks through countercyclical policies ordomestic financial markets is lower (countries at a lower stage of economic anddomestic financial development).
The empirical evidence suggests that international risk sharing increased somewhatfor advanced countries, especially over the past two decades, but that for emergingmarket and developing countries there has been relatively little change (Kose,Prasad, and Terrones, 2007).
Presbitero (Univpm) Financial Globalization EMI, UNIVPM 20 / 51
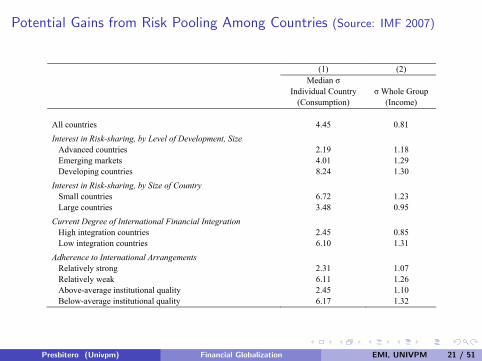
Potential Gains from Risk Pooling Among Countries (Source: IMF 2007) 22
Table 5. Potential Gains from Risk Pooling Among Countries
(1) (2) Median σ
Individual Country (Consumption)
σ Whole Group
(Income) All countries
4.45
0.81
Interest in Risk-sharing, by Level of Development, Size Advanced countries
2.19
1.18
Emerging markets 4.01 1.29 Developing countries 8.24 1.30 Interest in Risk-sharing, by Size of Country Small countries
6.72
1.23
Large countries 3.48 0.95 Current Degree of International Financial Integration High integration countries
2.45
0.85
Low integration countries 6.10 1.31 Adherence to International Arrangements Relatively strong
2.31
1.07
Relatively weak 6.11 1.26 Above-average institutional quality 2.45 1.10 Below-average institutional quality 6.17 1.32
Sources: Foreign assets are from Lane and Milesi-Ferretti, 2006; GDP data in current U.S. dollars are from the IMF’s World Economic Outlook. GDP and consumption data at PPP are from the World Bank’s World Development Indicators. Notes: Column (1) reports the median (across countries in the indicated sub-sample) standard deviation (σ) of individual country growth in 1975–2004. Column (2) reports the standard deviation of the growth rate of total output for the group of countries as indicated. Small (large) countries are those with a total population of less than (more than) 5.2 million in 1970. High (low) capital integration countries are those in the top (bottom) half of the sample when ranked by total foreign assets to GDP. Above and below average institutional quality is measured according to the index by Kaufmann, Kraay, and Mastruzzi (2005). Relatively strong adherence to international arrangements is defined as above average institutional quality and no defaults on international debt in 1970-2004 according to Detragiache and Spilimbergo (2001), and Reinhart, Rogoff and Savastano (2003).
• While regional pools can provide major benefits, risk-sharing benefits tend to be greater when countries choose partners from the worldwide sample rather than within a region. For example, median volatility of consumption growth for Latin American emerging markets equals 6.2 percentage points and can be lowered to 1.9 percentage points by pooling with five optimally-chosen Latin American emerging markets, but to 1.3 percentage points by pooling with five optimally-chosen emerging markets in the absence of geographical constraints. Similarly, the median Asian emerging market can reduce its volatility from 4.1 percentage points to 1.9 percentage points in a pool of five Asian emerging markets, and to 1.4 percentage points in a pool of five emerging markets chosen also from outside the region.15
15 An approach based on the number of crises common to more than one member of a given pool yields higher costs of geographical constraints, reflecting a regional element in past emerging market crises.
Presbitero (Univpm) Financial Globalization EMI, UNIVPM 21 / 51
Financial globalization, stability and growth
A number of underlying mechanisms are likely to be involved in the transmission offinancial globalization to economic volatility and growth:
Financial sector development may be instrumental in moderating boom-bustcycles and in efficiently allocating foreign financial flows to competing investmentprojects;
Institutional quality helps to shift the composition of financial flows towards FDIand portfolio equity, thereby enhancing growth and macroeconomic stabilitybenefits;
Sound macroeconomic policies avoid excessive borrowing and debtaccumulation, thus limiting vulnerability to crisis;
Trade integration seems to be associated with fewer sudden stops and currentaccount reversals.
Presbitero (Univpm) Financial Globalization EMI, UNIVPM 22 / 51
Financial globalization, volatility and crisis
The relationship between financial integration and macroeconomic volatility(proxied here by consumption volatility) depends on countries’ domestic financialdevelopment and institutions (thresholds view of financial integration).
The effect of de facto financial integration on consumption volatility is positive forcountries with relatively weak perceived institutional quality and a relatively lowdegree of domestic financial development, but not significantly different from zerofor countries with stronger institutions and more developed domestic financialsystems.
Despite a widespread perception that financial globalization may lead to higherfrequency of crises, existing empirical studies do not support the view that greaterfinancial integration increases the likelihood of crisis. On the contrary, a majorityof studies find that crises are, if anything, less frequent in financially opencountries than in financially closed ones (self-selection?).
Thresholds also appear to influence the impact of financial openness on crisispropensity, with factors such as financial sector development, institutional quality,macroeconomic policy soundness, and trade openness playing key roles.
Presbitero (Univpm) Financial Globalization EMI, UNIVPM 23 / 51
Financial globalization and economic growth
A survey of more than 40 macro-studies concludes that the evidence of a linkbetween financial integration and growth is not robust.
Potential explanations:
1 Composition: unbundling financial globalization into different types offinancial flow helps to uncover a relationship between financial integrationand economic growth.
2 Thresholds: financial integration appears to be beneficial in countries thatmeet certain thresholds with respect to financial development, institutionalquality, macroeconomic policy soundness, and trade openness, but haspotentially large negative effects in countries that do not.
3 Indirect benefits on:
F Total factor productivity growth (more efficiency);F Domestic financial sector development (international best practices in
accounting, financial regulation, and supervision);F Macroeconomic policies (policy discipline).
Micro-studies show a beneficial impact of financial globalization on marketcapitalization, financial development, and the cost of capital.
Presbitero (Univpm) Financial Globalization EMI, UNIVPM 24 / 51
Does the composition of capital flows matter?
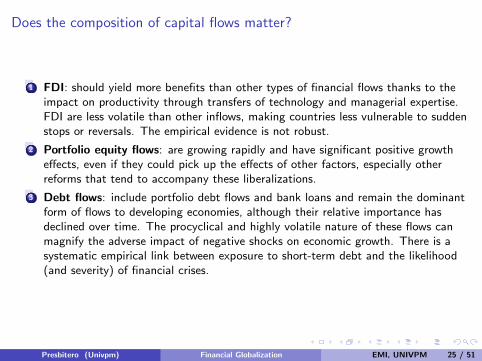
1 FDI: should yield more benefits than other types of financial flows thanks to theimpact on productivity through transfers of technology and managerial expertise.FDI are less volatile than other inflows, making countries less vulnerable to suddenstops or reversals. The empirical evidence is not robust.
2 Portfolio equity flows: are growing rapidly and have significant positive growtheffects, even if they could pick up the effects of other factors, especially otherreforms that tend to accompany these liberalizations.
3 Debt flows: include portfolio debt flows and bank loans and remain the dominantform of flows to developing economies, although their relative importance hasdeclined over time. The procyclical and highly volatile nature of these flows canmagnify the adverse impact of negative shocks on economic growth. There is asystematic empirical link between exposure to short-term debt and the likelihood(and severity) of financial crises.
Presbitero (Univpm) Financial Globalization EMI, UNIVPM 25 / 51
Some critiques on the premises of the pro-financial globalization argument
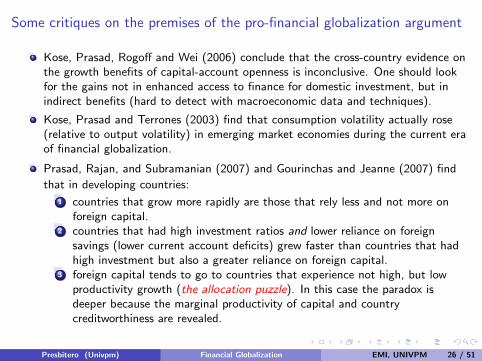
Kose, Prasad, Rogoff and Wei (2006) conclude that the cross-country evidence onthe growth benefits of capital-account openness is inconclusive. One should lookfor the gains not in enhanced access to finance for domestic investment, but inindirect benefits (hard to detect with macroeconomic data and techniques).
Kose, Prasad and Terrones (2003) find that consumption volatility actually rose(relative to output volatility) in emerging market economies during the current eraof financial globalization.
Prasad, Rajan, and Subramanian (2007) and Gourinchas and Jeanne (2007) find
that in developing countries:
1 countries that grow more rapidly are those that rely less and not more onforeign capital.
2 countries that had high investment ratios and lower reliance on foreignsavings (lower current account deficits) grew faster than countries that hadhigh investment but also a greater reliance on foreign capital.
3 foreign capital tends to go to countries that experience not high, but lowproductivity growth (the allocation puzzle). In this case the paradox isdeeper because the marginal productivity of capital and countrycreditworthiness are revealed.
Presbitero (Univpm) Financial Globalization EMI, UNIVPM 26 / 51
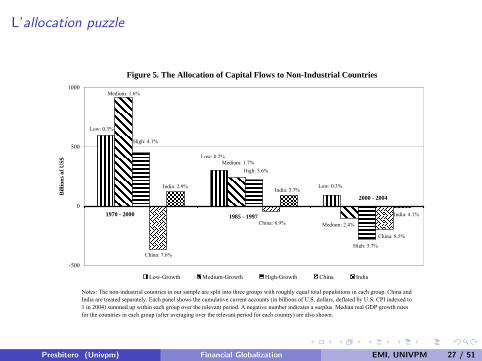
L’allocation puzzle
Figure 5. The Allocation of Capital Flows to Non-Industrial Countries
-500
0
500
1000
Bill
ions
of U
S$
Low-Growth Medium-Growth High-Growth China India
High: 4.1%
India: 2.9%
Medium: 1.6%
Low: 0.3%
China: 7.6%
China: 8.9%
Low: 0.2%
India: 3.7%
Medium: 1.7%High: 3.6%
China: 8.5%
High: 3.7%
Medium: 2.4%
India: 4.1%
Low: 0.3%
Notes: The non-industrial countries in our sample are split into three groups with roughly equal total populations in each group. China and India are treated separately. Each panel shows the cumulative current accounts (in billions of U.S. dollars, deflated by U.S. CPI indexed to 1 in 2004) summed up within each group over the relevant period. A negative number indicates a surplus. Median real GDP growth rates for the countries in each group (after averaging over the relevant period for each country) are also shown.
1970 - 2000 1985 - 1997
2000 - 2004
37
Presbitero (Univpm) Financial Globalization EMI, UNIVPM 27 / 51
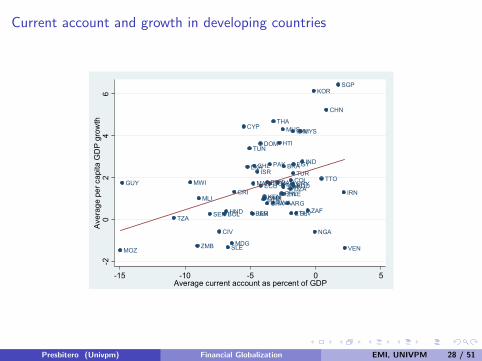
Current account and growth in developing countries
Coefficient = 0 .229 std. error = 0.104
Notes: Sample excludes Nicaragua. Including Nicaragua yields larger positive coefficient.
Figure 9. Current Account Balance and Growth in Developing Countries 1970-2000Unconditional Relationship
Full Sample
Sample excluding countries with Aid/GDP > 0.10
Coefficient = 0 .198 std. error = 0.062
DZA
ARG
BGD
BOL
BRA
CMR
CHL
CHN
COL
CRI
CYP
CIV
DOM
ECU
EGY
SLVETHGHA
GTM
GUY
HTI
HND
IND
IDN
IRN
ISR
JAM
JORKEN
KOR
MDG
MWI
MYS
MLI
MUS
MEXMAR
MOZ
NGA
PAK
PANPRY
PER
PHLRWA
SEN
SLE
SGP
ZAF
LKA
TZA
THA
TTO
TUN
TURUGA URY
VENZMB
ZWE
-20
24
6Av
erag
e pe
r cap
ita G
DP
grow
th
-15 -10 -5 0 5Average current account as percent of GDP
DZA
ARG
BGD
BOL
BRA
CMR
CHL
CHN
COL
CRI
CYP
CIV
DOM
ECU
EGY
SLVETHGHA
GTM
HTI
HND
IND
IDN
IRN
ISR
JAM
KEN
KOR
MDG
MYSMUS
MEXMAR
NGA
PAK
PANPRY
PER
PHL
SLE
SGP
ZAF
LKA
THA
TTO
TUN
TURUGA URY
VEN
ZWE
-20
24
6Av
erag
e pe
r cap
ita G
DP
grow
th
-8 -6 -4 -2 0 2Average current account as percent of GDP
41
Presbitero (Univpm) Financial Globalization EMI, UNIVPM 28 / 51
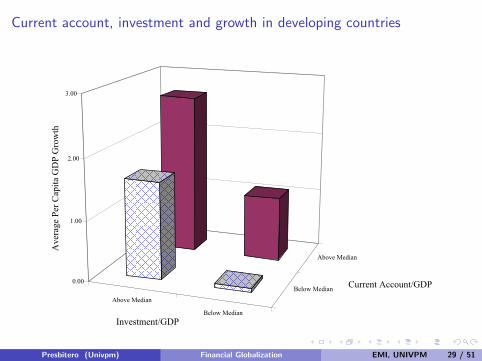
Current account, investment and growth in developing countries
Above Median
Below Median
Below Median
Above Median
0.00
1.00
2.00
3.00
Ave
rage
Per
Cap
ita G
DP
Gro
wth
Investment/GDP
Current Account/GDP
Figure 10. Current Accounts, Investment and Growth in Developing Countries
42
Presbitero (Univpm) Financial Globalization EMI, UNIVPM 29 / 51
Henry 2007
The failure of existing studies to detect a positive impact of financial globalization
(FG) on growth stems from three factors:
1 they look for permanent growth effects whereas in the basic Solow growthmodel permanent decreases in the cost of capital and hence increase in theratio of investment to GDP only have a temporary effect on growth (butconsider endogenous growth model);
2 much of the empirical work does not distinguish between effects of FG ondeveloping and developed countries;
3 FG indicators are measured with considerable error (but this is a commonproblem for many variables for which the growth effect is robust).
The evidence on opening domestic equity markets to foreign participation has beeninvoked as being more positive. Exploitation of short-term effects and onwithin-country-over-time variation in the data.
Limitations: the conflation of equity market reforms with a host of other ones,reverse causality, relatively small sample size.
Presbitero (Univpm) Financial Globalization EMI, UNIVPM 30 / 51
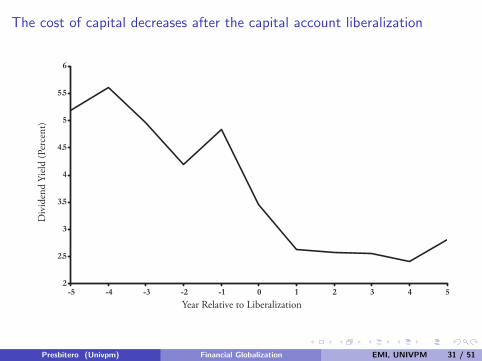
The cost of capital decreases after the capital account liberalization
��
2
2.5
3
3.5
4
4.5
5
5.5
6
-5 -4 -3 -2 -1 0 1 2 3 4 5
Div
iden
d Yi
eld
(Per
cent
)
Figure 3. The Cost of Capital Falls When Countries Liberalize the Capital Account.Year Relative to Liberalization
0 .075
0 .07
0 .065
0 .06
0 .055
0 .05
0 .045
0 .04-5 -4 -3 -2 -1 0 1 2 3 4 5
Gro
wth
Rat
e of
the
Cap
ital S
tock
(Per
cent
)Figure 4. Investment Booms When Countries Liberalize the Capital Account.
Year Relative to Liberalization
Presbitero (Univpm) Financial Globalization EMI, UNIVPM 31 / 51
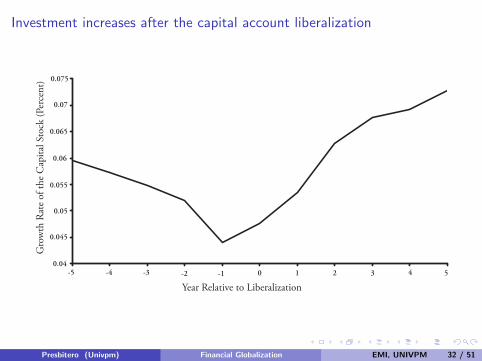
Investment increases after the capital account liberalization
��
2
2.5
3
3.5
4
4.5
5
5.5
6
-5 -4 -3 -2 -1 0 1 2 3 4 5
Div
iden
d Yi
eld
(Per
cent
)Figure 3. The Cost of Capital Falls When Countries Liberalize the Capital Account.
Year Relative to Liberalization
0 .075
0 .07
0 .065
0 .06
0 .055
0 .05
0 .045
0 .04-5 -4 -3 -2 -1 0 1 2 3 4 5
Gro
wth
Rat
e of
the
Cap
ital S
tock
(Per
cent
)
Figure 4. Investment Booms When Countries Liberalize the Capital Account.
Year Relative to Liberalization
Presbitero (Univpm) Financial Globalization EMI, UNIVPM 32 / 51
Kose, Prasad, Rogoff e Wei 2006
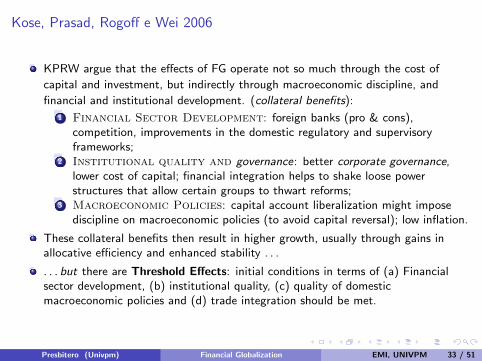
KPRW argue that the effects of FG operate not so much through the cost of
capital and investment, but indirectly through macroeconomic discipline, and
financial and institutional development. (collateral benefits):
1 Financial Sector Development: foreign banks (pro & cons),competition, improvements in the domestic regulatory and supervisoryframeworks;
2 Institutional quality and governance: better corporate governance,lower cost of capital; financial integration helps to shake loose powerstructures that allow certain groups to thwart reforms;
3 Macroeconomic Policies: capital account liberalization might imposediscipline on macroeconomic policies (to avoid capital reversal); low inflation.
These collateral benefits then result in higher growth, usually through gains inallocative efficiency and enhanced stability . . .
. . . but there are Threshold Effects: initial conditions in terms of (a) Financialsector development, (b) institutional quality, (c) quality of domesticmacroeconomic policies and (d) trade integration should be met.
Presbitero (Univpm) Financial Globalization EMI, UNIVPM 33 / 51
Different financial flows
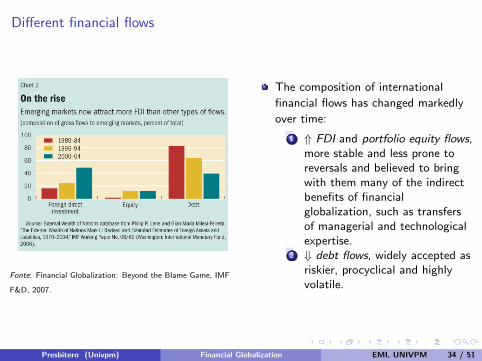
Fonte: Financial Globalization: Beyond the Blame Game, IMF
F&D, 2007.
The composition of international
financial flows has changed markedly
over time:
1 ⇑ FDI and portfolio equity flows,more stable and less prone toreversals and believed to bringwith them many of the indirectbenefits of financialglobalization, such as transfersof managerial and technologicalexpertise.
2 ⇓ debt flows, widely accepted asriskier, procyclical and highlyvolatile.
Presbitero (Univpm) Financial Globalization EMI, UNIVPM 34 / 51
The nexus between financial globalization and growth
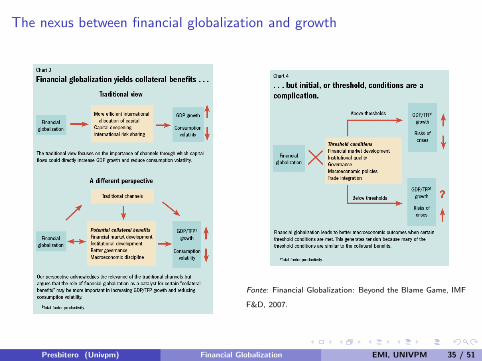
Fonte: Financial Globalization: Beyond the Blame Game, IMF
F&D, 2007.
Presbitero (Univpm) Financial Globalization EMI, UNIVPM 35 / 51
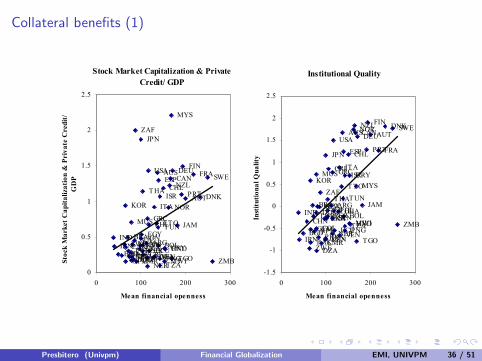
Collateral benefits (1)
Figure 4. Potential Indirect Benefits of Financial Globalization
Stock Market Capitalization & Private Credit/ GDP
USA
AUTDNK
FRADEU
ITA NOR
SWECAN
JPN
FIN
GRC
PRT
ESP
TUR
AUS
NZL
ZAF
ARGBOLBRA
CHL
COLCRIDOM
ECUSLV
GTM
HNDMEX
PRYPER URY
VEN
JAMTTO
IRN
ISR
EGY
BGDLKA
IND IDN
KOR
MYS
NPLPAK
PHL
THA
DZACMR GHAKEN
MWI
MUS
NER
ZWE
SENTZA
TGO
TUN
ZMB
FJI
PNGCHN
0
0.5
1
1.5
2
2.5
0 100 200 300
Mean financial openness
Stoc
k M
arke
t Cap
italiz
atio
n &
Pri
vate
Cre
dit/
GD
PInstitutional Quality
USAAUT
DNK
FRA
DEU
ITA
NOR SWECAN
JPN
FIN
GRC
PRTESP
TUR
AUSNZL
ZAF
ARGBOL
BRA
CHL
COL
CRI
DOM
ECU
SLV
GTMHND
MEX
PRY
PER
URY
VEN
JAM
TTO
IRN
ISR
EGY
BGD
LKAIND
IDN
KORMYS
NPLPAK
PHLTHA
DZACMR
GHA
KEN
MWI
MUS
NER
ZWE
SENTZA
TGO
TUN
ZMB
FJI
PNGCHN
-1.5
-1
-0.5
0
0.5
1
1.5
2
2.5
0 100 200 300
Mean financial openness
Inst
itutio
nal Q
ualit
y
Monetary Policy
USA
AUTDNK
FRADEU
ITANOR
SWECAN
JPN
FIN
GRC
PRTESP
TUR
AUSNZL
ZAFARGBOL
BRA
CHL
COLCRIDOM
ECU
SLV
GTM HND
MEXPRYPER
URYVEN
JAM
TTO
IRN
ISREGY
BGD
LKAIND
IDN
KOR
MYS
NPLPAK PHL
THA
DZA
CMR
GHA
KEN
MWI
MUSNER
ZWE
SEN
TZA
TGO
TUN
ZMB
FJI
PNGCHN
-5
-4.5
-4
-3.5
-3
-2.5
-2
-1.5
-1
-0.5
0
0 100 200 300
Mean financial O penness
Log
Inflt
atio
n
Fiscal Policy
USAAUT
DNK
FRA
DEU
ITA
NOR
SWECAN
JPN
FIN
GRC
PRT
ESP
TUR
AUSNZL
ZAF
ARGBOL
BRACHL
COLCRI
DOM ECUSLVGTM
HNDMEX
PRY
PERURY
VEN JAMTTOIRN
ISR
EGY
BGD
LKA
IND
IDN
KOR
MYS
NPL
PAK
PHL
THA
DZA
CMR
GHAKEN
MWI
MUS
NER
ZWESEN
TZATGOTUN
ZMB
FJIPNG
CHN
-15
-10
-5
0
5
10
0 100 200 300
Mean financial openness
Gov
ernm
ent B
udge
t Bal
ance
(%G
DP)
Notes: The financial integration data are based on a dataset constructed by Lane and Milesi-Ferretti (2006). Financial Development data are taken from Beck and Al-Hussainy (2006). Private Credit refers to credit given to the private sector by deposit money banks and Stock Market Capitalization is defined as the value of listed shares. Institutional quality data are from Daniel Kaufmann, Aart Kraayand Massimo Mastruzzi (2005) and cover the period 1996-2004. Institutional Quality is the average ofthe following indicators: Voice and Accountability, Political Stability, Government Effectiveness, Regulatory Quality, Rule of Law, and Control of Corruption. Monetary and fiscal data are from the World Bank's World Development Indicators and the IMF's International Financial Statistics and World Economic Outlook databases. Inflation is defined as the annual change in CPI. Government Budget Balance is the difference between government revenues and government expenditures.
Presbitero (Univpm) Financial Globalization EMI, UNIVPM 36 / 51
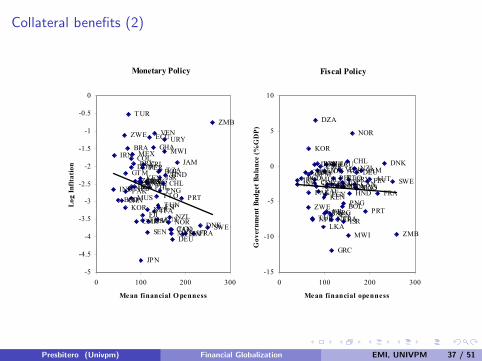
Collateral benefits (2)
Figure 4. Potential Indirect Benefits of Financial Globalization
Stock Market Capitalization & Private Credit/ GDP
USA
AUTDNK
FRADEU
ITA NOR
SWECAN
JPN
FIN
GRC
PRT
ESP
TUR
AUS
NZL
ZAF
ARGBOLBRA
CHL
COLCRIDOM
ECUSLV
GTM
HNDMEX
PRYPER URY
VEN
JAMTTO
IRN
ISR
EGY
BGDLKA
IND IDN
KOR
MYS
NPLPAK
PHL
THA
DZACMR GHAKEN
MWI
MUS
NER
ZWE
SENTZA
TGO
TUN
ZMB
FJI
PNGCHN
0
0.5
1
1.5
2
2.5
0 100 200 300
Mean financial openness
Stoc
k M
arke
t Cap
italiz
atio
n &
Pri
vate
Cre
dit/
GD
P
Institutional Quality
USAAUT
DNK
FRA
DEU
ITA
NOR SWECAN
JPN
FIN
GRC
PRTESP
TUR
AUSNZL
ZAF
ARGBOL
BRA
CHL
COL
CRI
DOM
ECU
SLV
GTMHND
MEX
PRY
PER
URY
VEN
JAM
TTO
IRN
ISR
EGY
BGD
LKAIND
IDN
KORMYS
NPLPAK
PHLTHA
DZACMR
GHA
KEN
MWI
MUS
NER
ZWE
SENTZA
TGO
TUN
ZMB
FJI
PNGCHN
-1.5
-1
-0.5
0
0.5
1
1.5
2
2.5
0 100 200 300
Mean financial openness
Inst
itutio
nal Q
ualit
y
Monetary Policy
USA
AUTDNK
FRADEU
ITANOR
SWECAN
JPN
FIN
GRC
PRTESP
TUR
AUSNZL
ZAFARGBOL
BRA
CHL
COLCRIDOM
ECU
SLV
GTM HND
MEXPRYPER
URYVEN
JAM
TTO
IRN
ISREGY
BGD
LKAIND
IDN
KOR
MYS
NPLPAK PHL
THA
DZA
CMR
GHA
KEN
MWI
MUSNER
ZWE
SEN
TZA
TGO
TUN
ZMB
FJI
PNGCHN
-5
-4.5
-4
-3.5
-3
-2.5
-2
-1.5
-1
-0.5
0
0 100 200 300
Mean financial O penness
Log
Inflt
atio
nFiscal Policy
USAAUT
DNK
FRA
DEU
ITA
NOR
SWECAN
JPN
FIN
GRC
PRT
ESP
TUR
AUSNZL
ZAF
ARGBOL
BRACHL
COLCRI
DOM ECUSLVGTM
HNDMEX
PRY
PERURY
VEN JAMTTOIRN
ISR
EGY
BGD
LKA
IND
IDN
KOR
MYS
NPL
PAK
PHL
THA
DZA
CMR
GHAKEN
MWI
MUS
NER
ZWESEN
TZATGOTUN
ZMB
FJIPNG
CHN
-15
-10
-5
0
5
10
0 100 200 300
Mean financial openness
Gov
ernm
ent B
udge
t Bal
ance
(%G
DP)
Notes: The financial integration data are based on a dataset constructed by Lane and Milesi-Ferretti (2006). Financial Development data are taken from Beck and Al-Hussainy (2006). Private Credit refers to credit given to the private sector by deposit money banks and Stock Market Capitalization is defined as the value of listed shares. Institutional quality data are from Daniel Kaufmann, Aart Kraayand Massimo Mastruzzi (2005) and cover the period 1996-2004. Institutional Quality is the average ofthe following indicators: Voice and Accountability, Political Stability, Government Effectiveness, Regulatory Quality, Rule of Law, and Control of Corruption. Monetary and fiscal data are from the World Bank's World Development Indicators and the IMF's International Financial Statistics and World Economic Outlook databases. Inflation is defined as the annual change in CPI. Government Budget Balance is the difference between government revenues and government expenditures.
Presbitero (Univpm) Financial Globalization EMI, UNIVPM 37 / 51
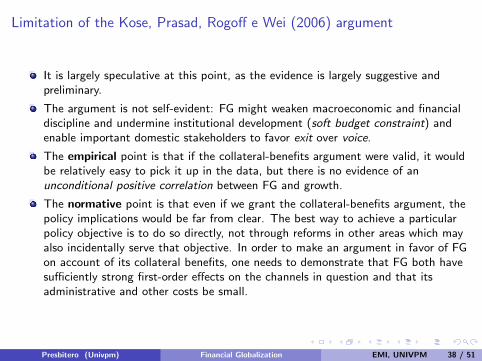
Limitation of the Kose, Prasad, Rogoff e Wei (2006) argument
It is largely speculative at this point, as the evidence is largely suggestive andpreliminary.
The argument is not self-evident: FG might weaken macroeconomic and financialdiscipline and undermine institutional development (soft budget constraint) andenable important domestic stakeholders to favor exit over voice.
The empirical point is that if the collateral-benefits argument were valid, it wouldbe relatively easy to pick it up in the data, but there is no evidence of anunconditional positive correlation between FG and growth.
The normative point is that even if we grant the collateral-benefits argument, thepolicy implications would be far from clear. The best way to achieve a particularpolicy objective is to do so directly, not through reforms in other areas which mayalso incidentally serve that objective. In order to make an argument in favor of FGon account of its collateral benefits, one needs to demonstrate that FG both havesufficiently strong first-order effects on the channels in question and that itsadministrative and other costs be small.
Presbitero (Univpm) Financial Globalization EMI, UNIVPM 38 / 51
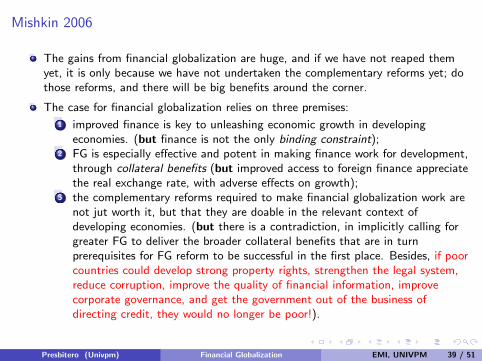
Mishkin 2006
The gains from financial globalization are huge, and if we have not reaped themyet, it is only because we have not undertaken the complementary reforms yet; dothose reforms, and there will be big benefits around the corner.
The case for financial globalization relies on three premises:
1 improved finance is key to unleashing economic growth in developingeconomies. (but finance is not the only binding constraint);
2 FG is especially effective and potent in making finance work for development,through collateral benefits (but improved access to foreign finance appreciatethe real exchange rate, with adverse effects on growth);
3 the complementary reforms required to make financial globalization work arenot jut worth it, but that they are doable in the relevant context ofdeveloping economies. (but there is a contradiction, in implicitly calling forgreater FG to deliver the broader collateral benefits that are in turnprerequisites for FG reform to be successful in the first place. Besides, if poorcountries could develop strong property rights, strengthen the legal system,reduce corruption, improve the quality of financial information, improvecorporate governance, and get the government out of the business ofdirecting credit, they would no longer be poor!).
Presbitero (Univpm) Financial Globalization EMI, UNIVPM 39 / 51
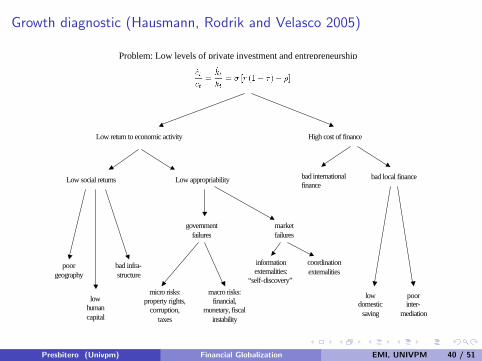
Growth diagnostic (Hausmann, Rodrik and Velasco 2005)
High cost of finance Low return to economic activity
Low social returns Low appropriability
government failures
market failures
poor geography
low human capital
bad infra-structure
micro risks: property rights,
corruption, taxes
macro risks: financial,
monetary, fiscal instability
information externalities:
“self-discovery”
coordination externalities
bad international finance
bad local finance
low domestic
saving
poor inter-
mediation
Figure 1: Growth diagnostics
Problem: Low levels of private investment and entrepreneurship
Presbitero (Univpm) Financial Globalization EMI, UNIVPM 40 / 51
Growth diagnostic
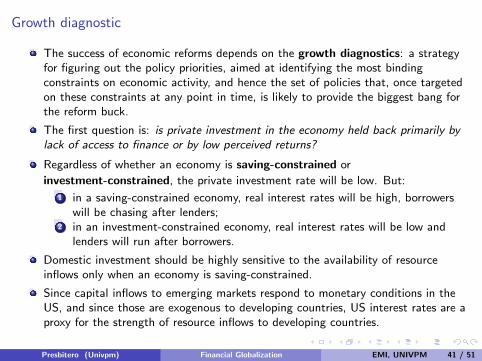
The success of economic reforms depends on the growth diagnostics: a strategyfor figuring out the policy priorities, aimed at identifying the most bindingconstraints on economic activity, and hence the set of policies that, once targetedon these constraints at any point in time, is likely to provide the biggest bang forthe reform buck.
The first question is: is private investment in the economy held back primarily bylack of access to finance or by low perceived returns?
Regardless of whether an economy is saving-constrained or
investment-constrained, the private investment rate will be low. But:
1 in a saving-constrained economy, real interest rates will be high, borrowerswill be chasing after lenders;
2 in an investment-constrained economy, real interest rates will be low andlenders will run after borrowers.
Domestic investment should be highly sensitive to the availability of resourceinflows only when an economy is saving-constrained.
Since capital inflows to emerging markets respond to monetary conditions in theUS, and since those are exogenous to developing countries, US interest rates are aproxy for the strength of resource inflows to developing countries.
Presbitero (Univpm) Financial Globalization EMI, UNIVPM 41 / 51
Saving- or investment-constrained?
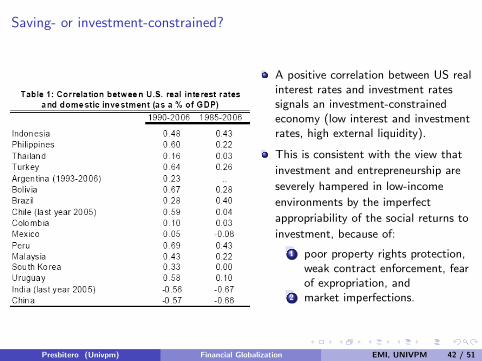
A positive correlation between US realinterest rates and investment ratessignals an investment-constrainedeconomy (low interest and investmentrates, high external liquidity).
This is consistent with the view that
investment and entrepreneurship are
severely hampered in low-income
environments by the imperfect
appropriability of the social returns to
investment, because of:
1 poor property rights protection,weak contract enforcement, fearof expropriation, and
2 market imperfections.
Presbitero (Univpm) Financial Globalization EMI, UNIVPM 42 / 51
A simple model
Because of agency problems, external finance is more expensive than internal cashflow as a source of investment funds: firms will not resort to external finance aslong as they have adequate cash flow or internal funds in relation to theirinvestment needs.
Firms will be of two types:
1 Type I: Profitability of investment projects is high relative to current cashflow, leaving firms in need of external finance for the undertaking ofincremental investments;
2 Type II: Profitability of investment projects is low relative to cash flow,leaving firms not in need of external finance.
The economies in which firms are predominantly of Type I aresaving-constrained, while economies characterized by Type II firms areinvestment-constrained.
Consider opening an economy where interest rates are high relative to the rest ofthe world to capital flows.
Presbitero (Univpm) Financial Globalization EMI, UNIVPM 43 / 51
A simple model
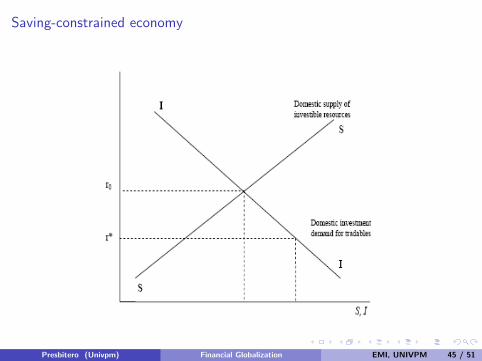
Saving-constrained economy
Capital-account liberalization works in the conventional fashion: a reduction indomestic interest rates and the increase in the availability of external finance spursdomestic investment (more consumption, less savings).
The increase in domestic investment and reduction in saving are financed bycapital inflows: the economy grows more rapidly.
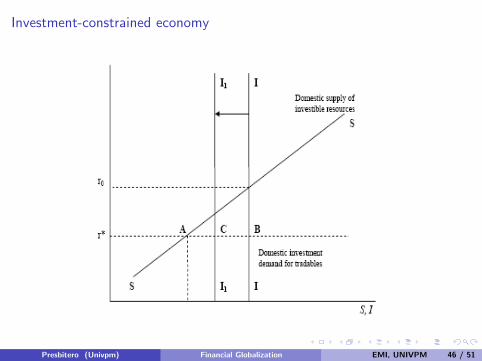
Investment-constrained economy
Given the vertical investment demand schedule, the effect of liberalization is purelyto boost consumption.
Foreign savings simply substitute for domestic savings, with no net effect oninvestment or growth.
Moreover, capital inflows also appreciate the real exchange rate, with adverse(positive) consequences for producers of tradables (non-tradables)
The effect on tradables is larger (tradables ar more demanding and generate moreexternalities): the investment schedule shift leftward, slowing down growth.
Presbitero (Univpm) Financial Globalization EMI, UNIVPM 44 / 51
Saving-constrained economy
Presbitero (Univpm) Financial Globalization EMI, UNIVPM 45 / 51
Investment-constrained economy
Presbitero (Univpm) Financial Globalization EMI, UNIVPM 46 / 51
Domestic or foreign finance?
The macro literature on finance and growth argues that financial depth and thequality of the financial system (i.e. augmenting domestic savings) have importanteffects on economic growth. Is it true also for investment-constrained economies?
In investment-constrained economies, an improvement in financial intermediation(⇑ domestic saving and access of firms to domestic finance) will have negligibleeffects on investment, but . . .
. . . an increase in economy-wide saving leads to a depreciation of the exchange rate.
Thus, improved financial intermediation will in fact boost domestic investment andgrowth, not necessarily through the cost-of-finance channel, but through theprofitability channel.
There is a crucial difference between domestic and foreign finance: improvementsin the former depreciate the real exchange rate, while improvements in the latterappreciate it.
Presbitero (Univpm) Financial Globalization EMI, UNIVPM 47 / 51
Responding to capital inflows
Capital flows are generally welcome, but sudden surges can complicate
macroeconomic management and create financial risks:
I Macroeconomic implications1 exchange rate appreciation2 reserve accumulation . . .3 . . . and sterilization (or decreases in domestic credit)4 adjustments in fiscal and monetary policy
I Financial fragility: prudential regulation.
If the macroeconomic and prudential framework can not be quickly adjusted,capital controls can be used to manage inflows.
The IMF recognize that capital controls are a legitimate part of the toolkit tomanage capital inflows in certain circumstances . . .
. . . but that a decision on their use should reflect a comparison of the distortionsand implementation costs that they may impose and the benefits from regainingmacro policy control and reducing financial fragility.
Presbitero (Univpm) Financial Globalization EMI, UNIVPM 48 / 51
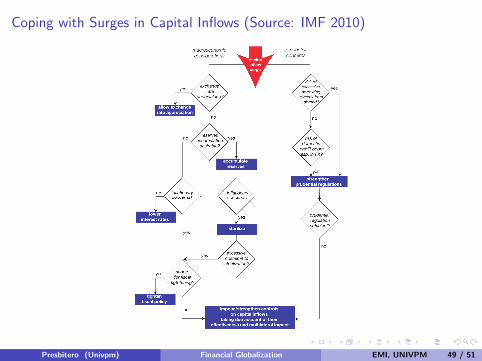
Coping with Surges in Capital Inflows (Source: IMF 2010) 7
Presbitero (Univpm) Financial Globalization EMI, UNIVPM 49 / 51
Evidence from the current crisis
In EM, countries with larger stocks of debt liabilities or financial FDI fared worse inthe current crisis (lower growth slowdown), whereas those with larger stocks ofnonfinancial FDI fared better.
Financial FDI may reflect lending from a parent bank to a branch or local affiliate,which may be more in the nature of debt flows than greenfield FDI.
Debt and some components of financial FDI are strongly associated with creditbooms and foreign-exchange-denominated lending by the domestic bankingsystem, which in turn is associated with greater vulnerability to crisis.
There does appear to be a negative association between capital controls that werein place prior to the global financial crisis and the output declines suffered duringthe crisis.
Presbitero (Univpm) Financial Globalization EMI, UNIVPM 50 / 51
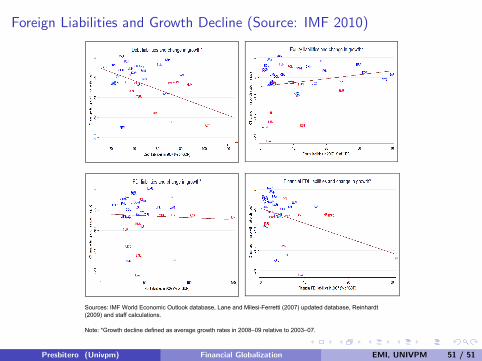
Foreign Liabilities and Growth Decline (Source: IMF 2010)
23
Figure A1. Foreign Liabilities and Growth Decline (in percentage points)
Sources: IMF World Economic Outlook database, Lane and Milesi-Ferretti (2007) updated database, Reinhardt (2009) and staff calculations. Note: *Growth decline defined as average growth rates in 2008–09 relative to 2003–07.
Presbitero (Univpm) Financial Globalization EMI, UNIVPM 51 / 51