financial distress and bankruptcy prediction: evidence ... frequent cases of corporate failures...
TRANSCRIPT
Expert Journal of Finance, Volume 4, pp.52-65, 2016
© 2016 The Authors. Published by Sprint Investify. ISSN 2359-7712
http://Finance.ExpertJournals.com
52
Financial Distress and Bankruptcy Prediction:
Evidence from Ghana
Solomon SAMANHYIA1*, Kofi MINTAH OWARE2
and Frederick ANISOM-YAANSAH1
1Ghana Technology University College, Ghana 2Kumasi Technical University, Ghana
The frequent cases of corporate failures within the financial sector raises the need to
employ models to predict forehand the financial distressed or bankruptcy state of the
financial sector. This study aims at predicting financial distress and bankruptcy on
selected listed banks on the stock exchange of a developing West African country,
Ghana. Data used for the study spanned from 2008 to 2014. The Altman Z-Score and
Boone Indicator were the main techniques of analysis. The study concluded that poor
corporate governance contributes to financial distress and that smaller board size
negatively affects corporate performance. The study also concludes that, in a highly
competitive industry, firms become more efficient and their performance enhance and
thus are less likely to be financially distressed. Merging the listed banks indicates
financial stability of listed banks albeit one distressed bank. Adoption of best
corporate governance standards, enhancing competition through effective corporate
strategies and the assurance from the Central Bank that banks have enough deposit
insurance funds in stock to mitigate the effect of bankruptcy are some of the policy
suggestions derived from this study.
Keywords: Financial Distress, Bankruptcy, Z-Score, Boone Indicator, Financial
Sector
JEL Classification: G2, G3, G33.
1. Introduction
In recent past years, there have been many cases of corporate failures, companies becoming financially
distressed or labeled totally bankrupt. The phenomenon is increasingly becoming worrisome in the banking
industry. Many researchers have tried to predict possible financial distress/bankruptcy of many corporate
entities, most of which are in the manufacturing industry.
Notably among these giants are American International Group Inc., Philipp Holzmann, Enron,
WorldCom, Swissair, Parmalat, Bank of Credit and Commerce International (BCCI). These cases have sent
intriguing message across the globe and helped to create awareness that, the “too big to fall” analogy is no
more an excuse and that larger corporations have the same tendencies to be labelled as financially distressed
*Corresponding Author:
Solomon Samanhyia, Ghana Technology University College, Ghana
Article History:
Received 22 November 2016 | Accepted 13 December 2016 | Available Online 27 December 2016
Cite Reference:
Samanhyia, S., Mintah Oware, K. and Anisom-Yaansah, F., 2016. Financial Distress and Bankruptcy Prediction: Evidence from Ghana. Expert
Journal of Finance, 4, pp.52-65.
Samanhyia, S., Mintah Oware, K. and Anisom-Yaansah, F., 2016. Financial Distress and Bankruptcy Prediction: Evidence from Ghana.
Expert Journal of Finance, 4, pp. 52-65.
53
just as smaller and medium enterprises (Outecheva, 2007). In the United States alone, from the year 2009 to
2015 about 486 banks are said to have collapsed and these has cost the country close to $74,777.8 billion in
asset worth (Federal Deposit Insurance Corporation, 2015). Before the recent 2008 financial crisis, most
African countries have also had their share of bank failures. In 1960, Nigeria saw Muslim Bank, the Lagos
Bank and Berini Bank go bankrupt. In Zimbabwe, The African Report (2014) reported that, the countries
Deposit Protection Corporation (DPC) has closed down six failed banks namely Sagit finance house, Genesis
and Royal, the Century discount house, Rapid discount house and Trust bank with a total cost to depositors of
$ 52.3 million and 11 more banks labeled as financially distressed.
Ghana is not an exception to this phenomenon, as it has also witnessed many corporate failures over
the years. From 2004 to 2005 alone Ghana Airways Limited, Juapong Textiles Ltd and Divine Gold Mines all
failed with assets worth $38.2 million (Addo and Nipah, 2006). Specifically, in the banking sector, Bank for
housing and construction, Meridian BIAO bank, Bank for Credit and Commerce International, Tana Rural
Bank, Ghana Co-operative Bank, Tano Agya Rural Bank, the National Savings and Credit Bank, City Savings
and Loans have all collapsed. Other financial institutions like Multi Credit Microfinance, Unity Trust
Microfinance, Equip Susu Microfinance, Mfa Microfinance, Busy Fingers, Devine Microfinance and Emends
Microfinance and recently DKM Microfinance have been shut down due to inadequate capital, fraud and
regulatory laxity. The effects of these failures have dire consequences on the institutions and the general public
as a whole as depositors undeservedly sometimes lose their money.
Most literatures attribute the cause of failures in corporate entities to many different reasons.
Generally, poor corporate governance measures, competition within the industry, technological changes and
government regulations are ranked high among the causes of failures in corporate entities.
This study therefore aimed at predicting financial distress/bankruptcy of selected listed banks on the
Ghana Stock Exchange. The study also sought to find out whether poor corporate governance and competition
within the banking industry have a relationship with financial distress/ bankruptcy.
A sample of listed banks on the Ghana Stock Exchange were selected and their corporate governance
practices appraised and evaluated, competition within the listed banks were also measured using the Boone
indicator and the stability of the banks examine using Altman’s Z-score for non-manufacturing companies.
The study used data from 2008 to 2014 and concluded that poor corporate governance contributes to financial
distress and that smaller board size affects corporate performance negatively.
The study also concludes that, in a highly competitive industry, firms become more efficient and their
performance enhanced and thus less likely to be financially distressed. Finally, only one bank out of the five
banks is distressed and the remaining four banks were neither distressed nor safe.
This research adds to the talk related to Ghana’s financial sector stability, particularly of the listed
banks and looks to help the overall population and investors on the financial health and wellbeing of the banks
listed on the Ghana stock exchange. This study is also different in many regards as there is no comprehensive
study on financial stability of listed banks on the Ghana Stock Exchange (GSE). Survey of literature showed
that this study is the first to use a theoretical approach such as the Boone Indicator to measure competition on
the Ghana Stock Exchange.
The rest of the paper is organized as follows. Section two presents literature on the relationship
between financial distress/bankruptcy on one side and corporate governance and competition on the other
hand. Section three of the paper presents the method used to analyzed data. The results and discussions are
presented in section four whilst section six concludes the paper with summary of findings and some policy
recommendations.
2. Literature Review
Eminent failure or bankruptcy of businesses and its prediction is of great importance to various
stakeholders including investors, suppliers, creditors and shareholders. A business could fail as a result of
economic reasons, where a firm’s revenue cannot cover its cost, financial where the firm is unable to meet its
current obligations even though its asset is more than its total liabilities or bankruptcy if a firm’s total liability
exceeds its total assets. Whitaker (1999) found that firms become bankrupt as a result of economic distress
stemming from a fall in industry operating income and poor management, arising out of incessant losses over
a period of five years. Whitaker’s explanations of business failure seem to agree with the economic and
financial reasons given above, but differ from the fact that, the fall in operating income is as a result of poor
management.
Altman (2006) assigned managerial incompetence as the most pervasive reason for corporate failures.
This assertion seems to agree with the view of Whitaker that management incompetence is a main reason for
Samanhyia, S., Mintah Oware, K. and Anisom-Yaansah, F., 2016. Financial Distress and Bankruptcy Prediction: Evidence from Ghana.
Expert Journal of Finance, 4, pp. 52-65.
54
company failure. In recent times many business failures have been attributed to poor corporate governance.
Corporate governance according to OECD (2008) is a set of dependable relationship between the directors,
owners and other stakeholders of an entity.
Corporate governance also underpins the structural arrangements put in place to enable the entity
achieve its objectives and be able to monitor and measure performance. Poor corporate governance results in
inappropriate decisions, lack of supervision and oversight responsibility over company activities, poor internal
controls and abuse of power by both the board of directors and management. Competition is another facet that
when not properly managed would result in business failure.
2.1. Corporate Governance and Financial Distress
Corporate governance is the system by which organizations are directed and controlled (Cadbury
report, n.d). Corporate governance is a set of dependable relationship between the directors, owners and other
stakeholders of an entity. Corporate governance also underpins the structural arrangements put in place to
enable the entity achieve its objectives and be able to monitor and measure performance (OECD, 2008).
Studies have shown and organizational theory has confirmed that the performance of corporate entities
depend on the collaboration of management at the top level. It is therefore an undoubted fact that corporate
governance and company leadership play an important role in company strategy formulation in order to drive
towards company profitability and sustainability. Researchers such as (Gilson, 1989; Gilson, 1990; Datta and
Iskandar-Datta, 1995) argued that financial distress can be associated or attributed to corporate governance.
Daily and Dalton (1994) accords the fact that, there is a relationship between corporate failure and corporate
governance characteristics, however, the distinction in consensus is about the different attributes that support
the markers.
Huang and Zhao (2008) identified eight independent variables for measuring the cost of financial
distress based on corporate governance indicators. According to Huang and Zhao, shareholder structure, board
structure, agency problems and control mechanisms are the key variables that can be used to measure financial
distress based on corporate governance indicators. Their work suggested that board structure and composition
for instance, the chief executive officer (CEO) and board chairman duality is a symbol of bad corporate
governance and not recommended as this creates conflict of interest and lack of effective leadership since the
CEO is now accountable to himself. Such structures do not create the right ambiance and promote strategic
thinking during periods of financial distress.
Colley et al (2005) also identified among many key corporate issues that tend to impact on corporate
performance and as such erode the confidence of stakeholders. Her view is however different from the ones
suggested by Huang and Zhao and reiterates that the most significant in the indicators is board entrenchment
where majority of board members remain on the board for too long and have measurable influence and
therefore are no longer interested in pursuing relevant corporate strategic goals. The result of such attitudes
of the board is ineffectiveness, lack of focus on corporate objectives, insufficient inertia and subsequently
collapse of corporations.
The view of board entrenchment espouses by Colley et al (2005) appears not to be a strong indicators
of corporate governance principles. The reason being that, directors of a company cannot entrench themselves
longer than the term required for directors to serve on boards and it is by shareholders vote that makes them
board members and as such can vote them out.
However, their view of long serving members pursuing self-interest rather than corporate goals could
be possible. Pozen (2010) in his article “The Case of Professional Boards” reiterated that, board structure, size
and expertise of the members are key determinants of the success of the board to implement a company’s
corporate strategy and make it profitable and sustainable. He suggests that, larger board sizes stifle consensus-
decision making and its time consuming and suggest that, it is suicidal to have all board members as generalist.
There’s the need for experts for example an accountant to head the audit committee and the rest of the members,
experts in the company’s main line of business. His suggestion of larger board results in consensus-decision
making difficult is acknowledgeable, however, on the issue of board size, his view contradicts that of Dalton
et al (1999) who conducted a meta-analysis of 27 studies that featured a board size variable and found having
that more directors was associated with higher levels of a firm’s financial performance. This result held true
for firms of all sizes, but the effect of board size on performance was greater for smaller firms.
In contrast, De Andres, Azofra and Lopez (2005) analyzed ten developed markets, including the
United States, and found a negative relationship between board size and firm performance as measured by 12-
month equity 17 market-to-book value, although the convex patterns of results suggested negative impact
decreased as board sizes were larger. Huther (1997) undertook an empirical test and his results confirm that of
De Andres, Azofra and Lopez (2005) that, there are actually efficiency gains to be made by reducing the size
Samanhyia, S., Mintah Oware, K. and Anisom-Yaansah, F., 2016. Financial Distress and Bankruptcy Prediction: Evidence from Ghana.
Expert Journal of Finance, 4, pp. 52-65.
55
of boards. There is therefore a mixed stance on the issue of board size in corporate governance and performance
of a company. Ultimately however, board size and expediency should not be sacrificed for the benefit of
different perspectives that would be brought to the board if larger members are involved and so an appreciable
number should be ideal.
2.2. Competition and Financial Distress
It is a known convention that competition induces risk in corporate entities. This risk is due to the fact
that entities want to reduce the penalty of failure and thus the incentive for prudence. This phenomenon is
more evident in the manufacturing and banking sector.
Studies have provided the most relevant findings on the relationship between bank competition and
financial distress or failure and can be put into two categories:
1. Micro-based analysis that investigates the influence of bank competition on risk-taking and for that
matter financial stability.
2. Macro-based analysis that analyses the impact of bank competition on company survival and
stability.
2.2.1. Micro-based Analysis View
Risk in financial terms is the degree of uncertainty on the return of an asset. In the banking industry,
risk-taking is measured by the ratio of non-performing loans to total loans in the bank’s portfolio. Competition
is the act of competing, rivaling for supremacy or to outwit ones competitor in order to claim maximum
benefits. It could be measured by concentration and Lerner indices. One group of researchers, namely Jimenez
et al (2008), examined the relationship between competition and bank failures based on the micro-based
category. They investigated the effect of bank competition on the bank’s risk-taking in a study of 107 Spanish
banks. Their study found no significant impact of bank concentration, however, it did find a negative
relationship between the Lerner index and risk-taking.
Alternatively, Berger et al (2009) used Herfindahl- Hirschman index and the Lerner index to examine
the effect of bank competition on three indicators of bank risk-taking, namely non-performing loans ratio, Z-
score and capitalization ratio. Berger et al (2009) broadened the measurement base and increased the sample
size to 9,000 banks from both developing and developed countries unlike Jimenex et al (2008). They found
that, competition has a positive impact on risk-taking banks in the developed countries but obtained ambiguous
results for the developing countries. Besanko and Thakor (1993) in a prior research demonstrated that,
incremented rivalry lessens the informational benefits from banking relationship and along these lines
reinforces the motivating forces for risk-taking - in this manner rivalry advances bank failure.
Fungacova and Weill (2013) examined the part of bank rivalry on the event of bank failures in Russian
banks from 2001-2007 and inferred that, stiffer bank rivalry enhances the event of bank failures and
subsequently increased rivalry could undermine financial stability. Caminal and Matudes (2002) additionally
contended that, market power ambiguously affected bank failures in which rivalry impacts bank solvency
through the incentives to put invest in technologies that lessen data asymmetries and thus moral risks issues.
Turk-Ariss (2010) examines the effect of market power, measured by the Lerner index, on a marker
of financial stability, the Z-score, for 821 banks from 60 nations. She found a positive impact of market power
on financial stability.
Despite the fact that the above reviews affirmed a huge impact of bank rivalry on bank stability, Boyd
et al. (2006) and De Nicolo and Loukoianova (2007) proposed contrary ideas. They examined the connection
between the Herfindahl-Hirschman index and the Z-score on two distinct samples, the first from 2,500 banks
from USA and the other sample from 2,700 banks from developing countries. Their results affirmed a positive
effect of bank focus on bank risk, and in this way they propose that rivalry diminishes the risk of bank failures.
Boyd and De Nicole view is grounded on the idea that, competition induces loan rates to be reduced and this
therefore decreases the probability of defaults. They propose that loan defaults are in a perfect correlation with
the probability of bank failure.
2.2.2. Macro-based Analysis View
Considering the studies done based on the macro-analysis category, two main literature investigations
relates to the relationship between competition and financial distress. Beck et al (2006) undertook an
investigation into the impact of bank concentration on the likelihood of a systemic banking crisis. Their
analysis was based on a sample of 69 countries for the period 1980 to 1997, which captured 47 credit crunch
episodes. Their conclusion is that, crisis are less likely in more concentrated banking systems and therefore
accords to the competition fragility view espoused by Boyd et al (2006), De Nicolo and Loukoianova (2007).
Samanhyia, S., Mintah Oware, K. and Anisom-Yaansah, F., 2016. Financial Distress and Bankruptcy Prediction: Evidence from Ghana.
Expert Journal of Finance, 4, pp. 52-65.
56
Schaecket al (2009) build on the research done by Beck et al (2006) and extended their work by using
another option to measure bank rivalry, namely the non-basic H-measurement, and they examined the effect
of bank rivalry on the event of a banking crisis and on time up to the crisis. The examination implied a sample
of 45 nations, followed up in the 1980-2005 timeframe, which incorporates 31 banking crises. The primary
results is that competition decreases the probability of a banking crisis and increases the run-up time to a crisis.
Consequently, this research supports the ‘competition stability’ view.
Boone (2008) has extended the existing set of competition measures by suggesting a new measure
based on the idea that efficient organizations are more highly rewarded in more competitive markets. The
indicator starts from the notion that in a more competitive market, firms are punished more harshly in terms of
profits for being inefficient. This analogy is in line with the efficient hypothesis which explains banks
performance by difference in efficiency. Under this hypothesis, it is believed that, more efficient firms perform
creditably well and achieve superior results in terms of profits and eventually market share. This therefore
suggest that, efficiency is underpinned by tougher competition and this results in compelling the competing
firms to produce their best in terms of performance hence the incidence of financial distress is distant from
such a firm all things being equal.
2.3. Predictability of Altman’s Z- score
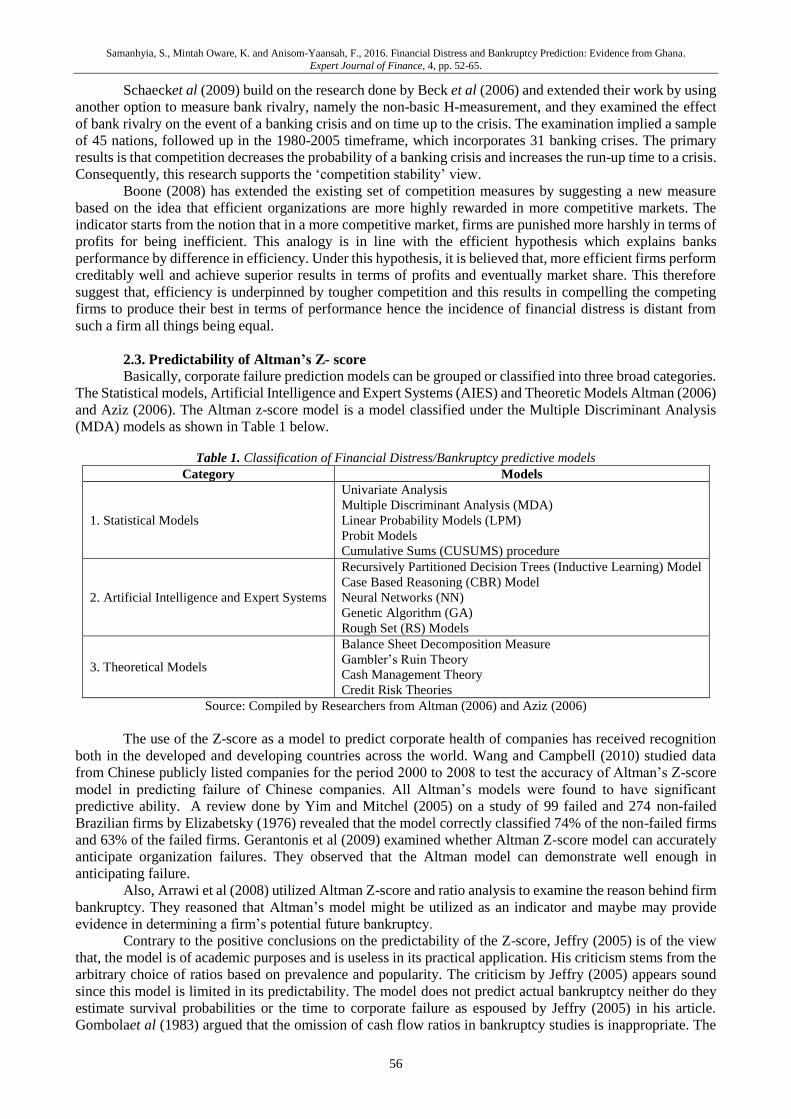
Basically, corporate failure prediction models can be grouped or classified into three broad categories.
The Statistical models, Artificial Intelligence and Expert Systems (AIES) and Theoretic Models Altman (2006)
and Aziz (2006). The Altman z-score model is a model classified under the Multiple Discriminant Analysis
(MDA) models as shown in Table 1 below.
Table 1. Classification of Financial Distress/Bankruptcy predictive models
Category Models
1. Statistical Models
Univariate Analysis
Multiple Discriminant Analysis (MDA)
Linear Probability Models (LPM)
Probit Models
Cumulative Sums (CUSUMS) procedure
2. Artificial Intelligence and Expert Systems
Recursively Partitioned Decision Trees (Inductive Learning) Model
Case Based Reasoning (CBR) Model
Neural Networks (NN)
Genetic Algorithm (GA)
Rough Set (RS) Models
3. Theoretical Models
Balance Sheet Decomposition Measure
Gambler’s Ruin Theory
Cash Management Theory
Credit Risk Theories
Source: Compiled by Researchers from Altman (2006) and Aziz (2006)
The use of the Z-score as a model to predict corporate health of companies has received recognition
both in the developed and developing countries across the world. Wang and Campbell (2010) studied data
from Chinese publicly listed companies for the period 2000 to 2008 to test the accuracy of Altman’s Z-score
model in predicting failure of Chinese companies. All Altman’s models were found to have significant
predictive ability. A review done by Yim and Mitchel (2005) on a study of 99 failed and 274 non-failed
Brazilian firms by Elizabetsky (1976) revealed that the model correctly classified 74% of the non-failed firms
and 63% of the failed firms. Gerantonis et al (2009) examined whether Altman Z-score model can accurately
anticipate organization failures. They observed that the Altman model can demonstrate well enough in
anticipating failure.
Also, Arrawi et al (2008) utilized Altman Z-score and ratio analysis to examine the reason behind firm
bankruptcy. They reasoned that Altman’s model might be utilized as an indicator and maybe may provide
evidence in determining a firm’s potential future bankruptcy.
Contrary to the positive conclusions on the predictability of the Z-score, Jeffry (2005) is of the view
that, the model is of academic purposes and is useless in its practical application. His criticism stems from the
arbitrary choice of ratios based on prevalence and popularity. The criticism by Jeffry (2005) appears sound
since this model is limited in its predictability. The model does not predict actual bankruptcy neither do they
estimate survival probabilities or the time to corporate failure as espoused by Jeffry (2005) in his article.
Gombolaet al (1983) argued that the omission of cash flow ratios in bankruptcy studies is inappropriate. The
Samanhyia, S., Mintah Oware, K. and Anisom-Yaansah, F., 2016. Financial Distress and Bankruptcy Prediction: Evidence from Ghana.
Expert Journal of Finance, 4, pp. 52-65.
57
empirical evidences provided above with the exception of Jeffry and Gombola et al points to the fact that the
Z-score is helpful in predicting failure of publicly listed firms in the developed countries.
Narrowing down to the developing countries, a study by Appiah (2011) on corporate failure prediction
on listed firms in Ghana revealed that, Altman’s Z-score is able to predict corporate health of listed firms in
Ghana dependent on company size and nature. Appiah’s study focused on a sample of 15 non-failed and failed
companies listed on the Ghana Stock Exchange, he tested the model through a cross-section of different firms
in the manufacturing industry with dataset from 2004 to 2005.
Titshabona (2013) investigated using Altman’s Z-score for non-manufacturing firms, on financial
institutions listed on the Zimbabwe Stock Exchange. The dataset for the period 2011 to 2013 were used and
the findings showed that 83.33% of the financial institutions were in the distress zone whiles 16.67% were at
the grey zone and non in the safe zone. The above studies indicate that, Altman’s Z-score despite its drawbacks
can and is used to predict corporate failure both in the public and private sector in both manufacturing and
non-manufacturing industries.
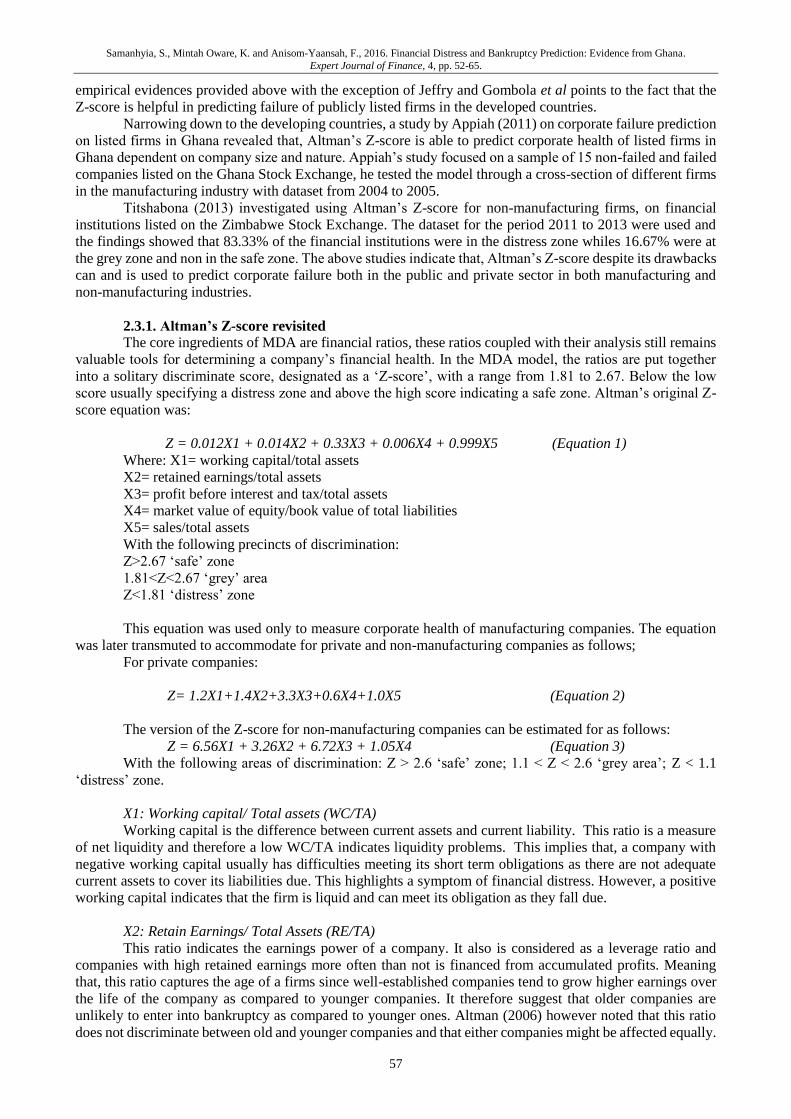
2.3.1. Altman’s Z-score revisited
The core ingredients of MDA are financial ratios, these ratios coupled with their analysis still remains
valuable tools for determining a company’s financial health. In the MDA model, the ratios are put together
into a solitary discriminate score, designated as a ‘Z-score’, with a range from 1.81 to 2.67. Below the low
score usually specifying a distress zone and above the high score indicating a safe zone. Altman’s original Z-
score equation was:
Z = 0.012X1 + 0.014X2 + 0.33X3 + 0.006X4 + 0.999X5 (Equation 1)
Where: X1= working capital/total assets
X2= retained earnings/total assets
X3= profit before interest and tax/total assets
X4= market value of equity/book value of total liabilities
X5= sales/total assets
With the following precincts of discrimination:
Z>2.67 ‘safe’ zone
1.81<Z<2.67 ‘grey’ area
Z<1.81 ‘distress’ zone
This equation was used only to measure corporate health of manufacturing companies. The equation
was later transmuted to accommodate for private and non-manufacturing companies as follows;
For private companies:
Z= 1.2X1+1.4X2+3.3X3+0.6X4+1.0X5 (Equation 2)
The version of the Z-score for non-manufacturing companies can be estimated for as follows:
Z = 6.56X1 + 3.26X2 + 6.72X3 + 1.05X4 (Equation 3)
With the following areas of discrimination: Z > 2.6 ‘safe’ zone; 1.1 < Z < 2.6 ‘grey area’; Z < 1.1
‘distress’ zone.
X1: Working capital/ Total assets (WC/TA)
Working capital is the difference between current assets and current liability. This ratio is a measure
of net liquidity and therefore a low WC/TA indicates liquidity problems. This implies that, a company with
negative working capital usually has difficulties meeting its short term obligations as there are not adequate
current assets to cover its liabilities due. This highlights a symptom of financial distress. However, a positive
working capital indicates that the firm is liquid and can meet its obligation as they fall due.
X2: Retain Earnings/ Total Assets (RE/TA)
This ratio indicates the earnings power of a company. It also is considered as a leverage ratio and
companies with high retained earnings more often than not is financed from accumulated profits. Meaning
that, this ratio captures the age of a firms since well-established companies tend to grow higher earnings over
the life of the company as compared to younger companies. It therefore suggest that older companies are
unlikely to enter into bankruptcy as compared to younger ones. Altman (2006) however noted that this ratio
does not discriminate between old and younger companies and that either companies might be affected equally.
Samanhyia, S., Mintah Oware, K. and Anisom-Yaansah, F., 2016. Financial Distress and Bankruptcy Prediction: Evidence from Ghana.
Expert Journal of Finance, 4, pp. 52-65.
58
It is however a general believe that companies with a high RE/TA ratio indicates good profitability and hence
less pruned to financial distress or bankruptcy.
X3: Earnings before Interest and Tax/ Total Assets (EBIT/TA)
EBIT measures a company’s profitability excluding statutory obligations in the form of tax and interest
charges. The ratio measures ability of management to derive profits out of the company’s assets. Significantly,
it measures earnings on each dollar of investment made in a company’s assets.
X4: Market Value of Equity/ Book Value of Total Liability (MVE/TL)
This ratio depicts a company’s worth. As expressed with Total liability indicates whether a company
is financially distressed or not. The market value of equity is obtain by multiplying the total number of
preferred and common stock of a company by its share price. The total liability incorporates both short term
and long term liability. The ratio is an indication of how the total assets of a company can cover its liabilities.
A company with high debt to equity ratio tends to move closely to insolvency if enough profits are not available
to support the payment of interest expense.
X5: Sales/Total Assets (Sales/TA)
This ratio measures management efficiency in generating sales from available assets. It also measures
the firm’s competitive ability, as it relates to sales of products. The higher this ratio the better it is for the firm.
3. Methodology
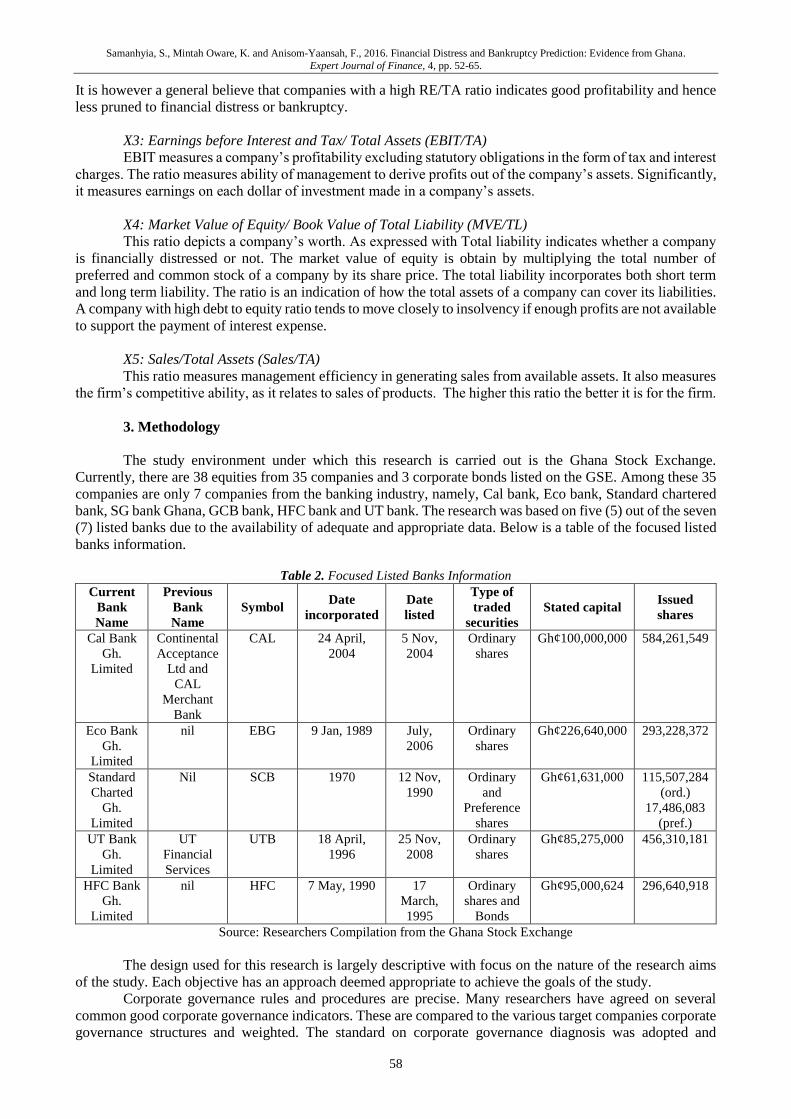
The study environment under which this research is carried out is the Ghana Stock Exchange.
Currently, there are 38 equities from 35 companies and 3 corporate bonds listed on the GSE. Among these 35
companies are only 7 companies from the banking industry, namely, Cal bank, Eco bank, Standard chartered
bank, SG bank Ghana, GCB bank, HFC bank and UT bank. The research was based on five (5) out of the seven
(7) listed banks due to the availability of adequate and appropriate data. Below is a table of the focused listed
banks information.
Table 2. Focused Listed Banks Information
Current
Bank
Name
Previous
Bank
Name
Symbol Date
incorporated
Date
listed
Type of
traded
securities
Stated capital Issued
shares
Cal Bank
Gh.
Limited
Continental
Acceptance
Ltd and
CAL
Merchant
Bank
CAL 24 April,
2004
5 Nov,
2004
Ordinary
shares
Gh¢100,000,000 584,261,549
Eco Bank
Gh.
Limited
nil EBG 9 Jan, 1989 July,
2006
Ordinary
shares
Gh¢226,640,000 293,228,372
Standard
Charted
Gh.
Limited
Nil SCB 1970 12 Nov,
1990
Ordinary
and
Preference
shares
Gh¢61,631,000 115,507,284
(ord.)
17,486,083
(pref.)
UT Bank
Gh.
Limited
UT
Financial
Services
UTB 18 April,
1996
25 Nov,
2008
Ordinary
shares
Gh¢85,275,000 456,310,181
HFC Bank
Gh.
Limited
nil HFC 7 May, 1990 17
March,
1995
Ordinary
shares and
Bonds
Gh¢95,000,624 296,640,918
Source: Researchers Compilation from the Ghana Stock Exchange
The design used for this research is largely descriptive with focus on the nature of the research aims
of the study. Each objective has an approach deemed appropriate to achieve the goals of the study.
Corporate governance rules and procedures are precise. Many researchers have agreed on several
common good corporate governance indicators. These are compared to the various target companies corporate
governance structures and weighted. The standard on corporate governance diagnosis was adopted and
Samanhyia, S., Mintah Oware, K. and Anisom-Yaansah, F., 2016. Financial Distress and Bankruptcy Prediction: Evidence from Ghana.
Expert Journal of Finance, 4, pp. 52-65.
59
modified from the method used by Salmon (1993) 22 questions for diagnosing your board cited in (Lorsch,
2000, p.22) and OECD principles of good corporate governance.
Similarly, the measure of competition has been extensively discussed in the literature. As competition
represents a non-observable variable, the most rational procedure is to estimate it. Among many other methods
available the study adopted the method known as the Boone indicator.
The model used to estimate the indicator is as follows;
𝑙𝑛(𝜋𝑖) = 𝛼 + 𝛽𝑖 𝑙𝑛(𝑚𝑐) + 𝐷𝑡
where 𝜋 = Market share in operating profit terms,
MC = Cost to income ratio, a measure of efficiency.
𝛽 𝑎𝑛𝑑 𝛼, 𝐷𝑡 = 𝐵𝑜𝑜𝑛𝑒 𝑖𝑛𝑑𝑖𝑐𝑎𝑡𝑜𝑟 𝑎𝑛𝑑 𝑑𝑢𝑚𝑚𝑖𝑒𝑠, respectively.
The model considers that, competition enhances performance (market share) of efficient banks
(namely, the banks with reduced operating expenses). The more 𝛽 < 0 the more competitive there is in a
specific market or industry, the more stable the firm is due to lower operational cost.
Lastly, the Z-Score for non-manufacturing companies is employed to measure the financial stability
of the target companies. This method involves collection of data from publicized accounts of the various target
companies and has unique rules and procedures.
The equation used for calculating the Z-score for the banks is as follows;
Z = 6.56X1 + 3.26X2 + 6.72X3 + 1.05X4 (Equation 3)
where all the variables were previously defined.
4. Results and Discussion
This section presents the findings of the study. It includes the effect of corporate governance on
financial distress or bankruptcy, and also the relationship between financial distress/bankruptcy and
competition in the selected banks. The result also includes the distressed or bankruptcy state of the selected
listed banks on Ghana Stock Exchange.
4.1. The Effect of Corporate Governance on Financial Distress or Bankruptcy
In order to measure the level of adherence or non-adherence to corporate governance standards, among
many indicators, three key indicators were adopted and used as a yardstick to measure corporate governance
practices in the case study companies.
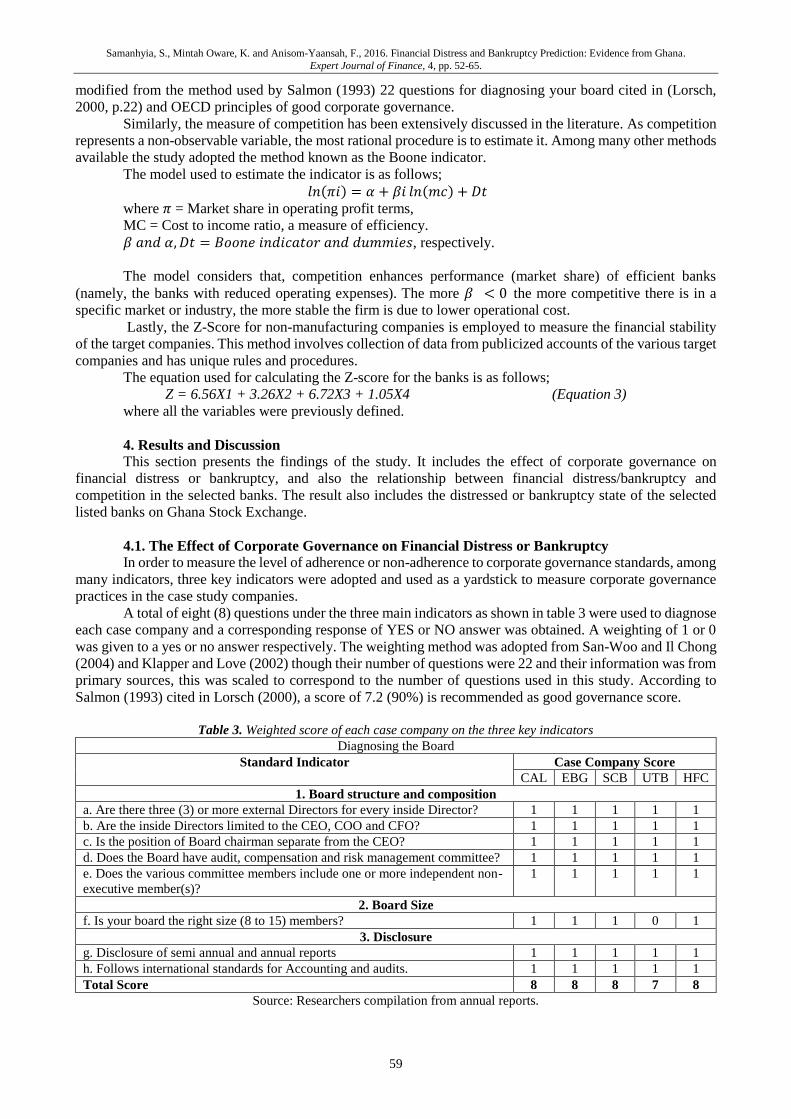
A total of eight (8) questions under the three main indicators as shown in table 3 were used to diagnose
each case company and a corresponding response of YES or NO answer was obtained. A weighting of 1 or 0
was given to a yes or no answer respectively. The weighting method was adopted from San-Woo and Il Chong
(2004) and Klapper and Love (2002) though their number of questions were 22 and their information was from
primary sources, this was scaled to correspond to the number of questions used in this study. According to
Salmon (1993) cited in Lorsch (2000), a score of 7.2 (90%) is recommended as good governance score.
Table 3. Weighted score of each case company on the three key indicators
Diagnosing the Board
Standard Indicator Case Company Score
CAL EBG SCB UTB HFC
1. Board structure and composition
a. Are there three (3) or more external Directors for every inside Director? 1 1 1 1 1
b. Are the inside Directors limited to the CEO, COO and CFO? 1 1 1 1 1
c. Is the position of Board chairman separate from the CEO? 1 1 1 1 1
d. Does the Board have audit, compensation and risk management committee? 1 1 1 1 1
e. Does the various committee members include one or more independent non-
executive member(s)?
1 1 1 1 1
2. Board Size
f. Is your board the right size (8 to 15) members? 1 1 1 0 1
3. Disclosure
g. Disclosure of semi annual and annual reports 1 1 1 1 1
h. Follows international standards for Accounting and audits. 1 1 1 1 1
Total Score 8 8 8 7 8
Source: Researchers compilation from annual reports.
Samanhyia, S., Mintah Oware, K. and Anisom-Yaansah, F., 2016. Financial Distress and Bankruptcy Prediction: Evidence from Ghana.
Expert Journal of Finance, 4, pp. 52-65.
60
From the table above, with the exception of UTB which obtained 4 out of 5 representing 80% with
respect to board size category, all the other case companies score a 100% in each of the indicator categories.
The board size of UTB fell below the range suggested by (Salmond, 1993 cited in Lorsch, 2000).
All the banks with the exception of UTB scored above 90% and seems to be more financially stable
as shown in the Z- Score which is a measure of stability computed in Table 4 below.
This therefore implies that financial stability may be linked to good corporate governance adherence
and poor or inadequate adherence to corporate governance practices results to poor performance and in this
respect smaller board size affects company’s financial stability.
This result however, conflicts with studies by Yermack (1996), Eisenberg et al. (1998) and Conyon
and Peck (1998) who suggested that, board size has an inverse relationship with performance. Meaning,
smaller boards should appear to be more efficient than larger boards.
However, one must be careful when concluding on board size and its direct implication on company
performance. Company size, nature of its business and length of time of existence may inform a company’s
reasons for its board size.
4.2. The Relationship between Financial Distress/Bankruptcy and Competition
It is normally stated that in industries or companies with increasing competition, inefficient operating
companies are pushed more harshly than those that are efficient. It therefore implies that, comparing the
relative profits between companies of arbitrarily efficient and those with greater efficiency contains some level
of information about competition.
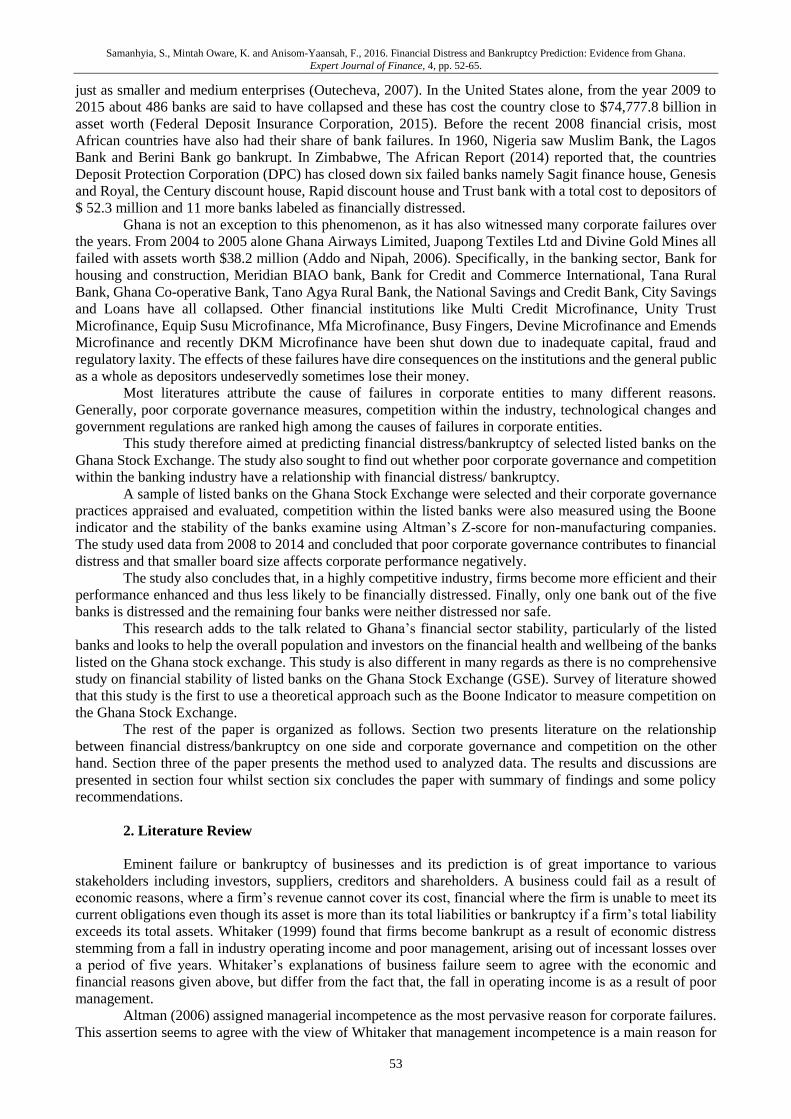
It is against this background that the results below are underpinned. Competition is estimated using
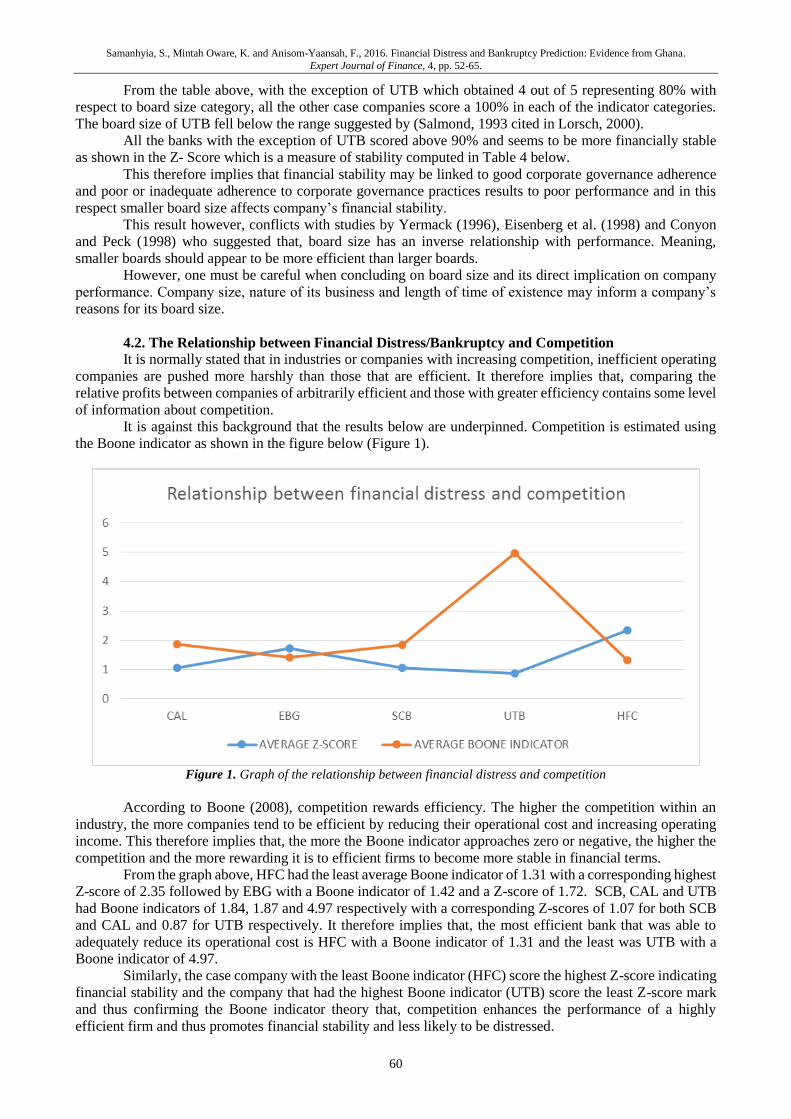
the Boone indicator as shown in the figure below (Figure 1).
Figure 1. Graph of the relationship between financial distress and competition
According to Boone (2008), competition rewards efficiency. The higher the competition within an
industry, the more companies tend to be efficient by reducing their operational cost and increasing operating
income. This therefore implies that, the more the Boone indicator approaches zero or negative, the higher the
competition and the more rewarding it is to efficient firms to become more stable in financial terms.
From the graph above, HFC had the least average Boone indicator of 1.31 with a corresponding highest
Z-score of 2.35 followed by EBG with a Boone indicator of 1.42 and a Z-score of 1.72. SCB, CAL and UTB
had Boone indicators of 1.84, 1.87 and 4.97 respectively with a corresponding Z-scores of 1.07 for both SCB
and CAL and 0.87 for UTB respectively. It therefore implies that, the most efficient bank that was able to
adequately reduce its operational cost is HFC with a Boone indicator of 1.31 and the least was UTB with a
Boone indicator of 4.97.
Similarly, the case company with the least Boone indicator (HFC) score the highest Z-score indicating
financial stability and the company that had the highest Boone indicator (UTB) score the least Z-score mark
and thus confirming the Boone indicator theory that, competition enhances the performance of a highly
efficient firm and thus promotes financial stability and less likely to be distressed.
Samanhyia, S., Mintah Oware, K. and Anisom-Yaansah, F., 2016. Financial Distress and Bankruptcy Prediction: Evidence from Ghana.
Expert Journal of Finance, 4, pp. 52-65.
61
The high competition was triggered by the deadline for meeting the Bank of Ghana directive on the
minimum capital adequacy requirement for commercial banks in 2010 and 2013. Therefore, all the banks were
seen striving towards meeting that directive.
Generally, the economic environment within these period was faced with stiff cost rises from
inflationary pressures, exchange rate fluctuations, and increased prices of petroleum products that are used to
fuel powered generators. It is therefore expected that competition would be stiff and banks will therefore
employ the best of strategies to contain these pressures.
The most efficient banks were those that were able to implement cost cutting strategies to reduce their
cost to income ratio drastically. These strategies to a large extend did have a positive impact on the banks
efficiency and making them more stable since the industry operating cost was of a lower magnitude than
growth in industry income resulting in more profitability (Ghana Banking Survey, 2014 p.49).
4.3. Financial or Bankruptcy State of the Selected Banks
Table 4. Z-Score of selected case study companies
Year CAL EBG SCB UTB HFC
2008 0.67 1.38 1.43 2.27 2.00
2009 1.46 1.33 0.54 2.18 3.42
2010 0.66 1.93 1.29 1.27 1.53
2011 0.41 0.51 0.82 0.20 1.61
2012 0.74 0.27 0.56 0.73 2.86
2013 1.58 3.32 1.68 1.21 2.54
2014 1.97 3.26 1.14 -1.80 2.49
Source: Computed by researcher from annual reports of the banks
From the table above (Table 4), CAL and SCB recorded an average Z-score of 1.07. This means that,
CAL and SCB according to Altman (2008) are considered to be in the “grey” zone. This zone means that, the
company has the likelihood of moving or falling into the safety zone or distressed zone if management do not
take measures to prevent it.
Furthermore, these two banks had a range within the grey zone in the individual years Z-Score. CAL
began at a distressed position in 2008 and moved out of the distressed zone in 2009 only to return in 2010,
2011 and 2012 and emerged back to the grey zone at a Z-Score of 1.97 in 2014. Likewise, SCB in 2008 was
in the grey zone and in 2009 fell to the distressed zone since its Z-Score was below 1.1.
The bank survived the following year but fell victim to a distressed state in 2011 and 2012 and since
has managed to remain out of the distressed zone. The back recorded a Z-Score of 1.68 and 1.14 in 2013 and
2014, respectively.
ECB had in its later years had a Z-Score of 3.32 and 3.26 in year 2013 and 2014 respectively. This
places the bank in the safe zone. However, on the average of the seven-year period, the bank recorded an
average Z-Score of 1.72. Meaning that, it is in the range of the grey zone. Also, HFC is another bank that saw
its Z-Score in 2009 and 2012 within the safe zone.
The other years within the period all fall within the grey zone. The bank recorded an average Z-Score
of 2.35, the highest average Z-Score recorded within the five banks measured during the period. UTB recorded
an average Z-Score of 0.87 meaning that, UTB falls below 1.1 and therefore is financially distressed according
to Altman’s measure.
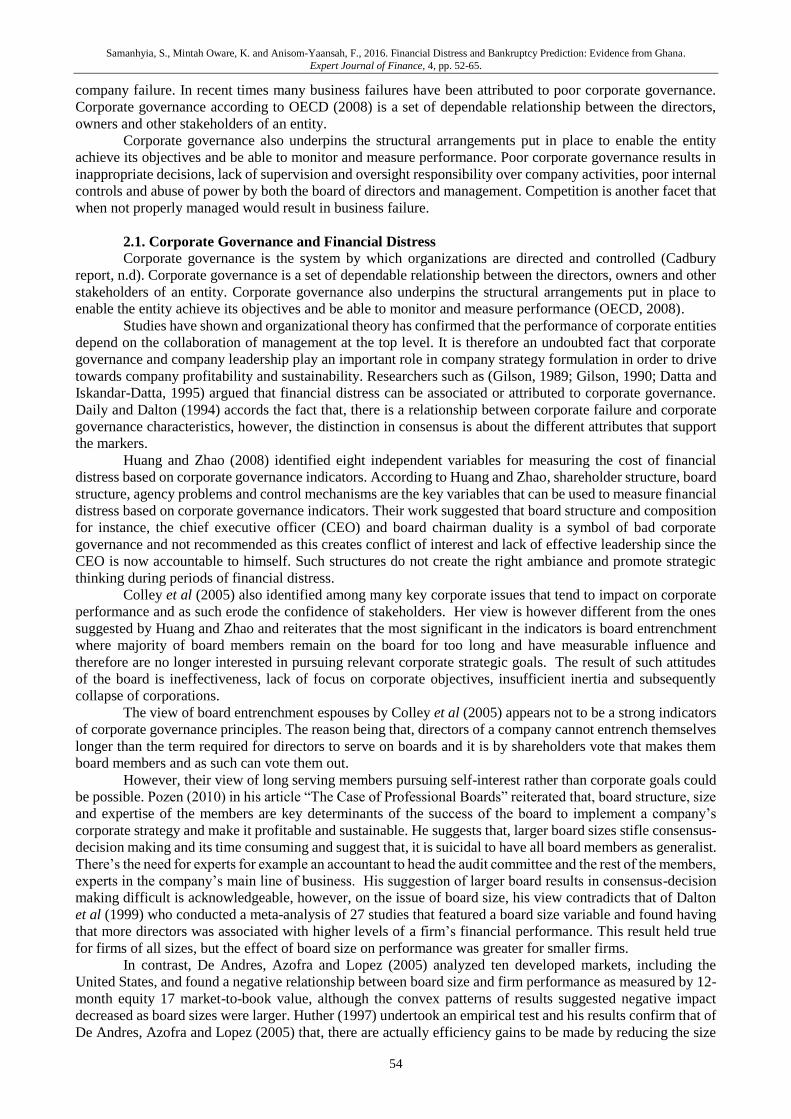
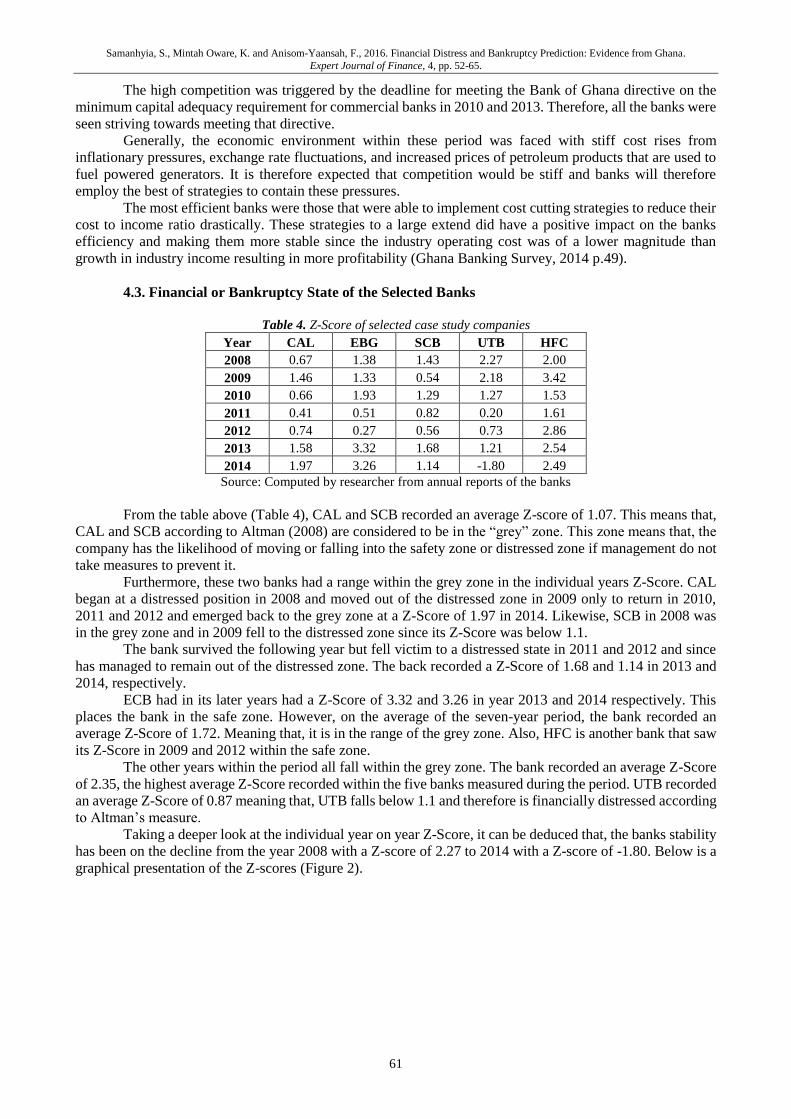
Taking a deeper look at the individual year on year Z-Score, it can be deduced that, the banks stability
has been on the decline from the year 2008 with a Z-score of 2.27 to 2014 with a Z-score of -1.80. Below is a
graphical presentation of the Z-scores (Figure 2).
Samanhyia, S., Mintah Oware, K. and Anisom-Yaansah, F., 2016. Financial Distress and Bankruptcy Prediction: Evidence from Ghana.
Expert Journal of Finance, 4, pp. 52-65.
62
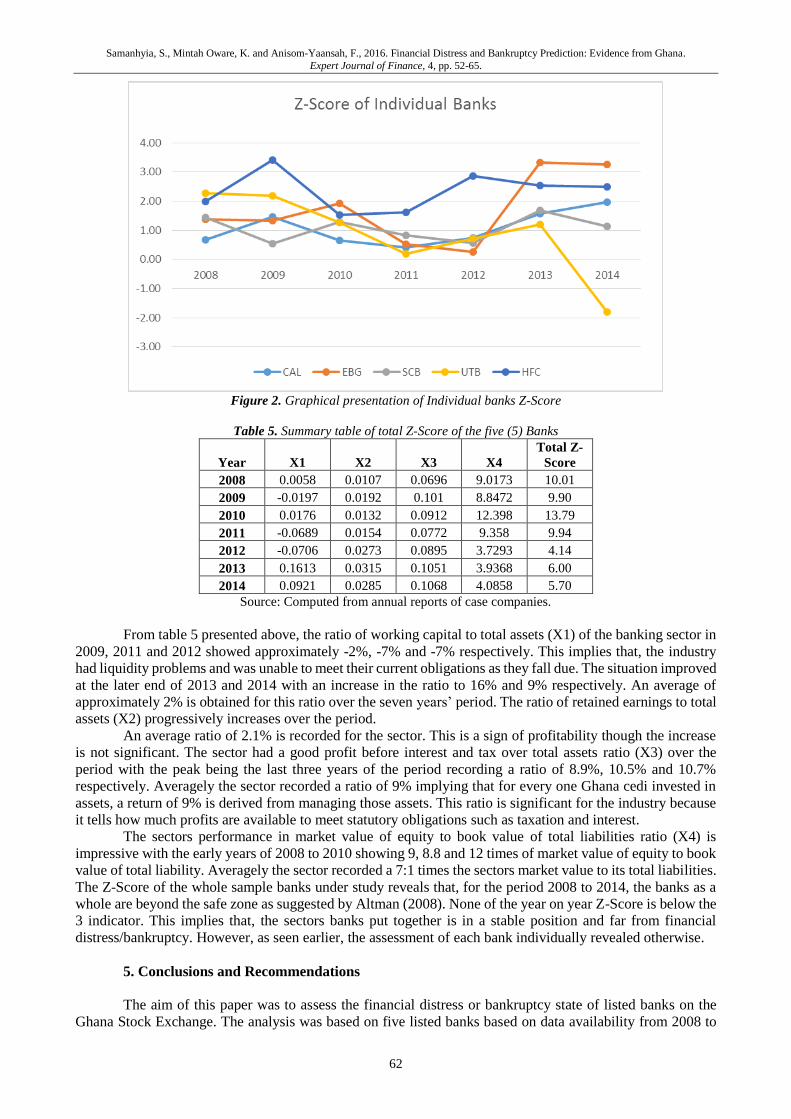
Figure 2. Graphical presentation of Individual banks Z-Score
Table 5. Summary table of total Z-Score of the five (5) Banks
Year X1 X2 X3 X4
Total Z-
Score
2008 0.0058 0.0107 0.0696 9.0173 10.01
2009 -0.0197 0.0192 0.101 8.8472 9.90
2010 0.0176 0.0132 0.0912 12.398 13.79
2011 -0.0689 0.0154 0.0772 9.358 9.94
2012 -0.0706 0.0273 0.0895 3.7293 4.14
2013 0.1613 0.0315 0.1051 3.9368 6.00
2014 0.0921 0.0285 0.1068 4.0858 5.70
Source: Computed from annual reports of case companies.
From table 5 presented above, the ratio of working capital to total assets (X1) of the banking sector in
2009, 2011 and 2012 showed approximately -2%, -7% and -7% respectively. This implies that, the industry
had liquidity problems and was unable to meet their current obligations as they fall due. The situation improved
at the later end of 2013 and 2014 with an increase in the ratio to 16% and 9% respectively. An average of
approximately 2% is obtained for this ratio over the seven years’ period. The ratio of retained earnings to total
assets (X2) progressively increases over the period.
An average ratio of 2.1% is recorded for the sector. This is a sign of profitability though the increase
is not significant. The sector had a good profit before interest and tax over total assets ratio (X3) over the
period with the peak being the last three years of the period recording a ratio of 8.9%, 10.5% and 10.7%
respectively. Averagely the sector recorded a ratio of 9% implying that for every one Ghana cedi invested in
assets, a return of 9% is derived from managing those assets. This ratio is significant for the industry because
it tells how much profits are available to meet statutory obligations such as taxation and interest.
The sectors performance in market value of equity to book value of total liabilities ratio (X4) is
impressive with the early years of 2008 to 2010 showing 9, 8.8 and 12 times of market value of equity to book
value of total liability. Averagely the sector recorded a 7:1 times the sectors market value to its total liabilities.
The Z-Score of the whole sample banks under study reveals that, for the period 2008 to 2014, the banks as a
whole are beyond the safe zone as suggested by Altman (2008). None of the year on year Z-Score is below the
3 indicator. This implies that, the sectors banks put together is in a stable position and far from financial
distress/bankruptcy. However, as seen earlier, the assessment of each bank individually revealed otherwise.
5. Conclusions and Recommendations
The aim of this paper was to assess the financial distress or bankruptcy state of listed banks on the
Ghana Stock Exchange. The analysis was based on five listed banks based on data availability from 2008 to
Samanhyia, S., Mintah Oware, K. and Anisom-Yaansah, F., 2016. Financial Distress and Bankruptcy Prediction: Evidence from Ghana.
Expert Journal of Finance, 4, pp. 52-65.
63
2014. The paper also assessed the effects of competition and corporate governance on financial distress
position of the banks. The measurement of each of the objectives of the study was explicitly defined to suit
each parameter especially the Boone indicator (competition) and the Z-Score (non-manufacturing) companies.
5.1. Conclusions
The study shows that companies that practices good governance principles is seen to be financially
stable and thus distances itself from being financially distressed. Furthermore, found that smaller board size
has negative effect on corporate performance. Thus, a poor corporate governance practice does contribute to
poor financial performance of a company and especially, smaller board size affects corporate performance
negatively.
Again, the study concludes that post 2010 of the banking industry was generally highly competitive.
This pushed inefficient banks to perform poorly and motivated the efficient banks to become more efficient,
controlling and reducing operational cost and increasing operating income and thus becoming more profitable
and stable. The study therefore asserts that competition within the banking industry enables efficient banks to
be more financially stable and less likely to be distressed and thus confirms the Boone indicator theory.
Finally, study was undertaken to measure the distress/bankruptcy state of the selected listed banks and
found out that, individually, four (4) of the selected banks have their average Z-Score between 1.1 to 2.6 and
therefore classified in the grey zone and only one (1) bank has its average Z-score below 1.1 and therefore was
classified as distressed. The four (4) out of the five (5) banks representing 80% of the selected banks are neither
distressed nor classified as safe.
5.2. Policy Recommendations
The boards of the banks should adopt all best and recommended corporate governance standards such
as those suggested by the Organization for Economic Co-operation and Development (OECD) on the
constitution of audit, risk, and compensation committees with more independent non-executive members and
ensure that they are implemented thoroughly. Shareholders should endeavor to advocate for and elect
experienced, well diversified, experts on boards with appropriate sizes (at least 8 to 15 members) to represent
their interest and safe guard their investments
It is also recommended that, management of the various banks should accept competition and see it as
an opportunity rather than a treat to enable them strategies more effectively to become market leaders.
Management should also implement policies that help in ensuring operational cost control and increasing
income. An example, is adopting automation of some manual transactions. This would reduce staff cost and
pension contributions and increase income generation.
The Central bank should ensure that, the banks classified under the grey zone have enough deposit
insurance funds in stock. This would help reduce the impact if any of the banks become financially distressed.
There is also a need for the supervisory bodies to shift focus on liquidity levels of banks. Many banks have
become rapidly distressed for lack of liquidity resulting in limited investment opportunities which ultimately
affected their financial stability. More consciousness on risk management techniques and managerial
competence towards liquidity management need to be considered in further policy development.
References
Addo, F. and Nipah, E., 2006. Corporate failure and bankruptcy in Ghana [online] Available at:
www.pwc.com/gh [Accessed on 26 May, 2015].
Altman, E.I., 2006. Corporate financial distress and bankruptcy: predict and avoid bankruptcy, analyses and
invest in distress debt (3rd Ed). New York: John Wiley and Sons.
Altman, E.I., 1968. Financial Ratios, Discriminant Analysis and the Prediction of Corporate bankruptcy. The
Journal of Finance, 23, pp.589-609.
Appiah, K.O., 2011. Corporate Failure Prediction: Some Empirical Evidence from Listed Firms in Ghana.
China-USA Business Review, 10(1), pp.32-41.
Aziz A. and Dar H., 2006. Predicting Corporate Bankruptcy: Whither do We Stand?. Journal of Corporate
Governance, 6(1), pp.18-33
Beck, T., Demirgüç-Kunt, A. and Levine, R., 2006. Bank concentration, competition, and crises: First results.
Journal of Banking and Finance, 30, pp. 1581-1603.
Berger, A., Klapper, L. and Turk-Ariss, R., 2009. Bank Competition and Financial Stability. Journal of
Financial Services Research, 35, pp.99-118.
Samanhyia, S., Mintah Oware, K. and Anisom-Yaansah, F., 2016. Financial Distress and Bankruptcy Prediction: Evidence from Ghana.
Expert Journal of Finance, 4, pp. 52-65.
64
Besanko, D. and Thakor, A., 1993. Relationship banking, deposit insurance and bank portfolio’, in: Mayer, C.
and Vives, X., eds.), Capital Markets and Financial Intermediation, Cambridge, MA: Cambridge
University Press, pp.292-313.
Boone, J., 2008. A new way to measure competition. The Economic Journal, 118(531), pp.1245-1261.
Boyd, J., De Nicolo, G. and Jalal, A., 2006. Bank Risk-Taking and Competition Revisited: New Theory and
New Evidence. IMF Working Paper WP/06/297.
Caminal, R. and Matutes, C., 2002. Market power and banking failures. International Journal of Industrial
Organization, 20, pp.1341-1361.
Colley, J. Jr., Doyle, J., Stettinius, W. and Logan, G., 2005. What is corporate governance. New York:
McGraw-Hill Executive.
Conyon, M.J. and Peck, S. I., 1998. Board size and corporate performance: Evidence from European countries.
The European Journal of Finance, 4, pp.291-304.
Daily, C.M. and Dalton, D.R., 1994. Bankruptcy and Corporate Governance: The impact of board composition
and structure. Academy of Management Journal, 37(6), pp.1603-1617.
Dalton, D., Daily, C., Johnson, J. and Ellstrand, A., 1999. Number of directors and financial performance: A
meta-analysis. Academy of Management Journal, 42, pp.674-686.
Datta, S. and Iskandar-Datta, M.E., 1995. Reorganization and financial distress: An empirical examination.
The Journal of Financial Research, 37(2), pp.15-32.
De Andres, P., Azofra, V. and Lopez, F., 2005. Corporate Boards in OECD Countries: Size, Composition,
Functioning and Effectiveness. Corporate Governance: An International Review, 13(2), pp.197-210.
Eisenberg, T., Sundgren, S. and Wells, M. T., 1998. Larger board size and decreasing firm value in small firms.
Journal of Financial Economics, 48, pp.35-54.
Federal Deposit Insurance Corporation, 2015. US Failed and Acquired banks since 2000 [online] Available at:
www.fdic.gov/bank/individual/failed/banklist.html [Accessed on 26 May, 2015].
Fungacova, Z. and Weill, L., 2013. Does competition influence bank failures: Evidence from Russia?.
Economic Transition, 21(2), pp.201-322.
Gerantonis, N., Vergos, K. And Christopoulos, A. G., 2009. Can Altman Z-score Predict Business Failures in
Greece?. Research Journal of International Studies, 12, pp.21-28.
Gilson, S.C., 1990. Bankruptcy, boards, banks and block holders. Journal of Financial Economics, 27(2),
pp.355-388.
Gombola, M.J. and Ketz, J.E., 1983. A note on cash flow and classification patterns of financial ratios. Journal
of Accounting Review, 58(1), pp.105-114.
Huang H., and Zhao, J.J., 2008. Relationship between Corporate Governance and Financial Distress: An
Empirical Study of Distressed Companies in China. International Journal of Management, 25(3),
pp.654-665.
Huther, J., 1997. An empirical test of the effect of board size on firm efficiency. Journal of Economic Letters,
54(3), pp.259-264.
Jeffry, R.H., 2005. Assessing how bankruptcy prediction models are evaluated. Journal of Business and
Economic Research, 3(1), pp.87-92.
Jimenez, G, and Saurina, J., 2006. Credit Cycles, Credit Risk, and Prudential Regulation. International Journal
of Central Banking 2(2), pp.65-98.
Klapper, L., and Inessa Love, (2002. Corporate Governance, Investor Protection and Performance in
Emerging Markets. Policy Research Working Paper no. 2818. World Bank, Washington, DC.
Kpodoh, B., 2009. Bankruptcy and Financial Distress Prediction in the Mobile Telecom Industry: The Case
MTN-Ghana, Millicom-Ghana and Ghana Telecom. School of Management, Blekinge Institute of
Technology.
Lorsch, J. W., 1996. Empowering the board. Harvard Business Review, 73(1), pp.107-118.
Lorsch, J.W., 2000. Harvard Business Review on Corporate Governance. Cambridge, MA, USA: Harvard
Business School Press.
Mugenda, O.M. and Mugenda, A.G., 2003. Research methods: Quantitative and qualitative Approaches.
Nairobi: African Centre for Technology Studies.
Outecheva, N., 2007. Corporate Financial Distress: An Empirical Analysis of Distress Risk. University of St.
Gallen Graduate School of Business Administration, Economics, Law and Social Science.
Pozen, R.C., 2010. The Big Idea: The Case for Professional Boards. Harvard Business Review, December
2010 Issue (Sunday December, 5, 2010) [online] Available at: https://hbr.org/2010/12/the-big-idea-
the-case-for-professional-boards [Accessed on 25 July, 2015].
Samanhyia, S., Mintah Oware, K. and Anisom-Yaansah, F., 2016. Financial Distress and Bankruptcy Prediction: Evidence from Ghana.
Expert Journal of Finance, 4, pp. 52-65.
65
San-Woo, N. and Il Chong, N., 2004. Corporate Governance in Asia: Recent Evidence from Indonesia,
Republic of Korea, Malaysia, and Thailand. Tokyo: Asian Development Bank Institute.
Schaeck, K., Cihak, M. and Wolfe, S., 2009. Are more competitive banking systems more stable?. Journal of
Money, Credit and Banking, 41, pp.711-734.
The Organization for Economic Co-operation and Development, 2008. Using the OECD Principles of
Corporate Governance: A Boardroom Perspective [online] Available at:
www.oecd.org/corporate/ca/corporategovernanceprinciples/40823806.pdf [Accessed on 26 May,
2015].
Titshabona, N., 2014. Predicting Corporate Failure: Insights from the financial sector in Zimbabwe.
International Journal of Economics, Commerce and Management, 11(II) [online] Available at:
http://ijecm.co.uk/wp-content/uploads/2014/11/21130.pdf [Accessed on 26 May, 2015].
Turk-Ariss, R., 2010. On the implications of market power in banking: Evidence from developing countries.
Journal of Banking and Finance, 34(4), pp.765-775.
Wang, Y. and Campbell, M., 2010. Business Failure Prediction for Publicly Listed Companies in China.
Journal of Business and Management, 16, pp.75-88.
Whitaker, R.B., 1999. The early stages of financial distress. Journal of Financial Economics, 23(2), pp.122-
133.
Yermack, D., 1996. Higher market valuation of companies with a small board of directors. Journal of Financial
Economics, 40, pp.185-221.
Yim, J. and Mitchel, H. 2005. A comparison of corporate distress prediction models in Brazil. Nova
Economia_Belo Horizonte, 15(1), pp.73-93.