finance and economics discussion series divisions … · finance and economics discussion series...
TRANSCRIPT
Finance and Economics Discussion SeriesDivisions of Research & Statistics and Monetary Affairs
Federal Reserve Board, Washington, D.C.
The currency dimension of the bank lending channel ininternational monetary transmission
Elod Takats and Judit Temesvary
2017-001
Please cite this paper as:Takats, Elod, and Judit Temesvary (2017). “The currency dimension of the bank lend-ing channel in international monetary transmission,” Finance and Economics Discus-sion Series 2017-001. Washington: Board of Governors of the Federal Reserve System,https://doi.org/10.17016/FEDS.2017.001.
NOTE: Staff working papers in the Finance and Economics Discussion Series (FEDS) are preliminarymaterials circulated to stimulate discussion and critical comment. The analysis and conclusions set forthare those of the authors and do not indicate concurrence by other members of the research staff or theBoard of Governors. References in publications to the Finance and Economics Discussion Series (other thanacknowledgement) should be cleared with the author(s) to protect the tentative character of these papers.

1
The currency dimension of the bank lending channel in
international monetary transmission*
Előd Takáts1
Bank for International Settlements
Judit Temesvary2
Federal Reserve Board
December 2016
Abstract: We investigate how the use of a currency transmits monetary policy shocks in the global
banking system. We use newly available unique data on the bilateral cross-border lending flows
of 27 BIS-reporting lending banking systems to over 50 borrowing countries, broken down by
currency denomination (USD, EUR and JPY). We have three main findings. First, monetary shocks
in a currency significantly affect cross-border lending flows in that currency, even when neither
the lending banking system nor the borrowing country uses that currency as their own. Second,
this transmission works mainly through lending to non-banks. Third, this currency dimension of
the bank lending channel works similarly across the three currencies suggesting that the cross-
border bank lending channel of liquidity shock transmission may not be unique to lending in USD.
Keywords: Cross-border bank lending, bank lending channel, monetary transmission, currency
denomination
JEL codes: classification: E5; F42; G21
* Acknowledgements: We would like to thank the Bank for International Settlements for providing the data
and financial resources for the completion of this project. We thank Stefan Avdjiev, Stijn Claessens, Dietrich
Domanski, Ingo Fender, Steven Ongena, Rebecca Zarutskie and seminar participants at the Bank for
International Settlements for valuable comments. All remaining errors are our own. The views expressed in
this paper are solely those of the authors and shall not be interpreted as reflecting the views of the Board of
Governors of the Federal Reserve System or the views of the Bank for International Settlements. 1 Bank for International Settlements, Centralbahnplatz 2, Basel, CH-4002 Switzerland. [email protected] 2 This project began while Judit Temesvary was an assistant professor at Hamilton College. Current affiliation:
Federal Reserve Board, 1801 K Street, Washington, DC 20006, USA. [email protected]

2
1. Introduction
Major advanced economies, such as the United States, the Euro Area and Japan have engaged in
extraordinary unconventional monetary policies after the global financial crisis. Evidence is
accumulating that these monetary policies indeed affect broad monetary and credit conditions
elsewhere (Cetorelli and Goldberg, 2012; Ongena et al, 2015, Miranda-Agrippino and Rey, 2015;
Forbes and Warnock, 2012), and that cross-border bank lending is a major channel of such
transmission (Temesvary et al, 2016; Rey, 2015; Bruno and Shin, 2015a, 2015b; Alper et al, 2016).
The concentrated currency exposure adds another, little investigated dimension to the analysis of
these cross-border transmission effects. The three major currencies, the US dollar (USD), the euro
(EUR) and the Japanese yen (JPY), dominate cross-border bank lending globally with shares
around 47 percent, 32 percent and 5 percent of the total volumes at end-2014 (Avdjiev and Takats,
2016). This raises several questions: How does monetary policy in the United States, the euro area
and Japan affect cross-border bank lending denominated in USD, EUR and JPY around the world?
Which target sectors’ borrowing is most affected by the monetary shocks? And, is the strength of
monetary transmission different across these three major currencies?
We answer these questions by using a new unique dataset on the bilateral cross-border lending
flows of 27 BIS-reporting banking systems to over 50 borrowing countries, broken down by
currency denomination (USD, EUR and JPY) and target sector (banks and non-banks). As Avdjiev
and Takats (2016) discuss, this dataset is the first to offer information simultaneously on three key
dimensions: (1) the currency composition of the claims, (2) the location, or residence, of the
borrower and (3) the nationality of the lending banking system. The dataset is available from Q2
2012 to Q4 2015. Given that in this period most advanced economies relied on unconventional
policies with policy interest rates hovering around zero, we use the shadow interest rates from
Krippner (2016) to measure monetary conditions.
We focus on a cross-border version of the “traditional” bank lending channel transmission
mechanism. Monetary policy shocks induced by the issuing country of a given currency affect the
amount of funding that is available to foreign banking systems in that currency.3 These funding
shocks will then impact the lending of these foreign banking systems to other countries. A
challenge is to disentangle the supply (funding) side lending effects of currency-specific monetary
shocks from their indirect impact on credit demand by borrowers around the world. In our
identification strategy, we isolate the monetary effects on the supply (funding) side by comparing
the differential lending responses of banking systems with various levels of short-term
international liquidity to changes in monetary policy (Kashyap and Stein, 2000; Jimenez et al, 2012;
Cetorelli and Goldberg, 2012). In order to control for unobservable credit demand shocks, we
saturate the model with fixed effects (Jimenez et al, 2014; Ongena et al, 2015). The results of our
instrumental variables regressions are robust to alternative specifications, including weighted
estimations.
We obtain three main results. First, we find that monetary shocks in a currency significantly affect
cross-border lending flows in that currency, across all lending and borrowing countries. For
instance, easing monetary conditions in the US, as measured by a lower short-term shadow US
3 For instance, monetary shocks induced by the issuing country of a currency impact the amount of that currency available to foreign banks through central bank liquidity swaps. Large-scale corporate deposits and FX swap markets are further examples of channels through which monetary shocks can affect banks in foreign countries.

3
interest rate, increase cross-border bank lending denominated in US dollars. The effect holds even
when the United States is neither the lending banking system nor the borrowing country. As an
example, US monetary policy significantly affects US dollar-denominated bank lending from the
UK banking system to Malaysia. We call this the currency dimension of the bank lending channel
in international monetary transmission.
Second, we find that this currency dimension of the bank lending channel works primarily through
cross-border lending to non-banks, while we do not find significant transmission into cross-
border lending flows to banks.4 This finding lends our results additional policy relevance, as credit
to the non-financial sector is important for real economic growth (Kashyap and Stein (2000) and
Peek and Rosengren (2000)).
Third, we find that this currency dimension of the bank lending channel works similarly across the
three major currencies. We do not find detectable differences in the lending responses of banking
systems to USD, EUR and JPY monetary shocks. This would suggest that the working of the USD
network in this transmission might not differ substantially from the working of other major
currencies.
The results are relevant for thinking about the international transmission of monetary policy
shocks. They suggest that policymakers should pay attention not only to the source of cross-
border bank lending but also to its currency denomination when analyzing the impact of cross-
border monetary and liquidity spillovers. For instance cross-border bank lending denominated in
euros and dollars will behave differently if the underlying monetary policies in the US and the
euro area diverge, even if these loans are targeted at the same borrowing country and originate
from the same lending banking system. These differences are likely to get more pronounced as
monetary policies have started to diverge since the taper tantrum: the Federal Reserve has already
raised interest rates while the European Central Bank and the Bank of Japan continue to explore
negative interest rates. Hence, understanding the workings of the currency dimension of the bank
lending channel that we identify in this paper is becoming increasingly more relevant.
The rest of the paper is organized as follows. The second section discusses the relevant literature.
The third section describes our data. The fourth section introduces the estimation methodology
and the fifth section presents the results. The final section concludes with policy implications.
2. Related Literature
Our work is related to the literature on drivers of cross-border bank lending, especially recent
work which focuses on the newly available currency dimension and the (absence of) the triple
coincidence in international finance.
Our paper adds to the strand of literature that examines the drivers of cross-border lending during
and after the financial crisis (for instance, De Haas and Van Lelyveld (2011), Rose and Wieladek
(2011), Cetorelli and Goldberg (2012a), Giannetti and Laeven (2012), De Haas and Van Horen
(2012), Buch et al. (2014), Cerutti et al (2014), Cerutti et al (2015)). In this context, Cetorelli and
4 The counterparty sector “banks” includes “[f]inancial institutions whose business it is to receive deposits or close substitutes for deposits and to grant credits or invest in securities on their own account…“banks” excludes central banks and multilateral development banks…[m]oney market funds, investment funds and pension funds…” (BIS Banking Statistics Glossary).

4
Goldberg (2012) and Temesvary et al (2016) find that US monetary policy has a significant effect
on US banks’ cross-border lending abroad before the crisis.
Closest to our work are the papers which investigate how monetary policy in a given currency
transcends national borders. Ongena et al (2016) uses variation across currencies to identify the
bank lending channel of monetary policy in foreign currency lending in Hungary. Alper et al (2016)
document significant cross-border lending effects of crisis-induced unconventional US monetary
policy in the lending of international banks to Turkey. Avdjiev and Takats (2016) show that
exposure to the USD had significantly reduced cross-border bank lending during the taper
tantrum and Avdjiev, Subelyte and Takats (2016) show similarly that exposure to the EUR during
the European Central Bank’s Quantitative Easing significantly increased cross-border bank
lending. This latter result strongly suggests that currency denomination can affect international
spillovers more systematically.
Finally, our empirical work builds on the insight that national borders and economically relevant
decision-making units often diverge. Fender and McGuire (2010) and Cecchetti et al (2010) have
shown that the lending bank’s nationality tends to be more relevant than its residence in
identifying the decision-making unit. This insight and its policy implications were developed
further in CGFS (2011). Building on these findings Avdjiev, McCauley and Shin (2015) coined the
term of the (absence of) triple coincidence in international finance. This term refers to the
phenomenon that national borders, the conventional units of international economic analysis,
often do not coincide with the economically relevant decision-making unit. Following these
lessons, we focus on “lending banking systems” as opposed to “lending countries”, so that we can
follow the decision-making unit as precisely as possible.
3. Data
In order to answer our research question precisely, we need three data dimensions: (A) the
currency composition of cross-border claims; (B) the residence of the borrower and (C) the
nationality of the lending banking system (see CGFS (2012) for further details and Avdjiev and
Takats (2016) for a more detailed discussion).
The first dimension, currency composition (A) enables us to map the relevant currency networks
and flows in each selected currencies, that is, to map bilateral claims in USD, EUR, and JPY and
their evolution over time, purged of valuation effects.
Dimension (B), the lender’s nationality identifies the home country of the highest-level banking
entity in the corporate chain, of the lending banking systems. As Fender and McGuire (2010) and
Cecchetti et al (2010) have shown, nationality tends to be much more relevant than residence for
identifying the decision-making unit when thinking about credit supply. This is because nationality
better captures the factors that influence a bank’s lending decisions, such as the performance or
equity constraints of the bank as a whole.
Furthermore, using nationality as opposed to residence is also necessary due to the presence of
financial centers. To see this, consider a German bank that lends to a borrower in Malaysia via its
London branch in the United Kingdom. The nationality-based data establishes a link between the
German banking system (as the lender) and Malaysia (as the borrowing country). The alternative
residence-based data would identify two cross-border bank lending links: one from Germany to
the UK and another between the UK and Malaysia. This classification would mistakenly identify

5
two economic relationships: one with the UK as the borrowing economy and another with the UK
banking system as the lender – whereas the loan is just intermediated through the UK and not
materially linked to local conditions there.
Dimension (C), the residence of the borrower, allows us to account for the country-specific
borrowing drivers of cross-border bank lending, such as credit demand.
The recently implemented Enhancements to the BIS International Banking Statistics (IBS) provides
the three necessary dimensions. This is a newly available unique dataset on the bilateral cross-
border exposures of 27 BIS-reporting countries to 51 borrowing countries over the Q2 2012 – Q4
2015 period, broken down by currency denomination (USD, EUR and JPY) and target sector (banks
and non-banks). The data described below are summarized in Table 1. 5
3.1 Data on Bank Claims and Flows
We focus on cross-border bank claims in three currencies: the US dollar (USD), the euro (EUR) and
the Japanese yen (JPY). These three reserve currencies dominate cross-border bank lending
globally with shares of around 47 percent, 32 percent and 5 percent of the total volumes at end-
2014, respectively.6 We measure bilateral cross-border bank flows from source banking system i
to target country j as the quarterly percent change in bilateral cross-border bank claims. The
median total bilateral cross-border claims (median across the three currencies, summed across
sectors) amount to 543 million USD, corresponding to median quarterly flows of -0.59 percent.
We see some variation in the magnitudes of total bilateral cross-border claims and flows across
currencies (Table 1). The median US dollar-denominated total cross-border claims (summed
across sectors) is 628 million US dollars (median quarterly flows of -0.01 percent). Converted to
US dollars, the median euro-denominated bilateral cross-border claims amount to 694 million US
dollars (median quarterly flows of -0.22 percent). The median yen-denominated total cross-border
claims are substantially smaller, amounting to only 162 million US dollars (median quarterly flows
of -0.62 percent).7
Looking by target sector, the median bilateral cross-border claims on recipient countries’ banking
sectors (median across currencies) amount to 517 million US dollars, while the median volume of
claims is lower on the non-bank sector at 350 million US dollars. Looking at flows rather than
5 The 27 lending banking systems are Austria; Australia; Belgium; Brazil; Canada; Chinese Taipei; Denmark;
Finland; France; Germany; Greece; India; Ireland; Italy; Japan; Korea; Luxembourg; Mexico; the Netherlands;
Norway; Portugal; Spain; Sweden; Switzerland; Turkey; United Kingdom; United States. The 51 borrowing
countries are Angola; Austria; Australia; Belgium; Brazil; Bulgaria; Canada; Chile; China; Chinese Taipei;
Croatia; Cyprus; Czech Republic; Denmark; Finland; France; Germany; Greece; Hungary; Ireland; Israel; Italy;
Japan; Korea; Liberia; Lithuania; Luxembourg; Malta; Marshall Island; Mexico; Morocco; the Netherlands; New
Zealand; Nigeria; Norway; Poland; Portugal; Romania; Russia; Slovakia; Slovenia; South Africa; Spain; Sweden;
Switzerland; Turkey; Ukraine; United Kingdom; United States; Vietnam. 6 The fourth largest currency network, the British Pound (GBP), constitutes less than 5 percent of total cross-
border bank claims. 7 Converted to US dollars, the mean total bilateral cross-border claims (average across the three currencies,
summed across sectors) amount to 21,874 million USD, corresponding to mean quarterly flows of 0.61
percent. By currency, the mean US dollar-denominated total cross-border claims (summed across sectors) is
12,368 million US dollars (mean quarterly flows of 0.91 percent). Converted to US dollars, the average euro-
denominated bilateral cross-border claims amount to 37,217 million US dollars (mean quarterly flows of 0.68
percent). The mean yen-denominated total cross-border claims are substantially smaller, amounting to only
2,964 million US dollars (average quarterly flows of -0.51 percent).

6
claims, bilateral cross-border flows are similar across the two sectors, with averages of 0.25
percent quarterly increase in flows to banks and 0.58 percent increase in flows to non-banks. The
median flows show a 0.19 percent quarterly decline in lending to both sectors.8
The breakdown by major lenders and borrowers shows that a few countries dominate the currency
networks (Table A1, upper panels). Among USD lenders (left panel) Japanese, US and UK banks
dominate. French and German banks are the top EUR lenders (center panel). On a much smaller
scale, Japanese banks dominate among JPY lenders (right panel). Looking at borrowers shows a
similar picture (Table A1, lower panels). The largest borrower in USD is the United States, and the
largest JPY borrower is Japan. Reflecting its role as a financial center UK is the largest cross-border
borrower in euros and the second largest in USD and JPY as well.
3.2 Data on Banking Sector Controls
Our main banking sector characteristic of interest is a banking system’s International Liquidity
Ratio, defined as the ratio of country j’s banks’ short-term international claims (with remaining
maturity less than one year) to their total international claims. International claims denote cross-
border claims and local claims denominated in foreign currency. We collect the data from the BIS
IBS consolidated banking statistics on intermediate counterparty basis. This measure is our proxy
for a banking system’s ability to replace and fund shortfalls in cross-border or FX claims emanating
from monetary shocks to their balance sheets. In other words, this short-term international
liquidity ratio measures a banking system’s ability to buffer international liquidity shortfalls by
reallocating short-term international claims within the banking system. Furthermore, this variable
also proxies for the extent to which a banking system has built-up channels to replace monetary
shock-induced international claim shortfalls. The average source banking system in our sample
has a short-term international liquidity ratio of around 48 percent.
In our differential estimation strategy, an important consideration is to the extent to which the
International Liquidity Ratio may be endogenous. While several features of our analysis help to
alleviate concerns about the confounding effects that the potential endogeneity of this measure
may have, we employ Instrumental Variable specifications in all our regressions as we detail later
in our methodology description.
While our estimation strategy ensures the identification of credit supply-side shocks, we take
additional steps to control for (potentially unobservable) features of and shocks to the credit
demand of target countries. We do so by including target country*time fixed effects in almost all
our specifications, which fully control for time-varying unobservable credit demand-side
conditions. In a few (less saturated) specifications, we include source banking system, target
country or time fixed effects.
3.3 Data on Macro Controls
We collect data on macro controls from the Economist Intelligence Unit (EIU)’s Country Data-
base. Our macro controls include the quarterly change in the exchange rate between the currencies
of the source banking system’s country and the target country, in order to account for potential
8 In terms of averages, the mean bilateral cross-border claims on recipient countries’ banking sectors
(average across currencies) amount to 11,807 million US dollars, while the mean volume of claims is on the
non-bank sector is 14,527 million US dollars.

7
valuation effects in the bilateral bank flows. The median and mean quarterly changes in the
exchange rate between country pairs are zero and 0.5 percent, respectively. Based on Kashyap
and Stein (2000) and Cetorelli and Goldberg (2012), we also include the real GDP growth rate of
the country of the source banking system as a control variable. The median and mean real GDP
growth rate in our sample of these source countries are both 1.5 percent. In some specifications,
we also control for the monetary policy shocks (measured as quarterly percentage point changes
in the short-term interest rate) associated with the source banking system’s currency.
Our main macroeconomic variable of interest is our measure of monetary policy shocks affecting
the three reserve currencies of lending. We define the monetary shock as the quarterly change
(from t-1 to t, in percentage points) in the short-term shadow interest rate that corresponds to
the monetary conditions determined by the central bank that issues currency c. We use this
measure as our sample spans the 2012-2015 period, which covers the aftermath of “conventional”
expansionary monetary policy actions by the Federal Reserve, the European Central Bank and the
Bank of Japan.9 As a result of these steps, the short-term policy target interest rates set by these
three central banks hit the zero lower bound in early 2009, rendering further “conventional”
monetary policy easing infeasible from then on (Figure 1).
In order to get a measure of monetary policy stance and liquidity shocks in the post-2009 period,
we use the currency-specific short-term shadow interest rates (as described in Krippner (2013,
2015 and 2016)) as our measures of monetary conditions for the United States, the Eurozone and
Japan (Figure 2).10 By construction, these short-term shadow interest rates are not subject to the
zero bound, and are therefore able to capture expansionary monetary policy actions by dipping
into the negative range. As expected, all three shadow rates fall below zero when monetary
conditions continue to ease and the nominal policy interest rates in Figure 1 hit the zero lower
bound. The US and Japanese short-term shadow rates continued their steep decline through
March 2013, dropping as low as -5 to -6 percent. The Eurozone shadow interest rate displayed a
more gradual decline. After the first quarter of 2013, the US short-term shadow interest rate
started to rise corresponding to the Federal Reserve’s monetary tightening, while the Eurozone
shadow rate continued to decline and approached the Japanese shadow rate at -5 to -6 percent.
Data on these shadow interest rates are compiled, described and provided by Krippner (2013,
2015, 2016).
9 We refer to expansionary monetary policy through open market operations as “conventional” policy. 10 Regarding the short-term shadow interest rate, Krippner (2016) describes: “The SSR is the shortest maturity
rate from the estimated shadow yield curve. It is essentially equal to the policy interest rate in non-
LB/conventional monetary policy environments (e.g. August 2008), but the SSR can freely evolve to negative
values in LB/unconventional environments (e.g. July 2011) to indicate an overall stance of policy that is more
accommodative than a near-zero policy rate alone. In particular, the SSR reflects the effects that
unconventional policy actions (such as quantitative easing and forward guidance) have on longer-maturity
interest rate securities, because it is estimated from yield curve data. SSRs have therefore become a popular
and intuitive indicator of the stance of monetary policy across conventional and unconventional environments
(emphasis added).” (page 4). Furthermore, Krippner describes: “…an in-principle issue with SSRs is that
negative values do not represent interest rates at which economic agents can transact. Therefore, the levels
and changes in SSRs when they are negative should not necessarily be expected to influence the economy
in the same way as policy rate levels and changes in conventional policy periods…… However, the results for
the United States in Krippner (2015) indicate that SSR estimates from K-ANSM(2) models do provide useful
quantitative indicators of unconventional monetary policy, and hence I think it is useful to retain them in the
suite of unconventional monetary policy indicators. (emphasis added)” (page 4).
8
4. Estimation methodology
Let 𝑌𝑗,𝑡𝑖,𝑐
denote the stock of claims held by the source banking system j’s in (target) country i at
time t, denominated in currency c (where c is one of USD, EUR or JPY). Then 𝛥 ln(𝑌)𝑗,𝑡𝑖,𝑐
denotes the
quarterly bilateral bank flows between the source banking system and target country, from time
t-1 to time t, defined as the difference in the natural logarithm of claims between a given quarter
and the previous one.
Our basic econometric formulation takes the following form:
(1) 𝛥 ln(𝑌)𝑗,𝑡𝑖,𝑐 =
= 𝛼 + ∑𝑘=14 𝛽𝑘𝑀𝑃𝑡−𝑘
𝑐 + ∑𝑘=14 𝛾𝑘𝑀𝑃𝑡−𝑘
𝑐 × 𝐿𝑗,𝑡−𝑘 + ∑𝑘=14 𝛿𝑘𝐿𝑗,𝑡−𝑘 + ∑𝑘=1
4 휁𝑘 (𝑆𝑜𝑢𝑟𝑐𝑒
𝐶𝑜𝑛𝑡𝑟𝑜𝑙𝑠)
𝑗,𝑡−𝑘
+ ∑𝑘=14 휂𝑘 (
𝑇𝑎𝑟𝑔𝑒𝑡 𝐶𝑜𝑛𝑡𝑟𝑜𝑙𝑠
)𝑡−𝑘
𝑖
+ 휀𝑗,𝑡𝑖,𝑐
In Equation (1), 𝛥 ln(𝑌)𝑗,𝑡𝑖,𝑐
denotes quarterly bilateral cross-border bank flows, as described above.
We include four lags of the following explanatory variables. The monetary shock 𝑀𝑃𝑡𝑐 is defined
as the quarterly change (from t-1 to t) in the short-term shadow interest rate corresponding to
the monetary conditions set by the central bank that issues currency c.11 Furthermore, 𝐿𝑗,𝑡 denotes
country j’s banking system’s International liquidity ratio, which we define as the ratio of country
j’s banks’ short-term FX claims to their total FX claims. The sets of Source and Target Controls
contain macroeconomic characteristics of source banking system j and target country i. We add
target country*time fixed effects in some specifications, in order to capture any unobservable
time-varying shocks (macro, regulatory, and so on) at the target country level. In the set of Source
Controls, we include the annualized quarterly GDP growth rate, the quarterly change in the short-
term policy interest rate, and the annualized quarterly change in the exchange rate between the
country of the source banking system and the target country. These sets of source and target
variables account for “outside” factors that may impact the country-level supply and demand of
credit, respectively.
As there is a valid concern that the International Liquidity Ratio may be endogenous, we employ
Instrumental Variable specifications in all our regressions. Several features of our analysis help to
alleviate concerns about the confounding effects that the potential endogeneity of this measure
may have.12 Nonetheless, in all our specifications we instrument the short-term International
11 This refers to the Federal Reserve Bank in the case of the US dollar, the European Central Bank in the case
of the Euro, and the Bank of Japan in the case of the Yen. 12 First, our identification strategy is to compare the differential impact of monetary shocks on cross-border
bank lending originating from banking systems of various international liquidity levels. Therefore, any level
effect that a liquidity shock in the Eurozone, for instance, might have on foreign banking systems’
international liquidity ratios does not jeopardize our identification strategy as long as this level effect is the
same across all foreign banking systems. In this case, the difference in lending response across any two
banking systems will not be affected, even if both banking systems’ funding ratios change by the same
amount. Second, we include four lagged values of the international liquidity measure.

9
Liquidity Ratio using source banking system j’s banks’ Short-to-long-term international liquidity
Ratio (defined as short-term international claims over long-term international claims).13
We expect that monetary tightening by the central bank that issues currency c reduces all lending
flows in currency c. Therefore, we expect to find that the cumulative effects of monetary policy
shocks on bilateral cross-border lending from that country are negative: ∑𝑘=14 𝛽𝑘 < 0. Our
identification strategy is based on Kashyap and Stein (2000) and Cetorelli and Goldberg (2012).
Accordingly, we identify the bank lending channel of monetary policy from the differential
response of the lending of source banking systems with less vs. more international liquidity to
monetary policy shocks. The idea is that banking systems with less short-term international
liquidity may find it more difficult to maintain previous levels of lending flows after a monetary
tightening-induced liquidity shortage, as they have less buffer than banking systems with more
international liquidity. Therefore, we expect to find that banking systems with less international
liquidity reduce their currency c-denominated lending flows more in response to monetary
tightening in currency c than banking systems with abundant international claims.14 If this is the
case, the cumulative sum of coefficients on the interaction of the international liquidity ratio with
interest rate shocks is positive: ∑𝑘=14 𝛾𝑘 > 0.
Next, we examine the extent to which the strength of the transmission of monetary shocks may
vary across different banking systems and countries. We examine monetary transmission by
adding country/banking system specific dummies as shown in the following specification.
(2) 𝛥 ln(𝑌)𝑗,𝑡𝑖,𝑐 =
= 𝜑 + ∑𝑘=14 ϐ𝑘𝐿𝑗,𝑡−𝑘 + ∑𝑘=1
4 ϙ𝑘𝑀𝑃𝑡−𝑘𝑐 + 𝜌Ϝ𝑗,𝑡
𝑖,𝑐 + ∑𝑘=14 𝜎𝑘𝑀𝑃𝑡−𝑘
𝑐 × Ϝ𝑗,𝑡𝑖,𝑐 + ∑𝑘=1
4 ϊ𝑘𝑀𝑃𝑡−𝑘𝑐 × 𝐿𝑗,𝑡−𝑘
+ ∑𝑘=14 Ϥ𝑘 𝐿𝑗,𝑡−𝑘 × Ϝ𝑗,𝑡
𝑖,𝑐 + ∑𝑘=14 𝜗𝑘𝑀𝑃𝑡−𝑘
𝑐 × 𝐿𝑗,𝑡−𝑘 × Ϝ𝑗,𝑡𝑖,𝑐
+ ∑𝑘=14 𝜛𝑘 (
𝑆𝑜𝑢𝑟𝑐𝑒 𝐶𝑜𝑛𝑡𝑟𝑜𝑙𝑠
)𝑗,𝑡−𝑘
+ ∑𝑘=14 ϝ𝑘 (
𝑇𝑎𝑟𝑔𝑒𝑡 𝐶𝑜𝑛𝑡𝑟𝑜𝑙𝑠
)𝑡−𝑘
𝑖
+ 𝜇𝑗,𝑡𝑖,𝑐
In addition to the terms presented in Equation 1, Equation 2 also contains the interaction of the
monetary shock 𝑀𝑃𝑡𝑐 with the dummy variable Ϝ𝑗,𝑡
𝑖,𝑐 , as well as the triple interaction of this dummy
variable with the monetary shock 𝑀𝑃𝑡𝑐 and international liquidity ratio 𝐿𝑗,𝑡 .
15
Depending on the specification, the dummy variable Ϝ𝑗,𝑡𝑖,𝑐
captures two types of monetary
transmission sensitivities. First, we analyze if the transmission of monetary shocks depends on
whether the bank flows under study are “return flows”, that is, if the country of the source banking
system and the target country is the same. This allows for the possibility, for instance, that US
13 This Short-to-long-term International Liquidity Ratio is a valid instrument in that it is highly and significantly
correlated with the short-term international liquidity ratio (correlation coefficient of over 0.90, significant at
the 1% level), but uncorrelated with changes in the short-term shadow interest rates (our measures of
monetary shocks, correlation coefficient of 0.02, insignificant) associated with the three reserve currencies. 14 As discussed in Section 3 above, we consider our international liquidity measure to be representative of
the extent to which a banking system is able to fund/replace FX losses, as it proxies for a banking system’s
current access to international liquidity from its balance sheet or built-up channels (such as FX swap
contracts, and so on). 15 Also included in the estimations, but not reported in the equation or the tables in the interest of space,
are the interactions of this dummy variable with all of the covariates in the model.

10
banks’ lending to the US may respond differently to monetary policy shocks than their lending to
non-US borrowers. In this analysis, Ϝ𝑗,𝑡𝑖,𝑐
is a dummy variable that takes on a value of 1 if the source
and the target are the same (i=j), and 0 otherwise.
Second, we examine whether the transmission of currency c-specific monetary shocks is different
in bank lending flows to borrowing countries which use currency c as their own currency. If this is
the case, for instance, an increase in the euro short-term shadow rate would affect EUR-
denominated lending inflows from all banks into countries in the Eurozone differently than USD
or JPY-denominated inflows into the Eurozone. In this analysis, Ϝ𝑗,𝑡𝑖,𝑐
is a dummy variable that takes
on a value of 1 if currency c is the borrowing (target) country j’s own currency, and 0 otherwise.
5. Estimation results
Tables 2 through 6 present our main estimation results. We begin by examining the transmission
of monetary policy-induced monetary shocks into aggregate bilateral bank flows to uncover the
currency dimension of the bank lending channel (Table 2). Next, we analyze transmission by sector
to see how transmission into lending to banks and non-banks differs (Tables 3 and 4). Finally, we
examine transmission by currency denomination, to see how transmission into lending in USD,
EUR or JPY may differ (Tables 5 and 6). As described above, in all our estimations we instrument
the Short-term International Liquidity Ratio with the Short-to-long-term International Liquidity
Ratio (defined as short-term FX claims over long-term FX claims).
5.1 Shock transmission in aggregate bilateral cross-border flows
We examine monetary transmission into aggregate bilateral cross-border flows, aggregated
(summed) across target sectors (bank and non-bank) in Table 2. We start by estimating Equation
1 to see the differential role of the source banking system’s International Liquidity Ratio in the
strength of monetary transmission. First, we estimate the equation in its simplest form with target
country fixed effects (Column 1). We find evidence of the currency dimension of the bank lending
channel: International liquidity-constrained banking systems reduce their bilateral cross-border
lending flows significantly more than their international liquidity-abundant counterparts (see
second row, showing ∑𝑘=14 𝛾𝑘 > 0). Furthermore, the results also suggest a significant direct
negative effect of monetary tightening in a currency on the lending denominated in the same
currency (first row, showing ∑𝑘=14 𝛽𝑘 < 0). In sum, the first results confirm our expectations.
We continue by saturating the model with increasingly extensive sets of fixed effects in order to
control for unobservable time-varying credit demand-side shocks. First, we add time fixed effects
(Column 2). Next, we add target country*time fixed effects (Column 3) to fully control for
unobservable time-varying demand-side shocks. Throughout these estimations, we continue to
confirm the initial results from Column 1. We find strong and robust evidence of the currency
dimension of the bank lending channel of monetary transmission.
Next, we allow banking system/country-specific effects on transmission by estimating the model
specified in Equation 2, while continuing to include target country*time fixed effects throughout
(Table 2, Columns 4 and 5). Specifically, in Column 4 we allow for the possibility that the presence
of “return flows” in the data (where the source banking system and target country are the same)
11
may affect the strength of monetary transmission.16 Our main results, both the statistical
significance and the size of the coefficient estimates, remain almost identical to earlier results.
Furthermore, transmission into “return flows” appear somewhat weaker, as implied by the triple
interaction term (Row 4 of Column 4). In Column 5, we allow for the possibility that the strength
of monetary transmission may differ if the currency of lending is the same as the currency of the
borrowing (target) country by including interactions with a dummy variable.17 Our main results in
the first two rows remain significant and similar in magnitude to earlier estimates. This same
currency effect does not significantly affect our main estimates (see interaction terms in the sixth
and seventh row).
Finally, we show that the results remain significant even when we explicitly exclude data on “return
flows” (Columns 6 and 7). Excluding return flows could matter in the strength of transmission, as
the coefficient on the triple interaction with the return flows dummy in Columns 4 was marginally
significant. In Column 6 we re-estimate the target country*time fixed-effect model of Column 3,
excluding data on flows where the source and target are the same. The results remain very similar.
In Column 7 we repeat the estimation of Column 5 (according to Equation 2) while we exclude
return flows. Again, we find that excluding observations where the currency of lending is the target
country’s own currency yields transmission results similar to the previous estimates, both in
magnitude and significance.
The currency dimension of the bank lending channel has statistically and economically significant
effects on cross-border lending flows. A 1 percentage point increase in a source banking system’s
Short-term International Liquidity Ratio mitigates the positive impact of a 100 basis points (bps)
decrease in the short-term shadow interest rate associated with the currency of lending by around
0.25 percentage points (Table 2, coefficient estimates in the second row). The economic impact
is also significant. The first two rows in Table 2 imply that for a source banking system at the
sample average International Liquidity Ratio (48 percent), a 100 bps decrease in the short-term
shadow rate of the currency of lending raises total bilateral cross-border lending flows by 0.49 to
15.68 percentage points. Taking into account the total bilateral claims on the average target
country, these percentage changes correspond to an increase of 50 billion USD in overall cross-
border inflows. This effect is much stronger for liquidity-constrained banking systems. As we
calculate in the bottom row of Table 2, banking systems at the 25th percentile of the distribution
of International Liquidity Ratios increase their bilateral cross-border lending 4.05 to 5.43
percentage points more in response to a 100 bps decrease in the short-term shadow rate of the
currency of lending than their peers at the 75th percentile of the international liquidity ratio
distribution.
The results we presented thus far show that currency-specific monetary shocks have generally
strong effects on bilateral cross-border lending in that given currency, across all source banking
systems. These shocks can exert real economic effects not only domestically (as implied by
16 We do so motivated by the hypothesis that “return flows” may increase if parent banks in the source
banking system recall loans from abroad, in order to mitigate the impact of monetary tightening at home
(Cetorelli and Goldberg, 2012). Furthermore, monetary policy shocks in such cases are highly endogenous
as they directly respond to domestic developments – thereby setting these “same source-target” pairs aside
from the rest of the sample. 17 For instance, monetary easing in the US would result in real economic effects via more abundant liquidity
conditions. These changes would then alter the inflow of bank claims into the US. Alternatively, in other (non-
US) countries that use the USD, easing USD liquidity conditions would alter the strength of the USD in
international financial markets, leading to real economic effects in any USD-using country. These real effects
could then change bank lending inflows into the country.

12
Kashyap and Stein, 2000), and not only in countries that receive credit from the source country of
the monetary shock (as implied by Peek and Rosengren, 2000), but also in unrelated (third)
country relationships, where the currency is used. For instance, US monetary policy can affect
lending by UK banks to Malaysia denominated in USD. In other words, the monetary policy
actions associated with the three reserve currencies have lending effects, and therefore potential
real economic effects, in all countries that receive lending flows in that currency, irrespective of
the source banking system of lending.18
5.2 Transmission in lending to banks and non-banks
In the analysis so far we focused on aggregate (summed across target sectors) bilateral cross-
border bank lending among country pairs and pooled them across different currencies. Now, we
turn our attention to lending to bank and non-bank borrowers separately.
In the first step of the investigation, in Table 3 we pool data on claims to banks and to non-banks
across currencies and calculate marginal transmission effects for each target sector separately. In
the second step of the sector-specific analysis, we estimate the model for each target sector
separately (Table 4). The results in both tables strongly support the following conclusion: The
monetary transmission effects are highly significant into lending to target countries’ non-bank
sectors, while there is no evidence of significant monetary transmission into cross-border lending
to target countries’ banking sectors.
In more detail on non-bank lending, the first three columns of Table 3 (which correspond to the
Columns 3, 4 and 7 from Table 2) show that a 1 percentage point increase in the International
Liquidity Ratio of a source banking system reduces the boosting effect of a 100 bps decline in the
short-term shadow rate of the currency of lending by 0.40 to 0.43 percentage points on non-bank
lending (bottom row). The economic significance of these results is great: Liquidity-constrained
banking systems’ cross-border lending flows to non-banks increase around nine percentage
points more than that of liquidity-abundant banking systems. Overall, these results imply that for
a banking system at the sample average of International Liquidity Ratio, a 100 bps decline in the
shadow rate of the currency of lending raises lending flows to non-banks by 2.02 to 3.54
percentage points. These changes amount to an increase of 28 billion USD in total inflows into
the non-bank sector of the average target country.
However, similar estimations for lending to banks in the same pooled dataset show that none of
the transmission results are significant (Columns 4 through 6).
In Table 4, we estimate the same IV specifications as in Table 3, now for lending to banks and
non-banks separately (rather than Table 3’s pooled specification). We continue to find substantial
differences in the strength of monetary transmission across target sectors: The monetary
transmission results are highly significant in lending to the non-bank sector, but insignificant in
lending to the banking sector of target countries. In terms of economic significance, international
liquidity-constrained banking systems (at the 25th percentile of the short-term international
liquidity distribution) increase their bilateral lending to non-bank borrowers in response to a 100
18 In specifications not presented here, we also examine whether the transmission of currency c-specific
monetary policy is stronger into the lending of banks that use currency c as their own currency. If this is the
case, we would find that monetary easing in the United States would affect the cross-border lending of US-
based banks more than the USD-denominated cross-border lending of banks from other countries. However,
we do not find a significant difference.
13
bps decrease in the short-term shadow rate of the currency of lending by 4.57 to 5.60 percentage
points more than international liquidity-abundant banking systems (at the 75th percentile of the
short-term international liquidity distribution). A monetary easing of similar magnitude would
increase the lending flows to non-banks of a source banking system at the sample average of the
International Liquidity Ratio (48 percent) by 1.08 to 9.89 percentage points. These changes
correspond to an increase of 20 billion USD in overall inflows to the average target country’s non-
bank sector. As in Table 3, the monetary transmission effects in lending to banks are insignificant
throughout (Columns 4 through 6 of Table 4).19
In summary, we find important differences in how the bank-lending channel transmits monetary
shocks into lending to target countries’ non-bank vs. bank sectors.20 The insignificance of the
“interbank” lending results makes sense insofar as cross-border interbank flows are driven by
many other, non-monetary policy-related considerations, such as payments systems, liquidity
management, hedging activities, and so on. Conceptually, these results also suggest that cross-
border interbank lending is not the initial channel through which monetary policy shocks in a
currency’s issuing country transmit to foreign banking systems. Large-scale corporate deposits,
FX swap markets or central bank liquidity swap lines may play a more prominent role in this initial
transmission instead.
Yet, while we find that transmission into interbank lending is insignificant in a global setup, our
result does not necessarily imply that interbank transmission is insignificant in all cross-border
relationships. For instance, Alper et al (2016) found significant evidence of US monetary policy
transmission into cross-border bank lending to Turkish banks, suggesting that interbank lending
might also be affected by monetary policy shocks, at least in some locations.
Our result showing that monetary shocks affect lending flows to non-bank borrowers suggests
potentially substantial real economic effects. Kashyap and Stein (2000) and Peek and Rosengren
(2000) have shown that monetary policy affects the real economy through bank lending to the
non-bank sector. We find that the currency dimension of bank lending channel operates through
exactly this type of lending to non-banks.
5.3 Transmission across different currencies
In this subsection we turn to compare how different currencies transmit their respective monetary
policy-induced monetary shocks. Following the logic of our sector-specific analysis, first we pool
the three reserve currencies and calculate marginal effects by currency (Table 5), then we examine
each currency separately (Table 6). In light of the previous section, where we established that the
currency dimension of the bank lending channel works primarily through lending to non-banks,
we focus our attention on lending to the non-bank target sector exclusively.
In Table 5, we employ a pooled IV specification across currencies and examine currency-specific
transmission effects by calculating marginal effects for each currency separately. Columns 1 and
19 Our IV specifications are particularly important in validating the insignificance of the transmission results
into lending to banks. The IV formulation eliminates the concern that the lack of significance could be due
to the possible endogeneity of our international liquidity measure. 20 Based on Column 2 of Table 3, we tested for the joint significance of the monetary transmission coefficients
across the two target sectors. That is, we tested whether ∑𝑘=14 𝛾𝑘 𝑛𝑜𝑛−𝑏𝑎𝑛𝑘 = ∑𝑘=1
4 𝛾𝑘 𝑏𝑎𝑛𝑘 = 0. The Chi-square
test indicates that we can reject this null hypothesis at the 90% confidence level, but not at the 95% level
(prob=0.91). Tests on this specification also show that the non-bank and bank results are jointly significant
at the 1% level.

14
2 show the results for the USD, 3 and 4 for the EUR and Columns 5 and 6 for the JPY. For each
currency, we run two specifications: A baseline estimation based on Equation 1, and a specification
based on Equation 2 which also allows for the possibility that monetary transmission is different
if the target country uses the denomination of lending as their own currency.
In this pooled specification, we find evidence of the transmission of monetary shocks into lending
in all three currencies. The significance levels are generally lower than in the previous estimates,
reflecting smaller sample size. The transmission is statistically significant into the USD-
denominated lending of all banking systems to the non-banking sector of target countries at
either the 5 or 10% level (Table 5, Columns 1 and 2). The USD transmission results are also large
in magnitude: A 100 bps decrease in the US short-term shadow interest rate increases the USD-
denominated lending of international liquidity-constrained banking systems (at the 25th percentile
of the international liquidity distribution) to non-banks in target countries by around 11
percentage points more than the lending of international liquidity-abundant banking systems (at
the 75th percentile of the distribution). In our baseline specification, a monetary easing of this
magnitude increases a source banking system’s USD lending to non-banks by 4.82 percent points
– even if the US itself is neither the source banking system nor the target country. By quantifying
these effects, our results add to the findings of the previous literature which has shown that US
monetary policy has global effects in part by impacting all USD-denominated bank flows around
the world (Ammer et al, 2016 and Alper et al, 2016, among others).
Monetary shocks associated with the euro are significant at the 5% level (Columns 3 and 4). Short-
term international liquidity-constrained banking systems increase their EUR-denominated lending
by 0.37 percentage points more in response to a 100 bps decrease in the EUR short-term shadow
interest rate than more international liquidity-abundant banking systems. The economic
significance is clear: A comparable decrease in the EUR short-term shadow interest rate increases
the EUR-denominated lending of banking systems at the 25th percentile of international liquidity
distribution by around 7 percentage points more than the lending of banking systems at the 75th
percentile.
Finally, we see a similar direction for monetary transmission via JPY-denominated lending to non-
banks, though the estimates are only significant at the 10% level (Columns 5 and 6).21 In our most
complete specification, international liquidity-constrained banking system’s JPY-denominated
lending to non-banks increases 9.03 percentage points more in response to a 100 bps decline in
the JPY short-term shadow interest rate than the lending of international liquidity-abundant
banking systems. Comparing magnitudes across currencies, the monetary transmission effects
appear greatest in USD-denominated lending to non-banks, followed by EUR lending and
smallest in JPY lending.
Overall, our results in Table 5 show that monetary policy-induced shocks associated with a given
reserve currency tend to affect all lending to non-banks in that currency across countries. To
confirm these findings, in Table 6 we examine the currencies one by one.22
21 We have much fewer observations on JPY-denominated bilateral cross-border lending as compared to
data on USD or EUR-denominated lending. 22 The individual monetary shock terms ∑𝑘=1
4 𝛾𝑘𝑀𝑃𝑡−𝑘𝑐 are excluded from the Table 6 specifications, since
these terms only vary in the time dimension within each currency and therefore cannot be included together
with our time fixed effects.

15
When we divide up the sample by currency denomination in Table 6, the monetary transmission
results point in a similar direction as in Table 5.23 The sample sizes drop substantially. For the USD
and the JPY, the coefficients on the interactions of the monetary shock and the International
Liquidity Ratio (first row) retain the same significance levels as in Table 5. However, the significance
of our transmission results into EUR lending declines.
We examine our individual estimates more closely by applying two tests. First, we test whether
the three coefficient estimates, on USD, EUR and JPY, are statistically indistinguishable from each
other, i.e. if ∑𝑘=14 𝛾𝑘
𝑢𝑠𝑑 = ∑𝑘=14 𝛾𝑘
𝑒𝑢𝑟 = ∑𝑘=14 𝛾𝑘
𝑗𝑝𝑦 in the Equation 1 specifications and ∑𝑘=1
4 ϊ𝑘𝑘𝑢𝑠𝑑 =
∑𝑘=14 ϊ𝑘𝑘
𝑒𝑢𝑟 = ∑𝑘=14 ϊ𝑘𝑘
𝑗𝑝𝑦 in the Equation 2 specification. We find that we cannot reject the equality of
transmission coefficients across currencies at the 90 percent confidence level. This would imply
that monetary transmission through USD-denominated lending around the world is not
statistically distinguishable from transmission through EUR and JPY-denominated lending.
Second, we test the joint significance of these variables. We cannot reject the null hypothesis of
joint significance at the 95 percent confidence level. The results imply that the currency dimension
of the bank lending channel is not unique to the USD: We find evidence of transmission in bilateral
cross-border lending in the other reserve currencies as well.
5.4 Robustness Checks
We conducted several robustness checks to confirm our results.
First, in Table 7 we examine an alternative IV formulation of our Table 3 specifications. In this table,
we pool the lending flows to banks and non-banks together, and estimate one set of coefficients,
assumed common across the two sectors. The Table 7 results imply that our monetary
transmission findings continue to hold. Both the “level” of the monetary shock, and its interaction
with the International Liquidity Ratio, are highly significant throughout. The economic magnitudes
are also significant: The differential impact on lending flows of a 100 bps decline in the shadow
interest rate of the currency of lending is around 5 percentage points, comparing liquidity-
constrained vs. liquidity-abundant banking systems.
Second, we address potential concerns that the unweighted estimations in Tables 2 through 7
implicitly consider all bilateral claim changes to be of equal weight. Indeed, larger claims could
contain more information about the drivers of lending as they are less likely to be influenced by
idiosyncratic shocks – which would call for weighting the observations (Avdjiev and Takáts, 2016).
To address this concern, we conduct a series of weighted estimations in Table 8. First, we construct
weights that represent the share of bilateral claims in a given target country in the total cross-
border claims that the source banking system originates to all target countries (Columns 1 and 2).
Second, we construct weights that represent the share of bilateral claims from a given source
banking system in the total cross-border claims that the target country receives from all source
banking systems (Columns 3 and 4). Third, we weight each source-target bilateral flows
observation by the share that the bilateral claims between the given source-target pair represent
compared to all bilateral claims across all source banking systems and target countries at a given
23 The subsample of JPY-denominated observations is markedly smaller than the subsamples of the other
two denominations.
16
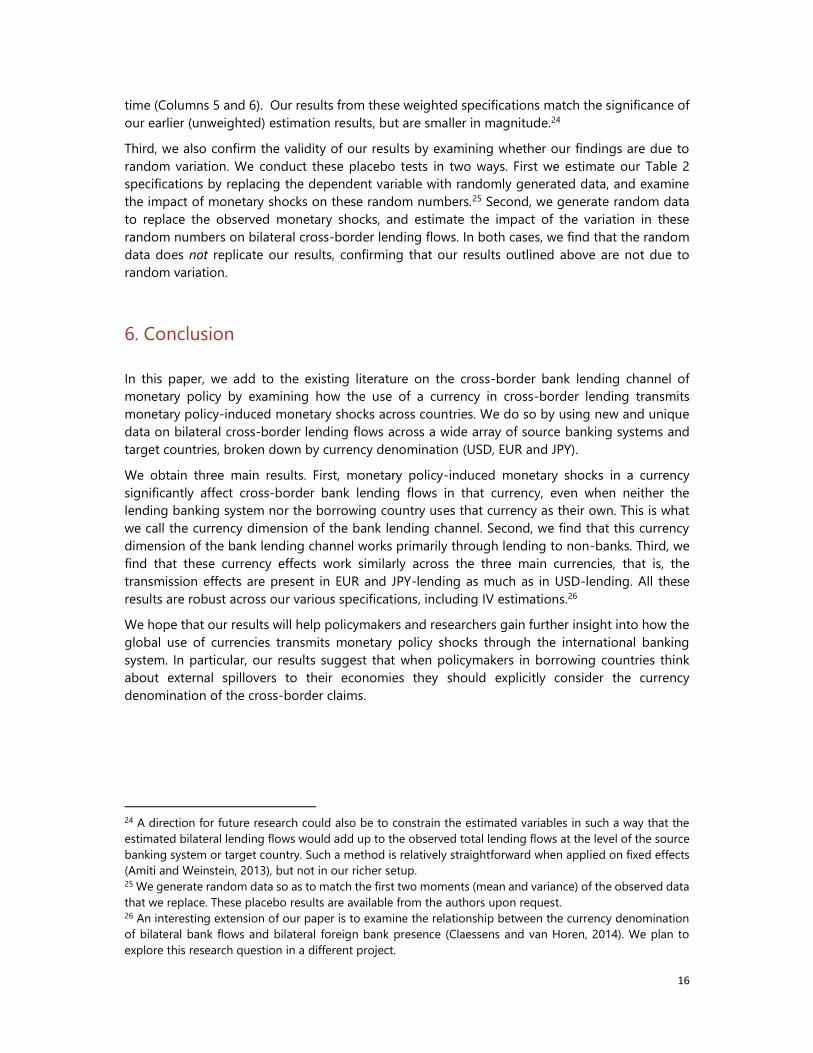
time (Columns 5 and 6). Our results from these weighted specifications match the significance of
our earlier (unweighted) estimation results, but are smaller in magnitude.24
Third, we also confirm the validity of our results by examining whether our findings are due to
random variation. We conduct these placebo tests in two ways. First we estimate our Table 2
specifications by replacing the dependent variable with randomly generated data, and examine
the impact of monetary shocks on these random numbers.25 Second, we generate random data
to replace the observed monetary shocks, and estimate the impact of the variation in these
random numbers on bilateral cross-border lending flows. In both cases, we find that the random
data does not replicate our results, confirming that our results outlined above are not due to
random variation.
6. Conclusion
In this paper, we add to the existing literature on the cross-border bank lending channel of
monetary policy by examining how the use of a currency in cross-border lending transmits
monetary policy-induced monetary shocks across countries. We do so by using new and unique
data on bilateral cross-border lending flows across a wide array of source banking systems and
target countries, broken down by currency denomination (USD, EUR and JPY).
We obtain three main results. First, monetary policy-induced monetary shocks in a currency
significantly affect cross-border bank lending flows in that currency, even when neither the
lending banking system nor the borrowing country uses that currency as their own. This is what
we call the currency dimension of the bank lending channel. Second, we find that this currency
dimension of the bank lending channel works primarily through lending to non-banks. Third, we
find that these currency effects work similarly across the three main currencies, that is, the
transmission effects are present in EUR and JPY-lending as much as in USD-lending. All these
results are robust across our various specifications, including IV estimations.26
We hope that our results will help policymakers and researchers gain further insight into how the
global use of currencies transmits monetary policy shocks through the international banking
system. In particular, our results suggest that when policymakers in borrowing countries think
about external spillovers to their economies they should explicitly consider the currency
denomination of the cross-border claims.
24 A direction for future research could also be to constrain the estimated variables in such a way that the
estimated bilateral lending flows would add up to the observed total lending flows at the level of the source
banking system or target country. Such a method is relatively straightforward when applied on fixed effects
(Amiti and Weinstein, 2013), but not in our richer setup. 25 We generate random data so as to match the first two moments (mean and variance) of the observed data
that we replace. These placebo results are available from the authors upon request. 26 An interesting extension of our paper is to examine the relationship between the currency denomination
of bilateral bank flows and bilateral foreign bank presence (Claessens and van Horen, 2014). We plan to
explore this research question in a different project.

17
References
Ahmed, Shagil and Andrei Zlate (2014). “Capital flows to emerging market economies: A brave
new world?” Journal of International Money and Finance 48, pp. 221-148.
Ahmed, Shagil, Brahima Coulibaly and Andrey Zlate (2015). “International financial spillovers to
emerging market economies: How important are economic fundamentals?” Federal Reserve
Board International Finance Discussion Papers 1135.
Ahmer, John, Erceg, Chris and Steven B. Kamin (2016). “Cross-border spillovers from monetary
policy,” presentation at the 2016 PBoC – FRBNY Joint Symposium: Global macro economy and
governance under monetary policy divergence” (March 1, 2016).
Aizenman, Joshua, Menzie D. Chinn and Hiro Ito. (2016). “Monetary policy spillovers and the
trilemma in the new normal: Periphery country sensitivity to core country conditions,” Journal of
International Money and Finance, forthcoming.
Alper, Koray, Fatih Altunok, Tanju Capacioglu and Steven Ongena (2016). “The effect of US
unconventional monetary policy on cross-border bank loans: Evidence from an emerging
market,” Working Paper.
Amiti, Mary and David E. Weinstein (2013). “How much do bank shocks affect investment?
Evidence from matched bank-firm loan data,” NBER Working Paper N. 18890.
Avdjiev, Stefan and Előd Takáts (2014). “Cross-border bank lending during the paper tantrum:
The role of emerging market fundamentals,” BIS Quarterly Review (September).
Avdjiev, Stefan and Előd Takáts (2016). “The ECB's QE and euro cross-border bank lending,” BIS
Working Paper 549.
Avdjiev, Stefan, Agne Subelyte and Előd Takáts (2016). “Cross-border bank lending during the
paper tantrum: The role of emerging market fundamentals,” BIS Quarterly Review (September).
Avdjiev, Stefan, Robert N McCauley and Hyun Song Shin. (2015). “Breaking free of the triple
coincidence in international finance,” BIS Working Paper 524.
Bowman, David, Juan M. Londono and Horacio Sapriza (2014). “US unconventional monetary
policy and transmission to emerging market economies,“ Federal Reserve Board International
Finance Discussion Papers 1109.
Bruno, Valentina and Hyun Song Shin (2015). “Cross-border banking and global liquidity,”
Review of Economic Studies 82, pp. 535-564.
Bruno, Valentina and Hyun Song Shin (2015). “Capital flows and the risk-taking channel of
monetary policy,” Journal of Monetary Economics 71, pp. 119-132.
Cerutti, Eugenio, Stijn Claessens and Lev Ratnovski (2014), “Global liquidity and drivers of cross-
border bank flows,” International Monetary Fund Working Paper 14/69.
Cerutti, Eugenio, Stijn Claessens and Luc Laeven (2015), “The use and effectiveness of macro-
prudential policies: New evidence,” International Monetary Fund Working Paper 15/61.
Cetorelli, Nicola and Linda S. Goldberg (2011). “Global banks and international shock
transmission: Evidence from the crisis,” IMF Economic Review 59(1), pp.
18
Cetorelli, Nicola and Linda S. Goldberg (2012). “Banking globalization and monetary
transmission,” The Journal of Finance 67(5), pp. 1811-1843.
Cecchetti, Stephen, Ingo Fender and Patrick McGuire (2010): “Towards a global risk map”, BIS
Working Paper 309.
Claessens, Stijn and Nieltje van Horen (2014). “Foreign banks: Trends and impact,” Journal of
Money, Credit and Banking, 46(s1), pp. 295-326.
Committee on the Global Financial System - CGFS (2011). “Global liquidity – concept,
measurement and policy implications,” CGFS Papers 45.
Committee on the Global Financial System - CGFS (2012). “Improving the BIS international
banking statistics,” CGFS Papers 47.
De Haas, Ralph and Iman van Lelyveld (2011). “Multinational banks and the global financial
crisis: Weathering the perfect storm,” Journal of Money, Credit and Banking 46(1), pp. 334-364.
De Haas, Ralph and Nieltje van Horen (2012). “International shock transmission after the Lehman
Brothers collapse: Evidence from syndicated lending,” American Economic Review Papers and
Proceedings 102(3), pp. 231-237.
Fender, Ingo and Patrick McGuire (2010). “Bank structure, funding risk and the transmission of
shocks across countries: concepts and measurement”, BIS Quarterly Review, September 2010,
pp. 63-79.
Ferrari, Massimo, Jonathan Kearns and Andreas Schrimpf (2016). “Monetary shocks at high-
frequency and their changing FX transmission around the globe”, Working Paper.
Forbes, Kristin J. and Francis E. Warnock (2012). “Debt and equity-led capital flow episodes,”
NBER Working Paper Series 18329.
Fratzscher, Marcel (2012). “Capital flows, push versus pull factors and the global financial crisis,”
Journal of International Economics 88, pp. 341-356.
Furceri, Davide, Stephanie Guichard and Elena Rusticelli (2012). “The effect of episodes of large
capital inflows on domestic credit,” North American Journal of Economics and Finance 23, pp.
325-344.
Georgiadis, Georgios. (2015). “Determinants of global spillovers from US monetary policy,”
European Central Bank Working Paper 1854.
Giannetti, Mariassunta and Luc Laeven (2012). “Flight home, flight abroad and international
credit cycles,” American Economic Review Papers and Proceedings 102(3), pp. 219-224.
Hofman, Boris and Elod Takats (2015). “International monetary spillovers,” BIS Quarterly Review
(September).
Jimenez, Gabriel, Steven Ongena, Jose-Luis Pedro and Jesus Saurina (2012). “Credit supply and
monetary policy: Identifying the bank balance-sheet channel with loan applications,” American
Economic Review 102(5), pp. 2301-2326.
Jimenez, Gabriel, Steven Ongena, Jose-Luis Pedro and Jesus Saurina (2014). “Hazardous times
for monetary policy: What do twenty-three million bank loans say about the effects of monetary
policy on credit risk-taking?”, Econometrica 82(2), pp. 463-505.
Kashyap, Anil K., and Jeremy C. Stein (2000). "What do a million observations on banks say
about the transmission of monetary policy?," American Economic Review 90(3), pp. 407-428.

19
Krippner, Leo (2013). "Measuring the stance of monetary policy in zero lower bound
environments," Economics Letters 118(1), pp. 135-138.
Krippner, Leo (2015). “A comment on Wu and Xia (2015), and the case for two-factor shadow
short rates,” Centre for Applied Macroeconomic Analysis Working Paper 48/2014.
Krippner, Leo (2016). “Documentation for Measures of Monetary Policy,” Reserve Bank of New
Zealand Working Paper.
Luca, Oana and Nicola Spatafora (2012). “Capital inflows, financial development and domestic
investment: Determinants and inter-relationships,” International Monetary Fund Working Paper
12/120.
Miranda-Agrippino, Silvia, and Hélène Rey (2012). “World asset markets and the global financial
cycle,” National Bureau of Economic Research Working Paper 21722.
Ongena, Steven, Ibolya Schindele and Dzsamila Vonnak (2015). “In lands of foreign currency
credit, bank lending channels run through?” CFS Working Paper 474.
Peek, Joe and Eric S. Rosengren (2000). “Collateral damage: Effects of the Japanese bank crisis
on real activity in the United States,” American Economic Review 90(1), pp. 30-45.
Rey, Helene (2012). “Dilemma not trilemma: The global financial cycle and monetary policy
independence,” National Bureau of Economic Research Working Paper 21162.
Rose, Andrew K. and Tomasz Wieladek (2014). “Financial protectionism? First evidence,” The
Journal of Finance 69(5), pp. 2127-2149.
Sahay, Ratna, Vivek Arora, Thanos Arvantis, Hamid Faruqee and Papa N’Diaye (2014). “Emerging
market volatility: Lessons from the taper tantrum,” International Monetary Fund Staff Discussion
Note 14/09.
Shin, Hyun Song (2012). “Global banking glut and loan risk premium,” IMF Economic Review
60(2), pp. 156-192.
Temesvary, Judit, Steven Ongena and Ann Owen (2016). “A global lending channel unplugged?
Does US monetary policy affect cross-border and affiliate lending by global US banks?” CFS
Working Paper 511.

20
Variables Unit Description Notes N mean sd min p25 p50 p75 max
Dependent Variables
Quarterly Change in Total Bilateral % Total 25,441 0.61 31.35 -149.76 -9.55 -0.21 10.21 149.66
Cross-border Claims where Y is the stock of bilateral cross-
border bank claims
By Sector:
To Banks 18,916 0.25 38.72 -149.70 -14.57 -0.19 14.03 149.66
To Non-banks 22,902 0.58 28.46 -149.39 -7.65 -0.19 8.10 149.64
By Currency:
U.S. Dollar 10,723 0.91 32.27 -149.39 -10.18 -0.01 11.61 149.55
Euro 11,102 0.68 28.05 -149.19 -8.47 -0.22 8.95 149.64
Yen 3,616 -0.51 37.56 -149.76 -12.34 -0.62 9.78 149.66
Main Explanatory Variables
Quarterly change in the Short-term
Shadow Interest Rate of the Currency of
Lending % U.S. Dollars 27,000 0.11 0.62 -1.46 -0.26 0.05 0.63 1.25
Euro 27,000 -0.26 0.60 -1.12 -0.75 -0.30 0.10 1.08
Yen 27,000 -0.12 0.75 -0.89 -0.66 -0.28 0.04 2.32
Short-term International Liquidity Ratio% 24,100 47.67 15.53 0.00 39.67 49.26 59.36 83.90
Short-term to Long-term International
Liquidity Ratio% 24,100 1.27 0.82 0.00 0.76 1.08 1.72 5.21
Descriptions and Summary Statistics of Variables
Table 1
Ratio of the source (lending) country's
banking sector's short-term FX claims
to their total FX claims, times 100
Quarterly change in the short-term
shadow interest rate associated with
the currency of lending, in 100 bps,
based on Krippner (2013)
Ratio of the source (lending) country's
banking sector's short-term
international claims to their long-term
international claims, denominated in
foreign currencies. Used as instrument
for short-term international liquidity
ratio in IV estimations

21
Variables Unit Description Notes N mean sd min p25 p50 p75 max
Macro Controls
Quarterly change in the exchange rate
between the currencies of the source and
target countries
% 20,908 0.50 10.07 -48.30 -4.08 0.00 4.35 76.08
Quarterly change in the source country's real
GDP% 26,950 1.51 2.59 -10.73 0.26 1.53 2.72 11.92
Quarterly change in the source country's
short-term interest rate%
Quarterly change in the
short-term shadow
interest rate of the
source country, in 100
bps, based on Krippner
(2013)
25,650 -0.04 0.34 -1.25 -0.10 0.00 0.00 5.50
Table 1 continued
Descriptions and Summary Statistics of Variables
Log difference of the
nominal exchange rate
between quarters,
multiplied by 100
Log difference of the
source country's real
GDP between quarters,
multiplied by 100

22
[1] [2] [3] [4] [5] [6] [7]
Independent Variables
ΣΔ Shadow Interest Rate {t-1 to t-4} -13.63 -12.15 -11.46 -12.43 -10.36 -12.29 -10.67
[4.023]*** [4.054]*** [4.021]*** [4.122]*** [4.149]** [4.15]*** [4.25]**
ΣΔ Shadow Interest Rate*International Liquidity Ratio {t-1 to t-4} 0.276 0.229 0.22 0.245 0.208 0.241 0.217
[0.0927]*** [0.0927]** [0.0911]** [0.0941]*** [0.0946]** [0.0946]** [0.0977]**
Σ International Liquidity Ratio {t-1 to t-4} -0.146 -0.149 -0.149 -0.0994 -0.159 -0.136 -0.137
[0.127] [0.13] [0.128] [0.133] [0.14] [0.134] [0.145]
Source-Target Same Dummy*ΣΔ Shadow Interest Rate*International Liquidity Ratio {t-1 to t-4} -0.675
[0.368]*
Source-Target Same Dummy*ΣΔ Shadow Interest Rate {t-1 to t-4} 27.359
[16.764]
Target Country's Currency Dummy*ΣΔ Shadow Interest Rate*International Liquidity Ratio {t-1 to t-4} -0.0416 0.0543
[0.298] [0.327]
Target Country's Currency Dummy*ΣΔ Shadow Interest Rate {t-1 to t-4} -2.303 -6.634
[14.19] [15.52]
Constant 7.547 10.75 8.205 9.307 10.31 7.471 5.639
[7.347] [7.579] [7.449] [7.483] [7.45] [7.766] [7.839]
Four lags of Dependent Variable Yes Yes Yes Yes Yes Yes Yes
Target-Source Same Pairs Included Yes Yes Yes Yes Yes No No
Source Banking System Macro Controls Yes Yes Yes Yes Yes Yes Yes
Target Country - Time Fixed Effects No No Yes Yes Yes Yes Yes
Time Fixed Effects No Yes -- -- -- -- --
Target Country Fixed Effects Yes No -- -- -- -- --
Number of Observations 12598 12598 12598 12598 12598 12072 12072
5.428 4.505 4.338 4.572 4.047 4.741 4.318
[1.825]*** [1.825]** [1.793]** [1.821]** [1.795]** [1.863]** [1.857]**
Note: The table reports estimates from Arellano-Bond dynamic panel IV estimations. The dependent variable is the quarterly change in total bilateral cross-border bank claims
across countries and currencies [i.e., claims denominated in U.S. dollars, Euro and Japanese Yen]. The Short-to-long international liquidity ratio is the instrument for the short-term
international liquidity ratio. Table 1 contains the definition of all variables and the summary statistics for each included variable. Coefficients are listed in the first row, robust
standard errors are reported in the row below, and the corresponding significance levels are placed adjacently. Σ indicates that the sum of the four coefficients on the indicated lag
terms [and corresponding robust standard errors and significance level] is reported. The Source-Target Same Dummy takes on a value of 1 if the source banking system and the
target country is the same, and zero otherwise. The Target Country's Currency Dummy takes on a value of 1 if the target country uses the given denomination as their own currency,
and zero otherwise. In addition to the reported variables, four lags of the two-way interactions of the Source-Target Same Dummy with the shadow rate change and International
Liquidity Ratio as well as the Target Country's Currency Dummy and International Liquidity Ratio are also included in the specifications. "Yes" indicates that the set of characteristics
or fixed effects is included. "No" indicates that the set of characteristics or fixed effects is not included. "--" indicates that the indicated set of characteristics or fixed effects are
comprised in the wider included set of fixed effects. *** Significant at 1%, ** significant at 5%, * significant at 10%.
Excluding
Return
Flows
Excluding
Return Flows
Quarterly change in total bilateral cross-border bank claims across countries and currencies for banking systems with different short-term international liquidity ratios during the
2012:Q1-2015:Q4 period
Table 2: Total bilateral bank flows - Instrumental Variable Estimations
Differential response of International Liquidity-abundant banking systems (at the 75th ptile) vs. international liquidity-constrained banking systems (at the 25th ptile) to a 100bps decline in the
policy interest rate
All
Bilateral
Flows
All
Bilateral
Flows
All
Bilateral
Flows
All
Bilateral
Flows
All
Bilateral
Flows
Type of Bilateral Flows

23
[1] [2] [3] [4] [5] [6]
Type of Bilateral Flows
Flows to the
Non-bank
Sector
Flows to the
Non-bank
Sector
Flows to the
Non-bank
Sector
Flows to
the Bank
Sector
Flows to
the Bank
Sector
Flows to
the Bank
Sector
Independent Variables
ΣΔ Shadow Interest Rate {t-1 to t-4} -22.64 -23.66 -21.87 -2.181 -2.16 -5.625
[5.443]*** [5.415]*** [5.475]*** [7.875] [8.085] [8.109]
ΣΔ Shadow Interest Rate*International Liquidity Ratio {t-1 to t-4} 0.401 0.443 0.427 0.0796 0.0885 0.142
[0.117]*** [0.118]*** [0.121]*** [0.177] [0.181] [0.186]
Σ International Liquidity Ratio {t-1 to t-4} 0.28 0.271 0.333 -0.602 -0.658 -0.777
[0.318] [0.32] [0.353] [0.456] [0.462] [0.513]
Target's Currency Dummy*ΣΔ Shadow Interest Rate*International Liquidity Ratio {t-1 to t-4} 0.267 -0.358
[0.468] [0.635]
Target's Currency Dummy*ΣΔ Shadow Interest Rate {t-1 to t-4} 0.267 -0.358
[0.468] [0.635]
Constant 7.158 2.974 4.241 7.158 2.974 4.241
[12.29] [12.24] [12.53] [12.29] [12.24] [12.53]
Four lags of Dependent Variable Yes Yes Yes Yes Yes Yes
Target-Source Same Pairs Included Yes Yes No Yes Yes No
Source Banking System Macro Controls Yes Yes Yes Yes Yes Yes
Target Country - Time Fixed Effects Yes Yes Yes Yes Yes Yes
Time Fixed Effects -- -- -- -- -- --
Target Country Fixed Effects -- -- -- -- -- --
Number of Observations 17147 17147 17147 17147 17147 17147
7.888 9.694 9.368 1.567 2.705 3.764
[2.313]*** [2.333]*** [2.373]*** [3.478] [3.567] [3.672]
Note: The table reports estimates from Arellano-Bond dynamic panel IV estimations. The dependent variable is the quarterly change in bilateral cross-border bank claims across
countries and currencies [i.e., claims denominated in U.S. dollars, Euro and Japanese Yen], with the marginal effects for claims to non-banks (Columns 1 through 3) and claims to
banks (Columns 4 through 6) calculated separately from pooled regressions. The Short-to-long international liquidity ratio is the instrument for the short-term international
liquidity ratio. Table 1 contains the definition of all variables and the summary statistics for each included variable. Coefficients are listed in the first row, robust standard errors
are reported in the row below, and the corresponding significance levels are placed adjacently. Σ indicates that the sum of the four coefficients on the indicated lag terms [and
corresponding robust standard errors and significance level] is reported. The Source-Target Same Dummy takes on a value of 1 if the source and target countries are the same,
and zero otherwise. The Target Country's Currency Dummy takes on a value of 1 if the target country uses the given denomination as their own currency, and zero otherwise. In
addition to the reported variables, four lags of the two-way interactions of the Target-Source Same Dummy with the shadow rate change and International Liquidity Ratio as
well as the Target Country's Currency Dummy and International Liquidity Ratio are also included in the specifications. "Yes" indicates that the set of characteristics or fixed effects
is included. "No" indicates that the set of characteristics or fixed effects is not included. "--" indicates that the indicated set of characteristics or fixed effects are comprised in the
wider included set of fixed effects. *** Significant at 1%, ** significant at 5%, * significant at 10%.
Table 3: Bilateral bank flows by sector - Instrumental Variable Estimations
Quarterly change in total bilateral cross-border bank claims on banks and non-banks, pooled specification, for banking systems with different short-term international liquidity
ratios during the 2012:Q1-2015:Q4 period
Differential response of International Liquidity-abundant banking systems (at the 75th ptile) vs. international liquidity-constrained banking systems (at the 25th ptile) to a
100bps decline in the policy interest rate

24
[1] [2] [3] [4] [5] [6]
Type of Bilateral Flows
Flows to the
Non-bank
Sector
Flows to the
Non-bank
Sector
Flows to the
Non-bank
Sector
Flows to the
Bank Sector
Flows to the
Bank Sector
Flows to the
Bank Sector
Independent Variables
ΣΔ Shadow Interest Rate {t-1 to t-4} -13.77 -15.72 -11.2 -9.465 -9.577 -7.998
[5.291]*** [5.425]*** [5.605]** [7.189] [7.431] [7.591]
ΣΔ Shadow Interest Rate*International Liquidity Ratio {t-1 to t-4} 0.266 0.303 0.236 0.159 0.177 0.122
[0.113]** [0.116]*** [0.119]** [0.155] [0.161] [0.163]
Σ International Liquidity Ratio {t-1 to t-4} -0.0497 -0.0272 -0.00517 -0.0698 -0.00605 -0.121
[0.135] [0.138] [0.149] [0.235] [0.242] [0.269]
Source-Target Same Dummy*ΣΔ Shadow Interest Rate*International Liquidity Ratio {t-1 to t-4} 50.617 4.072
[18.327]*** [23.504]
Source-Target Same Dummy*ΣΔ Shadow Interest Rate {t-1 to t-4} -0.978 -0.243
[0.382]** [0.502]
Target's Currency Dummy*ΣΔ Shadow Interest Rate*International Liquidity Ratio {t-1 to t-4} -0.0809 0.00511
[0.321] [0.405]
Target's Currency Dummy*ΣΔ Shadow Interest Rate {t-1 to t-4} -4.265 0.526
[14.97] [19.75]
Constant 7.137 6.161 4.67 -1.393 -2.788 -3.968
[8.147] [8] [8.142] [14.09] [13.92] [14.37]
Four lags of Dependent Variable Yes Yes Yes Yes Yes Yes
Target-Source Same Pairs Included Yes Yes No Yes Yes No
Source Banking System Macro Controls Yes Yes Yes Yes Yes Yes
Target Country - Time Fixed Effects Yes Yes Yes Yes Yes Yes
Time Fixed Effects -- -- -- -- -- --
Target Country Fixed Effects -- -- -- -- -- --
Number of Observations 11290 11290 11290 9161 9161 9161
5.243 5.599 4.57 3.127 3.399 2.403
[2.219]** [2.246]** [2.254]** [3.055] [3.104] [3.09]
Differential response of International Liquidity-abundant banking systems (at the 75th ptile) vs. international liquidity-constrained banking systems (at the 25th ptile) to a 100bps decline in the
policy interest rate
Note: The table reports estimates from Arellano-Bond dynamic panel IV estimations. The dependent variable is the quarterly change in bilateral cross-border bank claims across countries and
currencies [i.e., claims denominated in U.S. dollars, Euro and Japanese Yen], with the claims to non-banks (Columns 1 through 3) and claims to banks (Columns 4 through 6) analyzed separately.
The Short-to-long international liquidity ratio is the instrument for the short-term international liquidity ratio. Table 1 contains the definition of all variables and the summary statistics for each
included variable. Coefficients are listed in the first row, robust standard errors are reported in the row below, and the corresponding significance levels are placed adjacently. Σ indicates that the
sum of the four coefficients on the indicated lag terms [and corresponding robust standard errors and significance level] is reported. The Source-Target Same Dummy takes on a value of 1 if the
source and target countries are the same, and zero otherwise. The Target Country's Currency Dummy takes on a value of 1 if the target country uses the given denomination as their own currency,
and zero otherwise. In addition to the reported variables, four lags of the two-way interactions of the Target-Source Same Dummy with the shadow rate change and International Liquidity Ratio
as well as the Target Country's Currency Dummy and International Liquidity Ratio are also included in the specifications. "Yes" indicates that the set of characteristics or fixed effects is included.
"No" indicates that the set of characteristics or fixed effects is not included. "--" indicates that the indicated set of characteristics or fixed effects are comprised in the wider included set of fixed
effects. *** Significant at 1%, ** significant at 5%, * significant at 10%.
Table 4: Bilateral bank flows by sector - Instrumental Variable Estimations
Quarterly change in bilateral cross-border bank claims on non-banks and banks separately, for banking systems with different short-term international liquidity ratios during the 2012:Q1-2015:Q4
period
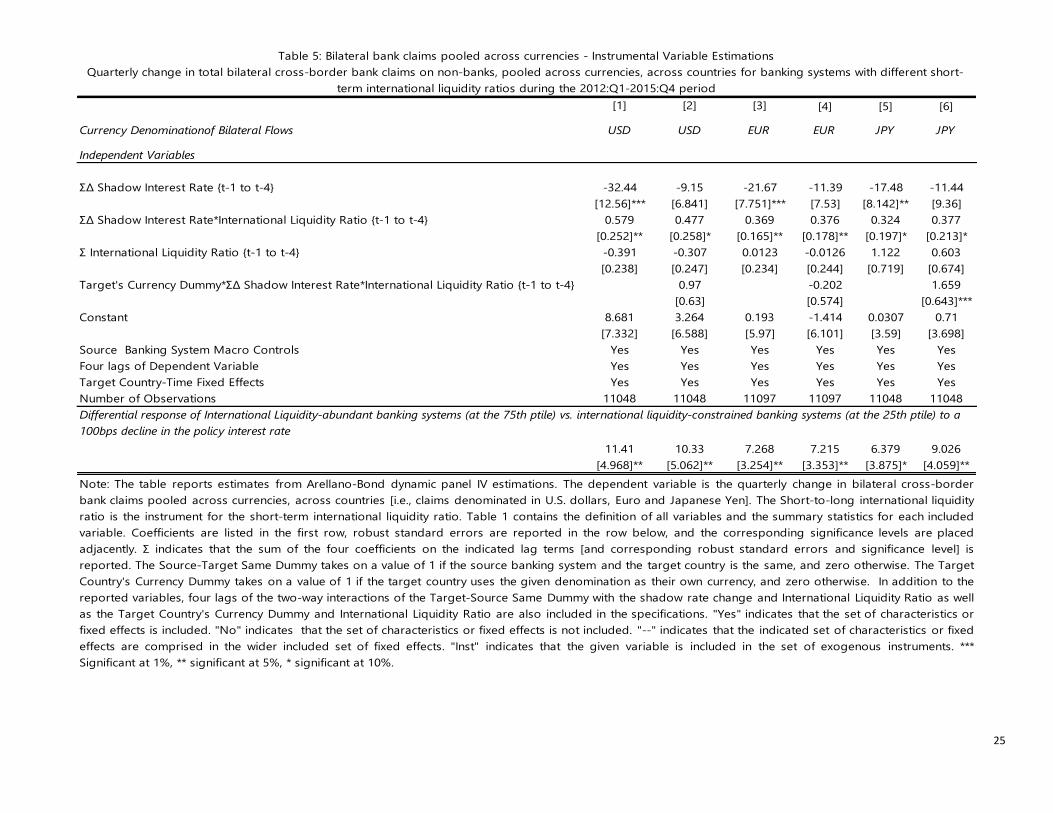
25
[1] [2] [3] [4] [5] [6]
Independent Variables
ΣΔ Shadow Interest Rate {t-1 to t-4} -32.44 -9.15 -21.67 -11.39 -17.48 -11.44
[12.56]*** [6.841] [7.751]*** [7.53] [8.142]** [9.36]
ΣΔ Shadow Interest Rate*International Liquidity Ratio {t-1 to t-4} 0.579 0.477 0.369 0.376 0.324 0.377
[0.252]** [0.258]* [0.165]** [0.178]** [0.197]* [0.213]*
Σ International Liquidity Ratio {t-1 to t-4} -0.391 -0.307 0.0123 -0.0126 1.122 0.603
[0.238] [0.247] [0.234] [0.244] [0.719] [0.674]
Target's Currency Dummy*ΣΔ Shadow Interest Rate*International Liquidity Ratio {t-1 to t-4} 0.97 -0.202 1.659
[0.63] [0.574] [0.643]***
Constant 8.681 3.264 0.193 -1.414 0.0307 0.71
[7.332] [6.588] [5.97] [6.101] [3.59] [3.698]
Source Banking System Macro Controls Yes Yes Yes Yes Yes Yes
Four lags of Dependent Variable Yes Yes Yes Yes Yes Yes
Target Country-Time Fixed Effects Yes Yes Yes Yes Yes Yes
Number of Observations 11048 11048 11097 11097 11048 11048
11.41 10.33 7.268 7.215 6.379 9.026
[4.968]** [5.062]** [3.254]** [3.353]** [3.875]* [4.059]**
Table 5: Bilateral bank claims pooled across currencies - Instrumental Variable Estimations
Quarterly change in total bilateral cross-border bank claims on non-banks, pooled across currencies, across countries for banking systems with different short-
term international liquidity ratios during the 2012:Q1-2015:Q4 period
Differential response of International Liquidity-abundant banking systems (at the 75th ptile) vs. international liquidity-constrained banking systems (at the 25th ptile) to a
100bps decline in the policy interest rate
Note: The table reports estimates from Arellano-Bond dynamic panel IV estimations. The dependent variable is the quarterly change in bilateral cross-border
bank claims pooled across currencies, across countries [i.e., claims denominated in U.S. dollars, Euro and Japanese Yen]. The Short-to-long international liquidity
ratio is the instrument for the short-term international liquidity ratio. Table 1 contains the definition of all variables and the summary statistics for each included
variable. Coefficients are listed in the first row, robust standard errors are reported in the row below, and the corresponding significance levels are placed
adjacently. Σ indicates that the sum of the four coefficients on the indicated lag terms [and corresponding robust standard errors and significance level] is
reported. The Source-Target Same Dummy takes on a value of 1 if the source banking system and the target country is the same, and zero otherwise. The Target
Country's Currency Dummy takes on a value of 1 if the target country uses the given denomination as their own currency, and zero otherwise. In addition to the
reported variables, four lags of the two-way interactions of the Target-Source Same Dummy with the shadow rate change and International Liquidity Ratio as well
as the Target Country's Currency Dummy and International Liquidity Ratio are also included in the specifications. "Yes" indicates that the set of characteristics or
fixed effects is included. "No" indicates that the set of characteristics or fixed effects is not included. "--" indicates that the indicated set of characteristics or fixed
effects are comprised in the wider included set of fixed effects. "Inst" indicates that the given variable is included in the set of exogenous instruments. ***
Significant at 1%, ** significant at 5%, * significant at 10%.
Currency Denominationof Bilateral Flows USD USD EUR EUR JPY JPY

26
[1] [2] [3] [4] [5] [6]
Independent Variables
ΣΔ Shadow Interest Rate*International Liquidity Ratio {t-1 to t-4} 0.497 0.408 0.266 0.151 0.389 0.395
[0.245]** [0.234]* [0.156]* [0.145] [0.234]* [0.231]*
Σ International Liquidity Ratio {t-1 to t-4} -0.162 -0.0607 -0.0856 -0.0326 0.6 0.672
[0.233] [0.232] [0.212] [0.187] [0.727] [0.736]
Target Country's Currency Dummy*ΣΔ Shadow Interest Rate*International Liquidity Ratio {t-1 to t-4} 0.853 0.687 -0.949 -0.87 1.475 1.198
[1.135] [1.115] [0.512]* [0.479]* [0.613]** [0.663]*
Target Country's Currency Dummy*ΣΔ Shadow Interest Rate {t-1 to t-4} -37.61 -37.17 20.23 -3.199 -85.35 -91.08
[50.45] [28.89] [20.43] [20.21] [33.11]*** [42.47]**
Constant -1.382 -3.678 6.824 3.095 -55 -53.77
[10.87] [9.683] [8.383] [7.949] [32.86]* [30.98]*
Four lags of Dependent Variable Yes Yes Yes Yes Yes Yes
Target-Source Same Pairs Included No No No No No No
Source Banking System Macro Controls Yes Yes Yes Yes Yes Yes
Target Country - Time Fixed Effects No Yes No Yes No Yes
Time Fixed Effects Yes -- Yes -- Yes --
Target Country Fixed Effects No -- No -- No --
Number of Observations 4775 4775 5146 5146 1127 1127
9.78 8.031 5.233 2.966 7.67 7.769
[4.834]** [4.605]* [3.062]* [2.861] [4.609]* [4.556]*
Note: The table reports estimates from Arellano-Bond dynamic panel IV estimations. The dependent variable is the quarterly change in the currency-specific bilateral cross-
border bank claims on non-banks, across countries [i.e., claims denominated in U.S. dollars, Euro and Japanese Yen]. The Short-to-long international liquidity ratio is the
instrument for the short-term international liquidity ratio. Table 1 contains the definition of all variables and the summary statistics for each included variable. Coefficients are
listed in the first row, robust standard errors are reported in the row below, and the corresponding significance levels are placed adjacently. Σ indicates that the sum of the four
coefficients on the indicated lag terms [and corresponding robust standard errors and significance level] is reported. The Source-Target Same Dummy takes on a value of 1 if the
source and target countries are the same, and zero otherwise. The Target Country's Currency Dummy takes on a value of 1 if the target country uses the given denomination as
their own currency, and zero otherwise. In addition to the reported variables, four lags of the two-way interactions of the Target-Source Same Dummy with the shadow rate
change and International Liquidity Ratio as well as the Target Country's Currency Dummy and International Liquidity Ratio are also included in the specifications. "Yes" indicates
that the set of characteristics or fixed effects is included. "No" indicates that the set of characteristics or fixed effects is not included. "--" indicates that the indicated set of
characteristics or fixed effects are comprised in the wider included set of fixed effects. *** Significant at 1%, ** significant at 5%, * significant at 10%.
Differential response of international liquidity-abundant banking systems (at the 75th ptile) vs. international liquidity-constrained banking systems (at the 25th ptile) to a 100bps
decline in the policy interest rate
Table 6: Bilateral bank flows by currency - Instrumental Variable Estimations
Quarterly change in total bilateral cross-border bank claims on non-banks across countries by currency, for banking systems with different short-term international liquidity
ratios during the 2012:Q1-2015:Q4 period
Currency Denomination of Bilateral Flows USD USD EUR EUR JPY JPY

27
[1] [2] [3] [4] [5] [6] [7]
Independent Variables
ΣΔ Shadow Interest Rate {t-1 to t-4} -13.2 -12.08 -11.62 -13.13 -9.281 -12.96 -10.36
[4.467]*** [4.456]*** [4.406]*** [4.540]*** [4.651]** [4.574]*** [4.8]**
ΣΔ Shadow Interest Rate*International Liquidity Ratio {t-1 to t-4} 0.255 0.227 0.216 0.25 0.18 0.246 0.201
[0.0976]*** [0.0977]** [0.0959]** [0.0994]** [0.101]* [0.0999]** [0.105]*
Σ International Liquidity Ratio {t-1 to t-4} -0.0459 -0.0471 -0.0483 -0.0129 -0.0475 -0.0369 -0.0352
[0.127] [0.13] [0.13] [0.132] [0.145] [0.133] [0.147]
Source-Target Same Dummy*ΣΔ Shadow Interest Rate*International Liquidity Ratio {t-1 to t-4} -0.711
[0.354]**
Source-Target Same Dummy*ΣΔ Shadow Interest Rate {t-1 to t-4} 17.270
[0.053]***
Target's Currency Dummy*ΣΔ Shadow Interest Rate*International Liquidity Ratio {t-1 to t-4} 0.0581 0.112
[0.293] [0.313]
Target's Currency Dummy*ΣΔ Shadow Interest Rate {t-1 to t-4} -7.282 -9.218
[14.13] [15.04]
Constant 1.465 4.933 2.95 2.271 2.786 2.725 0.489
[7.614] [7.77] [7.82] [7.598] [7.971] [8.003] [8.097]
Four lags of Dependent Variable Yes Yes Yes Yes Yes Yes Yes
Target-Source Same Pairs Included Yes Yes Yes Yes Yes No No
Source Banking System Macro Controls Yes Yes Yes Yes Yes Yes Yes
Target Country - Time Fixed Effects No No Yes Yes Yes Yes Yes
Time Fixed Effects No Yes -- -- -- -- --
Target Country Fixed Effects Yes No -- -- -- -- --
Number of Observations 20451 20451 20451 20451 20451 19487 19487
5.029 4.473 4.258 4.648 3.605 4.848 4.072
[1.921]*** [1.924]** [1.888]** [1.922]** [1.913]* [1.967]** [1.99]**
Note: The table reports estimates from Arellano-Bond dynamic panel IV estimations. The dependent variable is the quarterly change in bilateral cross-border bank claims across countries and
currencies [i.e., claims denominated in U.S. dollars, Euro and Japanese Yen], with the claims to non-banks and claims to banks pooled together. The Short-to-long international liquidity ratio is the
instrument for the short-term international liquidity ratio. Table 1 contains the definition of all variables and the summary statistics for each included variable. Coefficients are listed in the first row,
robust standard errors are reported in the row below, and the corresponding significance levels are placed adjacently. Σ indicates that the sum of the four coefficients on the indicated lag terms [and
corresponding robust standard errors and significance level] is reported. The Source-Target Same Dummy takes on a value of 1 if the source banking system and target country is the same, and zero
otherwise. The Target Country's Currency Dummy takes on a value of 1 if the target country uses the given denomination as their own currency, and zero otherwise. In addition to the reported
variables, four lags of the two-way interactions of the Target-Source Same Dummy with the shadow rate change and International Liquidity Ratio as well as the Target Country's Currency Dummy and
International Liquidity Ratio are also included in the specifications. "Yes" indicates that the set of characteristics or fixed effects is included. "No" indicates that the set of characteristics or fixed effects is
not included. "--" indicates that the indicated set of characteristics or fixed effects are comprised in the wider included set of fixed effects. *** Significant at 1%, ** significant at 5%, * significant at 10%.
Quarterly change in bilateral cross-border bank claims pooled across banks and non-banks, across countries and currencies for banking systems with different short-term international liquidity ratios
during the 2012:Q1-2015:Q4 period
Table 7: Bilateral bank flows pooled across sectors - Instrumental Variable Estimations
Excluding
Return Flows
Excluding
Return Flows
Differential response of International Liquidity-abundant banking systems (at the 75th ptile) vs. international liquidity-constrained banking systems (at the 25th ptile) to a 100bps decline in the policy interest rate
All Bilateral
Flows
All Bilateral
Flows
All Bilateral
Flows
All Bilateral
Flows
All Bilateral
FlowsType of Bilateral Flows
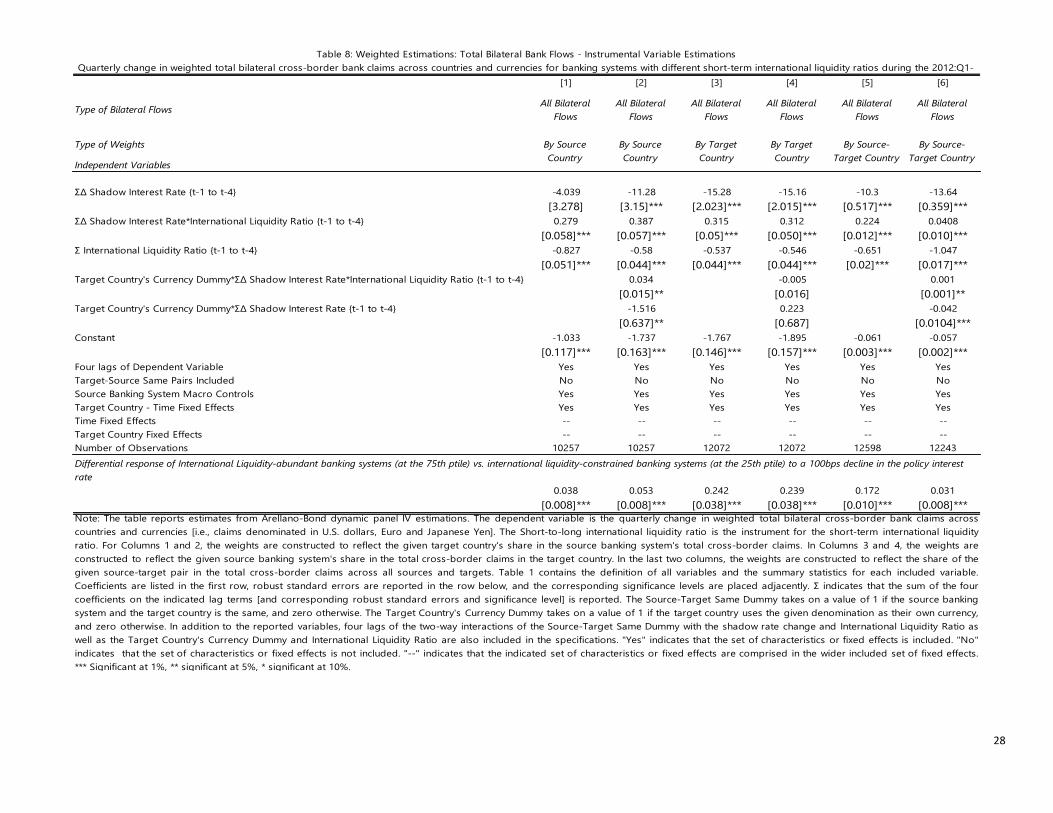
28
[1] [2] [3] [4] [5] [6]
Type of Weights
Independent Variables
ΣΔ Shadow Interest Rate {t-1 to t-4} -4.039 -11.28 -15.28 -15.16 -10.3 -13.64
[3.278] [3.15]*** [2.023]*** [2.015]*** [0.517]*** [0.359]***
ΣΔ Shadow Interest Rate*International Liquidity Ratio {t-1 to t-4} 0.279 0.387 0.315 0.312 0.224 0.0408
[0.058]*** [0.057]*** [0.05]*** [0.050]*** [0.012]*** [0.010]***
Σ International Liquidity Ratio {t-1 to t-4} -0.827 -0.58 -0.537 -0.546 -0.651 -1.047
[0.051]*** [0.044]*** [0.044]*** [0.044]*** [0.02]*** [0.017]***
Target Country's Currency Dummy*ΣΔ Shadow Interest Rate*International Liquidity Ratio {t-1 to t-4} 0.034 -0.005 0.001
[0.015]** [0.016] [0.001]**
Target Country's Currency Dummy*ΣΔ Shadow Interest Rate {t-1 to t-4} -1.516 0.223 -0.042
[0.637]** [0.687] [0.0104]***
Constant -1.033 -1.737 -1.767 -1.895 -0.061 -0.057
[0.117]*** [0.163]*** [0.146]*** [0.157]*** [0.003]*** [0.002]***
Four lags of Dependent Variable Yes Yes Yes Yes Yes Yes
Target-Source Same Pairs Included No No No No No No
Source Banking System Macro Controls Yes Yes Yes Yes Yes Yes
Target Country - Time Fixed Effects Yes Yes Yes Yes Yes Yes
Time Fixed Effects -- -- -- -- -- --
Target Country Fixed Effects -- -- -- -- -- --
Number of Observations 10257 10257 12072 12072 12598 12243
0.038 0.053 0.242 0.239 0.172 0.031
[0.008]*** [0.008]*** [0.038]*** [0.038]*** [0.010]*** [0.008]***
Quarterly change in weighted total bilateral cross-border bank claims across countries and currencies for banking systems with different short-term international liquidity ratios during the 2012:Q1-
Table 8: Weighted Estimations: Total Bilateral Bank Flows - Instrumental Variable Estimations
By Source-
Target Country
By Source-
Target Country
By Source
Country
By Source
Country
By Target
Country
By Target
Country
Note: The table reports estimates from Arellano-Bond dynamic panel IV estimations. The dependent variable is the quarterly change in weighted total bilateral cross-border bank claims across
countries and currencies [i.e., claims denominated in U.S. dollars, Euro and Japanese Yen]. The Short-to-long international liquidity ratio is the instrument for the short-term international liquidity
ratio. For Columns 1 and 2, the weights are constructed to reflect the given target country's share in the source banking system's total cross-border claims. In Columns 3 and 4, the weights are
constructed to reflect the given source banking system's share in the total cross-border claims in the target country. In the last two columns, the weights are constructed to reflect the share of the
given source-target pair in the total cross-border claims across all sources and targets. Table 1 contains the definition of all variables and the summary statistics for each included variable.
Coefficients are listed in the first row, robust standard errors are reported in the row below, and the corresponding significance levels are placed adjacently. Σ indicates that the sum of the four
coefficients on the indicated lag terms [and corresponding robust standard errors and significance level] is reported. The Source-Target Same Dummy takes on a value of 1 if the source banking
system and the target country is the same, and zero otherwise. The Target Country's Currency Dummy takes on a value of 1 if the target country uses the given denomination as their own currency,
and zero otherwise. In addition to the reported variables, four lags of the two-way interactions of the Source-Target Same Dummy with the shadow rate change and International Liquidity Ratio as
well as the Target Country's Currency Dummy and International Liquidity Ratio are also included in the specifications. "Yes" indicates that the set of characteristics or fixed effects is included. "No"
indicates that the set of characteristics or fixed effects is not included. "--" indicates that the indicated set of characteristics or fixed effects are comprised in the wider included set of fixed effects.
*** Significant at 1%, ** significant at 5%, * significant at 10%.
Differential response of International Liquidity-abundant banking systems (at the 75th ptile) vs. international liquidity-constrained banking systems (at the 25th ptile) to a 100bps decline in the policy interest
rate
All Bilateral
Flows
All Bilateral
Flows
All Bilateral
Flows
All Bilateral
FlowsType of Bilateral Flows
All Bilateral
Flows
All Bilateral
Flows
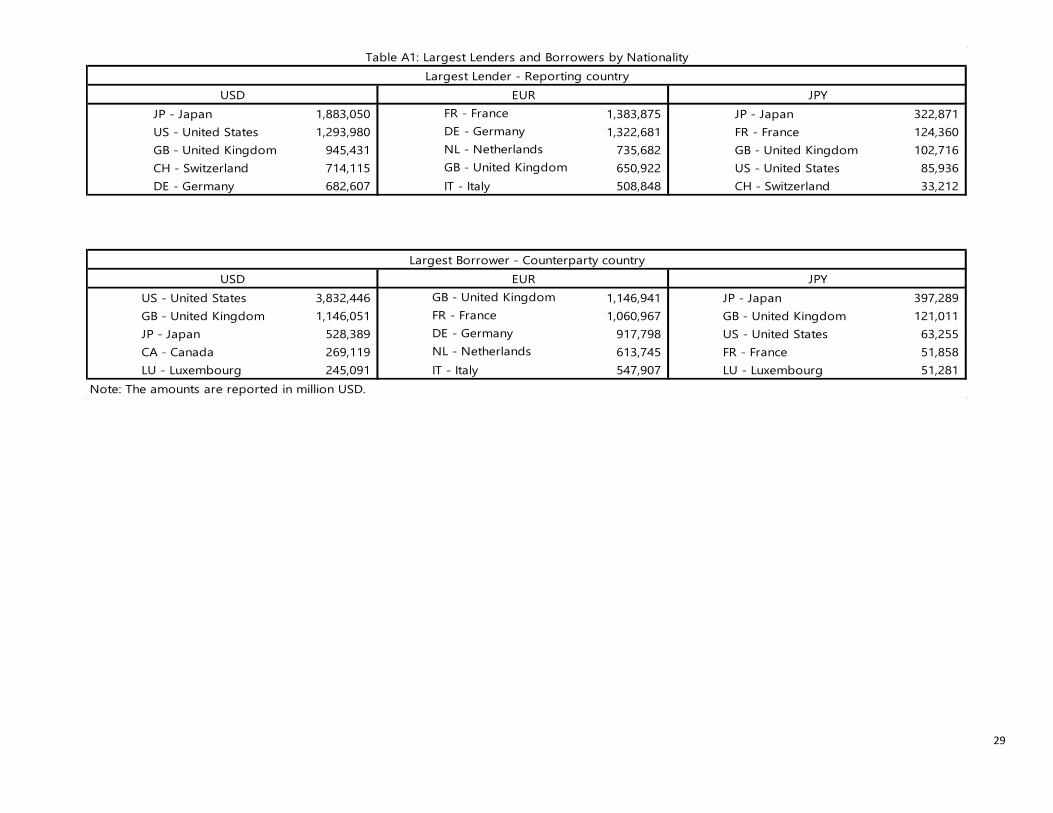
29
JP - Japan 1,883,050 FR - France 1,383,875 JP - Japan 322,871
US - United States 1,293,980 DE - Germany 1,322,681 FR - France 124,360
GB - United Kingdom 945,431 NL - Netherlands 735,682 GB - United Kingdom 102,716
CH - Switzerland 714,115 GB - United Kingdom 650,922 US - United States 85,936
DE - Germany 682,607 IT - Italy 508,848 CH - Switzerland 33,212
US - United States 3,832,446 GB - United Kingdom 1,146,941 JP - Japan 397,289
GB - United Kingdom 1,146,051 FR - France 1,060,967 GB - United Kingdom 121,011
JP - Japan 528,389 DE - Germany 917,798 US - United States 63,255
CA - Canada 269,119 NL - Netherlands 613,745 FR - France 51,858
LU - Luxembourg 245,091 IT - Italy 547,907 LU - Luxembourg 51,281
Table A1: Largest Lenders and Borrowers by Nationality
Note: The amounts are reported in million USD.
USD EUR JPY
Largest Lender - Reporting country
USD EUR JPY
Largest Borrower - Counterparty country

30
Short-term target interest rates
In per cent Figure 1
2007Q3—2015Q4 2012Q2—2015Q4
These graphs present the paths of the short-term policy target interest rates set by the Federal Reserve (blue), the European Central Bank
(yellow) and the Bank of Japan (red).
Source: Central bank websites.
Short-term shadow interest rates
In per cent Figure 2
2007Q3—2015Q4 2012Q2—2015Q4
These graphs present the paths of the short-term shadow interest rates for the US dollar (blue), the euro (yellow) and the yen (red).
Source: Krippner (2016)