final waste audit and waste reduction work plan humber college · waste audit and waste reduction...
TRANSCRIPT
FINAL
Waste Audit and Waste
Reduction Work Plan
Humber College
March 2017
Prepared by:
159 Ridout Street South, London, Ont. N6C 3X7
Paul van der Werf Tel: 519-645-7733
Email: [email protected]
March 2017 Humber College 1 of 3
Final Waste Audit and Waste Reduction Work Plan
Table of Contents
Table of Contents
1.0 Introduction ............................................................................................................ 1 1.1 Legislative Requirements ...................................................................................... 2
2.0 Current Situation ................................................................................................... 2 2.1 Description of Waste Generation ......................................................................... 2 2.2 Current Source Separation Programs ................................................................. 5 2.3 Current Waste Handling ........................................................................................ 7 2.4 Overview of Waste Generation ............................................................................. 8
3.0 Methodology .......................................................................................................... 9 3.1 Waste Auditing ........................................................................................................ 9 3.2 Development of Waste Reduction Work Plan ................................................. 11
4.0 Waste Audit Results ............................................................................................ 11 4.1 North Campus ....................................................................................................... 12
4.1.1 North Campus Common Areas ................................................................... 12 4.1.2 North Campus Food Serving Areas ............................................................ 13 4.1.3 North Campus Residence ............................................................................ 14
4.2 Lakeshore Campus ............................................................................................... 16 4.2.1 Lakeshore Common Areas ......................................................................... 16 4.2.2 Lakeshore Food Serving Areas .................................................................. 17 4.2.3 Lakeshore Residence .................................................................................. 18
4.3 Overall Waste Stream .......................................................................................... 19 4.4 Recycling ................................................................................................................ 20
5.0 Data Analysis ....................................................................................................... 22 5.1 North Campus ....................................................................................................... 22 5.2 Lakeshore Campus ............................................................................................... 23 5.3 Overall (North and Lakeshore Campus) ............................................................ 23 5.4 Comparison to 2014 and 2015 Waste Audits ................................................. 24
6.0 Waste Reduction Work Plan and Recommendations ..................................... 24 6.1 General Initiatives ................................................................................................. 25 6.2 Reduction Initiatives ............................................................................................. 26 6.3 Re-Use Initiatives .................................................................................................. 26 6.4 Recycling Initiatives .............................................................................................. 26 6.5 Implementation Plan ........................................................................................... 26
Appendix 1 Detailed Waste Audit Results
Appendix 2 Ministry of Environment Reporting Forms
March 2017 Humber College 2 of 3
Final Waste Audit and Waste Reduction Work Plan
Table of Contents
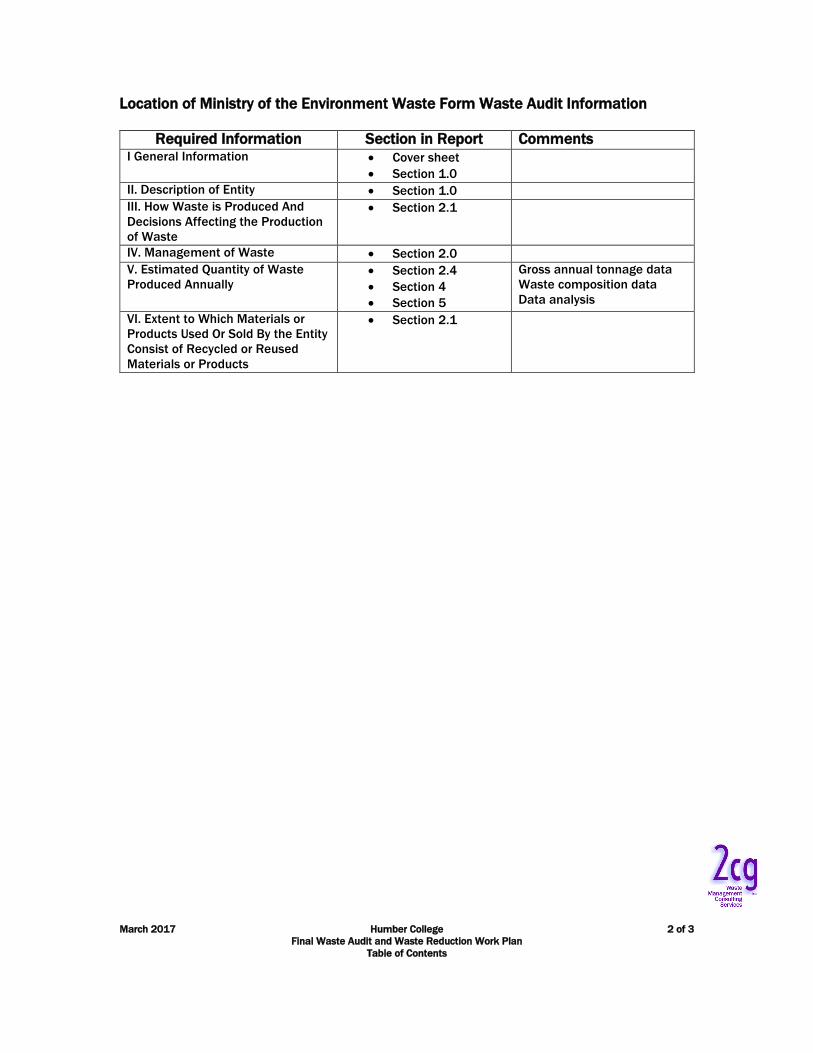
Location of Ministry of the Environment Waste Form Waste Audit Information
Required Information Section in Report Comments I General Information Cover sheet
Section 1.0
II. Description of Entity Section 1.0
III. How Waste is Produced And
Decisions Affecting the Production
of Waste
Section 2.1
IV. Management of Waste Section 2.0
V. Estimated Quantity of Waste
Produced Annually Section 2.4
Section 4
Section 5
Gross annual tonnage data
Waste composition data
Data analysis
VI. Extent to Which Materials or
Products Used Or Sold By the Entity
Consist of Recycled or Reused
Materials or Products
Section 2.1
March 2017 Final Humber College Page 1 of 27
Waste Audit and Waste Reduction Work Plan
1.0 Introduction
2cg Inc. was retained by Humber College (Humber) to update a waste audit and waste
reduction work plan from 2015 for Humber College in Toronto, Ontario.
Humber, a member of Polytechnics Canada, offers a broad range of career-focused,
educational programs (more than 350) that include: apprenticeships, certificates,
diplomas, bachelor's degrees and postgraduate certificates. Humber has 28,575 full-
time and 11,000 part-time students.
As noted in Humber’s 2013 – 2018 Strategic Plan, a key Value is:
“Sustainability: We preserve our collective future by embracing the social, ecological
and economic impact of our decisions.”
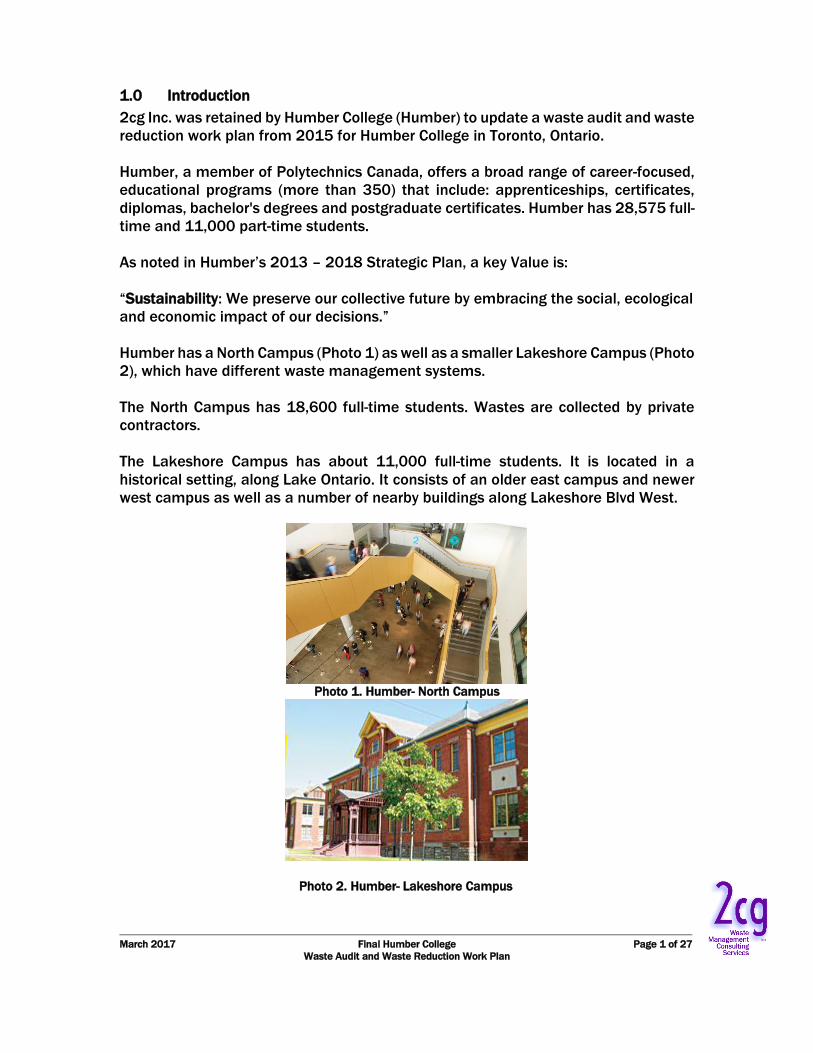
Humber has a North Campus (Photo 1) as well as a smaller Lakeshore Campus (Photo
2), which have different waste management systems.
The North Campus has 18,600 full-time students. Wastes are collected by private
contractors.
The Lakeshore Campus has about 11,000 full-time students. It is located in a
historical setting, along Lake Ontario. It consists of an older east campus and newer
west campus as well as a number of nearby buildings along Lakeshore Blvd West.
Photo 1. Humber- North Campus
Photo 2. Humber- Lakeshore Campus

March 2017 Final Humber College Page 2 of 27
Waste Audit and Waste Reduction Work Plan
This waste audit included a full review of waste handling, waste generation and waste
composition. The goal was to determine the success of current recycling programs
and to identify possible improvements and additional wastes which could be recycled.
1.1 Legislative Requirements
Humber fits the definition of an Educational Institution with an enrollment of greater
than 350 students.
According to ONTARIO REGULATION 102/94 “Waste Audits and Waste Reduction
Work Plans” the following must be completed at an “Educational Institution” (i.e.
facilities with enrolment greater than 350 people):
57. (1) The owner shall conduct a waste audit covering the waste generated by the operation of the establishment
at the site. The audit shall also address the extent to which materials or products used or sold consist of
recycled or reused materials or products.
(2) After conducting the waste audit, the owner shall prepare a written report of the audit.
(3) In every year following the initial waste audit, the owner shall update the audit and prepare an updated
written report. O. Reg. 102/94, s. 57.
58. (1) The owner shall prepare a written waste reduction work plan, based on the waste audit, to reduce, reuse
and recycle waste generated by the operation of the establishment.
(2) In every year following the preparation of the initial waste reduction work plan, the owner shall prepare an
updated written plan. O. Reg. 102/94, s. 58.
59. The owner shall implement the waste reduction work plan as updated. O. Reg. 102/94, s. 59.
60. The waste reduction work plan shall include measures for communicating the plan to the owner’s employees
who work at the site and, as a minimum, those measures shall require,
(a) that the plan or a summary be posted in places where most employees will see it; and
(b) if a summary is posted, that any employee who requests to look at the plan be allowed to do so. O. Reg.
102/94, s. 60.
According to ONTARIO REGULATION 103/94 “Industrial, Commercial and
Institutional Source Separation Programs” “Educational Institutions” need to have a
source separation program.
2.0 Current Situation
2.1 Description of Waste Generation
Waste is produced through normal and typical student and staff activities. A key
management decision that affects the production of waste has been to try and divert
wastes from landfill, to the extent possible through various waste diversion programs
(e.g. recycling and composting). Where possible, materials used by Humber consist
of recycled or reused materials or products.
There are a number of events and educational information regarding waste programs
available to students. During Earth Week in 2016 at the end of March, the annual
campus cleanup was held to get students involved in the various waste programs
available at the school. This events gets students and staff together to clean up their
shared space on campus and in the community at both the North and Lakeshore
campuses. Information about the waste programs is also available on the Humber
website and articles about waste programs are often written in the student
newspaper. In 2016, Humber started a paper use campaign to reduce the amount of

March 2017 Final Humber College Page 3 of 27
Waste Audit and Waste Reduction Work Plan
paper that was being used at printing labs, offices, and other areas on campus. This
included decals with the message “paper can’t save itself”.
There are a number of areas at Humber that result in waste generation.
Common Areas
Wastes that are generated by students and staff are discarded at centralized areas
in the common areas (Photo 3). This includes wastes that are generated in classes
(i.e. typically no waste bins in classes) as well as from consumption of food and some
waste from offices. The three-in-one waste bins (garbage, recyclables, and paper) that
were installed in 2009 and with coloured decals are still in use as they have led to
good feedback and participation.
There are also waste bins in outdoor common areas. In some, but not all cases, these
outdoor bins are twinned with recycling bins (Photo 4).
Photo 3. Common Area Waste and Recycling Bins
Photo 4. Common Area Outdoor Waste and Recycling Bins – Lakeshore Campus

March 2017 Final Humber College Page 4 of 27
Waste Audit and Waste Reduction Work Plan
Food Court and Food Outlets
There are a number of food court areas and food outlets at both campuses (Photo 5).
In these areas, the 3- in-1 bins are also used to collect waste and recyclables, along
with a number of custom recycling stations that collect waste, recycling, paper, and
liquids. These recycling stations are in the cafeterias of both campuses (Photo 6).
Photo 5. Cafeteria Area – North Campus
Photo 6. Composting by Food Outlets
Kitchens
At the North Campus, there are extensive teaching kitchens for the Hospitality,
Recreation and Tourism programs (e.g. culinary management, culinary skills). There
is a composting program in place to collect pre-consumer organic wastes from these
kitchens. As well, pre-consumer food waste from the various kitchens of food serving
areas is also collected for composting both in the North and Lakeshore Campuses
and the Tim Hortons and Starbucks locations on campus. Photos 7 and 8 depict the
types of carts used to collect food wastes and the types of food wastes collected in
these carts.

March 2017 Final Humber College Page 5 of 27
Waste Audit and Waste Reduction Work Plan
Photo 7. Food Collection and Recycling Bins Photo 8.Food Wastes in Cart
Offices
Typical office waste (paper products, meal leftovers) are produced in the offices. Most
desks have small blue bins to collect recyclables such as paper. In some cases, these
wastes and recyclables are collected in the office. In other cases, staff brings wastes
and recyclables to common areas (described above) for disposal. A small number of
offices have been using organic waste collection bins in their kitchens.
Residences
Humber has a number of student residences. Residential type waste is produced
including various paper streams, beverage containers and organic wastes.
Waste and recyclables are collected by janitorial staff and directed to the central
waste areas. Pre-consumer food waste is collected in the North Campus Residence,
which has one cafeteria in the building with its own recycling centre with separated
liquid and recycling collection.
2.2 Current Source Separation Programs
Humber has an extensive source separation program in place that goes beyond
regulatory requirements. Table 2.1 depicts the types of wastes for which Humber has
a source separation program and compares them to Regulation 103/94
requirements.
In February 2016, Humber switched waste service providers and garbage and
recycling at the Lakeshore Campus which is now collected by Canada Fibers. This is
the same collection provider as the North Campus. Recycling is all single stream and
the dual stream containers in use around campus (fibers and containers) are
combined in the receiving areas.

March 2017 Final Humber College Page 6 of 27
Waste Audit and Waste Reduction Work Plan
Table 2.1 Wastes Source Separated at Humber
Category Humber Reg.
103/94
Method of Collection
1. Cardboard (corrugated)
(OCC) Directed to compactors at North Campus
Directed to front end bins at Lakeshore
Campus
2. Fine paper Directed to 360 litre carts at both North and
Lakeshore campuses
Also directed to compactor at North Campus
Carts and compactors emptied by Canada
Fibers at both campuses
3. Newsprint Directed to 360 litre carts at both North and
Lakeshore campuses
Also directed to compactor at North Campus
Carts and compactors emptied by Canada
Fibers at both campuses
4. Aluminum Beverage and
Food Containers Directed to a bin
Compactors at north
Front end bins at Lake
5. Steel Beverage and Food
Containers Directed to a bin
Compactors at north
Front end bins at Lake
6. Glass Beverage and Food
Containers Directed to a bin
Compactors at north
Front end bins at Lake
7. Plastic Beverage and
Food Containers Directed to a bin
Compactors at north
Front end bins at Lake
8. Food waste Directed to wheeled carts (both campuses pre
and post-consumer)
9. Waste Cooking Oil Directed to Waste Cooking Oil Bin (both
campuses)
10. Metal Directed to Metal bin (North campus only)
As needed on call at Lakeshore
11. Wood Directed to Wood bin (North campus only)
As needed on call at Lakeshore
12. Computers (E-Waste) Initiated a program in 2008 to divert computers
and other college e-waste for re-use. Computers
generated at Lakeshore Campus taken to North
Campus for recycling.
Twice a year e-waste collection week done for
community drop off.
13. Toner Empty toner cartridges are collected and sent
away for recycling
14. Batteries Batteries are collected at North and Lakeshore
campus for recycling
15. Leaf and Yard Waste Collected by maintenance staff for on-site
composting and reuse
Pen recycling Yes Use teracycle program
Textbooks Yes Use Textbooks for change for collection

March 2017 Final Humber College Page 7 of 27
Waste Audit and Waste Reduction Work Plan
2.3 Current Waste Handling
Wastes are collected from their generation points by Humber janitorial staff and
taken to central waste management locations.
At the North Campus and Lakeshore Campus there are two main areas each where
wastes are gathered prior to removal from the site. These are described in Table 2.2.
Lift frequency has been tracked since switching to a private hauler for all waste and
recycling.
Waste removal has been consolidated for the two campuses. At both the North and
Lakeshore Campuses, wastes and recyclables are removed by a private sector
contractor. Some equipment may have been changed between contractors.
Table 2.2 Overview of Waste Removal from Humber in 2016 Depot Material Equipment Lift Frequency
(#/year)
Contractor
North Campus
Depot # 1
(110 Carrier
Dr)
Garbage 8 cu. yd. open top bin 46 Canada Fibers
Cardboard 8 cu. yd. slot bin 18 Canada Fibers
Mixed Containers 20 cu. yd. side door bin 3 Canada Fibers
Wood 8 cu. yd. open top
6 cu. yd. open top
29
24
Canada Fibers
Canada Fibers
Metal 20 cu. yd. open top 12 Canada Fibers
Sawdust 8 cu. yd. 12 Canada Fibers
Waste Cooking Oil 2-45 gal drums 2 Rothsay
Depot # 2
(205 Humber
College Blvd)
Garbage 40 cu. yd. compactor screw
20 cu. yd. open top bin
(furniture)
30 cu. yd. compactor (res)
73
32
19
Canada Fibers
Canada Fibers
Canada Fibers
Cardboard 40 cu. yd. compactor
40 cu. yd. compactor (res)
22
3
Canada Fibers
Canada Fibers
Mixed Containers 40 cu. yd. compactor
20 cu. yd. compactor (res)
24
17
Canada Fibers
Canada Fibers
Organic Waste 20-32 Gal totes
3-32 Gal totes
Daily
Daily
Canada Fibers
Canada Fibers
Waste Cooking Oil 1-2.5cu. yd. bin
1-45 Gal barrel (res)
2
4
Rothsay
Rothsay
Wood 14 cu. yd. open top bin 19 Canada Fibers
Metal 14 cu. yd. open top bin 15 Canada Fibers
Yard Waste 14 cu. yd open top bin ~10 Canada Fibers
Shredded Paper 47- 65 gal totes ~40 Iron Mountain
Carpet By project Varies Malton Flooring
Sweepings/Grounds 1 cu. yd locked bin ~13 Canada Fibers
Lakeshore Campus Depot # 1
West Campus
Garbage 2-3cu. yd. front end bins
(compacted)
3-8 cu. yd. front end bins
104
104
Canada Fibers

March 2017 Final Humber College Page 8 of 27
Waste Audit and Waste Reduction Work Plan
Depot Material Equipment Lift Frequency
(#/year)
Contractor
Recycling
(single stream)
3-3 cu. yd. front end bins
(compacted)
2-8 cu. yd. front end bins
52
52
Canada Fibers
Paper 13-95 Gal totes weekly Canada Fibers
Waste Cooking Oil 1-200 gal bin 2 Rothsay
Organic Waste 10-32 Gal totes 2x/week Canada Fibers
Shredded Paper 17- 65 gal totes ~40 Iron Mountain
Depot #2
East Campus
Garbage 5-6 cu. yd. front end bins 52 Canada Fibers
Recycling
(single stream) 3-8 cu. yd. front end bin 52
Canada Fibers
Organic Waste 10-32 Gal totes 2x/week Canada Fibers
Paper 7-95 Gal totes Weekly
Canada Fibers
Waste Cooking Oil 1-200 gal bin 2 Rothsay
*Note: U Pak was waste hauler until February 2016, then switched to Canada Fibers
2.4 Overview of Waste Generation
Annual waste generation at Humber is depicted in Table 2.3. This table is split into
the North Campus, Lakeshore Campus and Total waste and recyclables generation.
Weight data was provided for the North and Lakeshore campuses for waste to landfill
and some waste diversion activities. Some weights for waste diversion activities were
estimated such as yard waste. Some volumes were estimated from the Lakeshore
campus from October to February when Canada Fibers was not in charge of their
waste removal. In that case, estimated volumes removed and waste densities were
used to help develop estimates as required.
In 2016, Humber will have generated an estimated 1,948 tonnes of waste (disposed
and recycled). Of that, an estimated 1,231 tonnes was recycled and 717 tonnes sent
to landfill. This works out to an average of 14 tonnes of waste and 24 tonnes of
recyclables generated weekly.

March 2017 Final Humber College Page 9 of 27
Waste Audit and Waste Reduction Work Plan
Table 2.3 Summary of Waste Generation in 2016
Based on available data the North Campus has a higher waste generation and waste
diversion rate (66%) than Lakeshore Campus (55%). Both campuses have the same
waste and recycling programs and the difference can be attributed to natural
variability and student engagement. Overall, Humber has a greatly improved waste
diversion rate of about 63% compared to 55% in 2015. Waste generation has
decreased with better measurement. There was also a slight increase in recycling.
3.0 Methodology
3.1 Waste Auditing
On 5-6 November 2016 a waste audit was undertaken to assess the composition of
waste and recyclables from a one day period (4 November from both the North and
Lakeshore Campuses). As depicted in Table 3.1, representative samples of wastes
and recyclables were collected from the North Campus and Lakeshore Campus, by
Humber staff, and delivered to a sorting area at North Campus.
The waste audit focused on understanding the waste composition at three main
waste generating areas:
Common areas;
Food preparation areas; and
Residences.
All data was compiled to provide an overall overview of waste composition.
North
Campus
Lakeshore
Campus Total
North
Campus
Lakeshore
Campus Total
North
Campus
Lakeshore
Campus Total
Waste 523.1 395.5 918.6 514.7 305.5 820.2 506.3 211.0 717.3
Recyclables
Cardboard 79.3 3.3 82.6 83.0 0.0 83.0 73.0 6.6 79.6
Mixed Containers 11.1 - 11.1 0.0 0.0 0.0 46.4 104.6 151.0
Fine Mixed Papers 57.3 - 57.3 59.6 4.0 59.6 164.3 49.6 213.9
Single Stream Recycling 101.8 190.4 292.2 107.0 103.9 210.9 0.0 0.0 0.0
Shredded Paper 79.2 19.6 98.8 85.2 21.3 106.6 112.8 24.1 136.9
Organic Waste 162.6 54.5 217.1 244.7 79.1 323.8 261.0 0.6 261.6
Waste Cooking Oil 4.3 0.7 4.9 4.1 1.2 5.3 3.6 0.8 4.4
Wood 57.3 1.0 58.3 82.2 0.0 82.2 107.2 0.0 107.2
Metal 41.1 0.7 41.9 35.5 0.0 35.5 64.4 0.0 64.4
Yard Waste/Clean Fill 1.8 65.4 67.2 2.2 0.0 2.2 25.0 0.0 25.0
E-Waste 19.4 5.6 25.0 19.3 6.4 25.7 18.5 13.3 31.8
Lamps 1.7 0.6 2.3 0.3 0.2 0.5 0.3 0.2 0.5
Carpet 1.3 - 1.3 13.7 0.0 13.7 6.0 6.0 12.0
Batteries 0.1 - 0.1 0.2 0.0 0.2 0.1 0.1 0.2
Toner 2.2 0.5 2.6 1.5 0.8 2.3 1.7 1.2 2.8
Donations 52.9 51.6 104.5 49.3 0.0 49.3 34.5 34.5 69.1
C&D Waste 0.0 1.0 0.6 1.6 49.55 20.83 70.4
Total 673 394 1067.3 789 218 1006.2 968 262 1230.9
Grand Total 1,196.6 789.4 1,986.0 1,303.3 523.1 1,826.4 1,474.7 473.4 1,948.2
Diversion Rate (%) 56.3 49.9 53.7 60.5 41.6 55.1 65.7 55.4 63.2
Tonnes 2014 Tonnes 2015 Tonnes 2016

March 2017 Final Humber College Page 10 of 27
Waste Audit and Waste Reduction Work Plan
Table 3.1 Waste Generating Areas and Samples Collected
*the colours in the table indicate the color of bag used for each location
The following equipment was utilized to undertake waste auditing:
Sorting table;
30 blue boxes;
Black plastic bags;
Exacto-knives;
Weigh scale; and
Generating Area Specific Location
Number of
Trisorter bins
A: Common Areas Waste Recycling Paper
Athletics Near ping pong tables, 2nd floor and near gym 1st floor 3 3 3 3
Building L Anywhere 3 3 3 3
Building N Anywhere 3 3 3 3
Building D Registration: D-129 OR D-128 OR D-130 3 3 3 3
Building B B-104 and B second floor 3 3 3 3
Guelph Humber Second floor near study area 3 3 3 3
Extra bags to be put in any of the above locations - 5 5 4
B: Food Areas Waste Recycling Paper
Food Emporium/Cafeteria Any 4 4 4 4
Ackee Tree (food café) E building First floor 2 2 2 2
Java Jazz Bookstore and/or HSF side 3 3 3 3
Guelph Humber Second floor near Williams café/sutdy area 3 3 3 3
Athletic Building A Near Second Cup & Pizza Pizza 2 2 2 2
Extra bags to be put in any of the above locations - 5 5 4
C: Residence Waste Recycling Paper
Cafeteria "food area" 1st floor 4 4 4 4
Common Area R Building 6th floor all bins all all all
Common Area S Building any all bins all all all
Extra bags to be put in any of the above locations - 3 3 3
Generating Area Sepcific Location
Number of
Trisorter bins
A: Common Areas Waste Recycling Paper
Building H Anywhere 3 3 3 3
Building L (not cafeteria) Computers/study common area 3 3 3 3
Building B Anywhere 3 3 3 3
Building C Hallway 3 3 3 3
Extra bags to be put in any of the above locations - 3 3 3
B: Food Areas Waste Recycling Paper
Building A Cafeteria Anywhere in this area 3 3 3 3
Building L Cafeteria Anywhere in this area 4 4 4 4
Building F Basement Café 2 2 2 2
Extra bags to be put in any of the above locations 3 3 3
C: Residence Waste Recycling Paper
Building R Any lounge areas all bins all all all
SUM TOTAL 57 73 73 71
Number of each stream to
be collected from this bin
NORTH CAMPUS
LAKESHORE CAMPUSNumber of each stream to
be collected from this area
2016

March 2017 Final Humber College Page 11 of 27
Waste Audit and Waste Reduction Work Plan
Safety equipment (Tyvek suits, cut resistant gloves, safety boots, safety
glasses, hearing protection).
Table 3.2 depicts general waste auditing categories. Waste was identified and sorted
into various categories to mimic O. Reg. 103/94 source separation requirements,
current recycling programs and other common waste types.
A waste auditing crew of three people was used to sort wastes. Weights of each
category were taken and recorded. Data was entered into a spreadsheet for data
analysis. All weighing was completed in kilograms.
Table 3.2 Description of Waste Auditing Categories
Number Main Category Sub Categories
1. Paper
Newsprint
Office (fine) paper
Mixed paper (Office)
Paper beverage cups
Tissue/paper toweling
Mixed paper (food)
Other paper
Gable top & aseptic beverage containers
2. Cardboard/Boxboard
3. Plastic
Plastic beverage bottles
Rigid Plastic Recyclables
Polystyrene
Garbage Bags
Other Plastic
4. Glass Bottles and Jars
5. Metal Steel cans
Aluminum cans
Other metal
6. Organics Food waste
7. Other Waste Floor sweepings, textiles, miscellaneous waste
3.2 Development of Waste Reduction Work Plan
Using the results of this waste audit and other information, a new waste reduction
work plan was developed.
4.0 Waste Audit Results
It should be noted from the outset that these results represent a “snap-shot” in time.
Any extrapolations of this data are indicative rather than absolute. A representative
sample of waste generated on 4 November and destined for the landfill or recycling
was fully audited. A total of approximately 199 kg of waste and 178 kg of recyclables
were sorted.

March 2017 Final Humber College Page 12 of 27
Waste Audit and Waste Reduction Work Plan
4.1 North Campus
4.1.1 North Campus Common Areas
Figure 4.1 depicts the waste composition of the Common Areas’ waste stream. Table
4.1 depicts the waste audit results in Appendix 1. Approximately 34 kg of waste was
audited.
The most prevalent wastes included organics, paper and plastic.
The organic waste consisted of avoidable food waste such as beverages, leftover
lunches, and snacks, and the unavoidable food waste such as tea bags. The paper
sorted consisted mainly of paper towels (Photo 13), food paper, and beverage cups.
The plastics category consisted of “other plastic”, rigid plastic recyclables, and
garbage bags.
The remainder of the waste consisted of cardboard/boxboard, “other” waste (dust
and sweepings, vinyl gloves), metal and glass.
Photo 13. Paper Towels

March 2017 Final Humber College Page 13 of 27
Waste Audit and Waste Reduction Work Plan
Figure 4.1 Waste Composition for North Campus Common Areas
4.1.2 North Campus Food Serving Areas
Figure 4.2 depicts the waste composition of the Food Serving Areas’ garbage stream.
Table 4.1 depicts the waste audit results in Appendix 1. Approximately 58 kg of waste
was audited.
The most prevalent wastes included organics, paper, plastic and other waste.
The organic waste consisted of avoidable food waste such as unfinished lunches,
whole fruit including bananas and apples, and beverage liquids, and unavoidable food
waste such as fruit peelings, and coffee grounds. The paper sorted consisted of mixed
food paper, paper towels, beverage cups (Photo 14), and office (fine) paper. Most of
the plastics category consisted of rigid plastic recyclables, garbage bags and “other”
plastic.
The remainder of the waste consisted of other waste (mop, textiles, gloves, pens),
cardboard/boxboard and metal.
Paper26%
OCC & Boxboard3%
Plastic18%
Glass1%
Metal1%
Organic Waste49%
Other Waste2%

March 2017 Final Humber College Page 14 of 27
Waste Audit and Waste Reduction Work Plan
Photo 14. Beverage Cups
Figure 4.2 Waste Composition for North Campus Food Serving Areas
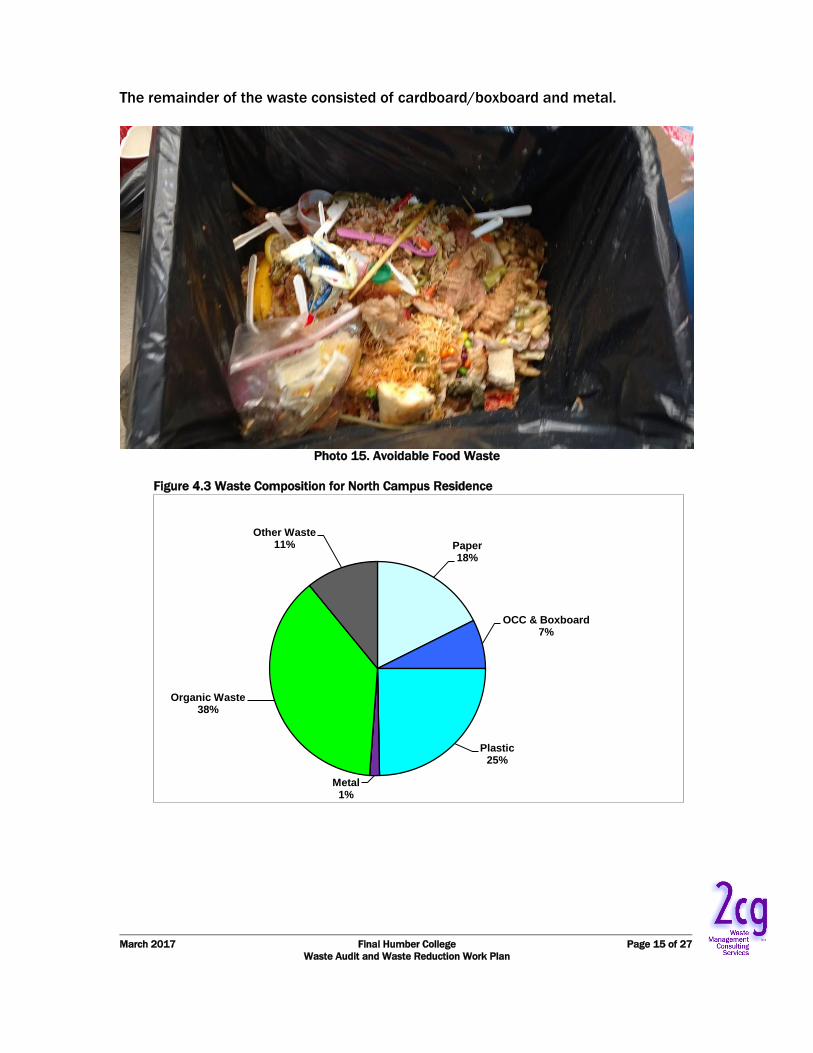
4.1.3 North Campus Residence
Figure 4.3 depicts the waste composition of the Residence waste stream. Table 4.1
depicts the waste audit results in Appendix 1. Approximately 47 kg of waste was
audited.
The most prevalent wastes included organic waste, plastic, paper and other waste.
The organic waste consisted of avoidable food waste such as leftover rice and bakery
products and beverage liquids (Photo 15), and unavoidable food waste such as fruit
and vegetable peels. The plastic sorted consisted of other plastic, rigid plastic
recyclables, garbage bags and plastic beverage bottles. The paper sorted consisted
of paper towels, mixed food paper, beverage cups, and gable top & aseptic
containers. The other waste consisted of shoes, textiles, and floor sweepings.
Paper21%
OCC & Boxboard3%
Plastic19%
Metal2%
Organic Waste42%
Other Waste10%
March 2017 Final Humber College Page 15 of 27
Waste Audit and Waste Reduction Work Plan
The remainder of the waste consisted of cardboard/boxboard and metal.
Photo 15. Avoidable Food Waste
Figure 4.3 Waste Composition for North Campus Residence
Paper18%
OCC & Boxboard7%
Plastic25%
Metal1%
Organic Waste38%
Other Waste11%

March 2017 Final Humber College Page 16 of 27
Waste Audit and Waste Reduction Work Plan
4.2 Lakeshore Campus
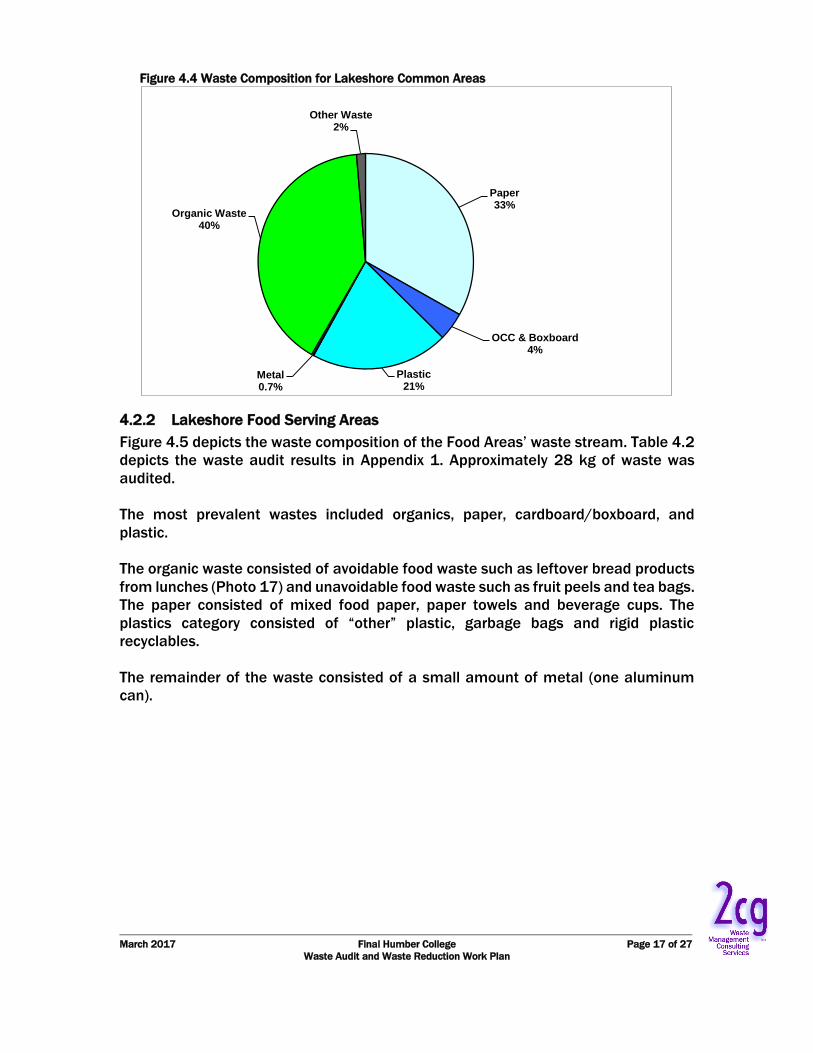
4.2.1 Lakeshore Common Areas
Figure 4.4 depicts the waste composition of the Common Areas’ garbage stream.
Table 4.2 depicts the waste audit results in Appendix 1. Approximately 20 kg of waste
was audited.
The most prevalent wastes included organics, paper, and plastic.
The organics consisted of avoidable food waste such as snacks, fruit, and fries, and
unavoidable food waste such as fruit peelings and coffee grounds. The paper sorted
consisted of mixed food paper, beverage cups, paper towels and fine office paper
(Photo 16). The plastics category consisted of other plastic, garbage bags, rigid plastic
recyclables and plastic beverage bottles.
The remainder of the waste consisted of cardboard/boxboard, “other” waste and
metal.
Photo 16. Fine Office Paper
March 2017 Final Humber College Page 17 of 27
Waste Audit and Waste Reduction Work Plan
Figure 4.4 Waste Composition for Lakeshore Common Areas
4.2.2 Lakeshore Food Serving Areas
Figure 4.5 depicts the waste composition of the Food Areas’ waste stream. Table 4.2
depicts the waste audit results in Appendix 1. Approximately 28 kg of waste was
audited.
The most prevalent wastes included organics, paper, cardboard/boxboard, and
plastic.
The organic waste consisted of avoidable food waste such as leftover bread products
from lunches (Photo 17) and unavoidable food waste such as fruit peels and tea bags.
The paper consisted of mixed food paper, paper towels and beverage cups. The
plastics category consisted of “other” plastic, garbage bags and rigid plastic
recyclables.
The remainder of the waste consisted of a small amount of metal (one aluminum
can).
Paper33%
OCC & Boxboard4%
Plastic21%
Metal0.7%
Organic Waste40%
Other Waste2%

March 2017 Final Humber College Page 18 of 27
Waste Audit and Waste Reduction Work Plan
Photo 17. Avoidable Food Waste
Figure 4.5 Waste Composition for Lakeshore Food Serving Areas
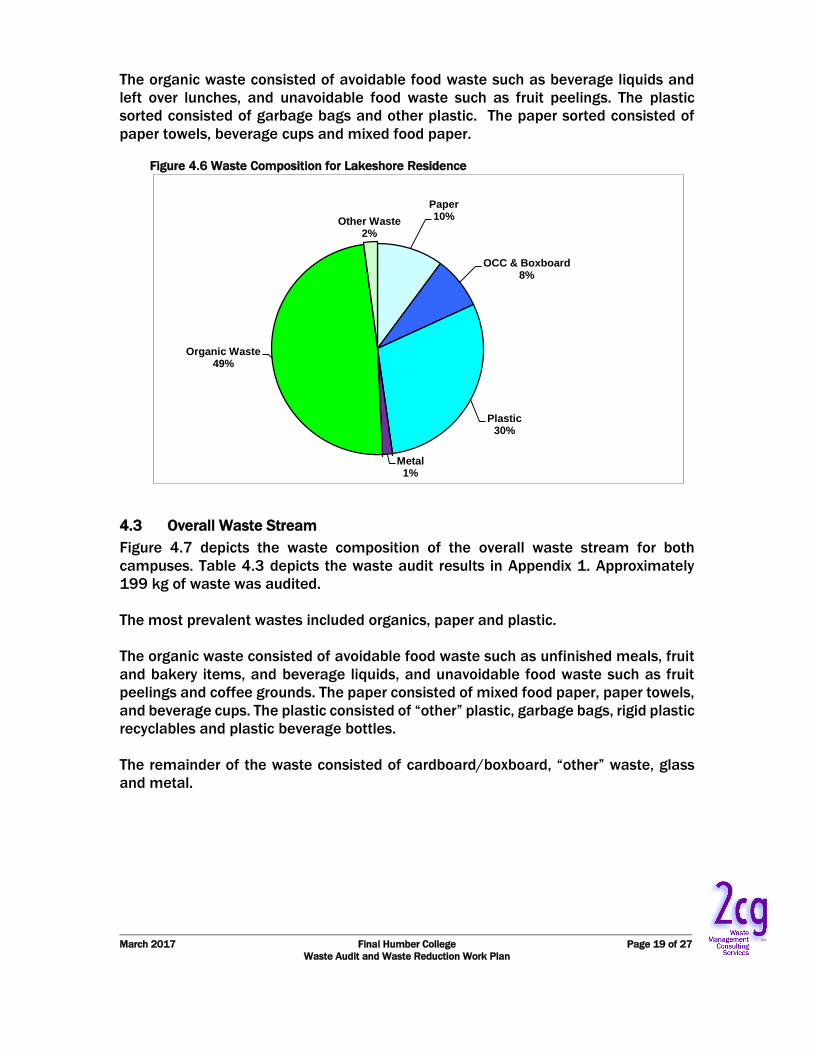
4.2.3 Lakeshore Residence
Figure 4.6 depicts the waste composition of the Residence waste stream. Table 4.2
depicts the waste audit results in Appendix 1. Approximately 12 kg of waste was
audited.
The most prevalent wastes included organic waste, plastic, and paper.
Paper18%
OCC & Boxboard17%
Plastic15%Metal
0.3%
Organic Waste50%
March 2017 Final Humber College Page 19 of 27
Waste Audit and Waste Reduction Work Plan
The organic waste consisted of avoidable food waste such as beverage liquids and
left over lunches, and unavoidable food waste such as fruit peelings. The plastic
sorted consisted of garbage bags and other plastic. The paper sorted consisted of
paper towels, beverage cups and mixed food paper.
Figure 4.6 Waste Composition for Lakeshore Residence
4.3 Overall Waste Stream
Figure 4.7 depicts the waste composition of the overall waste stream for both
campuses. Table 4.3 depicts the waste audit results in Appendix 1. Approximately
199 kg of waste was audited.
The most prevalent wastes included organics, paper and plastic.
The organic waste consisted of avoidable food waste such as unfinished meals, fruit
and bakery items, and beverage liquids, and unavoidable food waste such as fruit
peelings and coffee grounds. The paper consisted of mixed food paper, paper towels,
and beverage cups. The plastic consisted of “other” plastic, garbage bags, rigid plastic
recyclables and plastic beverage bottles.
The remainder of the waste consisted of cardboard/boxboard, “other” waste, glass
and metal.
Paper10%
OCC & Boxboard8%
Plastic30%
Metal1%
Organic Waste49%
Other Waste2%

March 2017 Final Humber College Page 20 of 27
Waste Audit and Waste Reduction Work Plan
Figure 4.7 Overall Waste Composition
4.4 Recycling
A total of 178kg of recyclables (paper and containers) was sorted from both
campuses.
Table 4.1 depicts overall recycling composition at North and Lakeshore Campus on a
percentage basis.
Overall the recycling consisted of 18% recyclable paper, 9% cardboard/boxboard,
22% recyclable food and beverage containers and 52% other waste (i.e.
contamination). All locations had fairly high contamination rates (other waste)
consisting of organic wastes, non-recyclable plastics, and non-recyclable paper .
Paper21%
OCC & Boxboard7%
Plastic20%
Glass1%
Metal1%
Organic Waste44%
Other Waste6%
March 2017 Final Humber College Page 21 of 27
Waste Audit and Waste Reduction Work Plan
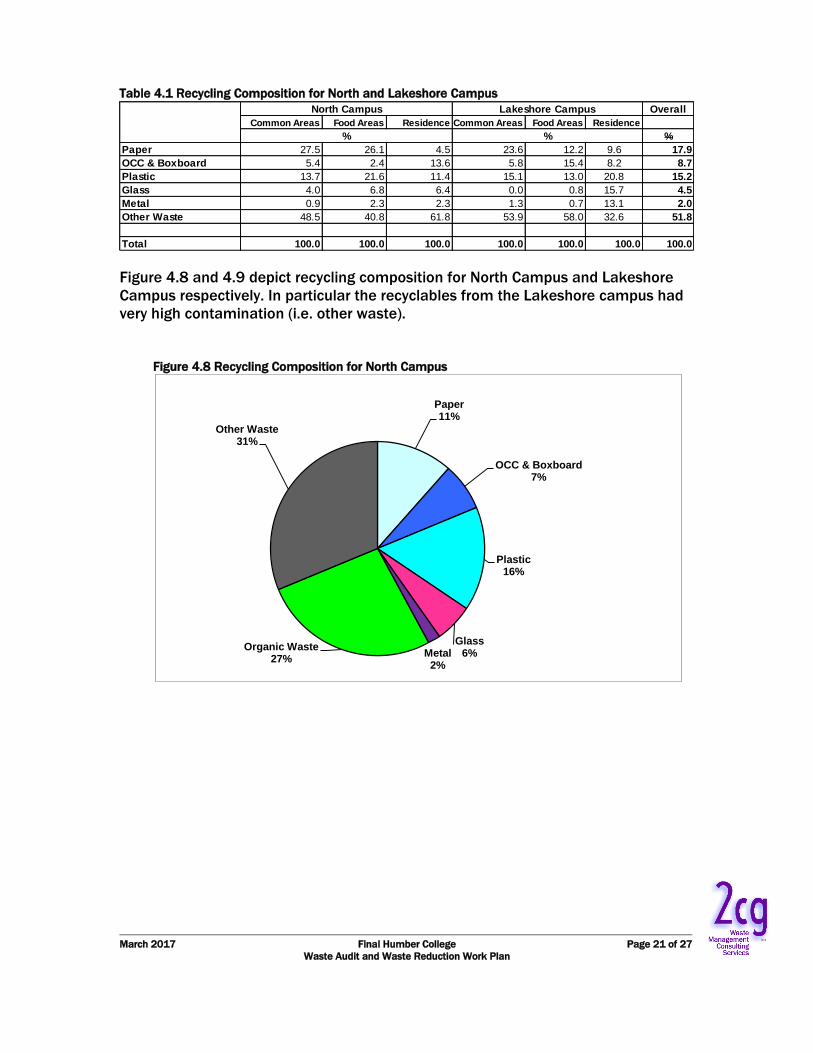
Table 4.1 Recycling Composition for North and Lakeshore Campus
Figure 4.8 and 4.9 depict recycling composition for North Campus and Lakeshore
Campus respectively. In particular the recyclables from the Lakeshore campus had
very high contamination (i.e. other waste).
Figure 4.8 Recycling Composition for North Campus
Overall
Common Areas Food Areas Residence Common Areas Food Areas Residence
%
Paper 27.5 26.1 4.5 23.6 12.2 9.6 17.9
OCC & Boxboard 5.4 2.4 13.6 5.8 15.4 8.2 8.7
Plastic 13.7 21.6 11.4 15.1 13.0 20.8 15.2
Glass 4.0 6.8 6.4 0.0 0.8 15.7 4.5
Metal 0.9 2.3 2.3 1.3 0.7 13.1 2.0
Other Waste 48.5 40.8 61.8 53.9 58.0 32.6 51.8
Total 100.0 100.0 100.0 100.0 100.0 100.0 100.0
%
North Campus Lakeshore Campus
%
Paper11%
OCC & Boxboard7%
Plastic16%
Glass6%Metal
2%
Organic Waste27%
Other Waste31%
March 2017 Final Humber College Page 22 of 27
Waste Audit and Waste Reduction Work Plan
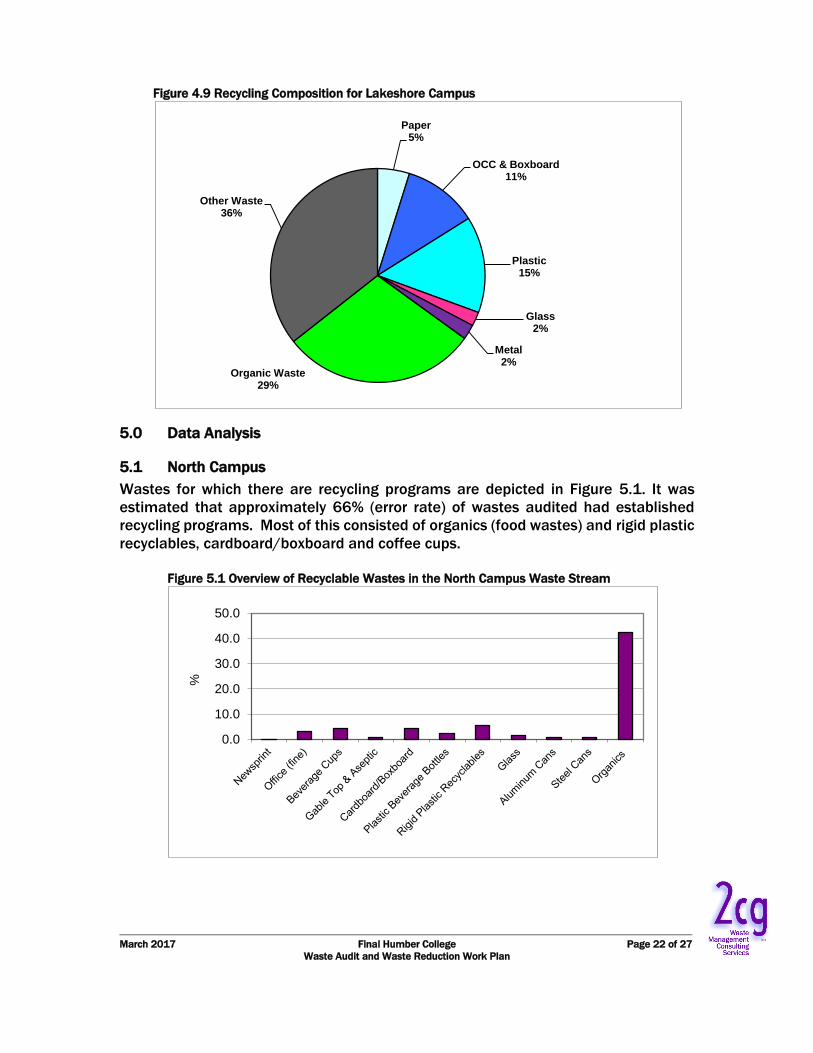
Figure 4.9 Recycling Composition for Lakeshore Campus
5.0 Data Analysis
5.1 North Campus
Wastes for which there are recycling programs are depicted in Figure 5.1. It was
estimated that approximately 66% (error rate) of wastes audited had established
recycling programs. Most of this consisted of organics (food wastes) and rigid plastic
recyclables, cardboard/boxboard and coffee cups.
Figure 5.1 Overview of Recyclable Wastes in the North Campus Waste Stream
Paper5%
OCC & Boxboard11%
Plastic15%
Glass2%
Metal2%
Organic Waste29%
Other Waste36%
0.0
10.0
20.0
30.0
40.0
50.0
%

March 2017 Final Humber College Page 23 of 27
Waste Audit and Waste Reduction Work Plan
5.2 Lakeshore Campus
Wastes for which there are recycling programs are depicted in Figure 5.2. It was
estimated that approximately 71% (error rate) of wastes audited had established
recycling programs. There was a significant amount of organic waste (46%) and
cardboard/boxboard (11%) present in the waste stream.
Figure 5.2 Overview of Recyclable Wastes in the Lakeshore Campus Waste Stream
5.3 Overall (North and Lakeshore Campus)
Figure 5.3 depicts wastes for which there are recycling programs for both campuses.
It was estimated that approximately 68% (error rate) of wastes audited had
established recycling programs. There was a significant amount of organic waste
(44%) present in the waste stream.
Figure 5.3 Overview of Recyclable Wastes in the Overall Waste Stream
0.05.0
10.015.020.025.030.035.040.045.050.0
%
0.0
10.0
20.0
30.0
40.0
50.0
%

March 2017 Final Humber College Page 24 of 27
Waste Audit and Waste Reduction Work Plan
Table 5.1 depicts the current capture rate of various waste streams for which there
are recycling programs. It is estimated that approximately 486 tonnes of potential
recyclables are found in the waste stream annually and landfilled. It is possible to
divert up to an additional 313 tonnes of organics annually through a more efficient
composting program across both campuses.
Table 5.1 Estimated Capture Rates of Recyclables
5.4 Comparison to 2014 and 2015 Waste Audits
The total amount of waste generated over the past three years was 1,986 tonnes in
2014, 1,826 tonnes in 2015 and 1,948 tonnes for this waste audit. The estimated
waste diversion rate for the 2016 waste audit was 63% across both campuses
compared to 54% in 2014 and 55% in 2015. The increase can be attributed to an
improvement in sorting and diversion, along with better tracking of weights through
a new private collections contractor.
In terms of waste composition the results of both campuses were improved from
2015. In 2016, there were less waste sent to landfill although there was less organic
waste diverted through composting programs. There were more donations, electronic
waste, construction and demolition waste, metal and wood that were diverted
through school programs. Recyclable containers and paper have essentially
remained the same.
6.0 Waste Reduction Work Plan and Recommendations
The time-line for the previous waste reduction work plan was from 1 January 2014 to
1 January 2017.
The following goals were set:
Decrease overall waste generation by 20%
Increase waste diversion rate to 60%
As of 2016, overall waste generation was reduced by 3% so the overall waste
generation goal was not achieved. It is important to note, however, that the amount
of waste to landfill was reduced by approximately 13% and the amount of wastes
recycled increased by almost 12% from 2015.
A new waste reduction work plan has been developed for 1 January 2017 to 1 January
2019.
Recycled Landfilled (Audit) Capture Rate (%) Landfilled (Audit)
tonnes/year
Cardboard 218.1 126.9 63.2 46.3
Paper 960.9 53.0 94.8 19.4
Food & Beverage Containers 413.7 292.5 58.6 106.8
Organics 716.8 858.0 45.5 313.2
Total 485.6
kg/day

March 2017 Final Humber College Page 25 of 27
Waste Audit and Waste Reduction Work Plan
The tracking of garbage and recycling has improved since 2012. As well, Humber has
implemented some new waste diversion opportunities and created educational
material to inform students about waste management and diversion programs.
To facilitate continuous improvement, it is recommended that Humber set a goal and
engage in a process to:
Decrease waste generation by 10% (using this waste audit as a baseline)
Increase waste diversion rate to 65%
This work plan sets out the framework to meet this goal.
6.1 General Initiatives
In 2016, it was estimated that Humber generated an estimated 1,948 tonnes of
waste (disposed and recycled). Of that, an estimated 1,231 tonnes was recycled and
717 tonnes sent to landfill. Based on this data, Humber has a waste diversion rate
of about 63%.
In 2016 it is estimated that approximately 66% of wastes at North Campus and 25%
of wastes at the Lakeshore campus destined for landfill are readily recyclable with
existing programs. Based on the waste audit results, an estimated 486 tonnes of
wastes which are currently landfilled is potentially available for additional diversion.
This includes 313 tonnes of organic waste that could be diverted through an improved
organic waste composting program.
Estimates continue to be generated for some waste and recyclable streams at the
Lakeshore Campus (construction and demolition waste, yard waste, metal and wood
waste). This is due to a lack of infrastructure and space at the Lakeshore Campus. All
other streams and locations have documentation of weights in place. For the
Lakeshore Campus location, it is recommended that Humber staff continue to
improve the documentation these waste diversion activities to improve the accuracy
of future waste diversion rate calculations as much as possible.
In general, it is recommended that Humber continue to update its communications
and education material annually (e.g. for Earth Week). It is important that Humber
report on progress and provide a “call to action” for students and employees on how
they can best participate.
According to Ontario Regulation 102/94 the waste reduction work plan should have
regard to:
Reduction as the first objective;
Re-use as the next objective; and
Recycling as the final objective.

March 2017 Final Humber College Page 26 of 27
Waste Audit and Waste Reduction Work Plan
To facilitate continuous improvement it is recommended that Humber undertake
the following efforts to reduce, re-use and recycle wastes:
6.2 Reduction Initiatives
A key waste stream that could be targeted for reduction could be:
Organic wastes make up about 44% of the waste stream. While considerable
amounts of food waste are unavoidable (e.g peelings, trimmings) a considerable
amount of edible food waste could be reduced. It is recommended that a
communications and education program be developed to encourage their reduction
through better use/consumption of food.
Recyclable Beverage and food containers currently make up about 9% of the waste
stream. This includes coffee cups, gable top and aseptic containers, as well as plastic,
glass and metal containers. It is recommended that a communications and education
program be developed to encourage their reduction through the use of re-usable
beverage containers.
6.3 Re-Use Initiatives
In 2016, Humber reused as much old furniture and renovation materials as possible
before sending them for reuse through their private contractor.
It is recommended that Humber continue to identify and implement re-use
opportunities within the Humber community as well as the broader community.
6.4 Recycling Initiatives
The greatest unrealized recycling opportunity is with organic wastes. While programs
are in place, only an estimated 43% is currently captured. It is recommended that
communications and education materials be developed that specifically addresses
using available recycling opportunities when disposal is unavoidable (this would
complement the program developed for reducing food waste as noted in Section 6.2).
It is recommended that the existing composting program at both campuses be
improved. Pre consumer food waste is collected in food preparation areas. Organic
bins are available at food outlets and in the cafeteria, along with some offices, to
capture post-consumer food waste. Students need to be made aware of this
opportunity and the impact it has on waste diversion as a whole. Additionally, waste
bins need to be emptied regularly so overflow does not get placed in the recycling or
organic bins, thus contaminating these diversion streams. It is recommended that
Humber focus on improving the usage of the composing programs at both campuses.
It is recommended that communications and education materials continue to be
developed, implemented and improved to promote Humber’s various recycling
programs.
6.5 Implementation Plan
The work will be coordinated by:

March 2017 Final Humber College Page 27 of 27
Waste Audit and Waste Reduction Work Plan
Ms. Lindsay Walker, Sustainability Manager, Humber College
The work includes Humber staff meeting with relevant staff to update the plan to
reduce, re-use and recycle wastes and to update communications and education
material by 1 May 2017. This should include a summary of waste audit results.
A summary of these waste audit results and waste reduction work plan will be posted
for staff to see by 1 April 2017.
The results of the waste audit are summarized in the signed Ministry of the
Environment Waste Form Report of a Waste Audit (Appendix 2). Humber has
indicated that they will work to address the recommendations set out in this Waste
Reduction Work Plan and has signed the Ministry of Environment Waste Reduction
Work Plan form in Appendix 2 indicating same.

Appendix 1
Detailed Waste Audit Results

Table 4.1 Detailed Waste Audit Results (North Campus)
Material Category
Accepted in
Recycling
Program (X)
Weight per
Category
% Weight per
Category
% Weight per
Category
% Weight per
Category
%
Paper
Newsprint X 0.2 0.6 0.0 0.0 0.0 0.0 0.2 0.1
Office (fine) paper X 0.4 1.1 2.0 3.5 0.5 1.1 2.9 2.1
Mixed (office) Paper X 0.1 0.2 1.3 2.2 0.2 0.5 1.6 1.1
Beverage Cups x 2.1 6.3 2.2 3.8 1.6 3.4 5.9 4.3
Paper Towels/Tissue 3.1 9.0 2.9 5.0 3.3 6.9 9.2 6.6
Mixed paper (food) 2.8 8.3 3.4 5.9 1.8 3.9 8.0 5.8
Other Paper 0.2 0.5 0.1 0.2 0.3 0.6 0.5 0.4
Gable Top & Aseptic Containers X 0.2 0.6 0.4 0.7 0.5 1.2 1.1 0.8
Total Paper 9.0 26.4 12.3 21.3 8.2 17.6 29.5 21.3
OCC & Boxboard
Total OCC & Boxboard X 1.1 3.2 1.6 2.8 3.5 7.4 6.2 4.5
Plastics
Plastic Beverage Bottles X 0.4 1.2 0.6 1.1 2.0 4.3 3.0 2.2
Rigid Plastic Recyclables X 1.3 3.9 3.4 5.9 3.0 6.5 7.8 5.6
Polystyrene (expanded foam) 0.3 0.9 1.1 1.8 0.2 0.3 1.5 1.1
Garbage Bags 1.0 2.9 2.9 5.0 2.3 4.8 6.2 4.4
Other Plastic 3.1 9.1 2.7 4.6 4.2 8.9 9.9 7.2
0.0 0.0 0.0 0.0 0.0 0.0 0.0 0.0
Total Plastic 6.1 17.9 10.7 18.5 11.6 24.8 28.4 20.5
Glass
Total Glass X 0.3 1.0 1.6 2.8 0.0 0.0 1.9 1.4
Metal
Aluminum Cans X 0.2 0.7 0.3 0.6 0.3 0.7 0.9 0.6
Steel Cans X 0.0 0.0 0.9 1.5 0.4 0.9 1.3 0.9
Other Metal 0.0 0.0 0.0 0.0 0.0 0.0 0.0 0.0
Total Metal 0.2 0.7 1.2 2.0 0.7 1.5 2.1 1.5
Organic Waste
Edible Food Waste X 13.1 38.5 19.9 34.3 16.1 34.4 49.1 35.4
Inedible Food Waste X 3.5 10.4 4.6 8.0 1.7 3.6 9.8 7.1
Total Organic Waste 16.6 48.9 24.5 42.3 17.8 38.0 58.9 42.5
Other Waste
Total Other Waste 0.6 1.9 5.9 10.2 5.1 10.8 11.6 8.4
Total 33.9 100.0 57.9 100.0 46.9 100.0 138.7 100.0
TotalNorth Campus Common Areas North Campus Food Areas North Campus Residences

Table 4.2 Detailed Waste Audit Results (Lakeshore Campus)
Material Category
Accepted in
Recycling
Program (X)
Weight per
Category
% Weight per
Category
% Weight per
Category
% Weight per
Category
%
Paper
Newsprint X 0.0 0.0 0.0 0.0 0.0 0.0 0.0 0.0
Office (fine) paper X 0.3 1.5 0.1 0.3 0.0 0.0 0.4 0.6
Mixed (office) Paper X 0.2 1.0 0.0 0.1 0.1 0.7 0.3 0.5
Beverage Cups x 2.3 11.1 1.0 3.6 0.3 2.6 3.6 5.9
Paper Towels/Tissue 1.5 7.4 1.6 5.6 0.4 3.3 3.5 5.7
Mixed paper (food) 2.4 11.8 2.2 7.7 0.3 2.3 4.8 8.0
Other Paper 0.0 0.0 0.0 0.0 0.0 0.0 0.0 0.0
Gable Top & Aseptic Containers X 0.1 0.5 0.2 0.6 0.2 1.3 0.4 0.7
Total Paper 6.8 33.2 5.0 18.0 1.2 10.1 13.1 21.5
OCC & Boxboard
Total OCC & Boxboard X 0.9 4.2 4.9 17.4 1.0 8.0 6.7 11.0
Plastics
Plastic Beverage Bottles X 0.4 2.1 0.4 1.3 0.4 2.9 1.1 1.9
Rigid Plastic Recyclables X 0.8 3.8 0.9 3.4 0.5 4.4 2.3 3.7
Polystyrene (expanded foam) 0.1 0.3 0.0 0.1 0.2 1.3 0.3 0.4
Garbage Bags 1.4 6.9 1.3 4.5 1.7 14.0 4.4 7.2
Other Plastic 1.5 7.5 1.5 5.2 0.9 7.2 3.9 6.4
0.0 0.0 0.0 0.0 0.0 0.0 0.0 0.0
Total Plastic 4.2 20.6 4.1 14.5 3.7 29.8 11.9 19.6
Glass
Total Glass X 0.0 0.0 0.0 0.0 0.0 0.0 0.0 0.0
Metal
0.0 0.0 0.0 0.0 0.0 0.0 0.0 0.0
Aluminum Cans X 0.1 0.3 0.0 0.1 0.2 1.5 0.3 0.46
Steel Cans X 0.0 0.0 0.0 0.0 0.0 0.0 0.0 0.00
Other Metal 0.0 0.0 0.0 0.0 0.0 0.0 0.0 0.00
Total Metal 0.1 0.3 0.0 0.1 0.2 1.5 0.3 0.46
Organic Waste
Edible Food Waste X 5.6 27.3 12.3 43.8 4.1 33.5 22.0 36.2
Inedible Food Waste X 2.7 13.0 1.7 6.0 1.9 15.1 6.2 10.2
Total Organic Waste 8.2 40.4 13.9 49.9 6.0 48.6 28.2 46.4
Other Waste
Total Other Waste 0.3 1.4 0.0 0.1 0.3 2.1 0.6 0.9
Total 20.4 100.0 28.0 100.0 12.3 100.0 60.7 100.0
TotalLakeshore Campus Common Areas Lakeshore Campus Food Areas Lakeshore Campus Residences

Table 4.3 Waste Audit Results (Overall)
Material Category
Accepted in
Recycling
Program (X)
Weight per
Category
% Weight per
Category
% Weight per
Category
% Weight per
Category
% Weight per
Category
% Weight per
Category
% Weight per
Category
%
Paper
Newsprint X 0.2 0.6 0.0 0.0 0.0 0.0 0.0 0.0 0.0 0.0 0.0 0.0 0.2 0.1
Office (fine) paper X 0.4 1.1 2.0 3.5 0.5 1.1 0.3 1.5 0.1 0.3 0.0 0.0 3.3 1.6
Mixed (office) Paper X 0.1 0.2 1.3 2.2 0.2 0.5 0.2 1.0 0.0 0.1 0.1 0.7 1.9 1.0
Beverage Cups x 2.1 6.3 2.2 3.8 1.6 3.4 2.3 11.1 1.0 3.6 0.3 2.6 9.5 4.8
Paper Towels/Tissue 3.1 9.0 2.9 5.0 3.3 6.9 1.5 7.4 1.6 5.6 0.4 3.3 12.7 6.4
Mixed paper (food) 2.8 8.3 3.4 5.9 1.8 3.9 2.4 11.8 2.2 7.7 0.3 2.3 12.9 6.5
Other Paper 0.2 0.5 0.1 0.2 0.3 0.6 0.0 0.0 0.0 0.0 0.0 0.0 0.5 0.3
Gable Top & Aseptic Containers X 0.2 0.6 0.4 0.7 0.5 1.2 0.1 0.5 0.2 0.6 0.2 1.3 1.6 0.8
Total Paper 9.0 26.4 12.3 21.3 8.2 17.6 6.8 33.2 5.0 18.0 1.2 10.1 42.6 21.4
OCC & Boxboard
Total OCC & Boxboard X 1.1 3.2 1.6 2.8 3.5 7.4 0.9 4.2 4.9 17.4 1.0 8.0 12.9 6.5
Plastics
Plastic Beverage Bottles X 0.4 1.2 0.6 1.1 2.0 4.3 0.4 2.1 0.4 1.3 0.4 2.9 4.2 2.1
Rigid Plastic Recyclables X 1.3 3.9 3.4 5.9 3.0 6.5 0.8 3.8 0.9 3.4 0.5 4.4 10.0 5.0
Polystyrene (expanded foam) 0.3 0.9 1.1 1.8 0.2 0.3 0.1 0.3 0.0 0.1 0.2 1.3 1.8 0.9
Garbage Bags 1.0 2.9 2.9 5.0 2.3 4.8 1.4 6.9 1.3 4.5 1.7 14.0 10.5 5.3
Other Plastic 3.1 9.1 2.7 4.6 4.2 8.9 1.5 7.5 1.5 5.2 0.9 7.2 13.8 6.9
0.0 0.0 0.0 0.0 0.0 0.0 0.0 0.0 0.0 0.0 0.0 0.0 0.0 0.0
Total Plastic 6.1 17.9 10.7 18.5 11.6 24.8 4.2 20.6 4.1 14.5 3.7 29.8 40.3 20.2
Glass
Total Glass X 0.3 1.0 1.6 2.8 0.0 0.0 0.0 0.0 0.0 0.0 0.0 0.0 1.9 1.0
Metal
0.0 0.0 0.0 0.0 0.0 0.0 0.0 0.0 0.0 0.0 0.0 0.0 0.0 0.0
Aluminum Cans X 0.2 0.7 0.3 0.6 0.3 0.7 0.1 0.3 0.0 0.1 0.2 1.5 1.2 0.58
Steel Cans X 0.0 0.0 0.9 1.5 0.4 0.9 0.0 0.0 0.0 0.0 0.0 0.0 1.3 0.63
Other Metal 0.0 0.0 0.0 0.0 0.0 0.0 0.0 0.0 0.0 0.0 0.0 0.0 0.0 0.00
Total Metal 0.2 0.7 1.2 2.0 0.7 1.5 0.1 0.3 0.0 0.1 0.2 1.5 2.4 1.21
Organic Waste
Edible Food Waste X 13.1 38.5 19.9 34.3 16.1 34.4 5.6 27.3 12.3 43.8 4.1 33.5 71.0 35.6
Inedible Food Waste X 3.5 10.4 4.6 8.0 1.7 3.6 2.7 13.0 1.7 6.0 1.9 15.1 16.0 8.0
Total Organic Waste 16.6 48.9 24.5 42.3 17.8 38.0 8.2 40.4 13.9 49.9 6.0 48.6 87.1 43.7
Other Waste
Total Other Waste 0.6 1.9 5.9 10.2 5.1 10.8 0.3 1.4 0.0 0.1 0.3 2.1 12.2 6.1
Total 33.9 100.0 57.9 100.0 46.9 100.0 20.4 100.0 28.0 100.0 12.3 100.0 199.4 100.0
Lakeshore Campus ResidencesNorth Campus Common Areas North Campus Food Areas North Campus Residences Lakeshore Campus Common Areas Lakeshore Campus Food Areas Total

Appendix 2
Ministry of Environment Reporting Forms
Ministry of the Environment Waste Form
Report of a Waste Audit
Industrial, Commercial and Institutional Establishments
As required by O. Reg. 102/94
• This report must be prepared 6 months after becoming subject to O. Reg. 102/94 and a copy retained on
file for at least five years after it is prepared, and be made available to the ministry upon request.
• For large construction and demolition projects, please refer to the forms included with “A Guide to Waste
Audits and Waste Reduction Work Plans for Construction and Demolition Projects as Required Under
Ontario Regulation 102/94” (revised July 2008)
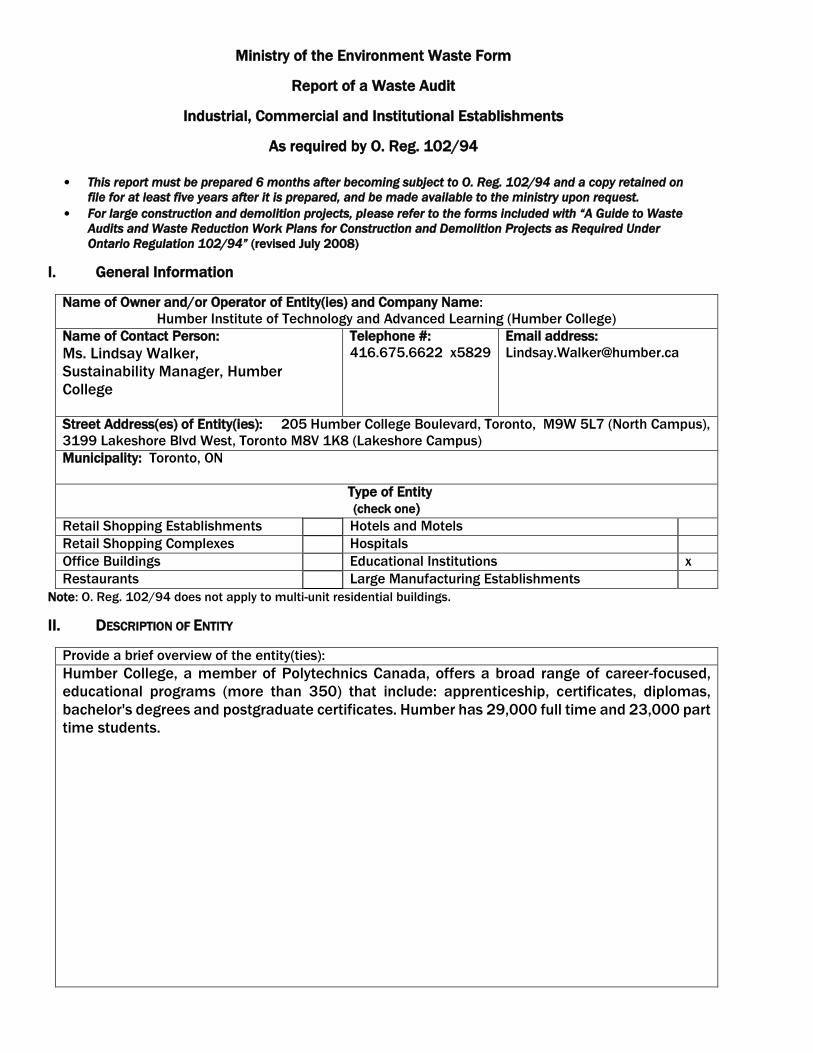
I. General Information
Name of Owner and/or Operator of Entity(ies) and Company Name:
Humber Institute of Technology and Advanced Learning (Humber College)
Name of Contact Person:
Ms. Lindsay Walker,
Sustainability Manager, Humber
College
Telephone #:
416.675.6622 x5829
Email address:
Street Address(es) of Entity(ies): 205 Humber College Boulevard, Toronto, M9W 5L7 (North Campus),
3199 Lakeshore Blvd West, Toronto M8V 1K8 (Lakeshore Campus)
Municipality: Toronto, ON
Type of Entity
(check one)
Retail Shopping Establishments Hotels and Motels
Retail Shopping Complexes Hospitals
Office Buildings Educational Institutions x
Restaurants Large Manufacturing Establishments
Note: O. Reg. 102/94 does not apply to multi-unit residential buildings.
II. DESCRIPTION OF ENTITY
Provide a brief overview of the entity(ties):
Humber College, a member of Polytechnics Canada, offers a broad range of career-focused,
educational programs (more than 350) that include: apprenticeship, certificates, diplomas,
bachelor's degrees and postgraduate certificates. Humber has 29,000 full time and 23,000 part
time students.

III. HOW WASTE IS PRODUCED AND DECISIONS AFFECTING THE PRODUCTION OF WASTE
For each category of waste that is produced at the entity(ies), explain how the waste will be produced and
how management decisions and policies will affect the production of waste.
Categories of Waste How Is the Waste Produced and What Management
Decisions/Policies Affect Its Production?
Example: Disposable Food Packaging
Generated by customers eating inside restaurant. Food packaging
is used for health reasons. Reusable mugs for customers
consuming coffee/tea inside restaurant is being reviewed.
Paper
Newsprint Generated by student newspaper and staff/students that bring in
newspapers to read. Recycling program in place.
Office (fine) paper Generated by students/staff as part of studies/job. Recycling
programs in place.
Mixed paper Generated by students/staff as part of studies/job. Recycling
programs in place.
Beverage cups Generated by students/staff consuming beverages. Recycling
program in place.
Paper Towels/Tissue Generated by students/staff in washrooms and food areas.
Compost program available in North Campus food areas.
Mixed paper (food) Generated by food outlets and students/staff bringing in food. No
recycling program in place.
Other paper Generated by students/staff as part of studies/job. Recycling
programs in place.
Gable Top & Aseptic Containers Generated by students/staff as part of studies/job. Recycling
programs in place.
Cardboard Generated from receipt of supplies. Recycling program in place.
Plastics
Plastic Beverage Bottles Generated by students/staff consuming beverages. Recycling
program in place.
Rigid Plastic Recyclables Generated by students/staff. Recycling program in place.
Polystyrene Generated by students/staff bringing to work and food areas. No
recycling program in place.
Garbage Bags Generated by staff. No recycling program in place.
Other plastic Generated by students/staff. No recycling program in place.
Glass bottles and jars Generated by students/staff consuming beverages. Recycling
program in place.
Metal
Aluminum cans Generated by students/staff consuming beverages. Recycling
program in place.
Steel cans Generated by students/staff consuming beverages. Recycling
program in place.
Wood Generated in wood shops. Recycling program in place.
Organics
Generated in cafeteria and administration areas. Composting
program in place in cafeteria and kitchens in North Campus and
kitchens in Lakeshore Campus.
Other Waste
Ewaste Generated during IT upgrades. Recycling program in place.
Batteries Generated from students/staff. Recycling program in place.
Lamps Generated when by janitorial staff. Recycling program in place.
Toner Generated from printers. Recycling program in place.
Note: When completing this form, write “n/a” in the columns where the entity will not produce any waste for a
category of waste.

IV. MANAGEMENT OF WASTE For each category of waste listed below, indicate which waste items will be disposed or reused/recycled
and how each item will be managed at the entity(ies).
Category Waste to be Disposed Reused or Recycled Waste
Example: Beverage cans
Staff/clients may place in garbage
bins
Staff/clients place cans in recycling
receptacles. Collection staff later
collect cans. Those in garbage are
disposed; those in recycling
receptacles are recycled.
Paper
Newsprint Some may end up in garbage bins. Placed in recycling bins that are
emptied by janitorial staff.
Office (fine) paper Some may end up in garbage bins. Placed in recycling bins that are
emptied by janitorial staff.
Mixed paper Some may end up in garbage bins. Placed in recycling bins that are
emptied by janitorial staff.
Beverage cups Some may end up in garbage bins. Placed in recycling bins that are
emptied by janitorial staff.
Paper Towels/Tissue Some may end up in garbage bins. Placed in composting bins where
available. Emptied by janitorial staff.
Mixed paper (food) Placed in garbage bins. n/a
Other paper Some may end up in garbage bins. Placed in recycling bins that are
emptied by janitorial staff.
Gable Top & Aseptic Containers Some may end up in garbage bins. Placed in recycling bins that are
emptied by janitorial staff.
Cardboard Some may end up in garbage bins. Placed in recycling bins that are
emptied by janitorial staff.
Plastics
Plastic Beverage Bottles Some may end up in garbage bins. Placed in recycling bins that are
emptied by janitorial staff.
Rigid Plastic Recyclables Some may end up in garbage bins. Placed in recycling bins that are
emptied by janitorial staff.
Polystyrene Some may end up in garbage bins. Lakeshore- placed in recycling bins
North- placed in garbage bins
Garbage Bags Placed in garbage bins. n/a
Other plastic Placed in garbage bins. n/a
Glass bottles and jars Some may end up in garbage bins. Placed in recycling bins that are
emptied by janitorial staff.
Metal
Aluminum cans Some may end up in garbage bins. Placed in recycling bins that are
emptied by janitorial staff.
Steel cans Some may end up in garbage bins. Placed in recycling bins that are
emptied by janitorial staff.
Wood
Organics Some may end up in garbage bins. Placed in composting bins where
available. Emptied by janitorial staff
Other Waste
Ewaste n/a Recycling program in place.
Batteries n/a Recycling program in place.
Lamps n/a Recycling program in place.
Toner n/a Recycling program in place.
Carpet n/a Recycling program in place.
Note: When completing this form, write “n/a” in the columns where the entity will not produce any waste for a
category of waste.

“B” * “C” * “B” * “C” * “B” * “C” * “B” * “C” *
Current
Year
Change Current Change Current Year Change Current
Year
Change
(A-B) Year (A-B) (A-B) (A-B)
1. Paper
Newsprint 10.9 0.7 10.2
Office (fine) paper 29.7 11.8 17.9
Mixed paper (office) 136.1 350.7 -214.6 12.6 6.8 5.7
Coffee Cups 56.6 34.2 22.3
Paper Towels/Tissue 95.3 45.6 49.6
Mixed paper (food) 192.9 46.3 146.5
Other Paper 9.8 1.9 7.8
Gable Top & Aseptic 0 7.6 -7.6 0.0 5.7 -5.7
Total 543.7 511.4 32.2 136.1 358.3 -222.2 407.6 153.2 254.4
2. Cardboard 135.8 125.9 9.9 114.1 79.6 34.5 21.7 46.3 -24.6
3. Plastics
Plastic Beverage Bottles 41.4 105.7 -64.3 39.6 15.0 24.5
Polyethylene jugs, pails,
crates, totes, drums
(HDPE) 4.3 36.1 -31.8
Polystyrene (expanded
foam)
5.2 6.4 -1.2
Garbage Bags 32.3 37.9 -5.6
Other Plastic 115.6 49.6 66.0
Total 238.4 250.8 -12.4 41.4 105.7 -64.3 197.0 145.1 51.9
4. Glass
Bottles and Jars 41.4 7.6 33.8 9.5 7.0 2.5
Total 50.9 14.5 36.4 41.4 7.6 33.8 9.5 7.0 2.5
5. Metal
Aluminum/Steel Cans 41.4 30.2 11.2 13.0 8.7 4.3
Other Metal 64.4 -64.4 0.3 0.0 0.3
Total 54.7 103.3 -48.6 41.4 94.6 -53.2 13.3 8.7 4.6
6. Wood 52.0 107.2 -55.2 52.0 107.2 -55.2 0.0 0.0 0.0
7. Organics
Food Waste 261.6 313.2
Leaf and Yard 25.0 0.0
Cooking Oil 4.4 0.0
Total 829.5 604.2 225.3 344.5 291.1 53.4 485.0 313.2 171.8
8. Other Waste
E Waste 31.8
Lamps 0.5
Carpet 12.0
Batteries 0.2
Toner 2.8
Miscellaneous waste 69.1 70.4 43.8
Total 124.6 230.7 -106.1 69.1 72.2 117.8 0.0 52.4 43.8 8.6
Total 2030 1948 81 0 69 0 843 1162 -218 1186 717 469
Percent Change (total C ÷
total A x 100 )
0 0 0 0 0 0
* Fill out these columns each year following the initial waste audit or baseline year to determine the progress that is being made by your waste reduction program.
Categories of Waste
“A” Base Year “A” Base
Year
“A” Base
Year
“A” Base
Year
Note: When completing this form, write “n/a” in the “Estimated Amount of Waste Produced” column where the entity will not produce any waste for a category of waste.
See also Waste Audit and Waste Reduction Work Plan Report December 2016)
Estimated Amount of Waste Produced
kgs or tonnes (t)
Generated Reused Recycled Disposed

VI. EXTENT TO WHICH MATERIALS OR PRODUCTS USED OR SOLD BY THE ENTITY CONSIST OF RECYCLED OR
REUSED MATERIALS OR PRODUCTS
Please answer the following questions:
1. Do you have a management policy in place that promotes the purchasing and/or use
of materials or products that consist of recycled and/or reused materials or
products? If yes, please describe.
There is currently no management policy in place that promotes the purchasing
and/or use of materials or products that consist of recycled and/or reused materials
or products
2. Do you have plans to increase the extent to which materials or products used or
sold* consist of recycled or reused materials or products? If yes, please describe.
Humber will investigate using recycled or re-used materials to the extent possible, where it
is economically feasible to do so.
* Information regarding materials or products “sold” that consist of recycled or reused
materials or products is only required from owner(s) of retail shopping establishments and
the owner(s) or operator(s) of large manufacturing establishments.
Please attach any additional page(s) as required to answer the above questions.
I hereby certify that the information provided in this Report of Waste Audit is complete and correct.
Signature of authorized official:
x
Title:
Sustainability Manager Date:
X

Ministry of the Environment Waste Form
Report of a Waste Reduction Work Plan
Industrial, Commercial and Institutional Establishments
As required by O. Reg. 102/94
This report must be prepared 6 months after becoming subject to O. Reg. 102/94 and a copy
retained on file for at least five years after it is prepared, and be made available to the
ministry upon request.
I. GENERAL INFORMATION
Name of Owner and/or Operator of Entity(ies) and Company Name:
Humber Institute of Technology and Advanced Learning (Humber College)
Name of Contact Person:
Ms. Lindsay Walker,
Sustainability Manager, Humber College
Telephone #:
416.675.6622 x5829
Email address:
Street Address(es) of Entity(ies): 205 Humber College Boulevard, Toronto, M9W 5L7 (North
Campus), 3199 Lakeshore Blvd West, Toronto M8V 1K8 (Lakeshore Campus)
Municipality: Toronto, ON
Type of Entity
(check one)
Retail Shopping Establishments Hotels and Motels
Retail Shopping Complexes Hospitals
Office Buildings Educational Institutions x
Restaurants Large Manufacturing Establishments
Note: O. Reg. 102/94 does not apply to multi-unit residential buildings.
II. DESCRIPTION OF THE ENTITY
Provide a brief overview of the entity(ties):
Humber College, a member of Polytechnics Canada, offers a broad range of career-focused,
educational programs (more than 350) that include: apprenticeship, certificates, diplomas,
bachelor's degrees and postgraduate certificates. Humber has 29,000 full time and 23,000
part time students.

III. PLANS TO REDUCE, REUSE AND RECYCLE WASTE
For each category of waste described in Part V of “Report of a Waste Audit” (on
which this plan is based), explain what your plans are to Reduce, Reuse and Recycle
the waste, including: 1) how the waste will be source separated at the
establishment, and 2) the programs to reduce, reuse and recycle all source
separated waste. Waste Category (as stated in Part
V of your “Report
of a Waste Audit”)
Source Separation and 3Rs Program
Example:
fine paper (e.g.
from an office)
“Fine Paper 3Rs Program”
Reduce: Staff will be encouraged to print on both sides of each sheet.
Reuse: Discarded paper with print only on one side will be used for note
pads/scrap.
Recycle: Staff will be provided with instructions via email. Receptacles will be
provided beside each desk. Staff will empty receptacles into centralized
containers. Custodial staff will empty centralized containers into bulk
container at loading dock for collection by recycling company.
General Improve data collection
Improve communications and education program
Paper
Reduce – double sided photocopying
Reduce- consider eliminating paper towels through installation of
hand dryers
Recycling- maximize use of existing recycling infrastructure
Cardboard Recycling- maximize use of existing recycling infrastructure
Plastic Recycling- maximize use of existing recycling infrastructure
Glass Recycling- maximize use of existing recycling infrastructure
Metal Recycling- maximize use of existing recycling infrastructure
Organic Waste
Recycling- maximize use of existing recycling infrastructure
Recycling- consider adding post consumer organic waste
program
Waste Cooking
Oil
Recycling- maximize use of existing recycling infrastructure
Wood Recycling- maximize use of existing recycling infrastructure
Yard Waste Recycling- maximize use of existing recycling infrastructure
E-Waste Recycling- maximize use of existing recycling infrastructure
IV. RESPONSIBILITY FOR IMPLEMENTING THE WASTE REDUCTION WORK PLAN
Identify who is responsible for implementing the Waste Reduction Work Plan at
your entity(ies). If more than one person is responsible for implementation,
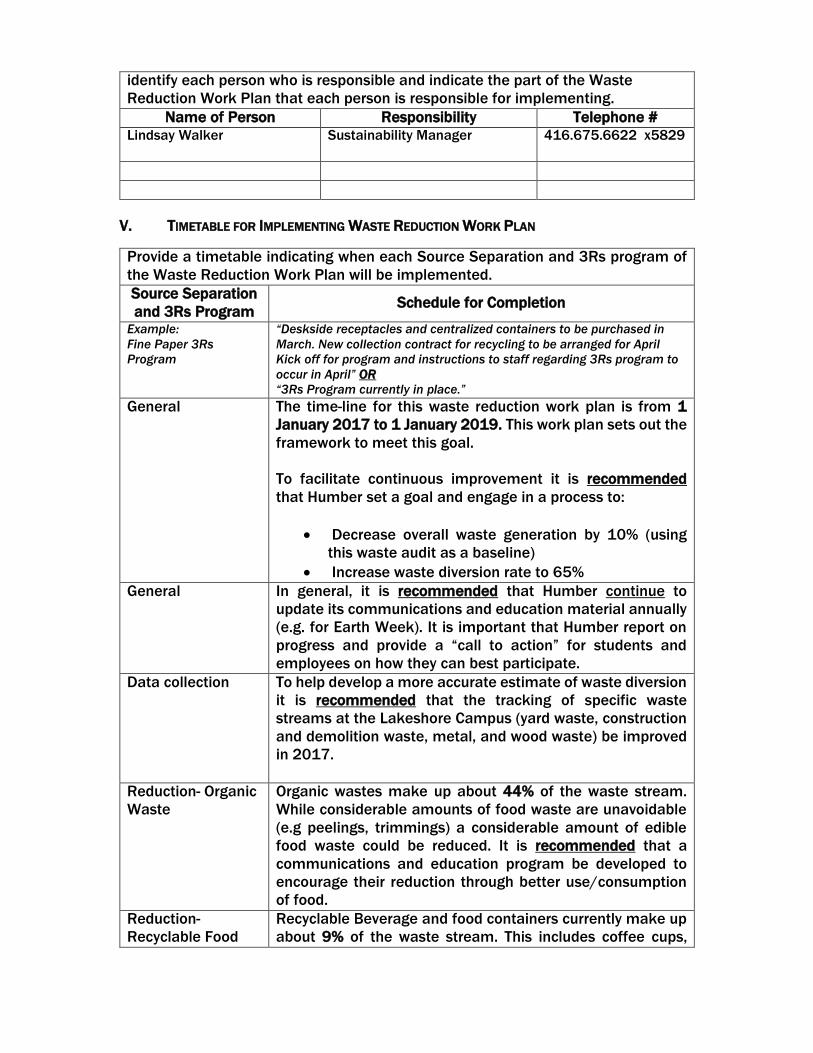
identify each person who is responsible and indicate the part of the Waste
Reduction Work Plan that each person is responsible for implementing.
Name of Person Responsibility Telephone # Lindsay Walker
Sustainability Manager
416.675.6622 x5829
V. TIMETABLE FOR IMPLEMENTING WASTE REDUCTION WORK PLAN
Provide a timetable indicating when each Source Separation and 3Rs program of
the Waste Reduction Work Plan will be implemented.
Source Separation
and 3Rs Program Schedule for Completion
Example:
Fine Paper 3Rs
Program
“Deskside receptacles and centralized containers to be purchased in
March. New collection contract for recycling to be arranged for April
Kick off for program and instructions to staff regarding 3Rs program to
occur in April” OR
“3Rs Program currently in place.”
General The time-line for this waste reduction work plan is from 1
January 2017 to 1 January 2019. This work plan sets out the
framework to meet this goal.
To facilitate continuous improvement it is recommended
that Humber set a goal and engage in a process to:
Decrease overall waste generation by 10% (using
this waste audit as a baseline)
Increase waste diversion rate to 65%
General In general, it is recommended that Humber continue to
update its communications and education material annually
(e.g. for Earth Week). It is important that Humber report on
progress and provide a “call to action” for students and
employees on how they can best participate.
Data collection To help develop a more accurate estimate of waste diversion
it is recommended that the tracking of specific waste
streams at the Lakeshore Campus (yard waste, construction
and demolition waste, metal, and wood waste) be improved
in 2017.
Reduction- Organic
Waste
Organic wastes make up about 44% of the waste stream.
While considerable amounts of food waste are unavoidable
(e.g peelings, trimmings) a considerable amount of edible
food waste could be reduced. It is recommended that a
communications and education program be developed to
encourage their reduction through better use/consumption
of food.
Reduction-
Recyclable Food
Recyclable Beverage and food containers currently make up
about 9% of the waste stream. This includes coffee cups,

and Beverage
Containers
gable top and aseptic containers, as well as plastic, glass and
metal containers. It is recommended that a communications
and education program be developed to encourage their
reduction through the use of re-usable beverage containers.
Reuse In 2016 Humber continues to partner with an organization
and donates all reusable furniture.
It is recommended that Humber continue to identify and
implement re-use opportunities within the Humber
community as well as the broader community.
Recycling It is recommended that Humber continue to improve its
composting program at both campuses.
The work includes Humber staff meeting with relevant staff
to update the plan to reduce, re-use and recycle wastes and
to update communications and education material by 1 May
2017. This should include a summary of waste audit results.
VI. COMMUNICATION TO STAFF, CUSTOMERS, GUESTS AND VISITORS
Explain how the Waste Reduction Work Plan will be communicated to employees,
customers, tenants, guests/visitors and students:
A summary of these waste audit results and waste reduction work plan will be
posted for staff to see by 1 April 2017.
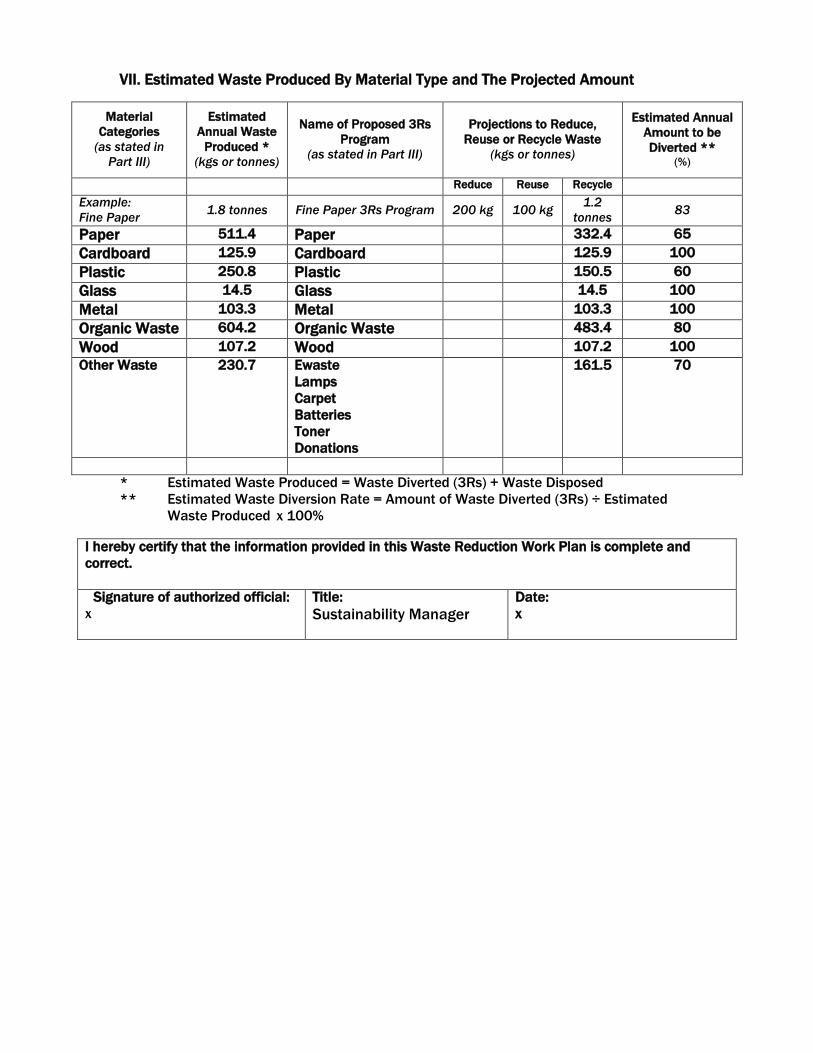
VII. Estimated Waste Produced By Material Type and The Projected Amount
Material
Categories
(as stated in
Part III)
Estimated
Annual Waste
Produced *
(kgs or tonnes)
Name of Proposed 3Rs
Program
(as stated in Part III)
Projections to Reduce,
Reuse or Recycle Waste
(kgs or tonnes)
Estimated Annual
Amount to be
Diverted ** (%)
Reduce Reuse Recycle
Example:
Fine Paper 1.8 tonnes Fine Paper 3Rs Program 200 kg 100 kg
1.2
tonnes 83
Paper 511.4 Paper 332.4 65
Cardboard 125.9 Cardboard 125.9 100
Plastic 250.8 Plastic 150.5 60
Glass 14.5 Glass 14.5 100
Metal 103.3 Metal 103.3 100
Organic Waste 604.2 Organic Waste 483.4 80
Wood 107.2 Wood 107.2 100
Other Waste 230.7 Ewaste
Lamps
Carpet
Batteries
Toner
Donations
161.5 70
* Estimated Waste Produced = Waste Diverted (3Rs) + Waste Disposed
** Estimated Waste Diversion Rate = Amount of Waste Diverted (3Rs) ÷ Estimated
Waste Produced x 100%
I hereby certify that the information provided in this Waste Reduction Work Plan is complete and
correct.
Signature of authorized official:
x
Title:
Sustainability Manager Date:
x