final report v3 - sc biomass litter final report.… · final report availability of poultry manure...
TRANSCRIPT
FINAL REPORT
AVAILABILITY OF POULTRY MANURE AS A POTENTIAL BIO-FUEL FEEDSTOCK FOR ENERGY PRODUCTION
By
Joseph R.V. Flora, Ph.D., P.E. and Cyrus Riahi-Nezhad Department of Civil and Environmental Engineering
University of South Carolina 300 Main Street, Columbia, SC 29208
Submitted to:
South Carolina Energy Office 1201 Main Street, Suite 430
Columbia, SC 20201 31 August 2006

1
SUMMARY
The purpose of this project is to document the availability of poultry manure in South Carolina and assess its potential for energy generation. A GIS database obtained from the SC Department of Health and Environmental Control (SC DHEC) in April 2006 showed 805 of 808 (99.6%) currently active and proposed poultry facilities produce dry litter. It is estimated that between 400,000 and 700,000 tons of litter are produced per year. Most of the litter production comes from chicken broiler facilities, followed by turkey facilities. Kershaw county produces the most litter at over 80,000 tons/year. Eight counties produce more than 40,000 tons/year. Based on US Environmental Protection Agency (USEPA) CAFO (confined animal feeding operation) size classifications, there are 380 medium chicken broiler farms, 146 large chicken broiler farms, and 122 medium turkey farms that produce an average of 547, 1090, and 1334 tons of litter per year, respectively. A survey of 9 agricultural permits for various types of poultry farms with large litter production revealed that 5 farms apply the litter on land for farming and 4 use a manure broker. A survey of 4 manure brokers revealed that the litter collected from poultry farms is applied on farmland.
The material value of poultry litter as fertilizer was calculated and compared with the material value as feedstock for energy generation via anaerobic digestion, combustion and co-firing, and gasification. This material value does not account for the cost of producing energy but included the potential value of recovered ash. Based on fifteen bulk fertilizer prices obtained for different grades of fertilizer from 5 supply companies in South Carolina, the maximum material value of poultry litter is $38/ton of chicken broiler litter and $52/ton of turkey litter. The material values of poultry litter for anaerobic digestion is $30/ton, for combustion and co-firing with ash recovery as fertilizer is $53–$57/ton, and for gasification with ash recovery as fertilizer is $46–$50/ton.
Electricity production facilities estimated assuming poultry litter utilization rates of 1000 tons/year (on-site), 10,000 tons/year (off-site), and 50,000 tons/year (regional/county scale) for various technologies range from 50–70 kW, 500–700 kW, and 2.5–3.5 MW, respectively. An economic analysis accounting for capital expenditures, operation and maintenance costs, litter cleanout and transportation, and recoverable ash value reveal that gasification at a small scale (100 kW) and medium scale (1 MW) is potentially economically viable compared to anaerobic digestion and combustion. Further studies are recommended that involve a full systems analysis of a facility (e.g., poultry integrator amenable to energy production or a regional energy production facility).
INTRODUCTION This project was proposed in response to solicitation number 06-IOP-06 of the South Carolina Energy Office (SCEO). The scope of work delineated in the solicitation is reiterated. The purpose of this project is to document the availability of poultry manure in South Carolina as a potential bio-fuel feedstock for energy generation. In this project, the term poultry is used to indicate chickens and turkeys farmed for economic production. Information obtained on commercial poultry facilities included current manure disposal practices and volumes of waste

2
created. Furthermore, several technical, environmental, economic, and policy issues were identified that would impact the development of poultry manure as a significant bio-fuel feedstock. The specific tasks identified in the scope of work are as follows:
1. Identify a minimum of five large poultry farms with significant amounts of waste availability. For each facility, document waste handling processes currently in use, quantity of waste processed, and the final disposition of the waste material.
2. Document the current disposition of waste transported for off-site processing or disposal, method of transport, and the associated commercial arrangements or issues, if applicable.
3. Document the volume of organic waste available for alternative treatment by anaerobic digestion.
4. Document the potential for on site production and use of bio-energy derived from available feedstock.
5. Document the potential for off site production and use of bio-energy derived from available feedstock.
6. Collect data relative to the total poultry farm facilities in SC sufficient to determine accurate estimates of the total quantity and quality of available poultry manure material as potential bio-fuel feedstock.
7. Estimate total organic waste available for potential anaerobic digestion processing. Present data in three separate categories (small, medium, large) of poultry farms, sized by absolute quantity of available waste with reasonable potential as bio-fuel feedstock.
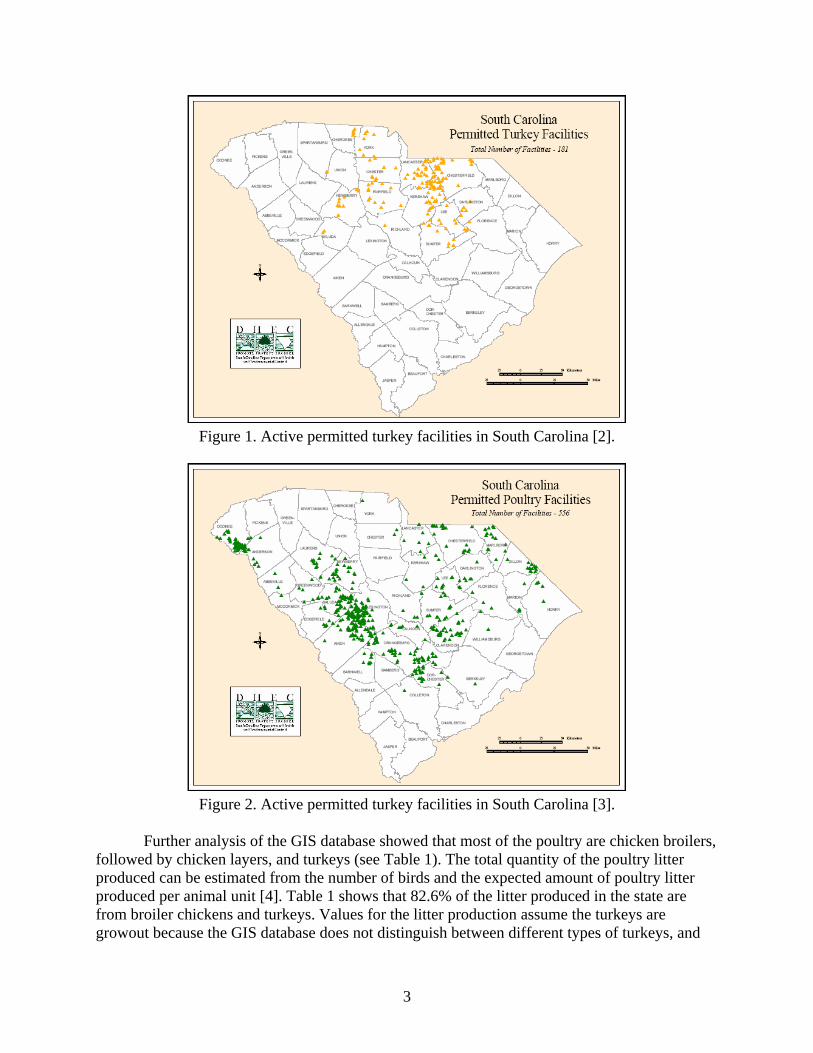
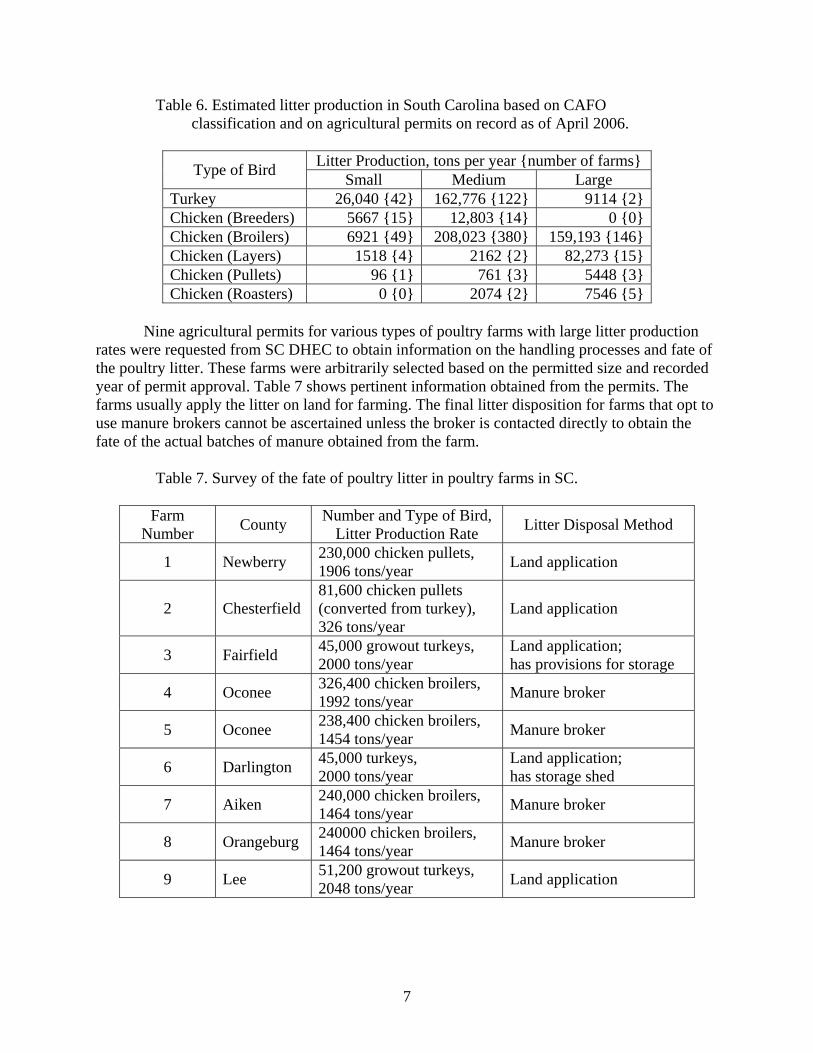
POULTRY FACILITIES IN SOUTH CAROLINA The South Carolina Department of Health and Environmental Control (SC DHEC) regulates agricultural facilities within the state under R.61-43 (Standards for the Permitting of Agricultural Animal Facilities) [1]. SC DHEC shows 181 permitted turkey facilities [2] and 556 permitted chicken facilities [3] in South Carolina (figures accessed in 2006). The general location of these facilities is shown in Figures 1 and 2. The term poultry in Figure 2 refers to chicken facilities. The turkey facilities are clustered in the northern mid-section of the state, while the chicken facilities are clustered in the western section of the state. To operate in the state, poultry facilities have to submit a comprehensive Animal Facility Management Plan to SC DHEC that includes the number and type of animals, the amount of animal manure and by-products generated per year, constituent concentrations in the litter, and proposed manure management/disposal/treatment approaches [1]. From a GIS database of agricultural facilities obtained from SC DHEC, 805 of 808 (99.6%) currently active and proposed poultry facilities produce dry litter, which is composed primarily of manure, bedding material (wood shavings, saw dust, paper, etc.), and feed. The total number (808) is different from the sum of the facilities in Figures 1 and 2 (181+556=737) because the exact date of generation of the figures cannot be ascertained. In general, poultry farmers lay fresh bedding material after complete cleanout of the houses, may practice partial cleanout and add fresh topping material to the beds between flocks as needed, and completely cleanout the houses about once a year. Numerous factors determine the quality and composition of the litter, including bedding material used, number and type of poultry, number of flocks per year, sources of moisture, and overall litter management approach.
3
Figure 1. Active permitted turkey facilities in South Carolina [2].
Figure 2. Active permitted turkey facilities in South Carolina [3].
Further analysis of the GIS database showed that most of the poultry are chicken broilers, followed by chicken layers, and turkeys (see Table 1). The total quantity of the poultry litter produced can be estimated from the number of birds and the expected amount of poultry litter produced per animal unit [4]. Table 1 shows that 82.6% of the litter produced in the state are from broiler chickens and turkeys. Values for the litter production assume the turkeys are growout because the GIS database does not distinguish between different types of turkeys, and

4
the layers use pit storage and produced the driest litter. The litter production in Table 1 can be regarded as an upper estimate because poultry farmers are not supposed to exceed the number of birds permitted at any single time.
Table 1. Estimated SC poultry litter production based on agricultural permits on record as of April 2006.
Type of Bird Total Heads Litter Production, tons per 1000 bird
spaces per year
Total Litter Production, tons
per year Turkey 4,948,250 40.0 197,930 Chicken (Breedersa) 1,248,000 14.8 18,470 Chicken (Broilersb) 61,333,910 6.1 374,137 Chicken (Layers) 4,841,840 17.9 85,953 Chicken (Pulletsc) 1,576,250 4.0 6,305 Chicken (Roastersd) 1,002,000 9.6 9,619
TOTAL 692,414 aBird utilized to produce offspring [40]. bYoung chicken suitable for broiling, not over 2.5 lb and less than 12 weeks of age [40]. cA laying hen before it lays its first egg [40]. dLarge young chicken over 4.5 lb suitable for roasting [40]
Litter production can also be estimated from the number of poultry produced as reported by the U.S. Department of Agriculture (USDA) National Agricultural Statistics Service [5]. Table 2 shows the litter production for turkeys and chicken broilers. Data for the other types of birds were not available, but are expected to constitute less than 19% of the total production based on Table 1. The unit litter production rates for Table 1 account for the number of flocks per year, while the rates for Table 2 are for a single flock. The total litter production in Table 2 can be regarded as a lower estimate because these figures do not include litter from animal loss.
Table 2. Estimated SC poultry litter production based on number of broilers slaughtered and number of turkeys raised in 2005.
Type of Bird Total Heads Produced
Litter Production, tons per 1000 birds per year
Total Litter Production, tons
per year Turkey 8,000,000 12.3 98,400 Chicken (Broilers) 266,233,000 1.2 319,479
TOTAL 417,879 Table 3 shows a county estimate of the maximum litter production using the GIS database. The top 5 counties in terms of litter production are Kershaw, Lexington, Orangeburg, Saluda, and Chesterfield counties. Kershaw has primarily turkey farms and a large layer facility; Lexington and Orangeburg Counties primarily have chicken broiler farms; Saluda has primary broiler farms with 4 large layer facilities; and Chesterfield has an almost equal number of turkey and broiler farms and a few breeder farms but with 69% of the litter coming from turkeys.

5
Table 3. Estimated poultry litter production by county based on agricultural
permits on record as of April 2006.
County Litter Production, tons per year
Abbeville 2,359 Aiken 44,113 Allendale 493 Anderson 13,588 Barnwell 7,777 Berkeley 3,096 Calhoun 6,655 Cherokee 4,160 Chester 11,144 Chesterfield 44,893 Clarendon 22,444 Colleton 174 Darlington 17,258 Dillon 13,278 Dorchester 9,161 Edgefield 3,556 Fairfield 15,730 Florence 2,373 Greenwood 4,166 Horry 2,891 Kershaw 81,936 Lancaster 32,096 Laurens 10,050 Lee 27,154 Lexington 59,339 Marion 2,865 Marlboro 15,116 McCormick 1,790 Newberry 44,506 Oconee 43,515 Orangeburg 52,080 Pee Dee 988 Pickens 18 Richland 2,226 Saluda 48,520 Spartanburg 2,560 Sumter 27,748 Union 1,790 Williamsburg 1,482 York 7,326
TOTAL 692,414

6
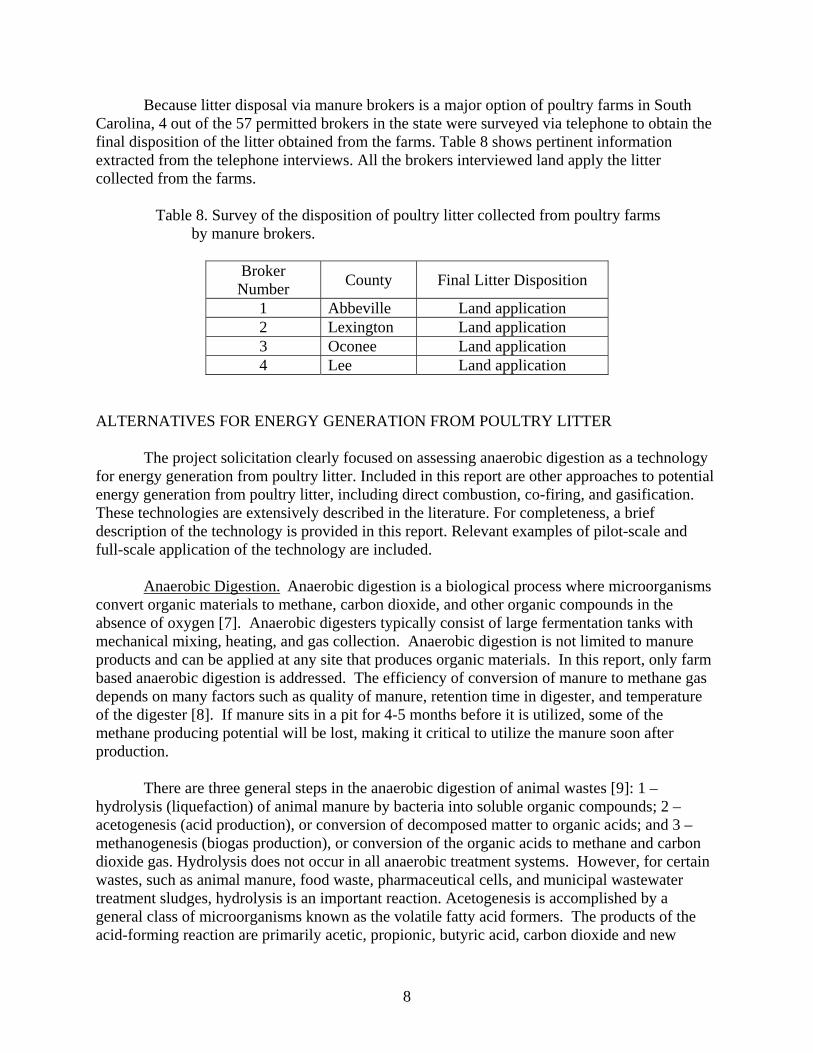
The U.S. Environmental Prodection Agency (US EPA) Confined Animal Feeding Operation (CAFO) classification categorizes poultry farms based on the type of poultry and the manure handling system as shown in Table 4 [6]. Table 5 shows the expected litter production based on the CAFO classification estimated using the unit production rates in Table 1. Table 6 shows the number of farms in South Carolina and the corresponding total litter production based on CAFO size. Medium turkey farms, medium chicken broiler farms, and large chicken broiler farms are the leading type of farms in terms of litter production and absolute number, producing an average of 1334, 547, and 1090 tons of litter per year, respectively.
Table 4. US EPA CAFO classification for poultry farms [6].
Type of Bird CAFO Classification Number of Birds
Small < 16,500 Medium 16,500 to 55,000 Turkey Large > 55,000 Small < 9,000 Medium 9000 to 30,000 Chickens with liquid
manure handling systems Large > 30,000 Small < 25,000 Medium 25,000 to 82,000
Layer chickens other than liquid manure handling systems Large > 82,000
Small < 37,500 Medium 37,500 to 125,000
Chickens except layers and other than liquid manure handling systems Large > 125,000
Table 5. Estimated litter production on a poultry farm based on CAFO classification.
Litter Production, tons per year Type of Bird Small Medium Large
Turkey < 660 660 to 2200 > 2200 Chicken (Breeders) < 555 550 to 1850 > 1850 Chicken (Broilers) < 229 229 to 763 > 763 Chicken (Layers) < 448 448 to 1468 > 1468 Chicken (Pullets) < 150 150 to 500 > 500 Chicken (Roasters) < 360 360 to 1200 > 1200
7
Table 6. Estimated litter production in South Carolina based on CAFO classification and on agricultural permits on record as of April 2006.
Litter Production, tons per year {number of farms} Type of Bird Small Medium Large
Turkey 26,040 {42} 162,776 {122} 9114 {2} Chicken (Breeders) 5667 {15} 12,803 {14} 0 {0} Chicken (Broilers) 6921 {49} 208,023 {380} 159,193 {146} Chicken (Layers) 1518 {4} 2162 {2} 82,273 {15} Chicken (Pullets) 96 {1} 761 {3} 5448 {3} Chicken (Roasters) 0 {0} 2074 {2} 7546 {5}
Nine agricultural permits for various types of poultry farms with large litter production rates were requested from SC DHEC to obtain information on the handling processes and fate of the poultry litter. These farms were arbitrarily selected based on the permitted size and recorded year of permit approval. Table 7 shows pertinent information obtained from the permits. The farms usually apply the litter on land for farming. The final litter disposition for farms that opt to use manure brokers cannot be ascertained unless the broker is contacted directly to obtain the fate of the actual batches of manure obtained from the farm.
Table 7. Survey of the fate of poultry litter in poultry farms in SC.
Farm Number County Number and Type of Bird,
Litter Production Rate Litter Disposal Method
1 Newberry 230,000 chicken pullets, 1906 tons/year Land application
2 Chesterfield 81,600 chicken pullets (converted from turkey), 326 tons/year
Land application
3 Fairfield 45,000 growout turkeys, 2000 tons/year
Land application; has provisions for storage
4 Oconee 326,400 chicken broilers, 1992 tons/year Manure broker
5 Oconee 238,400 chicken broilers, 1454 tons/year Manure broker
6 Darlington 45,000 turkeys, 2000 tons/year
Land application; has storage shed
7 Aiken 240,000 chicken broilers, 1464 tons/year Manure broker
8 Orangeburg 240000 chicken broilers, 1464 tons/year Manure broker
9 Lee 51,200 growout turkeys, 2048 tons/year Land application
8
Because litter disposal via manure brokers is a major option of poultry farms in South Carolina, 4 out of the 57 permitted brokers in the state were surveyed via telephone to obtain the final disposition of the litter obtained from the farms. Table 8 shows pertinent information extracted from the telephone interviews. All the brokers interviewed land apply the litter collected from the farms.
Table 8. Survey of the disposition of poultry litter collected from poultry farms by manure brokers.
Broker Number County Final Litter Disposition
1 Abbeville Land application 2 Lexington Land application 3 Oconee Land application 4 Lee Land application
ALTERNATIVES FOR ENERGY GENERATION FROM POULTRY LITTER The project solicitation clearly focused on assessing anaerobic digestion as a technology for energy generation from poultry litter. Included in this report are other approaches to potential energy generation from poultry litter, including direct combustion, co-firing, and gasification. These technologies are extensively described in the literature. For completeness, a brief description of the technology is provided in this report. Relevant examples of pilot-scale and full-scale application of the technology are included. Anaerobic Digestion. Anaerobic digestion is a biological process where microorganisms convert organic materials to methane, carbon dioxide, and other organic compounds in the absence of oxygen [7]. Anaerobic digesters typically consist of large fermentation tanks with mechanical mixing, heating, and gas collection. Anaerobic digestion is not limited to manure products and can be applied at any site that produces organic materials. In this report, only farm based anaerobic digestion is addressed. The efficiency of conversion of manure to methane gas depends on many factors such as quality of manure, retention time in digester, and temperature of the digester [8]. If manure sits in a pit for 4-5 months before it is utilized, some of the methane producing potential will be lost, making it critical to utilize the manure soon after production.
There are three general steps in the anaerobic digestion of animal wastes [9]: 1 – hydrolysis (liquefaction) of animal manure by bacteria into soluble organic compounds; 2 – acetogenesis (acid production), or conversion of decomposed matter to organic acids; and 3 – methanogenesis (biogas production), or conversion of the organic acids to methane and carbon dioxide gas. Hydrolysis does not occur in all anaerobic treatment systems. However, for certain wastes, such as animal manure, food waste, pharmaceutical cells, and municipal wastewater treatment sludges, hydrolysis is an important reaction. Acetogenesis is accomplished by a general class of microorganisms known as the volatile fatty acid formers. The products of the acid-forming reaction are primarily acetic, propionic, butyric acid, carbon dioxide and new
9
bacterial cells. This step can occur over a broad range of pH and temperature. The final step is the formation of methane and carbon dioxide. Methanogens (methane forming bacteria) are very sensitive to environmental conditions, such as temperature, retention time, and pH. Depending on the waste feedstock and the system design, biogas is typically 55–75% methane. The produced biogas can be used to fuel internal combustion engines that run generators and produce electricity, or stored in microturbines or fuel cells after scrubbing (removing carbon dioxide and hydrogen sulfide).
Anaerobic digestion can be operated in the mesophilic range (temperature of 20–45ºC) with a retention time of 15 to 30 days or in the thermophilic range (temperature > 45ºC) with a retention time of 12 to 14 days. Thermophilic digestion systems offer higher methane production and better virus and pathogen reduction, but require greater energy input and higher cost of operation compared to mesophilic systems [10]. Several studies on the anaerobic digestion of poultry manure have been reported. Safley et al. [11] presented detailed documentation of a 3 year study on the anaerobic digestion of poultry layer manure with subsequent energy generation at 833 KWH/day. Collins et al. [12] compared the effects of different process conditions on the anaerobic digestion of poultry litter and provided an economic analysis of the system. Kelleher et al. [13] provide a review of different processes that have been used in the disposal of poultry litter, including anaerobic digestion. Barker [14] provided guidelines on the design of digesters for poultry layers and the expected energy yield and equivalents. Mississippi State University recently presented laboratory studies using broiler litter as a feed stock in anaerobic digesters to produce electricity, with an assessment for field application [15]. These studies show that anaerobic digestion of poultry manure is technically feasible. Direct Combustion. Direct combustion involves the burning of fuel with excess air, producing hot flue gases that are used to produce steam in the heat exchange sections of boilers. Steam is then used to produce electricity in steam turbine generators. Various fuels could be used during combustion, including different varieties of biomass (e.g., wood, animal manure, agricultural residue, and municipal solid waste) [16]. Direct combustion is the simplest and most developed biopower technology which can be economical on a large scale, particularly if the biomass resource is nearby the combustion plant.
The Fibrowatt Thetford poultry litter power plant is the largest chicken litter fueled plant in the world and Europe’s largest biomass fueled electricity generator. The plant is located at the center of England’s poultry producing region and consumes 420,000 tons of litter each year. The 38.5 MW plant has the capability to supply sufficient electricity for 93,000 homes. The plant is equipped with a Foster Wheeler boiler and arranged in the following steps: First, poultry litter is delivered to the plant. Second, the fuel is delivered to a fuel hall which has a capacity of 10,000 tons of fuel. Hourly, 55 tons of litters are fed to the boiler house by spiral screw augers into combustion chamber at 850 ºC. The water is heated at 450 ºC to produce steam for turbines connected to a generator [17]. This plant has been used as a basis for several studies on the economic feasibility of poultry litter combustion for energy generation [18, 19]. Fibrowatt has reported several plants (FibroMinn where construction has started and will be operational by

10
2007, and FibroShore and FibroMiss that are under development) that will use poultry litter in conjunction with other biomass fuels in the US [20]. Co-Firing. Co-firing of renewable fuels such as manure, waste wood, or energy crop biomass can be considered as a low cost option for reducing greenhouse gas emissions. Co-firing is the simultaneous combustion of a complementary fuel, such as animal manure or wood waste, with a base fuel, such as coal in a coal-fired boiler [21]. The biomass can either be introduced via a dedicated feed system or mixed with coal in the coal pile and fed to the boiler through the coal feed system. It can be the most economic near-term method for introducing new biomass power generation. Because much of the existing power plant equipment can be used without major modifications, co-firing is less expensive than building a new biomass power plant. The system is especially conducive to converting animal manure, agricultural residue, and some industrial byproducts into heat or electricity [22]. Biomass can be substitute for up to 15% of the pulverized coal used in the boiler and reduce net greenhouse gas emissions (CO2) by 18% [23], and reduce NOx up to 30% with a biomass combustion efficiency to electricity in the 33–37% range [24].
There have been numerous reports on the co-firing of different types biomass with coal [25], but limited information exists on the direct co-firing of poultry litter with coal. Mukhtar et al. [26] presented a study on the properties of broiler litter for co-firing, but did not appear to follow up on actual testing.
Gasification. In gasification, heat, steam, and pressure are used to convert organic materials into carbon monoxide and hydrogen (i.e., “syngas”) that can subsequently be used for the production of a variety of fuels and chemicals. The first step in gasification is pyrolysis where volatile components are vaporized and char (fixed carbon) is produced at temperatures under 1100 ºF. In the second step, the char and volatile products are combusted with oxygen to form CO and CO2, generating heat for gasification. In the final step, gasification process takes place where the char reacts with CO2 and steam to produce CO and H2. Hydrogen and carbon monoxide are the desired product gases, and they can be directly fired in a gas turbine for power generation or used in chemical synthesis [21].
Gasification has been applied successfully using organic materials, coal, and petroleum-
based materials [27]. Gasification of poultry litter at a small scale has successfully been demonstrated [25]. In Carnesville, Ga., a $20 million gasification plant is under construction that will convert poultry litter to electricity. Green Power EMC has agreed to purchase 20 MW from the plant [28]. MATERIAL VALUE OF POULTRY LITTER Numerous presentations and websites present the “economic value” of poultry litter without consideration of the costs associated with the production of this value. This material value is first presented, followed by a discussion of the production costs and an economic analysis.

11
Value as Fertilizer. From discussions with manure brokers, a survey of large poultry farms, as well as discussions with engineers working in the agricultural industry, SC DHEC personnel, and USDA personnel, it is clear that the primary method of poultry litter disposal in South Carolina is through land application as a crop fertilizer, with a small percentage disposed via composting. As such, the value of poultry litter as a fertilizer can be calculated assuming it takes the place of commercial bulk fertilizer [19]. The nutrient composition of the litter obtained from actual litter samples in permit records listed in Table 7 varies significantly. To simplify the analysis, the nutrient composition of the litter will be assumed based on standard estimated nutrient availability values for continuous application [4]. These values are used in designing animal waste management plans and are listed in Table 9. Calculations will be made for broiler chickens and turkeys as these are the predominant sources of litter.
Table 9. Nutrient content of broiler chickens and turkeys [4].
Parameter Broiler Chicken Turkey N, lbs/ton 37.4 52 P2O5, lbs/ton 36 50 K2O, lbs/ton 31 39 Moisture Content, % 25 25
Fifteen bulk fertilizer prices were obtained for different grades of fertilizer from 5 supply companies in South Carolina. The average price of N, P2O5, and K2O were essentially identical at $0.37 per lb with a range of $0.29 to $0.67 per lb. As a point of comparison, the average 2004 U.S. farm prices for urea (45-46% N), superphosphate (44-46%) and KCl (60%) are $276, $266, and $181 per ton [29], which translates to prices of $0.31 per lb N, $0.30 per lb P2O5, and $0.24 per lb K2O. Using the SC prices and the nutrient content in Table 9, the maximum material value of poultry litter is $38/ton of chicken broiler litter and $52/ton of turkey litter. This price assumes that all the nutrients applied have equivalent fertilizer value. Value as Anaerobic Digestion Feedstock. Volatile solids in poultry litter anaerobically converted to biogas could be used for energy production. Poultry litter has been reported to contain 47.3% volatile matter [18]. The fraction of volatile matter converted to biogas depends on operating conditions (e.g., 56% in [8], 53% in [11]) and has been typically assumed to be 60% [14]. The amount of biogas produced has been reported to be 8.6 [8], 9.6 [11], and 13 [14] ft3 per lb of volatile matter destroyed. The methane composition of the biogas ranges from 55-75% (e.g., mean of 58.3% with a std deviation of 5.6% for 87 samples [11]), and has been typically assumed to be 60% [14]. The energy value of biogas containing 60% methane content is 600 BTU/ft3 [14]. Thus, assuming 47.3% volatile matter, 60% destruction of volatile matter during anaerobic digestion, 13 ft3 biogas per lb of volatile matter destroyed, and 60% methane composition of the biogas, the energy value of poultry litter is 2200 BTU/lb and is calculated as follows,
litterlbBTU2200
biogasftBTU600
destroyedVSlbbiogasft13
VSlbdestroyedVSlb60.0
litterlbVSlb473.0 3
3
=×××
The net plant heat rate is the number of BTU required to produce a KWH of energy and
is a measure of the overall energy generation efficiency of a process. The heat rate depends on

12
the method by which electricity is generated. Goldstein et al. [30] published heat rates for natural gas fired distributed energy technologies. Electric heat rates ranged from 9200 to 11,500 BTU/KWH for reciprocating engine systems with nominal capacities from 0.1 to 5 MW, 9200 to 15,600 BTU/KWH for gas turbine systems with nominal capacities from 1 to 40 MW, 13,000 to 15,000 BTU/KWH for microturbine systems with nominal capacities from 30 to 100 kW, 7500 to 11,000 BTU/KWH for fuel cell systems with nominal capacities from 5 kW to 2 MW, 11,000 BTU/KWH for a Stirling Engine system with a nominal capacity of 55 kW. The average retail price of electricity of in South Carolina for all sectors as of April 2006 is $0.0674 per KWH [31]. Assuming a net plant heat rate of 10,000 BTU/KWH, the material value of poultry litter for electricity generation is $30/ton and is calculated as follows,
ton30$
tonlb2000
KWH0674.0$
BTU10000KWH
lbBTU2200 =×××
Value as Combustion Feedstock. Poultry litter can potentially be combusted with the
possibility of the ash sold for fertilizer production or for its mineral content. Two studies report the heating value of poultry litter ranging from 3400 to 6300 BTU/lb as received, ash content ranging from 10 to 34%, and moisture content ranging from 12 to 43% [18,25]. Turkey litter from Colorado had a lower heating value but had higher moisture content. Heating value is inversely proportional to the moisture content. For this report, a heating value of 4600 BTU/lb is assumed for both chicken and turkey litter.
Studies report net plant heat rates of 15,000 to 16,000 BTU/KWH [18] and 11700
BTU/KWH [32] for large electricity generating facilities directly combusting poultry litter. As a point of comparison, the net plant heat rate for various biomass utilizing energy plants (10 to 80 MW) range from 11,000 to 20,000 BTU/KWH [33]. Assuming a net plant heat rate of 15,000 BTU/KWH, the material value of poultry litter for electricity generation is $41/ton and is calculated as follows,
ton41$
tonlb2000
KWH0674.0$
BTU15000KWH
lbBTU4600 =×××
Using the bulk fertilizer prices in the previous calculations and assuming that the ash can
be sold at half the value to a fertilizer manufacturer, the phosphate and potassium value of the ash is $12/ton and $16/ton for chicken litter and turkey litter respectively. The overall material value could be $53 to $57/ton for poultry litter.
Value as Co-Firing Feedstock. Net plant heat rates for poultry litter co-fired in electricity-
generating plants were not found in the literature. Net plant heat rates reported for the biomass portion in biomass co-fired power plants range from 11,000 to 17,000 BTU/KWH [33]. Assuming a net plant heat rate similar to the combustion value of 15,000 BTU/KWH, the material value of poultry litter is $41/ton. If the ash could be sold at half the value to a fertilizer manufacturer, the material value could be $53 to $57/ton for poultry litter.
Value as Gasification Feedstock. Net plant heat rates for electricity generation with
gasification technology utilizing poultry litter have been estimated to be 28,500 BTU/KWH for a 1 MW self-contained facility [18], calculated at 68,000 BTU/KWH for an experimental 4.25 KW demonstration unit [25], and 17,000 BTU/KWH estimated for a 2.6 MW unit designed to be co-
13
fired with an existing pulverized coal-fired power plant in Kentucky [34]. As a point of comparison, a net plant heat rate of 18,500 BTU/KWH has been used in the analysis of gasification plants utilizing various biomass fuels that are co-fired in existing energy generating facilities [35]. Assuming net plant heat rate of 18,000 BTU/KWH, the material value of poultry litter is $34/ton. If the ash could be sold at half the value to a fertilizer manufacturer, the material value could be $46 to $50/ton for poultry litter. POTENTIAL ELECTRICITY GENERATION The size of required on-site and off-site electricity production facilities is estimated assuming poultry litter utilization rates of 1000 tons/year, 10,000 tons/year, and 50,000 tons/year for various technologies. 1000 tons/year is representative of large chicken broiler farms. 10,000 tons/year is representative of the largest farms in SC and could be a small group of adjacent farms that cooperatively produce electricity. 50,000 tons/year is representative of a regional scale (county or multiple county level) scale implementation of electricity generation. The potential amount of electricity produced and the required plant size assuming power production at a 100% capacity factor is shown in Table 10. The calculated plant size would be larger at lower capacity factors but is useful as an indication of the scale of equipment required. The scale of equipment is within the same order of magnitude for various poultry litter utilization rates. Calculations were not provided for co-firing technologies as these are not expected to be on-farm facilities and poultry utilization rates would be dependent on the capacity of the primary combustion facility. COST ASSOCIATED WITH POULTRY LITTER DISPOSAL AND ENERGY GENERATION Disposal Costs and Transportation Costs. Poultry farmers currently dispose of their litter either by land applying the litter themselves to agricultural farms and selling the litter to a manure broker who would then sell the litter to an agricultural farmer as fertilizer. The manure broker usually spreads the manure on the farmland. Two of the poultry farmers in Table 7 have specific contracts where the manure broker purchases poultry litter from the farmers at $3/ton. The manure brokers in Table 8 purchase poultry litter from farms at prices ranging from $0/ton to $6/ton. The brokers then transport and sell the litter to a farm at prices ranging from $10/ton to $30/ton, depending on the distance. The brokers would obtain and deliver the litter within 50 miles of their location. One broker stated that a 50 mile delivery would cost $180 to $200 using a trailer that can carry up to 25 tons of poultry litter. Assuming 80% trailer capacity, this would translate to $9 to $10 per ton (Note that this does not include cleaning, loading, unloading, and spreading costs). Others have used cleanout costs at $4/ton and transportation costs at $10/ton [19] and a hauling cost of $2/mile [36]. Energy generation equipment . It has been difficult to get the price of installing energy generating equipment in South Carolina. Manufacturers consider it inappropriate to give quotes without knowing specific application conditions (One requested payment for services to provide a quote). Since this study involved more of a survey of the potential for energy generation from poultry litter, the approach taken is to use the most updated published values of equipment costs.

14
Table 10. Size of electricity generation equipment required for various technologies.
Poultry Litter Utilized Technology Parameter 1000 tons/yr 10,000 tons/yr 50,000 tons/yr Energy Value, BTU/lb
2200 2200 2200
Assumed Heat Rate, BTU/KWH
10,000 10,000 10,000
Electricity Produced, MWH
440 4400 22,000
Anaerobic Digestion
Size of Plant, kW 50 500 2500 Energy Value, BTU/lb
4600
4600 4600
Heat Rate, BTU/KWH
15,000 15,000 15,000
Electricity Produced, MWH
610 6100 31,000 Combustion
Size of Plant, kW 70 700 3500 Energy Value, BTU/lb
4600 4600 4600
Heat Rate, BTU/KWH
18,000
18,000
18,000
Electricity Produced, MWH
510 5100 26,000 Gasification
Size of Plant, kW 58 580 2900 Reports of the capital cost of anaerobic digestion equipment applied specifically to poultry litter are very limited. One study estimated the cost of a facility to be $10,000 to $25,000 per thousand cubic feet per day of methane production in 1997 dollars [12], with the analysis that $25,000 was likely more accurate at that time. Since methane has an energy value of 1008 BTU/ft3, the cost This would be equivalent to
KW950,5$
dayhr24
KWHBTU000,10
BTU1008ft
dayft10
000,25$ 3
33
=×××
Anaerobic digestion of other livestock wastes is more prevalent. One study estimated the capital cost of a digester system (including mix tank, pipine, digester, enginer, electrical genset, engineering costs, etc.) as $424,000 in 2005 dollars for an 800 cow operation producing 1253 KWH/cow/year [37]. The plant size is estimated at 114 KW and would cost $3705/KW, with annual operating costs of $15,000 for the first 5 years, $125,000 for engine replacement and generator repair at the end of year 5, and $25,000 for the next 5 years. Capital cost information for the combustion of poultry litter are estimated as ranging from $2500 to $2900/KW in 2000 dollars for 12 to 40 MW new facilities [18,19]. However, based on projected plant size in Table 10, it is likely that facilities in SC will be smaller. For

15
distributed generation applications, the costs for a biomass combustion facility was estimated for a 700 kW stoker boiler plant as $10,500/KW with fixed annual operating and maintenance costs of $1,800/KW, and $2800/KW for a 10 MW stoker boiler plant with fixed annual operating and maintenance costs of $180/KW [38]. Although the report [38] did not specify the year in which these costs are obtained, other tables show cost figures in 2006 dollars.
Capital cost information for the gasification of poultry litter using a Biomax Modular Power System were reported in 2001 to be $1520/KW for a 0.5 MW system and $1121/KW for a 1 MW system [25]. A more updated 2005 report on the analysis of a Biomax system for gasifying forest residues shows capital costs at $2000/KW for a 100 KW system and $1500/KW for a 1 MW system [39]. The same 2005 report shows detailed calculations of fixed and variable operating costs of $142000 to $188,000 over a 10 year period. ECONOMIC ANALYSIS The energy value of the poultry litter has to be balanced by the production costs. Studies report the measure of economic viability by presenting the costs in $/KWH, the nominal rate of return, and the payback period. Rather than normalizing all calculations to a specific power plant size, we chose to use the cost figures reported in the literature for the corresponding power plant size shown in the previous section to evaluate whether it would be feasible to generate electricity from poultry litter. Critical to an economic analysis is the selection of a rate of return and the payback period. Two related studies [18,19] use a 15% rate of return and a 20-year time frame in their economic analysis of 12-40 MW plants. The Antares group [18] states that a 3 year payback period is typically used to justify energy production at industrial facilities. Bilek et al. [39] use a 10 year period in analyzing the economics of biomass gasification. AgSouth Farm Credit stated in a telephone conversation in July 2006 that, in general, they could give poultry farmers 15-year loans at 9.25–10% interest with a 25% down payment. However, a loan for energy generation is a unique application that must have acceptable collateral and must be studied carefully when the situation arises. For this study, a 10-year time period at a 10% rate of return is used for the base analysis. Table 11 shows a comparison of the costs associated with producing electricity using various technologies. The primary costs included in the analysis are capital costs, operation and maintenance, litter cleanout, and transportation. Also included in the analysis is the potential recovered ash value. The costs are normalized to a KWH. Thus, although the cleanout costs are assumed to be the same per ton of litter, the electricity produced from each ton depends on the technology selected. Transportation costs are excluded for on-site systems. Anaerobic digestion does not produce ash, and is assumed not to produce any value from sludge that might be recovered. Table 11 shows the cost of generating electricity is greater than the average retail price for anaerobic digestion and combustion under the assumed conditions. Calculations show that gasification is potentially economically viable.

16
Table 11. Cost analysis assuming a 10 year time frame at a 10% rate of return.
Anaerobic Digestion Combustion Combustion Gasification Gasification
Year of Reported Cost Figures 2005 likely 2006 likely 2006 2005 2005 Plant Rating, kW 114a 700 10000 100 1000 Probable Application on-site off-site regional on-site off-site Capital Costs, $/kW $3,719 $10,500 $2,800 $2,000 $1,500 O&M Costs, $/kW $219 $1,800 $180 $200 $150 Capacity Factor 100% 80% 80% 81.70% 81.70% Capital Costs, $/KWH $0.4230 $1.4983 $0.3995 $0.2793 $0.2095 Levelized Capital Costs, $/KWH $0.0688 $0.2438 $0.0650 $0.0455 $0.0341 O&M Costs, $/KWH $0.0249 $0.3211 $0.0321 $0.0279 $0.0209 Cleanout Costs, $/KWH $0.0091 $0.0087 $0.0078 $0.0078 $0.0078 Transportation Costs, $/KWH $0.0000 $0.0261 $0.0235 $0.0000 $0.0235 Ash Value, $/KWH $0.0000 $0.0261 $0.0235 $0.0235 $0.0235 Cost of Production, $/KWH $0.1029 $0.5736 $0.1050 $0.0577 $0.0629 SC Average Electricity Retail Price, $/KWH $0.0674 $0.0674 $0.0674 $0.0674 $0.0674
aexact rating not specified
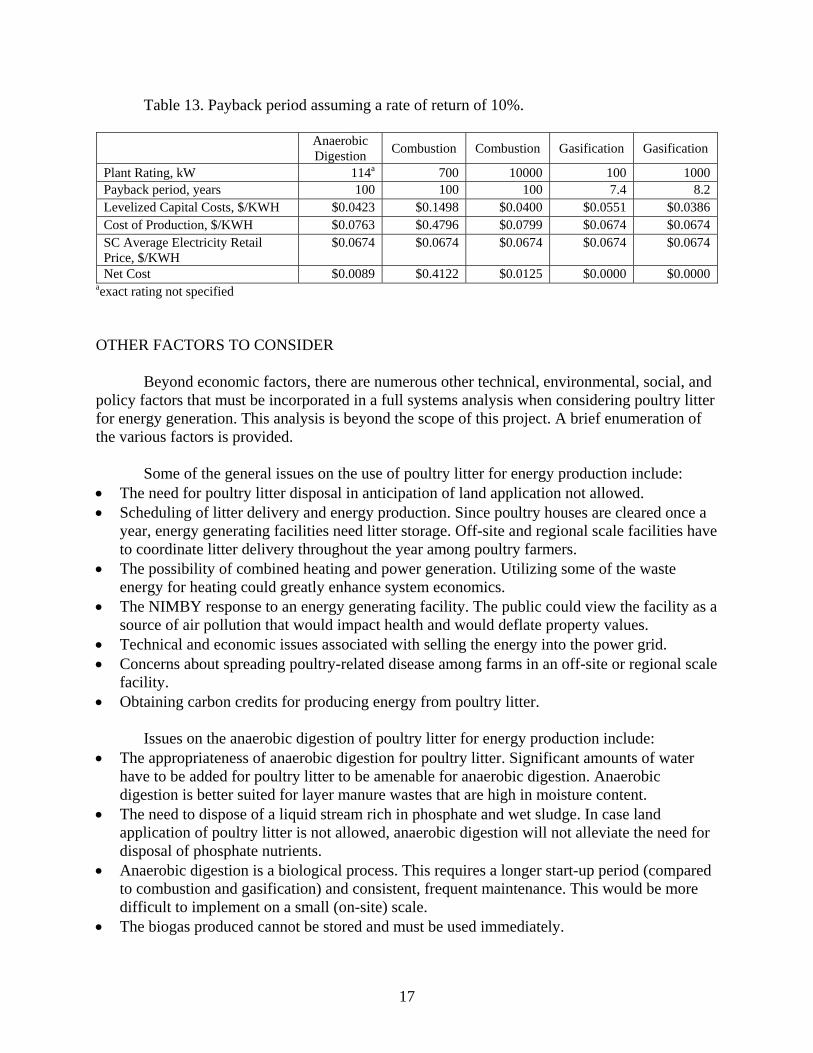
As expected, the same conclusions are reached when analyzing the rate of return and the payback period. Negative rates of return are shown in Table 12 for anaerobic digestion and combustion. For the 700 kW combustion plant, a net cost of zero cannot be calculated despite large negative rates of return (resulting in near-zero levelized capital costs) because of extremely high operating and maintenance costs. The gasification systems show rates of return more than 10%. Table 13 shows that the cost of production exceeds the SC average retail price of electricity for anaerobic digestion and combustion despite payback periods greater than 100 years. Gasification systems have payback periods less than 10 years.
Table 12. Rate of return assuming a 10 year time frame.
Anaerobic Digestion Combustion Combustion Gasification Gasification
Plant Rating, kW 114a 700 10000 100 1000 Rate of Return, % -4.10% -50.00% -6.30% 14.76% 13.00% Levelized Capital Costs, $/KWH $0.0334 $0.0007 $0.0275 $0.0551 $0.0386 Cost of Production, $/KWH $0.0674 $0.3305 $0.0674 $0.0674 $0.0674 SC Average Electricity Retail Price, $/KWH
$0.0674 $0.0674 $0.0674 $0.0674 $0.0674
Net Cost $0.0000 $0.2631 $0.0000 $0.0000 $0.0000 aexact rating not specified
17
Table 13. Payback period assuming a rate of return of 10%.
Anaerobic Digestion Combustion Combustion Gasification Gasification
Plant Rating, kW 114a 700 10000 100 1000 Payback period, years 100 100 100 7.4 8.2 Levelized Capital Costs, $/KWH $0.0423 $0.1498 $0.0400 $0.0551 $0.0386 Cost of Production, $/KWH $0.0763 $0.4796 $0.0799 $0.0674 $0.0674 SC Average Electricity Retail Price, $/KWH
$0.0674 $0.0674 $0.0674 $0.0674 $0.0674
Net Cost $0.0089 $0.4122 $0.0125 $0.0000 $0.0000 aexact rating not specified OTHER FACTORS TO CONSIDER Beyond economic factors, there are numerous other technical, environmental, social, and policy factors that must be incorporated in a full systems analysis when considering poultry litter for energy generation. This analysis is beyond the scope of this project. A brief enumeration of the various factors is provided. Some of the general issues on the use of poultry litter for energy production include: • The need for poultry litter disposal in anticipation of land application not allowed. • Scheduling of litter delivery and energy production. Since poultry houses are cleared once a
year, energy generating facilities need litter storage. Off-site and regional scale facilities have to coordinate litter delivery throughout the year among poultry farmers.
• The possibility of combined heating and power generation. Utilizing some of the waste energy for heating could greatly enhance system economics.
• The NIMBY response to an energy generating facility. The public could view the facility as a source of air pollution that would impact health and would deflate property values.
• Technical and economic issues associated with selling the energy into the power grid. • Concerns about spreading poultry-related disease among farms in an off-site or regional scale
facility. • Obtaining carbon credits for producing energy from poultry litter. Issues on the anaerobic digestion of poultry litter for energy production include: • The appropriateness of anaerobic digestion for poultry litter. Significant amounts of water
have to be added for poultry litter to be amenable for anaerobic digestion. Anaerobic digestion is better suited for layer manure wastes that are high in moisture content.
• The need to dispose of a liquid stream rich in phosphate and wet sludge. In case land application of poultry litter is not allowed, anaerobic digestion will not alleviate the need for disposal of phosphate nutrients.
• Anaerobic digestion is a biological process. This requires a longer start-up period (compared to combustion and gasification) and consistent, frequent maintenance. This would be more difficult to implement on a small (on-site) scale.
• The biogas produced cannot be stored and must be used immediately.

18
Issues on the combustion and co-firing of poultry litter for energy production include: • The public response to a perceived incinerator. • The need for air pollution control devices. • The location of primary combustion facility for co-firing the litter. • Co-firing could reduce sulfur and NOx emissions. • In case land application of poultry litter is not allowed, this technology will be a viable
means to dispose of poultry litter. • Possibilities of ash usage. Issues on the gasification of poultry litter for energy production include: • Relatively limited full-scale applications. • The public response to a perceived incinerator. • The need for air pollution control devices. • In case land application of poultry litter is not allowed, this technology will be a viable
means to dispose of poultry litter. • The gas produced cannot be stored and must be used immediately. • Possibilities of ash usage. CONCLUSIONS AND RECOMMENDATIONS Adequate amounts of poultry litter are available in numerous counties within South Carolina that could potentially be tapped for energy generation initiatives. Sustained economic viability should be the primary driver for many initiatives. Although other studies have shown that the technologies were not economical [12,18,19,25,39], the increasing cost of electricity has made energy production from poultry litter potentially viable. The cost data shown in Tables 11 to 13 illustrate that some technologies may be more viable than others. However, the economic analysis presented is far from comprehensive. A full systems analysis must be performed prior to making full conclusions. This analysis would use cost and technical data appropriate for the technology and location selected. First, this system should be identified.
In discussions within the Gaseous Fuels Committee within the South Carolina Biomass Council, it is anticipated that it would be difficult to convince poultry farmers to adapt energy generation on-site. Off-site cooperative and regional energy generating facilities may be more viable. It was suggested that poultry integrators would be a potential good prospect for energy production. The integrators are located within reasonable distance of poultry farms, have established relations with the farmers, have large centralized facilities that could utilize combined heating and power generating facilities, and have a vested interest in ensuring continued viability of poultry farms if land application of poultry litter is not allowed. Identifying a poultry integrator facility willing to consider this possibility and performing a systems analysis on that facility would provide a more accurate assessment of the viability of energy production from poultry litter.
Another possible avenue of future work would be to pursue an initiative similar to the
arrangement in Georgia between Earth Resources, Inc. and Green Power EMC (which consists of 28 electric membership corporations). Earth Resources, Inc. uses gasification technology to
19
generate electricity, which is consistent with the economic analysis in Tables 11-13 that show gasification to be cost-effective. However, detailed information on the Georgia system could not be obtained for use in an economic analysis in this report. It is possible that higher level discussions would indicate more serious inquiries that would better reveal the cost structure of the initiative. ACKNOWLEDGEMENTS The authors gratefully acknowledge the contributions of the following individuals for their significant contributions to the project: Jeannie Eidson, Teige Elliot, Jodie Hamm, and Sandra Sailer-Taylor from SC DHEC, Stephen Henry from USDA/NRCS, and Leon Fulmer and Joyce Shealy of Shealy Consulting, Dr. John Ingersoll of ECO Corp., and Dr. Howard Van Dijk of the Clemson Extension Service. REFERENCES [1] SC DHEC, Standards for the Permitting of Agricultural Animal Facilities,
http://www.scdhec.gov/eqc/water/regs/r61-43.pdf, last accessed July 7, 2006. [2] SC DHEC, Agricultural Program Facility Maps: Turkey,
http://www.scdhec.net/water/images/turkey.pdf, last accessed July 7, 2006. [3] SC DHEC, Agricultural Program Facility Maps: Poultry,
http://www.scdhec.net/water/images/poultry.pdf, last accessed July 7, 2006. [4] USDA, National Resources Conservation Service Electronic Field Office Technical Guide:
Supplement 1 of the SC Agricultural Waste Management Field Handbook, http://efotg.nrcs.usda.gov/efotg_locator.aspx?map=SC, last accessed July 18, 2006.
[5] USDA, National Agricultural Statistics Service: South Carolina Statistics, http://www.nass.usda.gov/Statistics_by_State/South_Carolina/index.asp#.html, last accessed July 18, 2006.
[6] US EPA, Concentrated Animal Feeding Operations Clean Water Act Requirements, http://www.epa.gov/npdes/pubs/cafo_brochure_chicken.pdf, last accessed July 18, 2006.
[7] California Energy Commission, http://www.energy.ca.gov/development/biomass/anaerobic.html, last accessed August 2, 2006.
[8] Jenner, M., “The Biotown, USA Sourcebook of Biomass Energy,” Indiana State Department of Agriculture and Reynolds, Indiana, April 2006, http://www.in.gov/biotownusa/pdf/Biotown_Sourcebook_040306.pdf, last accessed July 24, 2006.
[9] Legett, J., Graves, R.E., and Lanyon, L.E., “Anaerobic Digestion: Biogas Production and Odor Reduction from Manure,” Pennsylvania State University College of Agricultural Science Cooperative Extension, http://www.age.psu.edu/extension/factsheets/g/G77.pdf, last accessed August 4, 2006.
[10] Biorefining Process: Anaerobic Digestion, http://www.wisbiorefine.org/proc/anaerobic.pdf, last accessed August 4, 2006.

20
[11] Safley Jr., L.M., Vetter, R.L., and Smith, L.D., “Management and Operation of a Full-Scale Poultry Waste Digester,” Poultry Science, 66:941-945, 1987.
[12] Collins, A.R., Murphy, J., and Bainbridge, D. “Optimal Loading Rates and Economic Analyses for Anaerobic Digestion of Poultry Waste.” Journal of the Air and Waste Management Association, 50:1037-1044, 2000.
[13] Kelleher, B.P., Leahy, J.J., Henihan, A.M., O’Dwyer, T.F., Sutton, D., and Leahy, M.J. “Advances in Poultry Litter Disposal Technology – A Review.” Bioresource Technology, 83:27-36, 2002.
[14] Barker, J.C., “Methane Fuel Gas from Livestock Wastes – A Summary,” North Carolina Cooperative Extension Service Publication Number EQAE 071-90, March 2001, http://www.bae.ncsu.edu/programs/extension/publicat/wqwm/ebae071_80.html, last accessed July 24, 2006.
[15] Mississippi Technology Alliance, http://www.technologyalliance.ms/strategic-biomass-initiative/alternative-energy/poultry-litter.php, last accessed August 10, 2006.
[16] Apollo Alliance, “Biomass 101,” http://www.apolloalliance.org/strategy_center/reports_and_resources/clean_energy_101/biomass101.cfm, last accessed August 10, 2006.
[17] Poultry-litter power station: Fibrowatt, Thetford, UK, http://www.aboutbioenergy.info/Thetford.html, accessed August 10, 2006.
[18] Antares Group, Inc., T.R. Miles Consulting, Inc., and Foster Wheeler Development Corporation, “Economic and Technical Feasibility of Energy Production from Poultry Litter and Nutrient Filter Biomass on the Lower Delmarva Peninsula,” Final Report submitted to the Northeast Regional Biomass Program, 1999, http://www.nrbp.org/pdfs/pub20a.pdf, last accessed July 21, 2006.
[19] Lichtenberg, E., Parker, D., and Lynch, L., “Economic Value of Poultry Litter Supplies for Alternative Uses,” Center for Agricultural and Natural Resource Policy – Policy Analysis Report No. 02-02, http://www.arec.umd.edu/agnrpolicycenter/Publications/Reports/Parker_PoultryLiter.pdf, last accessed July 21, 2006.
[20] Fibrowatt, LLC Home Page, http://www.fibrowattusa.com/index.html, last accessed August 10, 2006.
[21] Alternative Technologies/Uses for Manure (DRAFT), http://www.oardc.ohio-state.edu/ocamm/Draft%20EPA%20Alternative%20Technologies.pdf, last accessed August 10, 2006.
[22] Confirming Biomass in Coal-Fired Boilers. Foster Wheeler Review, Spring 1999, Volume 1, No. 1, http://www.fwc.com/publications/heat/heat_html/spr99/confiring.cfm, last accessed August 10, 2006.
[23] Biopower Factsheet. Biomass Co-Firing: A Renewable Alternative for Utilities, June 2000, http://www.nrel.gov/docs/fy00osti/28009.pdf, last accessed August 10, 2006.
[24] Biomass Co-Firing: A Renewable Alternative for Utilities, August 1999, DOE/GO-10099-914, August 1999, http://www.nrel.gov/docs/fy99osti/27048.pdf, last accessed August 10, 2006.
[25] Reardon, J.P., Lilley, A., Browne, K., Beard, K., Wimberly, J., and Avens, J., “Demonstration of a Small Modular Biopower System Using Poultry Litter,” Final Report submitted to the Department of Energy, 2001,
21
http://www.osti.gov/bridge/servlets/purl/794292-6l279H/native/794292.pdf, last accessed July 21, 2006.
[26] Mukhtar, S., Annamalai, K., Thien, B., Porter, S.C. “Co-firing of Coal and Broiler Litter for Power Generation – BL Fuel Quality and Characteristics.” Paper No 024189, American Society of Agricultural Engineers Annual International Meeting / CIGR 15th World Congress, Chicago, IL, July 28-31, 2002.
[27] Conversion Technology For Municipal Residuals, May 2001, http://www.ciwmb.ca.gov/organics/Conversion/Events/TechForum00/ForumPaper.doc, last accessed August 10, 2006.
[28] EMCs Sign Unique Renewable Energy Agreement, http://www.greenpoweremc.org/article.aspx?categID=4&articleID=699, last accessed August 10, 2006.
[29] USDA Economic Research Service, Table 7 - Average U.S. farm prices of selected fertilizers for 1960-2003, http://www.ers.usda.gov/Data/FertilizerUse/Tables/Fert%20Use%20Table%207.xls, last accessed July 19, 2006.
[30] Goldstein, L., Hedman, B., Knowles, D., Freedman, S.I., Woods, R., Schweizer, T., “Gas-Fired Distributed Energy Resource Technology Characterizations,” NREL/TP-620-34783, http://www.nrel.gov/docs/fy04osti/34783.pdf, last accessed July 24, 2006.
[31] Energy Information Administration, Average Retail Price of Electricity to Ultimate Customers by End-Use Sector by State, April 2006. http://www.eia.doe.gov/cneaf/electricity/epm/table5_6_a.html, last accessed July 21, 2006.
[32] Tschanun, I. and Mineur, M. “Biomass Combustion with State of the Art Bubbling Bed Steam Generators,” 2003, http://www.powergeneration.siemens.com/download/pool/industrialheatpower_01.pdf, last accessed July 21, 2006.
[33] Wiltsee, G. “Lessons Learned from Existing Biomass Energy Power Plants,” NREL/SR-570-26946, 2000, http://www.nrel.gov/docs/fy00osti/26946.pdf, last accessed July 21, 2006.
[34] Patel, B., McQuigg, K., and Tourney, R., “Gasification Based Biomass Co-Firing Project: Integration of Poultry Litter Gasification with Conventional PC Fired Power Plant,” http://www.p2pays.org/ref/05/04868.pdf, last accessed July 21, 2006.
[35] GE Energy and Environmental Research Corporation, “Utilization of Waste Renewable Fuels in Boilers with Minimization of Pollutant Emissions,” November 2005, http://www.energy.ca.gov/2005publications/CEC-500-2005-177/CEC-500-2005-177.PDF, last accessed July 21, 2006.
[36] Collins, A.R. and Basden, T., “A Policy Evaluation of Transport Subsidies for Poultry Litter in West Virginia.” Review of Agricultural Economics, 28(1):72-88, 2006.
[37] Lazarus, W.F. and Rudstrom, M. “Profits from Manure Power? Economic Analysis of the Haubenschild Farms Anaerobic Digester.” http://www.apec.umn.edu/documents/Lazarus-RudstromSem05.pdf, last accessed August 7, 2006.
[38] La Capra Associates, Inc. “Velco/CVPS Southern Loop Project Distributed Generation Study.” http://www.velco.com/Files/Southern%20Loop/VELCO%20CVPS%20La%20Capra%20DG%20Report%20Final%2005%2011%2006.pdf, last accessed August 7, 2006.
[39] Bilek, E.M., Skog, K.E., Fried, J., and Christensen, G. “Fuel to Burn: Economics of Converting Forest Thinnings to Energy Using Biomax in Southern Oregon.” USDA Forest

22
Service, Forest Products Laboratory General Technical Report FPL-GTR-157, http://www.fpl.fs.fed.us/documnts/fplgtr/fpl_gtr157/fpl_gtr157.pdf, last accessed August 7, 2006.
[40] Poultry Related Definitions, http://www.progressivebioactives.com/faq_item.php?faqId=44, last accessed August 28, 2006.