final report · table 6. 3 historical data of streetlight program dissemination ... program langit...
TRANSCRIPT

CENTER FOR TRANSPORTATION AND LOGISTICS STUDIES
UNIVERSITAS GADJAH MADA
( P U S T R A L )
Study on Practice Diffusion and Adoption Processunder Cities for Climate Protection (CCP) Programin Indonesia
FINAL REPORT
Funded by:
The Institute for Global Environmental Strategies (IGES)a not-for-profit corporation organised in accordance with the Japanese Civil Code
Researcher:
Prof. Dr. Danang Parikesit

Study on Practice Diffusion and Adoption Processunder Cities for Climate Protection (CCP) Programin Indonesia
FINAL REPORT
Disclaimer:The content of the report is solely the responsibility of the researchersand does not represent the policy of The IGES
(Contract signed on 23 June 2008)

i
Forewords
This Final Report on Study on Practice Diffusion and Adoption Process under Cities for
Climate Protection (CCP) Program in Indonesia is submitted to comply with the Contract
signed on June 23rd, 2008 between The Institute for Global Environmental Strategies (IGES)
and the Center for Transportation and Logistics Studies (PUSTRAL) Gadjah Mada University
Yogyakarta, Indonesia.
This report contains the findings of the practise for the diffusion and adoption process of
Streetlights Management Scheme Project in Yogyakarta, Community-Based Biogas Project:
Converting Liquid Waste to Energy Project in Denpasar and Fuel Switching for City
Government Vehicles Project in Surabaya.
We would like to acknowledge Ir. I Gusti Putu Suparsa, MT from University of Udayana,
Denpasar for his assistance in coordinating the survey in Denpasar and Ir. Hera Widyastuti,
MT from Sepuluh November Institute of Technology in Surabaya for her assistance in
coordinating the survey in Surabaya. The hard work of surveyors in Yogyakarta (Robby
Adiarta, Lukman Syarifuddin, Yenny Beatrix, Baharufahmi and David E.H.P), Denpasar (I
Gusti Ayu Putri Adnya Swari, Komang Adi Prabawa, Dewa Putu Adi Sucipta and I Gusti
Ngurah Made Abdi Yasa) and Surabaya (M. Hafiizh, Adistra Widyanie and Tommy Febri
Setyawan) are very much appreciated.
The report will not be completed without the assistance from various individuals and
organizations in Yogyakarta and Denpasar. We wish to express our sincere appreciation to
The City Council of Yogyakarta and Denpasar, The City Planning Office of Yogyakarta and
Denpasar, City Environment Office of Yogyakarta and Denpasar, City Infrastructure Office of
Yogyakarta, Electricity Company in Yogyakarta, BORDA, Bali Fokus, Lestari Indonesia,
WALHI Yogyakarta, BERNAS Yogyakarta, Kedaulatan Rakyat Yogyakarta, and individuals for
their active participation and support that can make this report completed and presented to
relevant parties. We hope that the results of the study can be of the consideration for other
cities to reduce the green gas houses through local initiatives.
The report will not be completed without the assistance from various individuals and
organizations in Yogyakarta, Denpasar and Surabaya. We wish to express our sincere
appreciation to The City Council of Yogyakarta, Denpasar and Surabaya, The City Planning
Office of Yogyakarta, Denpasar and Surabaya, City Environment Office of Yogyakarta,
Denpasar and Surabaya, City Infrastructure Office of Yogyakarta, Electricity Company in
Yogyakarta, BORDA, Bali Fokus, Lestari Indonesia, Jawa Pos Surabaya, WALHI Yogyakarta,
BERNAS Yogyakarta, Kedaulatan Rakyat Yogyakarta and individuals for their active
participation and support that can make this report completed and presented to relevant
parties. We hope that the results of the study can be of the consideration for other cities to
reduce the green gas houses through local initiatives.

ii
Summary of City Profile No Criteria Yogyakarta Denpasar Surabaya
1 Area (km2) 32.5 127.78 326.37
2 Population (persons) 528,789*** 583,600** 2,861,928***
3 GDP (Mio USD) 791.4** 711** 9,170*
4 City GDP to Provincial GDP (%)
20** 20** 23*
5 City GDP to National GDP (%)
0.3** 0.23** 3*
6 Economic Growth (%) 4.13** 5.88** 5.67*
7 Income per capita (USD) 1,787** 1,218** 3,400*
8 City Revenue (Mio USD) 62.64*** 55.74*** 203.5***
9 Average allocated budget for Environmental program (%)
4-5 6-8 NA
Notes: *2005 **2006 ***2007

iii
Table of Content
Forewords
Summary of City Profile
Table of Content
List of Tables
List of Figures
List of Boxes
List of Abbreviations
CHAPTER 1 INTRODUCTION ............................................................................................1-1
1.1. Background............................................................................................1-1
1.2. Objective ................................................................................................1-1
1.3. Methodology ......................................................................................... 1-2
1.4. Schedule................................................................................................ 1-3
CHAPTER 2 CITIES PROFILE............................................................................................ 2-1
2.1. Yogyakarta ............................................................................................ 2-1
1. General Description ....................................................................... 2-1
2. Economic Condition ...................................................................... 2-1
2.2. Denpasar...............................................................................................2-4
1. General Description .......................................................................2-4
2. Economic Condition ......................................................................2-6
2.3. Surabaya ...............................................................................................2-7
1. General Description .......................................................................2-7
2. Economic Condition ......................................................................2-9
CHAPTER 3 STAGES OF POLICY PROCESS..................................................................... 3-1
3.1. Regional Mid-Term Development Plan ............................................... 3-1
3.2. Process of Establishing City RPJMD ................................................... 3-1
3.3. Development Challenges of the City ....................................................3-2
3.4. Regional Development Policy and Programme ...................................3-3
CHAPTER 4 CONDITION OF PUBLIC SECTOR FUNDING............................................. 4-1
4.1. Regional Budget Plan (APBD).............................................................. 4-1
1. Regional Revenue .......................................................................... 4-1
2. Regional Expenditure ....................................................................4-4
3. Regional Financing ........................................................................4-5
4.2. Public Sector Financing by Sectors ......................................................4-6
CHAPTER 5 CAPACITY BUILDING OF GOVERNMENT STAFFS AND ROLE OF
INTERCITY PROGRAM................................................................................. 5-1

iv
CHAPTER 6 PROGRAMME OF EACH CITY...................................................................... 6-1
6.1. Yogyakarta ............................................................................................ 6-1
1. Project Description: Streetlight Management Scheme Programme..................................................................................... 6-1
2. Methodology in Reducing the GHG Emission ..............................6-2
3. Scope of the Project........................................................................6-2
4. Stakeholders Involvement .............................................................6-3
5. Financing........................................................................................6-5
6. Project Co-Benefits ........................................................................6-5
6.2. Denpasar...............................................................................................6-6
1. Project Description: Community-Based Biogas Project: Converting Liquid Waste to Energy ..............................................6-6
2. Methodology in Reducing the GHG Emission ............................. 6-8
3. Scope of the Project....................................................................... 6-8
4. Stakeholders Involvement .............................................................6-9
5. Financing........................................................................................6-9
6. Project co-benefits .......................................................................6-10
6.3. Surabaya .............................................................................................6-10
1. Project Description: Fuel Switching for City
Government Vehicles...................................................................6-10
2. Methodology in Reducing the GHG Emission ............................ 6-12
3. Scope of the Project...................................................................... 6-12
4. Stakeholders Involvement ........................................................... 6-12
5. Financing......................................................................................6-14
6. Project Co-benefits.......................................................................6-14
CHAPTER 7 CONCLUDING REMARKS ............................................................................ 7-1
REFERENCES
ANNEXES
1. LIST OF RESPONDENTS
2. COEFFICIENT VALUE
3. TABLES AND FIGURES OF YOGYAKARTA CITY
4. TABLES AND FIGURES OF DENPASAR CITY
5. TABLES AND FIGURES OF SURABAYA CITY
6. QUESTIONNAIRES AND SUMMARY OF RESULTS

v
List of Tables
Table 1. 1 Schedule of the Project............................................................................................. 3
Table 2. 1 Regional GDP of Yogyakarta City by Industrial Origin at Current Prices (Million Rp) .............................................................................................................. 2
Table 2. 2 Economic Growth by Constant Price in Yogyakarta City (%) ................................. 3
Table 2. 3 Economic Structure of Yogyakarta City (%) ............................................................ 4
Table 2. 4 Regional GDP of Denpasar City by Industrial Origin at Current Prices (Million IDR)............................................................................................................ 6
Table 2. 5 Economic Growth by Constant Price in Denpasar City (%) .................................... 7
Table 2. 6 Economic Structure of Denpasar City (%)............................................................... 7
Table 2. 7 Regional GDP of Surabaya City by Industrial Origin at Current Prices (Million Rp) .............................................................................................................. 9
Table 2. 8 Economic Growth by Constant Price in Surabaya City ......................................... 10
Table 2. 9 Economic Structure of Surabaya City (%) ............................................................. 10
Table 6. 1 GHG Forecasting.......................................................................................................1
Table 6. 2 GHG Monitoring ......................................................................................................2
Table 6. 3 Historical Data of Streetlight Program Dissemination ........................................... 3
Table 6. 4 Saving from the Payment of Streetlight Bill ............................................................ 6
Table 6. 5 Historical Data of Biogas Program Dissemination.................................................. 9
Table 6. 6 Green House Gas Reduction from the CNG Program .......................................... 12
Table 6. 7 Targets and Performance Indicators ..................................................................... 12
Table 6. 8 Outreach Process of CNG Program........................................................................ 13

vi
List of Figures
Figure 2. 1 Administrative Map of Yogyakarta City................................................................... 2
Figure 2. 2 Administrative Map of Denpasar City ..................................................................... 5
Figure 2. 3 Administrative Map of Surabaya City......................................................................8
Figure 3. 1 Process of Program Adoption in Indonesian Cities................................................. 2
Figure 6. 1 KWh Meter in Public Streetlights .............................................................................1
Figure 6. 2 Yogyakarta Mayor (Herry Zudianto) and Honolulu Mayor (Jeremy Harris) in the MAPES 2003 Held in Honolulu, Hawaii........................................................... 4
Figure 6. 3 Development Process of in Ubung Village............................................................... 7
Figure 6. 4 City Government’s Car with CNG Fuel ................................................................... 11

vii
List of Boxes Box 1. NGO Lestari Indonesia................................................................................................... 5-1
Box 2. NGO Bali Fokus .............................................................................................................5-2
Box 3. Jawa Pos Newspaper......................................................................................................5-3
Box 4. Voice of the Community (Yogyakarta) ..........................................................................6-5
Box 5. Voice of Community (Denpasar) .................................................................................6-10
Box 6. Voice of Community (Surabaya)..................................................................................6-14

viii
List of Abbreviations
APBD : Anggaran Pendapatan dan Belanja Daerah (Regional Budget Plan)
APEKSI : Asosiasi Pemerintah Kota Seluruh Indonesia (Association of Indonesian
Municipalities)
ASL : Above Sea-Level
BAPPEDA : Badan Perencanaan dan Pengembangan Daerah (Planning and
Development Agency)
BOD : Biochemical Oxygen Demand
BORDA : Bremen Overseas Research and Development Agency
BPD : Bank Pembangunan Daerah (Regional Development Bank)
BPHTB : Bea Perolehan Hak Atas Tanah dan Bangunan (Right Acquisition Duty
for Land and Building)
BUMD : Badan Usaha Milik Daerah (Locally-owned Company)
CAI – Asia : Clean Air Initiatives in Asian Cities
CNG : Compressed Natural Gas
DAK : Dana Alokasi Umum (Special Allocation Fund)
DAU Dana Alokasi Umum (General Allocation Fund)
DIY : Daerah Istimewa Yogyakarta (Yogyakarta Special Region)
DSDP : Denpasar Sewerage Development Project
GDP : Gross Domestic Product
GHG : Green House Gases
GTZ : German Technical Cooperation
ICLEI : International Council for Local Environment Initiatives
IDR : Indonesia Rupiah
IMB : Izin Mendirikan Bangunan (Building License)
IPAL : Instalasi Pengelolaan Air Limbah (Liquid Waste Treatment Installation)
KARTAMANTUL : Yogyakarta, Sleman, Bantul (agglomeration of regencies of Yogyakarta
City)
KK : Kepala Keluarga (Households)
KTP : Kartu Tanda Penduduk (Population ID Card)
KWh meters : Kilo Watt hours meters
LPMK : Lembaga Pemberdayaan Masyarakat Kelurahan (Institution for Village
Community Empowerment)
LSAP UAQi : Local Strategy and Action Plan for Urban Air Quality Improvement
MAPES : Mayors’ Asia-Pacific Environmental Summit

ix
MUSRENBANGDA : Musyawarah Perencanaan Pembangunan Daerah (Regional
Development Planning Conference)
NGO : Non Government Organizations
PAD : Pendapatan Asli Daerah (Original Revenue)
PBB : Pajak Bumi dan Bangunan (Land and Building Tax)
PBBKB : Pajak Bahan Bakar Kendaraan Bermotor (Fuels Tax)
PDAM : Perusahaan Daerah Air Minum (Drinking Water Company))
PKB : Pajak Kendaraan Bermotor (Vehicle Tax)
PKBBBNKB : Pajak Kendaraan Bermotor dan Bea Balik Nama Kendaraan Bermotor
(Motor Vehicle Tax and Motor Vehicle Ownership Exchange Duty)
PLN : Perusahaan Listrik Negara (State Electricity Company)
Posyandu : Pos Pelayanan Terpadu (Integrated Service Post)
PPH : Pajak Penghasilan (Personal Income Tax)
PPPABT : Pajak Pengambilan dan Pemanfaatan. Air Bawah Tanah (Underground
water usage tax)
PROLABIR : Program Langit Biru (Blue Sky Programme)
Puskesmas : Pusat Kesehatan Masyarakat (Public Health Centre)
Renja SKPD : Rencana Kerja Satuan Kerja Pemerintah Daerah (Regional Apparatus
Task Unit Work Plan)
Renstra SKPD : Rencana Strategis Satuan Kerja Pemerintah Daerah (Regional
Government Task Unit Strategic Plan)
RKPD : Rencana Kerja Pemerintah Daerah (Regional Government Work Plan)
RPH : Rumah Pemotongan Hewan (Animal Slaughter House)
RPJMD : Rencana Pembangunan Jangka Menengah Daerah (Regional Mid-term
Development Plan)
RPJPD : Rencana Pembangunan Jangka Panjang Daerah (Regional Long-Term
Development Plan)
RSUD : Rumah Sakit Umum Daerah (Regional Hospital)
SDH : Sumber Daya Hutan (Provincial Forestry Resources)
SUTP Sustainable Urban Transport Program
WALHI : Wawasan Lingkungan Hidup (NGOs for Environment)

1-1
Chapter 1 Introduction 1.1. Background
Cities for Climate Protection (CCP) is a campaign program introduced by ICLEI (International Council
for Local Environment Initiatives)1 for reducing green house gases to improve liveable cities and
collectively global warming and climate change through local actions. In Indonesia, this program began
in 2001 with 5 (five) cities as the member i.e Yogyakarta, Bogor, Surabaya, Semarang and Cilegon. In
2005, the number of cities has grown to 9 cities, including Balikpapan, Denpasar, Bandung and Medan
with a total population of more than 6.5 million.
To participate in CCP Program, the City Government was obliged to develop a resolution for emission
reduction and to give commitment in carrying out the following 5 milestones:
a. Milestone 1: Emissions Inventory and Forecast
b. Milestone 2: Setting a Reduction or Avoidance Goal
c. Milestone 3: A Climate Action Plan
d. Milestone 4: Measures Implemented
e. Milestone 5: Monitoring and Verification
It should be noted that the resolution for the City Government is not legally binding, but it is the sign of
commitment from the City Government in their effort to reduce green house gases emissions through
programs at local level.
During CCP Program implementation, twenty-six projects have been initiated and another 20 are in the
pipeline. Energy efficient street lighting was very successful and the projects made it to the last
milestone, number 5. Over $4 million in domestic investment has been leveraged and 500,000 tons of
CO2 avoided per year, mostly from new composting programs diverting waste from dumps. The annual
savings are near $1 million. Future plans include waste-to-biogas projects.2 Unfortunately due to
funding problem, the activity of CCP in Indonesia can not be continued.
1.2. Objective
The study aims to understand the practice diffusion and adoption process in the city governments of
Surabaya, Yogyakarta, and Denpasar to examine the success factors of diffusion of good practices
regarding mitigation of greenhouse gas emissions at local level through the network of CCP program of
ICLEI. Projects to be reviewed in each city are as followed:
a. Yogyakarta, Streetlights Management Scheme
b. Surabaya, Fuel Switching for City Government Vehicles
c. Denpasar, Community-Based Biogas Project: Converting Liquid Waste to Energy
1 ICLEI - Local Governments for Sustainability is an international association of local governments and national and regional local government organizations that have made a commitment to sustainable development. 2 Taken from USAID report on An End of Program Evaluation of The Cooperative Agreement between USAID/EGAT and The International Council for Local Environmental Initiatives (ICLEI), 2005

1-2
1.3. Methodology
The study basically undertaken the following steps:
1. Develop brief description of the project including methods to reduce greenhouse gas (GHG)
emissions, stakeholders involved, cost of the project, financing mechanism, actual annual financial
savings, actual / estimated annual GHG reduction and co-benefits of the project will be provided.
The data will be gathered by reviewing ICLEI reports and other available data and interview related
staffs, academics, residents and NGO involved in the project in each city.
2. Develop historical record of activities relevant with introduction of the practice. The events and
activities are to be summarized in chronological order by stakeholders such as Mayor, city
government official, city government division/department/section, city legislatives, NGO,
businesses, residents, ICLEI secretariat, international organizations and consultants. The data will
be gathered by interviewing related staffs involved in the project in each city, city planning office
and city environment office.
3. Identify policy process stages and the role of intercity program by referring the following stages: (1)
recognition of the issue, (2) agenda setting, (3) examination and decision of measures, and (4)
execution of the measure. The data will be gathered by interviewing the Mayor, city legislatives,
related staffs involved in the project in each city, city planning office and city environment office
and related NGOs.
4. Identify mutual reference among city governments and the role of intercity program. To understand
the daily information collection and learning activities by the city government officials, means of
daily information collection by the officials of the environment section are to be studied.
Information sources, purpose of collection, frequency of information gathering, timing of
information collection vis-à-vis the policy process, and the actual utilization results of information
will be studied. Information sources include ICLEI and other intercity networks, which should be
identified if any. Private networks including friends and other social networks are also included. It
will be studied if city government officials are searching or sharing necessary information for their
works with other city government officials, and if so, how they do so. Concrete actions such as email,
telephones, internet search, participation in the workshop, and so on will be identified. The role of
ICLEI and other intercity program for mutual reference of city governments will be clarified. The
data will be gathered by interviewing city planning office and city environment office.
5. Identify political factors in the adoption of the new practices.
The research identified and studied the specific factors that play important roles in adoption of the
new practices.
6. Socio-economic statistics
Data on socio-economic environment of the city were collected annually from 2001 to the latest.
Data were gathered from City Planning Office, Statistic Center Office in each city. The research then
analysed if these socio-economic factors triggered or contributed the adoption or implementation of
the CCP projects in each city.
7. Practice diffusion to other cities
The states of practice diffusion to other cities from the studied cities were clarified, including the
cities that adopted the practice and the implementation status of the practice. Its diffusion
mechanism such as domestic / international networks, roles of NGOs was also identified.

1-3
1.4. Schedule
In order to accomplish the objectives, the project organized the following activities as described in Table
1.
Table 1. 1 Schedule of the Project
No Activities Time
a. Contract Signing 23rd June 2008
b. Submission of the work plan 15th July 2008
c. First field survey in Yogyakarta and Denpasar End July – End August 2008
d. Submission of the first field report 15th September
e. Second field survey in Surabaya Mid Sept – End September 2008
f. Submission of the second field report 6th October
g. Submission of the final report 31st October

2-1
Chapter 2 Cities Profile
2.1. Yogyakarta
1. General Description
Yogyakarta City, the capital of DIY Province, has long known as the City of Struggle, City of Students,
City of Culture, and City of Tourism. If Yogyakarta city is developed in accordance to the call names and
well managed, it will have positive impact on the community welfare. Furthermore, Yogyakarta is a city
that has various arts and cultures which are still alive in its society. This advantage has encouraged
tourist to visit Yogyakarta. The development of tourism sector in Yogyakarta city shall put the cultural-
based tourism concept in the first place since Yogyakarta has a great potential of culture. In addition,
tourism object potentials, adequate facilities and infrastructure, and its strategic geographical position
are valuable assets which, if they are well managed, will support the existence of Yogyakarta City as the
prominent tourism destination.
Developmental vision of Yogyakarta City for 2007-2011, as mentioned in the 2007-2011 Regional Mid-
term Development Plan (RPJMD) of Yogyakarta City, states that Yogyakarta City shall play role as the
city of high quality education, city of culture-based tourism and city of environment-concept service
centre. In tourism sector, furthermore, the vision has determined the development target for 2007-2011,
i.e. Yogyakarta as the city of culture-based tourism with the support of various tourism objects and
attractiveness.
The area of Yogyakarta City is 32.5 km2 or about 1.02% of the area of DIY Province. Geographically,
Yogyakarta City lies between 110o24’19” – 110o28’53” East Longitude and 07o49’26” – 07o15’24” South
Latitude. Administratively, Yogyakarta City is bordered by Sleman Regency to the north, Sleman and
Bantul Regency to the east, Bantul Regency to the south and Bantul and Sleman Regency to the west (see
Figure 2.1).
The population of Yogyakarta City in 2007 was about 528,789 persons (see Table Annex 3.2), with
density of 16,270 persons/km2 (Table Annex 3.3) and population growth of 1.1%/year. Gondokusuman is
the district with the most number of populations, amounting 76,302 and Pakualaman is the district with
the least number of population, amounting 14,923. In terms of population density, Ngampilan district
has the highest level of population density, 28,973 persons/km2, and Umbulharjo district has the lowest
level of population density, 9,358 persons/km2.
2. Economic Condition
a. Regional Gross Domestic Product (GDP)
The regional GDP which is based on the current price in 2006 amounted IDR 7.76 trillion (791.4
Million USD) and income per capita amounting USD 1,787 annually. Compared to DIY Province
Regional GDP in 2006, the Yogyakarta City GDP amounted for quarter of the Provincial GDP and
amounted for 0.3% of National GDP. It is seen, in accordance to Table 2.1, that sub-sectors of hotel,
restaurant and service play role as the dominant contributor for the regional economy since

2-2
Yogyakarta is one of the biggest tourism destination in Indonesia. From year to year, the
contribution of these sectors continuously increase compared to other sectors.
Figure 2. 1 Administrative Map of Yogyakarta City
Table 2. 1 Regional GDP of Yogyakarta City by Industrial Origin at Current Prices (Million Rp)
Year Industrial Origin
2000 2001 2002 2003 2004* 2005** 2006*** Agriculture 34,570 35,712 39,865 34,134 29,792 28,951 28,721 Mining and Quarrying 747 689 608 509 492 366 451 Manufacturing Industries
465,069 494,807 578,492 658,973 678,292 750,690 822,702
Electricity, Gas and Water Supply
40,269 51,870 72,003 92,288 103,379 121,093 133,537
Construction 208,012 232,334 269,700 321,580 376,541 449,611 573,425 Trade Hotel and Restaurant
862,621 961,513 1,068,549 624,750 1,337,465 1,568,940 1,786,890
Transportation and Communication
550,291 618,285 810,174 904,168 1,041,131 1,213,823 1,391,144
Finance, rent of building and business service
510,331 561,742 671,779 757,462 903,571 1,029,640 1,107,768
Services 837,946 1,016,406 1,120,802 1,237,994 1,404,689 1,606,975 1,920,294 Total Yogyakarta 3,509,856 3,973,358 4,631,972 4,631,858 5,875,352 6,770,089 7,764,932 Total DIY Province 12,789,312 14,944,611 16,971,846 19,648,763 21,941,886 25,265,865 29,193,797 Total Indonesia (Billion Rp) 1,264,919 1,449,398 1,821,833 2,013,674 2,273,141 2,729,708 3,338,195
Note: 2007 data is not available yet *Preliminary figures **Very preliminary figures ***Very-very preliminary figures Source : Yogyakarta in Figures, 2002-2006

2-3
b. Economic Growth
Based on the existing data, from the production point of view, the growth of economy in Yogyakarta
City is mainly resulted from the improvement of business sectors related to service, i.e. trading,
hotel and restaurant sector; finance, rent and business service sector; services sector; and
transportation and communication sector. If it is seen more precisely, the four sectors are attracted/
affected by two locomotives, i.e. tourism and education. From the consumption point of view, the
economy of Yogyakarta City is supported by the increase of community consumption. Table 2.2
presents the economic growth in 2003-2006.
Table 2. 2 Economic Growth by Constant Price in Yogyakarta City (%)
No Sector 2003 2004 2005 2006
1. Agriculture -5.64 -13.96 -11.79 -4.66
2. Mining and Quarrying -24.13 -9.95 -34.77 -8.68
3. Manufacturing Industries 4.49 1.56 2.38 0.25
4. Electricity, Gas and Water Supply 6.94 4.56 5.30 -1.85
5. Construction 7.88 11.20 7.14 13.28
6 Trade, Hotel and Restaurant 6.08 4.93 6.24 5.11
7. Transportation and Communication 8.14 13.93 5.20 5.20
8. Finance, rent of building and business service 2.90 2.71 7.50 -1.84
9. Services 1.67 0.90 2.46 5.80
Yogyakarta City 4.76 5.05 4.88 4.13
DIY Province 4.5 3.1 5.4 4.9
Indonesia 4.8 5.0 5.7 5.5
Source : Yogyakarta City in Figures 2007
The growth of economy in 2005 is smaller than that of 2004 because the government had issued a
policy to increase the fuel of price by twice. The increase of fuel price had resulted in the increase of
production cost. In order to decrease the production cost, the business sectors had decrease their
business volume. However, the evenly improvement of various sectors had encouraged the growth
of economy. The finance, rent and business service sectors had increased by 7.5%, the construction
sector had increased by 7.14%, trade, hotel and restaurant had increased by 6.25%, and
transportation and communication sector had increased by 5.2%. The same as the previous two
years, two sectors, agriculture and mining and quarrying, had experienced negative growth. The
mining and quarrying sector had decreased by 34.77% while agriculture sector had decreased by
11.79%.
In 2006, the growth of economy had decreased by 4.13%. The main reason was that earthquake
disaster happened on 27 May 2006. The disaster had resulted in negative growth on four business
sectors. Mining and quarrying sector decreased by 8.68%, agriculture sector decrease by 4.66%,
electricity, gas and water supply decreased by 1.85% and finance, rent and business services sector
decreased by 1.84%. In line with the rehabilitation and reconstruction phase, the growth of economy
in 2006 had been encouraged by the increase on construction, services, transportation and
communication, and trade, hotel and restaurant sectors amounted 13.28%, 5.80%, 5.20% and
5.11%, respectively. In terms of demand, based on the 2006 Economic Report of Yogyakarta Special
Region established by Bank of Indonesia, Yogyakarta Branch, household consumption,
establishment of gross fixed capital (investment), and value of inter-region/international trading

2-4
had contributed to the growth of economy in Yogyakarta City for the last three years. The slowing
down of economic growth in 2006 is resulted from the earthquake disaster. The earthquake had
destroyed most of production tools. This had forced business actors to get raw materials or
intermediate/partly finished goods from other region outside DIY Province that subsequently they
conducted finishing. The earthquake had decreased the number of tourists visiting Yogyakarta City
that subsequently decreased the community consumption and volume of inter-region/international
trading.
c. Structure of Regional Economy
Based on the above data, the economic structure of Yogyakarta City (Table 2.3) is business sector
related to services. The primary superior sector is Trade, Hotel and Restaurant that the contribution
to Regional GDP for four years amounts for 25%. The next superior sector is services that contribute
21% to the GDP for four years. The next is Transportation and Communication sector that
contributes 18% to GDP for four years. The last is Finance, Rent and Business Services sector that
contributes 14% to the Regional GDP during the last four years. The industrial sector, i.e.
Manufacture Industry, is on the fifth rank of superior sectors, contributing 11%-12% to the Regional
GDP during the last four years.
Table 2. 3 Economic Structure of Yogyakarta City (%)
Year Business Sector
2003 2004 2005 2006 1. Agriculture 0.7 0.6 0.5 0.5 2. Mining and Quarrying 0.0 0.0 0.0 0.0 3. Manufacturing Industries 12.5 12.1 11.8 11.3 4. Electricity, Gas and Water Supply 1.4 1.4 1.4 1.3 5. Construction 6.5 6.9 7.0 7.6 6. Trade, Hotel and Restaurant 25.2 25.2 25.5 25.8 7. Transportation and Communication 16.7 18.2 18.2 18.4 8. Finance, rent of building and business service 14.3 14.0 14.3 13.5 9. Services 22.7 21.8 21.3 21.7
Total 100.0 100.0 100.0 100.0 Source : Decree of Yogyakarta Mayor No 617 / KEP /2007
2.2. Denpasar
1. General Description
Denpasar city, the capital of Bali Province, represents the economic centre of Bali island where there is a
meeting between the Bali traditional culture and the west culture. At the beginning, Denpasar represents
the centre of Badung Kingdom, finally, it still also becomes the centre of government of Badung
Regency, and in fact starting from 1958 Denpasar also becomes the centre government of Bali province.
The city with income per capita around Rp 23.4 million per year has a strategic role as a centre for
governmental and economic activities control such as trading, banking, services, and many innovative
productions. Beside that, it is also as concentration place of social services facilities, in regional services
scale, such as education, sanitary, sport, etc. This condition brings about an impact of the high
population of Denpasar City than other regencies in Bali Province.

2-5
Developmental vision of Denpasar City for 2005-2010, as mentioned in the 2005-2010 Regional Mid-
term Development Plan (RPJMD) of Denpasar City, states that Denpasar City shall play role as the
culture-concept city with a harmony in sustainable balance.
The area of Denpasar City is 127.78 km2 or about 2.2% of the area of Bali Province. Geographically,
Denpasar City lies between 08o35’31” – 08o44’49” South Latitude and 115o10’23” – 115o16’27” East
Longitude. Administratively, Denpasar City is bordered by Badung Regency to the north, Gianyar
Regency to the east, Badung Strait to the south, and Badung Regency to the west (Figure 2.2).
Figure 2. 2 Administrative Map of Denpasar City
The population of Denpasar City in 2006 was about 583,600 persons (see Table Annex 4.2), with density
of 3,697 persons/km2 (Table Annex 4.3) and population growth of 3.01%/year. West Denpasar is the
district with the most number of populations, i.e. 168,580 persons, followed by South Denpasar with
167,358 persons, North Denpasar with 137,390 persons, and East Denpasar as the least numbers of
populations with 110,272 persons. In terms of population density, West Denpasar District has the
highest level of population density, 7,007 persons/km2 and South Denpasar District has the lowest level
of population density, 3,348 persons/km2.

2-6
2. Economic Condition
a. Regional Gross Domestic Product (GDP)
The regional GDP based on current price in 2006 amounted for Rp 7 trillion (711 Million USD) and
income per capita amounting 1218 USD annually. Compared to Bali province Regional GDP in
2006, the Denpasar GDP is one fifth (1/5) of the province GDP and 0.23% of national GDP. Similar
to Yogyakarta, hotel and restaurant subsector play a role as a dominant contributor for regional
economy since Denpasar is also the biggest tourisms areas in Indonesia (Table 2.4).
Table 2. 4 Regional GDP of Denpasar City by Industrial Origin at Current Prices (Million IDR)
Year Industrial Origin 2000 2001 2002 2003 2004* 2005** 2006***
Agriculture 265,994 305,387 340,717 374,778 413,088 468,265 515,066 Mining and Quarrying
220 249 281 295 309 340 379
Manufacturing Industries
383,960 445,701 508,144 560,340 634,540 715,780 790,593
Electricity, Gas and Water Supply
108,562 126,775 146,083 168,314 194,224 235,556 276,472
Construction 104,728 118,971 136,066 155,585 179,333 217,109 259,185 Trade Hotel and Restaurant
400,230 1,250,963 1438,983 1,640,424 1,893,875 2,222,458 2,912,533
Transportation and Communication
426,014 497,358 565,004 630,554 709,869 833,201 920,342
Finance, rent of building and business service
491,157 55,3,151 627,239 692,150 769,784 914,292 1,046,420
Services 316,013 369,767 421,554 497,568 581,811 688,926 779,480 Total Denpasar 3,196,884 3,667,427 4,194,075 4,720,100 5,376,838 6,295,930 7,000,481 Total Bali Province NA NA 23,856,437 26,168,942 25,986,595 30,995,660 37,418,484 Total Indonesia (Billion Rp) 1,264,919 1,449,398 1,821,833 2,013,674 2,273,141.5 2,729,708 3,338,195
Note: 2007 data is not available yet *Preliminary figures **Very preliminary figures ***Very-very preliminary figures Source :Denpasar City in Figures, 2002-2006
b. Economic Growth
Based on the existing data, from the production side, economic development of Denpasar City
especially results from business sectors related to service, i.e. trade, hotel and restaurant sector;
finance, rent and business service sector; services sector; and transportation and communication
sector. If it is seen more precisely, the four sectors are attracted/affected by tourism sector. The
number of economic growth for 2003-2006 can be seen in Table 2.5.
As the impact of Bali Bombing Tragedy 2002, the economy of Denpasar City has decreased
drastically. The decreasing number of tourists visiting Bali has a great impact on the decrease of
hotel occupancy level in Denpasar City and this has very big impact on the economic growth of
Denpasar city. However, slowly since 2003 the tourists visiting level began to increase and it raised
the economic growth. And if it is not early anticipated, it will impact again to the decrease of tourist
visit, included hotel occupancy level that will influence the economic growth.

2-7
Table 2. 5 Economic Growth by Constant Price in Denpasar City (%)
No Sector 2003 2004 2005 2006
1. Agriculture 4.11 4.67 3.87 5.47
2. Mining and Quarrying 0.73 0.8 0.32 0.28
3. Manufacturing Industries 4.82 5.57 4.7 4.61
4. Electricity, Gas and Water Supply 7.5 7.26 7.21 8.05
5. Construction 6.95 6.27 6.97 6.73
6 Trade Hotel and Restaurant 5.79 6.47 6.73 5.23
7. Transportation and Communication 4.85 5.65 5.53 5.93
8. Finance, rent of building and business service 3.24 3.15 4.84 5.15
9. Services 7.53 8.19 8.47 9.53
Denpasar City 4.88 5.83 6.05 5.88
Bali Province 3.6 4.6 5.6 5.3
Indonesia 4.8 5.0 5.7 5.5
Source: Denpasar City in Figures, 2007
c. Structure of Regional Economy
The contribution of agriculture sector to the GRDP of Denpasar City was about 7.36% in 2006,
while in Bali Province in the same year was about 19.96%. The difference characterized that
Denpasar City had a strong characteristic to be a metropolitan city while Bali Province was still in its
journey to modern region. Furthermore, construction sector had 3.70% contribution to the GRDP of
Denpasar City and 4.28% to Bali Province. Quarrying sector gave 0.01% contribution and 0.6% to
Denpasar City and Bali Province, respectively. The contribution of service sector to the Denpasar
economy was 11.13% and 16.22% to Bali in year 2006 (Table 2.7).
Table 2. 6 Economic Structure of Denpasar City (%)
Year Sector
2005 2006 Denpasar Bali Denpasar Bali
1. Agriculture 7.44 20.9 7.36 19.9 2. Mining and Quarrying 0.01 0.7 0.6 0.8 3. Manufacturing Industries 11.37 5.9 11.29 8.7 4. Electricity, Gas and Water Supply 3.74 1.9 3.95 1.9 5. Construction 3.45 4.2 3.70 4.3 6. Trade Hotel and Restaurant 35.3 30.3 34.46 28.9 7. Transportation and Communication 13.23 12.2 13.15 11.9 8. Finance, rent of building and business
service 14.52 7.3 14.95 7.5
9. Services 10.94 16.7 11.13 16.2 TOTAL 100.0 100.0 100.0 100.0
Source: Denpasar City in Figures, 2007
2.3. Surabaya
1. General Description
Surabaya City, the capital of East Java Province, is the second biggest city in Indonesia after Jakarta.
With its metropolitan population that almost reaches 3 millions people, Surabaya is the centre of
business, trading, industries, and education in the eastern area of Java Island and its surrounding. It is

2-8
well-known as the City of Heroes, because of its historical background back in the Indonesian
independence struggle era. Most of its inhabitants work as employees and traders.
The development of Surabaya cannot be separated from its characteristic as the city of services and
trading. The demand of globalization era and its citizens and the consideration on its geography and
geostrategy position require various innovations in conducting the governance and development. The
future challenge for Surabaya is very hard and complex, starting from transportation, flood, population,
employment, informal sector, investment, various infrastructures, and the less quality of regulation and
bureaucracy supports, and the culture of the community that is encouraged to be able to make Surabaya
to be in the standard of world big cities.
The local autonomy with its decentralization authority brings good practices (innovation of government
implementing) towards economy development, public services, as well as politics and law development
to achieve its better and constructive direction towards better welfare of city community. Promoting the
economy growth and raising the life-quality through fulfilling the community basic rights are the
strategic agendas that in order to gain those supports from the infrastructure development acceleration,
assets management and development as the alternative financing, bureaucracy reformation, as well as
the constructive and reliable monitoring system are needed. These agendas become the important part
to achieve 2006-2010 Surabaya City development vision, that is Smart and Caring Surabaya.
Figure 2. 3 Administrative Map of Surabaya City
The area of Surabaya City is around 326.37 km2 or 0.70% from total East Java Province. Its population
in 2007 was about 2,861,928 persons (see Table Annex 5.2), with density of 8,769 persons/km2 and
population growth of 1.2%/year. Geographically, Surabaya City lies between 07° 21' South Latitude and

2-9
112° 36' - 112° 54' East Longitude. Administratively, as seen in Figure 2.3, Surabaya City is bordered by
Madura Strait (North and East), Sidoarjo Regency, (South), and Gresik Regency (West).
2. Economic Condition
Surabaya City is one of main trading gates in East Indonesia area. With all its potencies, facilities, and its
great geography, Surabaya city has high economic potentials. The primary, secondary, and tertiary
sectors of this city are very supportive in strengthening Surabaya to be the city of trading and economy.
Along with the existing private sectors, Surabaya City has prepared itself to be an international trading
city. The development of buildings and modern economic facilities is its preparation as the part of the
transparent and competitive international economic activities.
a. Regional Gross Domestic Product (GDP)
The regional GDP based on the current price in 2005 is Rp 91.19 Trillion (9.17 trillion USD) and
income per capita approximately 3400 USD annually. Compared to East java province Regional
GDP in 2005, the Surabaya GDP is 23% of the province GDP and 3% of national GDP. Table 2.7
describes that manufacturing and hotel and restaurant industries are the dominant contributors to
the regional economy since Surabaya City is one of the industrial areas in Indonesia.
Table 2. 7 Regional GDP of Surabaya City by Industrial Origin at Current Prices (Million Rp)
Year Industrial Origin
2000 2001 2002 2003 2004 2005
Agriculture 88,812 98,990 NA 89,930 112,048 122,937
Mining and Quarrying
2,527 25,852 NA 8,277 9,925 9,318
Manufacturing Industries
14,081,654 16,229,452 NA 17,294,288 25,047,776 29,321,166
Electricity, Gas and Water Suppply
1019,226 1,235,153 NA 1,322,460 2,032,623 2,456,972
Construction 4,013,328 4,498,356 NA 4,444,304 6,036,190 7,407,298
Trade Hotel and Restaurant
13,337,159 15,338,042 NA 19,499,744 27,346,400 32,475,894
Transportation and Communication
4,858,254 4,688,635 NA 5,586,785 6,873,703 8,371,416
Finance, rent of building and business service
2,523,785 2,912,895 NA 3,685,477 5,026,199 5,577,531
Services 2,059,213 2,322,404 NA 4,089,458 5,108,929 5,447,901
Total Surabaya 41,983,961 47,349,785 NA 56,020,728 77,593,797 91,190,435
Total East Java Province NA NA 267,157,716 300,609,857 341,065,251 403,392,350 Total Indonesia (Billion Rupiah) 1,264,919 1,449,398 1,821,833 2,013,674 2,273,141 2,729,708
Notes : 2006-2007data is not available Source : Surabaya in Figures, 2001,2002,2005,2006
b. Economic Growth
Based on the data from BPS Surabaya, the economy development of Surabaya City in 2002-2005
shows a positive growth number, amounting 3.80% (2002), 4.22% (2003), 5.78% (2004) and 5.67%
(2005), as explained in Table 2.8.
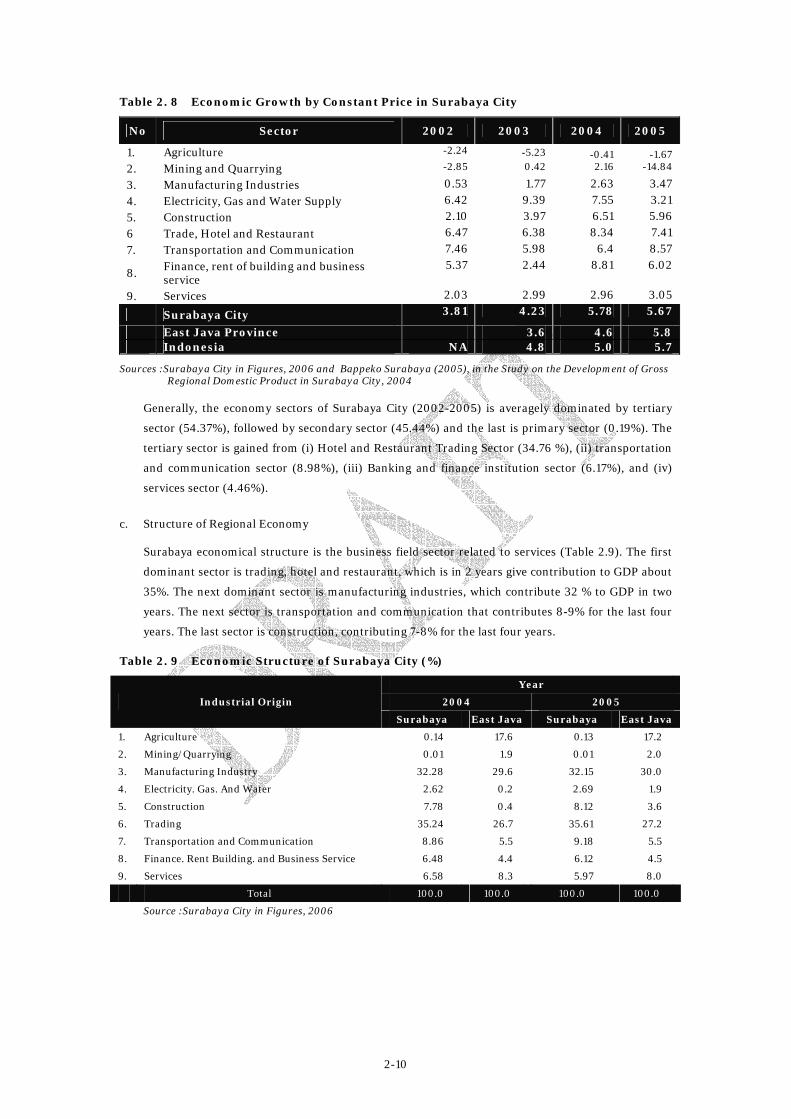
2-10
Table 2. 8 Economic Growth by Constant Price in Surabaya City
No Sector 2002 2003 2004 2005
1. Agriculture -2.24 -5.23 -0.41 -1.67 2. Mining and Quarrying -2.85 0.42 2.16 -14.84
3. Manufacturing Industries 0.53 1.77 2.63 3.47
4. Electricity, Gas and Water Supply 6.42 9.39 7.55 3.21
5. Construction 2.10 3.97 6.51 5.96
6 Trade, Hotel and Restaurant 6.47 6.38 8.34 7.41
7. Transportation and Communication 7.46 5.98 6.4 8.57
8. Finance, rent of building and business service
5.37 2.44 8.81 6.02
9. Services 2.03 2.99 2.96 3.05
Surabaya City 3.81 4.23 5.78 5.67
East Java Province 3.6 4.6 5.8 Indonesia NA 4.8 5.0 5.7
Sources :Surabaya City in Figures, 2006 and Bappeko Surabaya (2005), in the Study on the Development of Gross Regional Domestic Product in Surabaya City, 2004
Generally, the economy sectors of Surabaya City (2002-2005) is averagely dominated by tertiary
sector (54.37%), followed by secondary sector (45.44%) and the last is primary sector (0.19%). The
tertiary sector is gained from (i) Hotel and Restaurant Trading Sector (34.76 %), (ii) transportation
and communication sector (8.98%), (iii) Banking and finance institution sector (6.17%), and (iv)
services sector (4.46%).
c. Structure of Regional Economy
Surabaya economical structure is the business field sector related to services (Table 2.9). The first
dominant sector is trading, hotel and restaurant, which is in 2 years give contribution to GDP about
35%. The next dominant sector is manufacturing industries, which contribute 32 % to GDP in two
years. The next sector is transportation and communication that contributes 8-9% for the last four
years. The last sector is construction, contributing 7-8% for the last four years.
Table 2. 9 Economic Structure of Surabaya City (%)
Year
2004 2005 Industrial Origin
Surabaya East Java Surabaya East Java
1. Agriculture 0.14 17.6 0.13 17.2
2. Mining/Quarrying 0.01 1.9 0.01 2.0
3. Manufacturing Industry 32.28 29.6 32.15 30.0
4. Electricity. Gas. And Water 2.62 0.2 2.69 1.9
5. Construction 7.78 0.4 8.12 3.6
6. Trading 35.24 26.7 35.61 27.2
7. Transportation and Communication 8.86 5.5 9.18 5.5
8. Finance. Rent Building. and Business Service 6.48 4.4 6.12 4.5
9. Services 6.58 8.3 5.97 8.0
Total 100.0 100.0 100.0 100.0
Source :Surabaya City in Figures, 2006

3-1
Chapter 3 Stages of Policy Process 3.1. Regional Mid-Term Development Plan
In performing duties and conducting activities, The City Government refers to the city regional planning
document commonly referred as RPJMD (Regional Mid-Term Development Plan). The City’s RPJMD,
as the urban development planning document for 5 (five) years period, is established through The
Decree of City Mayor, is aimed to give direction as well as reference for all development actors in the city
(government, community and business society) in administering government, managing development
and service for the community.
The RPJMD is the detail description of the National Mid-Term Development Plan, Provincial Mid-Term
Development Plan and the city RPJPD (Regional Long-Term Development Plan) for 2005-2025 period
that is established through the application of participative planning which involves all stakeholders. The
implementation of city RPJMD will be described in the Renstra SKPD (Regional Government Task Unit
Strategic Plan) and Renja SKPD (Regional Apparatus Task Unit Work Plan) as well as in the General
Policy of Annual Regional Budget Plan that subsequently will be stated in Regional Budget Plan (APBD).
3.2. Process of Establishing City RPJMD
The establishment of RPJMD is conducted through the following steps (Figure 3.1):
a. Preparing the draft of RPJMD in order to acquire initial description of vision and mission of the
regional leaders and the regional financial policy, regional development strategy, general policy and
the establishment of SKPD programme, across SKPD, work plan in the form of regulation
framework and indicative financing framework. The programme ideas may come from the result of
discussions in governmental offices or institutions that are based on the result of field observation
and/or community aspiration.
b. Organizing Mid-Term MUSRENBANGDA (Regional Development Planning Conference) in order to
get input/feedback and commitment from all related stakeholders regarding the RPJMD draft.
The MUSRENBANGDA is facilitated by LPMK (Institution for Village Community Empowerment)
which has association from district to national level. The LPMK association shall periodically holds
meetings. During the meeting, community-based programmes successfully conducted in certain
region will be presented. It is expected that the programmes can be implemented in other regions.
c. Develop the RPJMD final draft based on the result of Mid-Term MUSRENBANGDA. It will become
the main input for the completion of RPJMD draft.
d. Establishment of Mayor Decree regarding RPJMD together with its legislation in the regional
gazette.

3-2
Figure 3. 1 Process of Program Adoption in Indonesian Cities
After RPJMD has been established, it must be described in the Renstra-SKPD, RKPD (Regional
Government Work Plan), and Renja-SKPD as well as in the General Policy of Annual Budget that
subsequently will be stated in the Regional Budget Plan. The draft of Regional Budget subsequently will
be discussed with the City Council to be approved. It is necessary since the City Council, as the
representative of the community, will be able to listen to the explanation of the city government;
therefore, it is expected that the implementation of the programme will give the community benefits. In
addition, the City Council will be able to look at the budget proposed by the municipal government and
approve the proposed budget if it has been appropriate.
3.3. Development Challenges of the City
1. Economic Development Challenges
The decentralization process – which started effectively in the year of 2000 has put forward
opportunities and challenges for City mayors in Indonesia. There are opportunities of managing its own
programs so the development needs can be addressed properly. On the other hand, it also presents a
challenge for the city to be more transparent and accountable to the people. The city should also be
creative in promoting the city investment and generate revenue, prudently manage its financial matters
by investing its public money into the most cost-effective public expenditure and projects.
2. Social Development Challenges
The informal sector is not only shaping and dominating the city’s economy but is also posing a challenge
for providing their livelihood. For those who can not survive in this urban struggle, they often end up as
an urban poor – a community often live in an urban slum without adequate infrastructure such as clean
water, proper sanitation, electricity and affordable transportation facilities.
MUSRENBANGDA
Final Draft of RPJMD
The Mayor Decree on RPJMD
City Gov. Ideas
Program Implementation
RPJMD Draft
Develop Renstra-SKPD, RKPD and Renja SKPD as well as APBD based on RPJMD
Process of City Council Approval
Community Aspiration

3-3
On the air quality related issue – increasing congestion, particularly in urban core and the main
corridors have created a social stress and reckless driving behavior. Such situation is destructing the
social cohesion and the cultural bound among us. The social capital we are very proud of is being
threatened by the increasing uncontrolled urbanization – a problem that is not only dependent on the
urban development but is also related with larger development policies.
3. Environment Challenges
As perhaps typical for many cities around the world, the distinct environmental problems associated
with the city development are air pollution, solid waste and waste-water management.
While local industry is still dominating the air pollution balance – the mobile sources or transport sector
has grown at the highest speed – even during the economic crisis. This is an interesting phenomenon
because the number of vehicles and the vehicle-kilometers maintains its high growth despite the
economic down-turn during the crisis.
According to emission audit conducted by ICLEI during CCP Program in 2001 -2005, the highest
contributor of CO2 emission in Yogyakarta is from residential, 78% of total emission (i.e electricity) and
transportation at second place (22%). While in Denpasar the highest contribution is transportation
(56%) and the second place is residential (18%). Different from the two previous cities, in Surabaya the
highest contribution is residential (53%), industry (25%) and transportation is at the third place (15%).
Recent survey in several streets in Yogyakarta, Denpasar and Surabaya by Environmental Offices (see
Table Annex 3.6, 4.6 and Figure Annex 5.1 – 5.2) indicated that there are large variations of air quality in
those cities. Meaning, that there is un-even development in the city. Some parts of the city are having an
intensive development activity while others there are less intense.
4. Institutional Development Challenges
The city government is also experiencing a reform in the governance with the full introduction of
decentralization law. Decentralization means a higher responsibility for local government to manage
local development – from infrastructure to resource mobilization. For such a small city like Yogyakarta,
which relies on small and medium business as well as informal sector, resource mobilization is an
intricate issue to balance the tax-related revenue and promoting small scale investment.
Decentralization requires a planning and implementation capacity of the local agencies, including
environmental office of the city government.
3.4. Regional Development Policy and Programme
Urban development in many countries in the developing Asia and the Pacific region faces many
challenges confronting social - economic development issues and environmental issues. Those involved
in the development business know from the difficulties in it.
Promoting programs, particularly environmental programs often involve a major effort in education and
campaign which is a long or perhaps a very long and never ending process. In the political reality
however, this is a very difficult choice. Political leaders are always under pressure of delivering changes
and improvement – especially to their constituents.

3-4
In the decentralized system currently experienced by the cities in Indonesia – the local government
should seek ways to integrate the above concerns. The city administration has to ensure the benefit of
business community and public-at-large, not only for the present but also for future generation.
Yogyakarta, Denpasar as a major cultural tourism destination and Surabaya as industrial cities should
also be able to maintain the harmony between culture, environment and economic development.
Responding to the above challenges and tho achieve city’s vision, The City Government of Yogyakarta,
Denpasar and Surabaya have formulated missions and programs as described below.
1. Yogyakarta
City development vision can be accomplished through 9 (nine) development mission as follows:
a. Maintaining the predicate of Yogyakarta City as the City of Education.
b. Maintaining the predicate of Yogyakarta City as the City of Tourism, City of Culture and City of
Struggle.
c. Developing superior competitive power of Yogyakarta City in service sector.
d. Developing Yogyakarta City into a comfortable and environmentally-friendly city
e. Developing Yogyakarta City community which is civilized and has morality, ethics and culture.
f. Developing Yogyakarta City which is good governance, clean government, justifiable, democratic
and based on law
g. Developing Yogyakarta City into a safe, orderly, united and peaceful city
h. Realizing the development of quality facilities and infrastructures
i. Developing Yogyakarta City into a healthy city
The above missions are further realized into programmes. Table Annex 3.7 provides the details of
programmes in environment sector, while programme of Public Streetlight is included in the mission to
realize the development of quality facilities and infrastructures.
2. Denpasar
The 2005-2010 Denpasar City development vision can be accomplished through 5 (five) development
mission as follows:
a. Developing the identity of Denpasar City community based on Bali culture.
b. Empowering the community based on the Bali culture and local Wisdom.
c. Creating good governance through Law Enforcement.
d. Developing Public Services to improve the community welfare.
e. Accelerating the economic growth and strengthening the Economy endurance through Community
Economic System (economic stability).
In the effort to realise the fourth mission, Developing Public Services to improve the community welfare,
City Government of Denpasar has determined development programmes as follows:
a. Community Empowerment and Health Promotion Programme
b. Sanitary Environment Programme
c. Community Health Effort Programme
d. Personal Health Effort Programme
e. Programme on Prevention and Termination of Disease

3-5
f. Community Nutrient Improvement Programme
g. Health Resource Programme
h. Health Supply and Medicine Programme
i. Food and Medicine Monitoring Programme
j. Indonesian Original Herb Programme
k. Programme on Health Development Policy and Management
l. Health Research and Development Programme
The Sanitary Environment Programme is aimed at establishing more sanitary environment through
regional sanitary system development to stimulate health-concept cross-sectoral development. The main
activities organised in the programme include:
b. Provision of basic sanitation and clean water infrastructure;
c. Maintenance and monitoring of environment quality;
d. Environment pollution risk impact control; and
e. Sanitary region development.
Based on the above description, Biogas project implemented in Ubung Village is an activity conducted in
the effort to realise the Sanitary Environment Programme in Denpasar City. Funding allocation for each
programme, unfortunately, is not specifically described in Denpasar City RPJMD.
3. Surabaya
The development mission as a concrete description to support the realization of 2006-2010 Surabaya
City Development Vision are:
a. Establishing the democratic, equitable, transparent and accountable government system;
b. Improving the acceleration of the goods and services trading growth in regional and international
level and integrating Greater Surabaya areas (Gresik, Bangkalan, Sidoarjo, Pasurun) in an
integrated spatial planning system supported by sufficient infrastructure, transportation system,
and IT system;
c. The facilities to develop cooperatives, investment on small and medium enterprises as well as
establishing integration of small and medium enterprises owners with the bigger scale businessmen
supported by a conducive situation;
d. Improving the people welfare especially for poor people through the provision of basic needs
facilities, management and training for street peddlers and other informal businessmen;
e. Establishing clean, healthy, green, and comfortable city environment management;
f. Improving the quality of education with nationalism awareness and global quality accessible to the
citizens as well as preparing the young generation in anticipating future challenges;
g. Improving the quality of health care services that is accessible for the citizents as well as improving
the community’s awareness on healthy environment and behaviour;
h. Exploring and improving local cultural diversity as well as developing the community to live in
harmony, tolerant, and respectable deeds;
To attain the second mission, the Surabaya City Government has designed the following development
program: (1) Spatial Planning Program, (2) Road and bridge management program, (3) City Utilities
Management Program, (4) Transportation Development Program (5) Technology Information
Utilization Program.

3-6
In order to describe the Transportation Development Program, in 2001 Surabaya City Government with
the assistance of the GTZ the German Technical Cooperation – Sustainable Urban Transport Project
(SUTP), has developed a plan to device and implement policies toward environmentally, economically,
and socially sustainable transport in the city. This will result in a range of local economic (enhanced
investment eliminate), social (poverty reduction) and environmental (cleaner air) benefits, and will also
contribute to a stabilization of “global“CO2 emissions from Surabaya’s transport sector.
One of the studies and pilot projects conducted in the City’s cooperation with GTZ is the use of CNG for
the mikrolet (public car) transportation. In this pilot project, it is found out that by using CNG, the fuel
can be saved and the program can reduce gas emission. To disseminate the advantage of CNG and to
improve air quality in Surabaya City, Surabaya City Government has adopted the idea by implementing
it to the city government vehicles.
Beside that, the Resolution of City Government of Surabaya signed by Mayor Surabaya to decrease CO2
emission on the 2002/2010 ICLEI – CCP program has also encourage the implementation of the CNG
program. It is mentioned in that resolution that one of the programs to be conducted is the efficiency
fuel usage for the city government’s vehicles by installing of gas fuel (CNG) converter kit in the vehicles
owned by Surabaya City Government.

4-1
Chapter 4 Condition of Public Sector Funding
4.1. Regional Budget Plan (APBD)
APBD is the detail description of government work plan for one year period. APBD is a document
describing the financial condition including revenue, expenditure and activity information. Shortly,
APBD is a financial plan stating the amount of costs for the determined plans and how to collect
adequate resources in order to finance the plan.
In the governmental administration, APBD functions as the mean of planning, controlling, fiscal policy,
politics, coordination, performance assessment, motivation and public participation generation. APBD
consists of three categories of post, i.e. regional revenue, regional expenditure and regional financing.
1. Regional Revenue
Regional revenue includes all earnings of regional rights for one year budget period that will become
regional revenue. The regional revenue presents the nominal target of money to be collected through the
implementation of work plan that explores the regional revenue resources. The regional revenue consists
of PAD (Original Revenue), balancing fund and other legitimate revenues.
a. Regional Original Revenue consists of:
i. Regional Tax, consisted of hotel tax, restaurant tax, entertainment tax, advertisement tax,
Streetlight Tax, and parking.
ii. Regional retribution, consisted of Puskesmas (Public Health Centre), waste, KTP (Population
ID Card), civil record, parking, terminal, PKB (Vehicle Tax), RPH (Animal Slaughter House),
IMB (Building License), RSUD (Regional Hospital), and other licenses.
iii. Return of BUMD (Locally-owned Company), consisted of BPR Bank Pasar, PDAM (Drinking
Water Company) and shares on BPD (Regional Development Bank) or Bank Pembangunan
Daerah) in province.
iv. Other legitimate earnings of regional asset operation consisted of clearing service, interest
earning, income from the third party and income from locally-owned goods sale.
b. Balancing fund, that is the amount of fund gathered from the central and provincial government,
consisted of:
i. Tax Sharing, i.e. PBB (Land and Building Tax), BPHTB (Right Acquisition Duty for Land and
Building), PPH (Personal Income Tax), PKBBBNKB (Motor Vehicle Tax and Motor Vehicle
Ownership Exchange Duty), PBBKB (Fuels Tax) Pajak Bahan Bakar Kendaraan Bermotor),
PPPABT (Underground water usage tax), and Reserved PBB.

4-2
ii. Non-Tax Sharing, consisted of SDH (Provincial Forestry Resources), Fishery Natural Resource,
and Reserved Provincial Retribution
iii. DAU (General Allocation Fund), i.e. block grant fund in nature that the use is handed over to
the region. It has been established that DAU shall amount for minimally 25% of domestic net
income of the National Budget, in which 10% DAU is allocated for provincial government, and
90% DAU is allocated for the regency and municipal government.
iv. DAK (Special Allocation Fund), is a balancing fund of specific grant, specifically aimed for
reforestation activity at the beginning. Since 2003 the central government has expanded the
allocation of DAK so that includes health, education, and road infrastructure sector.
c. Other legitimate revenues consisted of contingency fund, equalizer fund and emergency fund.
The revenue of Yogyakarta City in 2007 is approximately Rp 615.65 billion (or equal to 62.64 Million USD).
Revenue structure of City Government of Yogyakarta for the last seven years (2001-2007) shows that
PAD is arranging between 19-22% of the entire regional revenues components. Balancing Fund and
other legitimate revenues collected from the central and provincial government amount for about 77-
81% (see Figure 4.1 and Table Annex 3.8).
Figure 4. 1 Revenues of City Government of Yogyakarta
The revenue of Denpasar City in 2007 is approximately Rp 549.5 billion (or equal to 55.74 Million USD).
The Denpasar City Regional revenue structure for the last 7 (seven) years (2001-2007) shows that PAD
is just on the average of more or less 22-31% of all components of regional revenue. The interesting thing
is that the balancing fund raises rapidly from year to year, from 31% in 2001 to 71% in 2007 (see Figure
4.2 and Table Annex 4.7).
-
50,000
100,000
150,000
200,000
250,000
300,000
350,000
400,000
450,000
500,000
2003 2004 2005 2006 2007
Year
Expe
nditu
re (R
p M
illio
n)
Original Revenue Balancing Fund Other Legitimate Revenue

4-3
Figure 4. 2 Revenues of City Government of Denpasar
Compare to Surabaya, its regional revenue in 2008 is Rp 2.06 billion (or equal to 206.7 Million
USD). Surabaya City Government revenue structure for the last 8 years (2001-2008) shows that the
PAD ranges around 27 – 31% of all the local revenue components. Meanwhile for Balancing Fund,
the amount decreases from year to year, from 73% in 2001 to 57% in 2008. (Figure 4.3 and Table
Annex 5.6).
Figure 4. 3 Revenues of City Government of Surabaya
If we look at the revenue structure of the three cities, Yogyakarta and Denpasar still highly depend on
the funding from provincial and central government. Meanwhile, Surabaya shows that year by year the
dependency to the funding from the central and provincial governments is decreasing.
-
50,000
100,000
150,000
200,000
250,000
300,000
350,000
400,000
450,000
2001 2002 2003 2004 2005 2006 2007
Year
Rev
enue
(Mill
ion
Rp)
Original Revenue Balancing Fund Other Legitimate Revenue
-
200,000
400,000
600,000
800,000
1,000,000
1,200,000
1,400,000
2001 2002 2003 2004 2005 2006 2007 2008
Year
Rev
enue
(Mill
ion
Rp)
Original Revenue Balancing Fund Other Legitimate Revenue

4-4
2. Regional Expenditure
Regional expenditure includes all spending of regional duties within one year period that will become
regional spending. The regional expenditure presents the highest ceiling of fund allocated for each
activity covered in the work plan.
Expenditure can be categorized into two main groups, i.e. regional apparatus and public service
expenditure. The regional apparatus expenditure share covers expenditure allocated or utilized for
financing activities that their results, benefits and impacts are indirectly enjoyed by the society.
Furthermore, the public service share covers all expenditure allocated or utilized to finance activities
that their result, benefits and impacts are directly enjoyed by the society (public). The followings are
details of the two expenditures.
a. Regional apparatus, consisted of:
i. General administration (personnel/staff expenditure, goods and service, official travel, and
maintenance)
ii. Operational and maintenance expenditure (personnel/staff expenditure, goods and service,
official travel, and maintenance)
iii. Capital expenditure
b. Public service
i. General administration (personnel/staff expenditure, goods and service, official travel, and
maintenance)
ii. Operational and maintenance expenditure (personnel/staff expenditure, goods and service,
official travel, and maintenance)
iii. Capital expenditure
iv. Profit share and financial grant expenditure
v. Incidental expenditure
Figure 4. 4 Regional Expenditure for Development in Yogyakarta City
In Yogyakarta, fund purely allocated for development (capital/developmental expenditure) is only 20%
of total expenditure (Figure 4.4 and Table Annex 3.9) while in Denpasar the figure reaches 5-10%
-
50,000
100,000
150,000
200,000
250,000
300,000
350,000
400,000
450,000
2003 2004 2005 2006
Year
Exp
endi
ture
(Rp
Mill
ion)
Development Expenditure Others

4-5
(Figure 4.5 and Annex 4.8) and Surabaya 15-35% (Figure 4.6 and Table Annex 5.7). It shows the
minimum amount of fund allocated for development in the cities in Indonesia1.
Figure 4. 5 Regional Expenditure for Development in Denpasar City
Figure 4. 6 Regional Expenditure for Development in Surabaya City
3. Regional Financing
The implementation of performance budget has made deficit and surplus possible to happen during the
establishment of APBD. Deficit occurs when the regional expenditure is greater than the regional
revenue, while surplus is the reverse. Regional financing is needed to cover the deficit (Table 4.1). The
sources of financing of budget deficit may come from regional loan, residual surplus of budget
calculation, reserved fund and asset sale. In accordance to the Governmental Regulation No 2 of 2006
regarding Procedure of Loan Provision and/or Grand Acceptance and Continuation of Loan and/or
Foreign Grant, the regional government has a right to conduct regional loan.
1 Generally, local government budgets for implementing development programs are around 30% of the total budget while the majority is spent on employees and their associated expenses. For further discussion on public expenditure, the World Bank (www.worldbank.org/indonesia) has recently published “Spending for Development: Making the most of Indonesia’s new opportunities”, Indonesia Public Expenditure Review 2007, (World Bank, 2007).
-50,000
100,000150,000200,000250,000300,000350,000400,000450,000500,000
2004 2005 2006
Year
Exp
endi
ture
(Rp
Mill
ion)
Development Expenditure Others
-
500,000
1,000,000
1,500,000
2,000,000
2,500,000
2004 2005 2006 2007 2008
Year
Expe
nditu
re (R
p M
illio
n)
Development Expenditure Others

4-6
In order to improve the effectiveness of regional loan, the loan shall be planned well. Besides it shall be
adjusted to the financial capability of the region, the loan shall be of the right target. In addition, the
regional load not only shall give income to the PAD but also shall be able to improve the economic
growth rate reflecting from the improvement of trade and service sector. Table 11 describe the regional
financing in Yogyakarta, Denpasar and Surabaya.
Table 4. 1 APBD of Yogyakarta, Denpasar and Surabaya (in IDR)
Year Revenue Expenditure Difference between Revenue and Expenditure
Financing Residual Surplus of Current Year
Budget Financing
Yogyakarta
2001 243,769,299,494 243,769,299,494 - - -
2002 303,020,070,538 303,020,070,538 - - -
2003 338,630,761,654 305,351,032,427 33,279,729,227 (33,279,729,227) -
2004 369,649,879,035 370,340,575,770 (690,696,736) 690,696,736 -
2005 391,886,902,046 399,244,605,370 (7,357,703,324) 7,357,703,324 -
2006 519,022,237,322 496,768,977,052 22,253,260,269 (20,008,255,948) 2,245,004,321
2007 615,648,852,480 483,453,112,089 132,195,740,391 88,239,636,104 220,435,376,496
Denpasar
2001 200,287,410,360 200,287,410,360 - - -
2002 325,483,729,948 325,483,729,948 - - -
2003 323,221,275,005 323,221,275,005 - - -
2004 334,757,185,000 340,584,960,845 (5,827,775,845) 5,827,775,845 -
2005 355,484,065,996 356,725,896,841 (1,241,830,845) 1,241,830,845 -
2006 486,959,048,000 497,986,739,400 (11,027,691,400) 11,027,691,400 -
2007 549,523,912,133 554,160,700,933 (4,636,788,800) 4,636,788,800 -
Surabaya
2001 764,477,490,000 NA NA NA NA
2002 920,265,810,000 NA NA NA NA
2003 1,150,976,100,000 NA NA NA NA
2004 1,330,350,750,000 1,165,929,320,000 164,421,430,000 NA NA
2005 1,361,422,950,000 1,686,371,490,000 (324,948,540,000) NA NA
2006 1,712,217,508,389 1,386,340,966,460 325,876,541,929 510,710,582,140 836,587,124,069
2007 2,029,556,867,569 1,556,472,090,169 473,084,777,400 817,619,995,499 1,290,704,772,899
2008 2,056,999,103,515 3,025,360,210,903 (968,361,107,388) 968,361,107,388 -
Source: Report of Regional Revenue and Expenditure Plan Implementation, BAPPEDA of Yogyakarta City, 2008, BAPPEDA of Denpasar City, 2008 and Bappeda of Surbaya City, 2008
It is mentioned in the RPJMD of the three cities that expenditure finance is directed to the capital
participation of State Local Companies (BUMD) which oriented in profit and aimed at increasing
services to the community.
4.2. Public Sector Financing by Sectors
Based on the sectors, all cities reflected that the greatest budget is education and culture sector
amounting averagely 30-40% (see Table Annex 3.11, Annex 4.10 and Annex 5.10). Furthermore, budget
for environmental sector merely about 4-5% in Yogyakarta and 6-8% in Denpasar (unfortunately data
for Surabaya is not available).

5-1
Chapter 5 Capacity Building of Government Staffs and Role of Intercity Program
In the effort of capacity building, the City Government of Yogyakarta, Denpasar and Surabaya delegates
several government staffs to attend to short course and training, workshop and seminar. Although these
kind of method considered insufficient, due to the short time of period, many municipal government
staffs are still not able to implement the result of training, workshop or seminar in their daily tasks. And
therefore, it is proposed that the ideal capacity
building for government staffs is through
comparative study, in which the city
government staffs can learn directly in the real
field. By organizing comparative study, it is
expected that the city government staffs will be
able to adopt various programmes applicable in
their city, surely based on the existing needs. In
addition, inter-city or inter-province job
trainings are needed so that the skills of the city
government staffs can be tested and assessed
directly.
Internet use currently has been encouraged for
the city government staffs in searching
information and conducting communication
with other parties. The frequency of internet use
for searching information, however, depends on
the individual and the workload of the staffs. In
addition, almost all city governments in
Indonesia have possessed website presenting
urban programmes; therefore, it is quite easy
for the city government staffs to search
information regarding programmes currently
run in other cities (for Yogyakarta :
www.jogja.go.id, for Denpasar:
www.denpasar.go.id, and for Surabaya :
www.surabaya.go.id), in which space for the
community to express their problems and for
information exchange has been made available
in the current website.
Box 1. NGO Lestari Indonesia
Mr. Aris Sustiyono, familiarly called Bung Aris, opened a conversation by explaining the mission of Lestari Indonesia, i.e. to respond global-level changes by establishing a local institution that the contributions are based on sustainable development principle. The institution tried to integrate three important aspects (economy, social and environment) and focused itself on environmental issues, both rural and urban.
In implementing its programmes, Lestari Indonesia, which was established on the Earth Day 2002, frequently cooperated with many parties. Besides it involved in other NGO consortium, Lestari Indonesia frequently cooperated with governmental institutions such as Yogyakarta City Environmental Office.
In more detail, Bung Aris as the Director of Lestari Indonesia, said that although Lestari Indonesia did not involved in the Streetlight Management Scheme and Kampong Streetlight program, it currently involves in air pollution programme.
The friendly man viewed that the performance of City Government of Yogyakarta has been quite good and that it could play its roles as the leader of the community and give positive options for the community through various diplomatic efforts it had conducted. The implementation of environment programmes seemed quite progressive for the last several years and Yogyakarta Mayor was quite creative in placing environment ordering in the first place.

5-2
The decision making process in the City Governments is the combination of bottom up and top down
approach. According to RPJMD, both bottom up and top down approach should accommodate
community aspiration through MUSRENBANGDA. For example, in sanitation program in Surabaya, the
needs of sanitation in each sub-district area is proposed in the sub-district MUSRENBANGDA as well as
through sanitation planning proposed by Environment Control Office to Budgeting Team and if it is
approved, prioritized, and in line with the RPJMD, then the sanitation budget will be allocated in this
office. Idea of a program can also be achieved during the visits of Mayor and city government staffs to
other cities in the world. In Yogyakarta, after the visits the Mayor will immediately conduct a meeting
with related offices to discuss the programmes that have been performed successfully by other visited
countries to see the possibility to be implemented in Yogyakarta based on the needs of Yogyakarta
community.
The involvement of NGOs (such as Lestari Indonesia,
WALHI, BORDA, Dian Desa, Bali Fokus) and community
in the outreach of the programmes has been encouraged
by the City Government and their performance are
satisfying. The performance, however, shall be improved
considering that in several cases of program
implementation, the community still treated as the object,
not the subject.
Meanwhile, the media, as a means to distribute
information, has functioned well. All information about
municipal government programmes has been distributed
by the media through Regional Information Body (special
office designated to distribute related information with
regards City Government activities). Nevertheless, the
information can also be collected through interviews with
city government staffs directly related to the
implementation of a programme.
In order to share information of activities or programmes
at national level, the City Government of Yogyakarta,
Denpasar and Surabaya participate as the member of
APEKSI (Association of Indonesian Municipalities,
website: http://www.apeksi.or.id/). On annual basis,
members of APEKSI (94 municipal governments) hold a
meeting to share information. The information sharing
among municipalities is very important to be done. In
addition to sharing program, the meeting is aimed to strengthen partnership that has important
meaning to the development of a region.
The City Government of Yogyakarta, Denpasar and Surabaya develop good relationship with central
government as well. For example, City Environmental Office frequently coordinates with the Ministry of
Environment in Jakarta, particularly in the implementation of several local programmes supporting the
programmes implemented by the central government. PROLABIR (Blue Sky Programme) is a
programme of air pollution control that is aimed to create an effective and efficient work mechanism in
Box 2. NGO Bali Fokus
Mr. I Nyoman Suartana, ST., commonly called Pak Nyoman, explains that Bali Fokus, as non-profit organisation, is aimed at encouraging dissemination of information about environmental management issues to all community groups. In addition, Bali Fokus encourages and develops independency and autonomy to the community in the effort to manage the environment. In the implementation of Biogas Project in Ubung Village, Pak Nyoman said that it is merely NGO, City Government and Mekar Sari group (Soybean curd industries) that involve in the project. Media, unfortunately, is not involved.

5-3
air pollution control, to control air pollution, to achieve ambient air quality necessary for human and
other creature health, and to develop environment-aware human behaviour. By the presence of
PROLABIR, several local air pollution control programmes will be monitored by the central government.
PROLABIR, for example, implemented by the central government through Decree of Minister of
Environment No. 15/1996 regarding Blue Sky. At local level, the program is adopted by provincial
government. For example in Yogyakarta, the program is adopted Provincial Government of Yogyakarta
Special Province (through Decree of DIY Province Governor No. 182 of 2003).
As a part of PROLABIR, five cities i.e Yogyakarta,
Denpasar, Surabaya, Central Jakarta, and Makassar
have been awarded as “Kota Langit Biru Terbaik (The
Best Blue Sky City) 2008” by Ministry of Environment
of Republic of Indonesia. The cities were awarded
after measurement and evaluation on air quality were
conducted in 12 big cities in Indonesia.
At international level, a program called Sister City is
implemented by three cities. Yogyakarta has been
cooperated with Savannah City (United Nations of
America), Kyoto City (Japan), and Hefei City (Peoples’
Republic of China). Denpasar currently has
cooperated with Kyongju City (South Korea),
particularly in cultural exchange programme. And
Surabaya has developed sister city cooperation with
three cities, that is Seattle (Washington, AS), Busan
(South Korea), and Kochi (Japan). Sister City Program
is conducted based on the similarities of the cities
geographical and activities features to develop the
opportunity of information sharing and cooperation in
various sectors. The program is conducted through
exchanged individuals, exchanged delegation, and
information sharing in education and culture sectors.
Beside ICLEI, Yogyakarta and Surabaya is the member
of CAI – Asia (Clean Air Initiatives in Asian Cities
www.cleanairnet.org/caiasia/). CAI-Asia is an organisation holding a mission to promote and
demonstrate innovative ways to improve the air quality in Asian cities through partnership and
sharing experiences. Surabaya is also conducted cooperation with Kitakyushu Initiative Network and
UNESCAP.
The cooperation between the cities with ICLEI since 2001 to 2005 has given many advantages for the
city government staff. Cities program has been promoted by ICLEI at national and international level.
City government staffs including the Mayor have been invited to many international and local events to
promote in order to promote urban environment-concept programmes that have been successfully
completed. During the ICLEI’s activities in Indonesia, a partnership had been developed with The
Center for Transportation and Logistics Studies (PUSTRAL) at Gadjah Mada University. PUSTRAL
Box 3. Jawa Pos Newspaper
Pak Imron works as a Marketing Staff in Jawa Pos Newspaper. He coordinates the activities directly related to the community and the city government, including environment programs. In his opinion, in order to make a program successful, it takes good coordination among the governments, media, and sponsors. Each party has its own responsibility that is interdependent to the others; the government as the initiator, the sponsors as the organizer, and the media as the one that communicate it to the community. One of the examples is the Green and Clean Program in Surabaya. With appropriate synergy among the government, Jawa Pos, and Unilever, the program is successful. The majority of the community support and participate.

5-4
serves as technical assistance for ICLEI with tasks to assist the cities (the member of ICLEI in Indonesia)
in formulating transportation program and GHG profiling.
Particularly for Denpasar, the role of ICLEI has not been optimum in promoting the Biogas program.
This is because Denpasar joined ICLEI in 2004 and ICLEI stopped its activities in Indonesia since 2005
and therefore information dissemination process in City Government of Denpasar stopped as well.
Despite of the success of ICLEI in promoting cities program both in national and international level,
however in the implementation stage there are some constraints:
a. The guidance from ICLEI Indonesia project coordinator has not been optimum, especially in
calculating the target of emission reduction from related programs. This is why until now the city
government staff has no capability in calculating the reduction.
b. The software to analyze the level of emission has not been given to the City Government. The City
Government has always been asked to collect data and the data are calculated by ICLEI Indonesia
project coordinator so that when the project is over, the City Government has not been able to
conduct independent calculation / evaluation its own emission reduction target.

6-1
Chapter 6 Programme of Each City 6.1. Yogyakarta
1. Project Description : Streetlight Management Scheme Programme
Figure 6. 1 KWh Meter in Public Streetlights
Yogyakarta City with an area of 32.5 km2, divided in to 14
districts and 45 villages, including the capital of Yogyakarta
Special Province, has 441,231 km of road length, served by
15,000 streetlights (on 467 streets). From years to years the
numbers of streetlights are increasing in order to comply with
the demand.
Before 2001, The City Government must pay the electricity bill
for the streetlight based on contract system. Meaning, the city
must pay for 12 hours of streetlight usage, regardless whether
the lights are actually on or not. Consequently, the city had to
pay the electricity bill of USD 56,000 per month in average to
the PLN. Meanwhile, streetlight’s revenue from public
streetlight tax, which is 8% from total customer’s electricity bill
each month, was only USD 50,000 per month, which causes the
deficit of USD 6,000 per month. Noticing such a condition,
Yogyakarta City Government formulated programs to cut down
its electricity bill.
Table 6. 1 GHG Forecasting
GHG (ton) Year
With Project With Out Project Reduction %
2001 6,495 - -
2002 7,387 4,802 2,586 35%
2003 8,066 5,243 2,823 35%
2004 8,863 5,761 3,102 35%
2005 9,767 6,349 3,418 35%
Total 11,929
Average Annually 2,982 35%
Source: ICLEI, 2002
In 2001, The City Government of Yogyakarta through City Infrastructure Office implemented an energy
efficient program for streetlight. They changed the usual streetlight to the type which are : (a) life time is
twice as longer as the existing (b) the same lumens with 60% lower power (watt), (c) had capacitor that
can reduce the power use up to 30%. And at the same time putting a meter on streetlight poles to
measure the power used (pay-for-service principal). In 2002, ICLEI assisted the City Government of

6-2
Yogyakarta to forecast the GHG from streetlight with and without project condition. The result is shown
in Table 6.1.
From Table 6.1, one can assume that in a business as usual condition (no project is implemented), in
2005 the City would produce 9,767 tonnes of eCO2. In that time, the City predicted that the project
would reduce 35% GHG (Green House Gases), based on the reduced of payment for the last couple
months. With this assumption, it was calculated that by the year of 2005 the City would reduce 11,929
tonnes of eCO2.
Table 6. 2 GHG Monitoring
GHG (ton) Year
With Project With Out Project Reduction %
2001 8,628 - - -
2002 9,374 6,858 2,516 27%
2003 10,185 5,337 4,848 48%
2004 11,066 6,773 4,292 39%
2005 12,023 7,834 4,189 35%
Total 15,845
Average Annually 4,241 37%
Source: ICLEI, 2005
After four years of implementation, to monitor the results of the energy efficiency program, a calculation
of GHG reduction was carried out in 2005. Based on the real energy used and payment in 2002 until
2005, it was calculated that in 2005 the City have reduced 15,845 tonnes of eCO2 or 37% GHG reduction
(Table 6.2).
2. Methodology in Reducing the GHG Emission
Green house gas resulted from the programme was measured by calculating the kilowatt hour (electricity
use) consumed using green house gas coefficient number (the coefficient number is provided by ICLEI –
Annex 2) for electricity. The difference of green house gas before and after the implementation of the
programme is the reduction of green house gas emission as the result of the programme
implementation. For Streetlight Management Scheme programme in Yogyakarta, as explained in the
previous section, after ICLEI conducted monitoring, the reduction of green house gas emission was
15,845 ton during 2001-2005.
Based on the interview with the City Environmental Office and City Infrastructure Office (offices related
to CCP and streetlight programme within City Government of Yogyakarta), it is revealed that related
staffs have not mastered the method of computing green house gas reduction from the related
programme, although ICLEI in 2002 had organized a workshop on method of computing GHG
reduction.
3. Scope of the Project
The scope of Streetlight Management Scheme programme is the entire of Yogyakarta City. Due to large
amount of saving on streetlight payment since the streetlight management scheme program was
implemented, the program is extended to Kampong Streetlight Program (since 2004). The city has
developed 4,500 streetlights in 45 sub districts in 14 districts all over the city. The management of

6-3
Kampong Streetlight is managed by Sub District Community Institution (SDCI) in every district. The
City Government provides each SDCI a grant to pay the streetlights bill and its maintenance.
Looking at the success of the project, in 2005 ICLEI donates 100 Ecorola lamps to the City Government.
Those lamps have not been installed yet since the City Government need to secure supporting fund to
build the poles, KWh meters and other supporting facilities. The City Government through City
Infrastructures Office plans to install the lamps at the end of 2005 in 3 sub districts i.e Purwokinanti,
Mantrijeron and Wirobrajan.
Until 2008, KWh meter and energy-saving lamps have been installed in all protocol street, 70% of
kampong street and 55% of area/village street. It is expected that in 2011 KWh meter and energy saving
lamps will have been installed in all street from protocol street to kampong or village street.
4. Stakeholders Involvement
The streetlight programme was initiated by the City Government and was well accepted by the
community which currently needs streetlight, particularly in kampong level. The programme is actually
a follow-up of the city government’s efforts to deliver services to the community.
Table 6. 3 Historical Data of Streetlight Program Dissemination
Organizer
Year/Month Government (city, provincial,
central)
Government (municipal, provincial,
central)
International NGO
May, 2008 Hearing Forum between City Infrastructure Office and community figures
2006 Seminar Clean Air Initiative, Yogyakarta
May 2006
4th Mayors’ Asia-Pacific Environmental Summit (MAPES 2006) in Australia (although the Mayor failed to participate but Yogyakarta submitted Mayors’ Commitments Progress Report)
Medan, 22-25 August 2005
ICLEI INDO-CCP WORKSHOP
2004 Seminar, City Infrastructure Office
22-24 September 2003
MAPES (Mayor’s Asia – Pacific Environmental Summit) 2003 in Honolulu
15-17 April 2003
National Workshop, INDO-CCP (ICLEI) in Surabaya
Source: Data Survey, 2008 and PUSTRAL’s archives
In accordance to urban programme planning, the streetlight programme planning has engaged
community participation through MUSRENBANGDA in village level by inviting the head of sub villages
and neighbourhood facilitated by Institution for Urban Community Development (LPMK). After it is

6-4
discussed in MUSRENBANGDA, the programme was included in the RPJMD to be implemented until
2011.
In the outreach of streetlight programme in Yogyakarta City, NGOs are not involved. The City
Government of Yogyakarta, through City Infrastructure Office, directly goes down to the community to
socialise and evaluate the programme. Nevertheless, media (in this case newspaper) has been actively
involved to inform the streetlight programme.
The streetlight programme has been informed widely in local, national and international level since
2003 (based on the recorded data, see Table 6.3). In local level, City Infrastructure Office, as the
institution which is responsible for the programmed, has organized dissemination of the program in the
form of seminars by inviting the community figures. In national level, workshops and seminars have
actively organized by ICLEI in several cities of Indonesia by inviting CCP member cities in Indonesia.
Within the forum, each city shared information about the programme conducted in every city. In
international level, furthermore, ICLEI has invited cities of Indonesia in the effort of programme
exchange, although it is not as specific as streetlight programme, for example programmed conducted in
Rayong, Thailand (30 June – 2 July, 2004), discussing waste management.
In international level, Yogyakarta City has
been quite active in introducing streetlight
programme, for example in MAPES (Mayors’
Asia-Pacific Environmental Summit) event
which is conducted on two years basis. In the
event, the Mayors are asked to give
commitment in the implementation of a
programme and to report the progress in the
next MAPES meeting.
Another party, such as City Council, plays role
as the supervisor and gives approval toward
budget proposed by the municipal
government for streetlight programme. PLN,
on the other side, in the implementation of
the programme plays as the party providing
electricity supply.
Figure 6. 2 Yogyakarta Mayor (Herry Zudianto) and Honolulu Mayor (Jeremy Harris) in the MAPES 2003 Held in Honolulu, Hawaii
Third party can be involved in the implementation of city programme. For streetlight programme, the
provision of energy-saving light is performed through general bid system to the third party (Service
Provider). The requirements of lamp desired by the Government are mentioned in the bid requirement.
The service provider, subsequently, submitted proposal describing various types and kinds of energy-
saving lamp. Eventually, the government chooses lamp of PHILIPS brand since the brand met all the
qualification in the bid requirement.
Problem facing the implementation of Kampong Streetlight Programme is in technical terms. The
community expects that kampong streetlight programme is also implemented on non-conbloc areas. It is
different with the city government side desiring that kampong streetlight is prioritised for conbloc
streets. On the other side, inefficiency has happened in several locations: streetlight is installed on areas

6-5
that have been quite bright and lighting has been previously available. It is pitiful since there are many
other locations that seem urgent to install streetlight. Although there are some problems in the field, it
does not result in conflict and the problems can be solved through discussion.
5. Financing
The financing of Streetlight programmed had been allocated in the APBD, since the programme was
started in 2001 until the final phase of the programme in 2011. The budget allocated for Streetlight
Management Scheme and Kampong Streetlight programme from 2007 – 2011 to improve (purchase and
install KWH meter and energy-
saving lamps) and maintaining
public streetlight is about Rp
39,558 Million (4,026,726 USD).
As mentioned above, the payment
of streetlight bill was monthly
collected from the Streetlight Tax
(8% from total electricity bill per
month) of PLN customers. The
mechanism is as follows: PLN
receive payment from the
community including the tax and
8% shall be deposited to the City
Government to be included in the
APBD in the PAD post.
Subsequently, the City
Government will pay for the
streetlight bill to PLN. Since the
implementation of streetlight
programmed in 2001, by the
installation of KWh meter and energy efficiency lamps, the City Government has been quite successful in
saving Rp 500 – 900 million per year (see Table 6.4).
6. Project Co-Benefits
In addition to the reduction of GHG, co-benefits of streetlight programme to the city government are as
follow: a) being able to serve the community comprehensively; (b) motivating the night tourism; (c)
saving the cost that can be allocated for other necessary programmes; and (d) the use of KWh meter is
useful in controlling and supervising electricity fraud. For the community, the programme can (a)
increase the cleanness of environment, such as decreasing pollution wasted to rivers (because it is
bright); (b) improve economic activities of the community; (c) improve safety of the community living
around the riverbank; and (d) reduce criminal action or criminal risk at night.
Mr. Affandi (Left) and Mr. Nugroho (right) are citizens of Cokrodiningratan Village. They got information about PJU and kampong street programme in their area through LPMK in the meeting attended by local community.
”Dari gelap menjadi terang! (From dark to bright!)”, Mr. Afandi said briefly when he was asked about the benefits of the programme. In addition, the surroundings became safer, Mr. Nugroho continued after he was interviewed while sitting in the patrol post.
Mr. Afandi and Mr. Nugroho argued that City Government of Yogyakarta, particularly during the current governing period, had been quite good in performing it duties and responsibilities and there was improvement compared to previous years. Much budget allocated to improve the community’s prosperity could be enjoyed by the implementation of the prescribed programmes.
Box 4. Voice of the Community (Yogyakarta)

6-6
Table 6. 4 Saving from the Payment of Streetlight Bill
Residue of Public Streetlight Revenue Year
Revenue form Public Streetlight
Tax
Payment of Public Streetlight Bill
Per year Per year
2000 5,398,722,290 5,233,590,507 165,131,783 13,760,982
2001 6,707,661,020 5,518,837,141 1,188,823,879 99,068,657
2002 10,113,246,000 5,537,053,508 4,576,192,492 381,349,374
2003 12,073,973,520 6,135,411,297 5,938,562,223 494,880,185
2004 14,373,485,340 6,913,135,186 7,460,350,154 621,695,846
2005 14,962,323,865 7,017,957,323 7,944,366,542 662,030,545
2006 16,819,421,894 6,470,189,571 10,349,232,323 862,436,027
2007 18,165,137,380 6,678,931,704 11,486,205,676 957,183,806
2008 7,155,019,850 2,983,648,492 4,171,371,358 834,274,272
Source: Yogyakarta City Infrastructure Office, 2008
6.2. Denpasar
1. Project Description : Community-Based Biogas Project: Converting Liquid Waste to Energy
Community Based Biogas Project in Ubud Vilage, Denpasar was initiated in 2003. The project is
basically installed IPAL (Instalasi Pengelolaan Air Limbah - Liquid Waste Treatment Installation)
communal infrastructures. IPAL is a liquid waste treatment plant with biogas digester. IPAL collects
waste from soybean curd industries and poultry slaughterhouse, processes it in the digester, and
converts it into biogas.
Ubung village of North Denpasar District, particularly Pucuk Sari is an area with high level of population
density and complex sanitation problem. Highly dense settlement, in addition to the presence of centre
of household industry of soybean and chicken slaughtering house, has turned Ubung area into a dirty
area in Denpasar City. Previously, there has been many programmes and efforts planned for several last
years in order to make the area better; however, it seems useless since it does not solve the root of the
problems.
On July 2003, because there are complaints from the community that feels disturbed by the stinky smell
and liquid waste of the small-scale industries, the entrepreneurs have agreed to develop IPAL system
together. The entrepreneurs, however, need technical assistance and guidance from other parties.
Together with process of participative approach currently implemented in the area in the frame of
SANIMAS1 (Community-Based Sanitation Group) project, Bali Fokus-BORDA (Bremen Overseas
Research and Development Association) have responded well to the idea by giving technical assistance,
guidance and financial support for IPAL physical construction. The entrepreneurs, furthermore, agree to
give contribution of area for IPAL location, digging cost, transportation of land resulted from digging
process and pipe system from the manufacture locations to IPAL site. The physical construction of
Biogas equipment is developed by an engineer made available by Bali Fokus. The workers, however,
including foreman, are taken from the citizens who have knowledge in construction; therefore, transfer
of knowledge can happen. It is extremely useful since the maintenance of the equipment will be
performed by the community.
1 SANIMAS is a participative approach that is aimed at analysing needs of sanitation and conducting development process until maintenance of facility by, from and for the community living within a dirty settlement.

6-7
The City Government of Denpasar does really support the initiative of the programme because it is in
line with the government programme, i.e. Sanitary Environment Program in Denpasar City. On
February 2004, IPAL Unit I was officially opened by Denpasar Mayor, in this case represented by the
Head of Denpasar City Environment Office together with the official announcement of SANIMAS
system.
Source: http://www.balifokus.or.id/ubung.htm
Figure 6. 3 Development Process of in Ubung Village
Up to this time, there have been 2 units of Biogas in Pucuk Sari area of Ubung village. Each unit can
process 6-8 tons of liquid waste a day, collected from participating home-based soybean industries. Each
unit produces about 15M3 biogas per day that is used for cooking (Unit I, 9 stoves for 5 KKs and Unit II,
8 stoves for 5 KKs) and lighting needs of the community so that the community can save petroleum
consumption.
In the wider scope, at present, public IPAL is under construction in Denpasar, called as DSDP (Denpasar
Sewerage Development Project) that was certified by Indonesian President on June 14, 2008. DSDP is
the development project of centred liquid waste hydrant system, which for the early stage involved
Denpasar City and Badung Regency and able to serve 160,000 persons. This development project
funded by loan from Japan Bank International Corporation (JBIC) is based on the fact of high pollution
of Benoa Bay waters.
The implementation of the certified project represents the early phase of three planned phases. The
activity involves the development of 129 km liquid waste pipe network covering main pipe, secondary
pipe, tertiary pipe, and lateral pipe network as well as IPAL development in Sawung. The second phase
of DSDP development construction will be conducted in 2009-2014.
DSDP Phase I will serve 10 thousand home connections or equal to 50 thousand persons. Beside that,
DSDP also serves connection to hotels and restaurants with connection cost of Rp 1.5 million.
Furthermore, households will get subsidiary from the local government and pay only Rp 600 thousands.

6-8
Then, every home gets connection and shall pay retribution around Rp 5,000 monthly. The retribution
for hotels is based on room numbers, and for restaurants is based on chair numbers.
The Bali Province government prepares 10 hectares field that costs Rp 100 billion for this IPAL project.
With the capacity of 51.000 m3 per day, IPAL will produce water processing result with BOD (Biological
Oxygen Demand) of less than 30mg/litre (better of the quality standard, 50mg/litter). Then, it can be
used to water parks or drained to sea.
With the development of DSDP, it is expected will not interrupt the activity of sewerage to communal
IPAL, since it is only the effluent which is drained to the DSDP.
2. Methodology in Reducing the GHG Emission
GHG reduction of this program resulted from fuel substitution and avoidance of methane gas emissions
from the untreated liquid waste. Fuel consumption (kerosene and LPG) before and after the program is
calculated in order to see the fuel saving. In addition, the liquid waste is also measured before and after
the program. The difference of fuel and liquid waste then multiply with coefficient number of green
house gas (the coefficient number is provided by ICLEI, Annex 2) in accordance to the fuel type and
waste type, so that the reduction of GHG is acquired.
Based on ICLEI Report (2005), Community-Based Biogas Project in Denpasar were successful in
reducing GHG by 149 ton per year. Based on the interview with the City Environmental Office
(department related to CCP and Community-Based Biogas programme within City Government of
Denpasar), as in Yogyakarta, it is revealed that related staffs have not mastered the method of
computing GHG reduction from the related programme.
3. Scope of the Project
The project, at the beginning, is implemented for small scale. Currently, it can serve the entire of Ubung
village citizens (500 KKs), using the stoves in turn. Biogas Projects were also implemented in several
villages by Bali Fokus, such as in Sesetan, Padang Sambian and Penatih village. The suppliers of waste
are not merely from soybean curd industries but also animal (cow) husbandry and slaughterhouse such
as in Pesanggaran village, Aswinandini Cow Husbandry in Bangli and Peguyangan Kangin. The
programme is not only implemented in Denpasar, the programme has also been implemented in West
Nusa Tenggara Province (Harapan Makmur Soybean curd industry in Bima City) and Stable in Lombok.
Biogas project in Ubung is a pilot project and The City Government of Denpasar was merely role as
facilitator. If the project responded well by the community, then for the next stages the City Government
will allocate some fund in the APBD. But since the cost to build one biodigester is quiet expensive (Rp 85
Million), the City Government sought for other partner which is PT. Mulya Tiara Nusa. With this
company, the cost to build one biodigester was only Rp 5 million.
Until 2007, The City Government of Denpasar (Environment Office and Husbandry Office) in the form
of SANIMAS Program have built 16 biogas units in several villages such as Padang Sambian Kaja,
Peguyangan Kangin, Penatih, Padang Sambian and Sesetan.
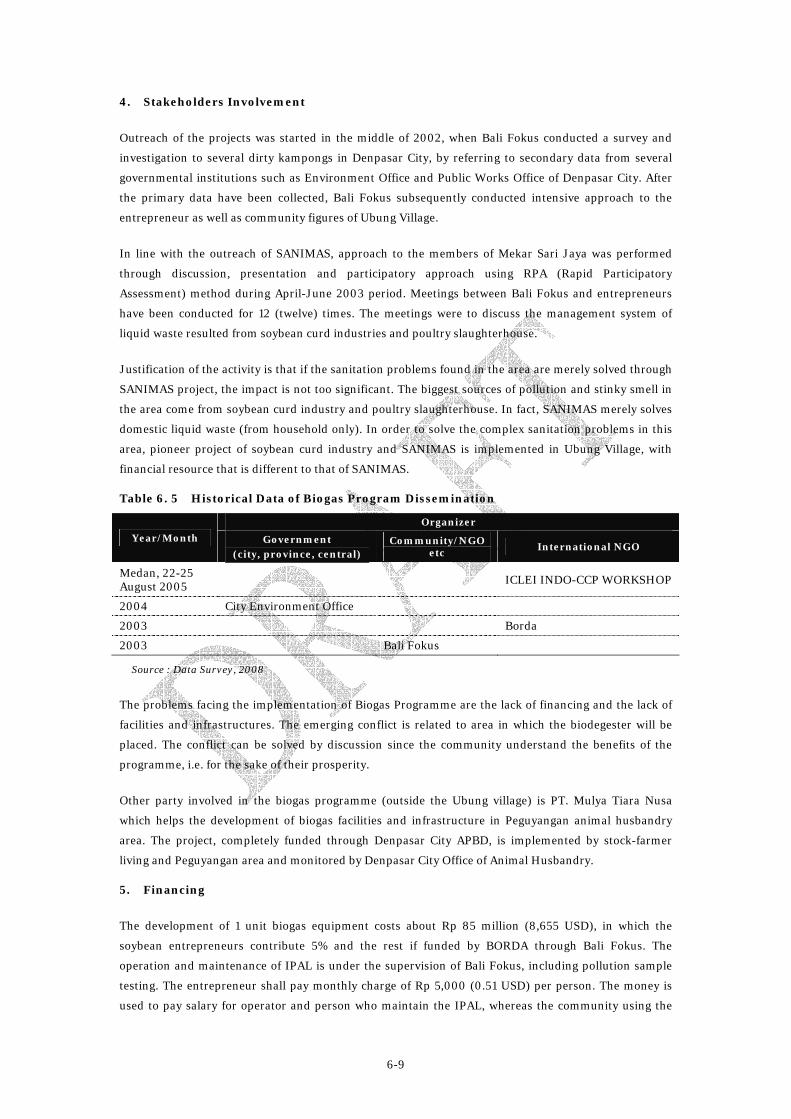
6-9
4. Stakeholders Involvement
Outreach of the projects was started in the middle of 2002, when Bali Fokus conducted a survey and
investigation to several dirty kampongs in Denpasar City, by referring to secondary data from several
governmental institutions such as Environment Office and Public Works Office of Denpasar City. After
the primary data have been collected, Bali Fokus subsequently conducted intensive approach to the
entrepreneur as well as community figures of Ubung Village.
In line with the outreach of SANIMAS, approach to the members of Mekar Sari Jaya was performed
through discussion, presentation and participatory approach using RPA (Rapid Participatory
Assessment) method during April-June 2003 period. Meetings between Bali Fokus and entrepreneurs
have been conducted for 12 (twelve) times. The meetings were to discuss the management system of
liquid waste resulted from soybean curd industries and poultry slaughterhouse.
Justification of the activity is that if the sanitation problems found in the area are merely solved through
SANIMAS project, the impact is not too significant. The biggest sources of pollution and stinky smell in
the area come from soybean curd industry and poultry slaughterhouse. In fact, SANIMAS merely solves
domestic liquid waste (from household only). In order to solve the complex sanitation problems in this
area, pioneer project of soybean curd industry and SANIMAS is implemented in Ubung Village, with
financial resource that is different to that of SANIMAS.
Table 6. 5 Historical Data of Biogas Program Dissemination
Organizer
Year/Month Government (city, province, central)
Community/NGO etc International NGO
Medan, 22-25 August 2005
ICLEI INDO-CCP WORKSHOP
2004 City Environment Office
2003 Borda
2003 Bali Fokus
Source : Data Survey, 2008
The problems facing the implementation of Biogas Programme are the lack of financing and the lack of
facilities and infrastructures. The emerging conflict is related to area in which the biodegester will be
placed. The conflict can be solved by discussion since the community understand the benefits of the
programme, i.e. for the sake of their prosperity.
Other party involved in the biogas programme (outside the Ubung village) is PT. Mulya Tiara Nusa
which helps the development of biogas facilities and infrastructure in Peguyangan animal husbandry
area. The project, completely funded through Denpasar City APBD, is implemented by stock-farmer
living and Peguyangan area and monitored by Denpasar City Office of Animal Husbandry.
5. Financing
The development of 1 unit biogas equipment costs about Rp 85 million (8,655 USD), in which the
soybean entrepreneurs contribute 5% and the rest if funded by BORDA through Bali Fokus. The
operation and maintenance of IPAL is under the supervision of Bali Fokus, including pollution sample
testing. The entrepreneur shall pay monthly charge of Rp 5,000 (0.51 USD) per person. The money is
used to pay salary for operator and person who maintain the IPAL, whereas the community using the
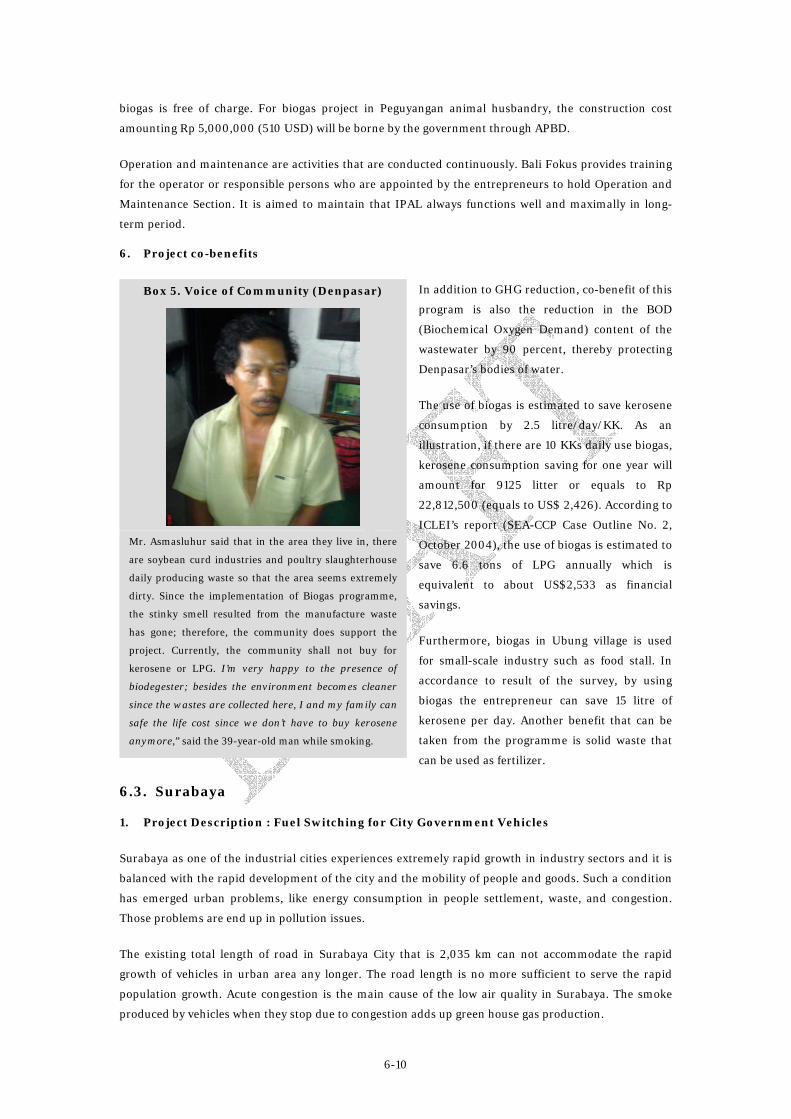
6-10
biogas is free of charge. For biogas project in Peguyangan animal husbandry, the construction cost
amounting Rp 5,000,000 (510 USD) will be borne by the government through APBD.
Operation and maintenance are activities that are conducted continuously. Bali Fokus provides training
for the operator or responsible persons who are appointed by the entrepreneurs to hold Operation and
Maintenance Section. It is aimed to maintain that IPAL always functions well and maximally in long-
term period.
6. Project co-benefits
In addition to GHG reduction, co-benefit of this
program is also the reduction in the BOD
(Biochemical Oxygen Demand) content of the
wastewater by 90 percent, thereby protecting
Denpasar’s bodies of water.
The use of biogas is estimated to save kerosene
consumption by 2.5 litre/day/KK. As an
illustration, if there are 10 KKs daily use biogas,
kerosene consumption saving for one year will
amount for 9125 litter or equals to Rp
22,812,500 (equals to US$ 2,426). According to
ICLEI’s report (SEA-CCP Case Outline No. 2,
October 2004), the use of biogas is estimated to
save 6.6 tons of LPG annually which is
equivalent to about US$2,533 as financial
savings.
Furthermore, biogas in Ubung village is used
for small-scale industry such as food stall. In
accordance to result of the survey, by using
biogas the entrepreneur can save 15 litre of
kerosene per day. Another benefit that can be
taken from the programme is solid waste that
can be used as fertilizer.
6.3. Surabaya
1. Project Description : Fuel Switching for City Government Vehicles
Surabaya as one of the industrial cities experiences extremely rapid growth in industry sectors and it is
balanced with the rapid development of the city and the mobility of people and goods. Such a condition
has emerged urban problems, like energy consumption in people settlement, waste, and congestion.
Those problems are end up in pollution issues.
The existing total length of road in Surabaya City that is 2,035 km can not accommodate the rapid
growth of vehicles in urban area any longer. The road length is no more sufficient to serve the rapid
population growth. Acute congestion is the main cause of the low air quality in Surabaya. The smoke
produced by vehicles when they stop due to congestion adds up green house gas production.
Mr. Asmasluhur said that in the area they live in, there
are soybean curd industries and poultry slaughterhouse
daily producing waste so that the area seems extremely
dirty. Since the implementation of Biogas programme,
the stinky smell resulted from the manufacture waste
has gone; therefore, the community does support the
project. Currently, the community shall not buy for
kerosene or LPG. I’m very happy to the presence of
biodegester; besides the environment becomes cleaner
since the wastes are collected here, I and my family can
safe the life cost since we don’t have to buy kerosene
anymore,” said the 39-year-old man while smoking.
Box 5. Voice of Community (Denpasar)

6-11
Sources: Photos taken from the Presentation of Air Quality Improving - Experiences of Surabaya City Indonesia, The Sixteenth Asia Pacific Seminar on Climate Change “Asia Pasific Regional Approach to Climate Friendly and Climate Change - Resilient Society “Jakarta, Indonesia, 5 - 8 September 2006
Figure 6. 4 City Government’s Car with CNG Fuel
To address to this problem, Surabaya City Government conducts some environment programs as well as
sustainable transportation programs. The program is then known as “Program Langit Biru Surabaya“
or Surabaya Blue Sky Program. Previously in 1998, with the GTZ assistance, Surabaya has developed
SUTP (Sustainable Urban Transport Program) documentation. STUP GTZ is began with programs of
many aspects, including sustainable development of transportation policies through intensive discussion
with institutes and related partners, designing and implementing a campaign of community awareness
about sustainable transportation, technical ways in reducing vehicles emission, increasing capacity of
air quality management, assembling appropriate fiscal instruments, improve the condition for non
motorized vehicles and pedestrians, CNG (Compressed Natural Gas) usage promotion, a pilot project of
public transportation improvement, and supplying and information dissemination about international
experiences.
But in its implementation, SUTP program did not receive enough fund with the result the programs can
not be implemented. Therefore, to attract community interest especially in promotion of CNG fueled
vehicles, in 2002 the City Government began the fuel efficiency program by using CNG for city
government vehicles. This program is intended as pilot project in order to encourage the community to
use CNG fueled vehicles. The use of CNG that can save energy better and produce less pollution
compared to diesel fuel or gasoline is introduced by the City Government as one of the solutions to deal
with air pollution. CNG as an alternative fuel has been started in 1996 – 1997 by Zebra Taxi, which has
1000 fleets using CNG as fuel.
Meanwhile, in the scope of the city government, the CNG program has been started in October 2002 to
April 2003 as the first stage of the program. One hundred (out of 400) vehicles operated by the City
Government has used CNG fuel. The office vehicles have been provided with converter kit, CNG tube and
on/off switch, so that they can use either gasoline or CNG for fuel.
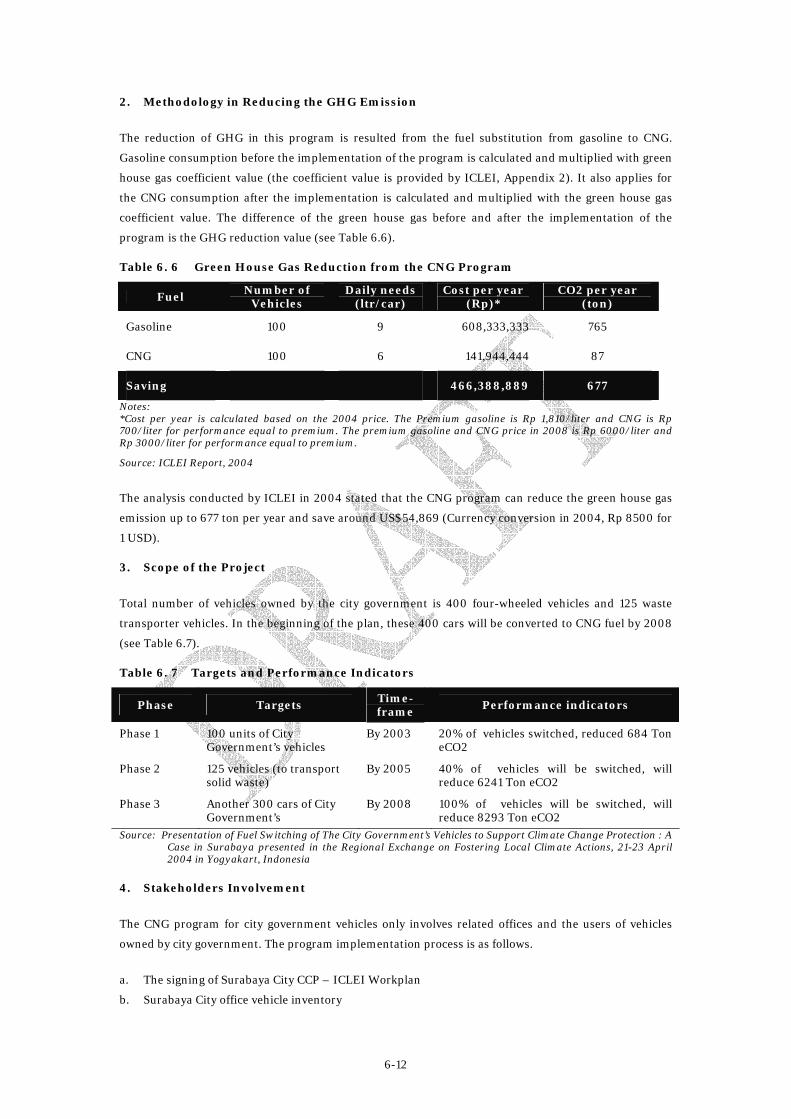
6-12
2. Methodology in Reducing the GHG Emission
The reduction of GHG in this program is resulted from the fuel substitution from gasoline to CNG.
Gasoline consumption before the implementation of the program is calculated and multiplied with green
house gas coefficient value (the coefficient value is provided by ICLEI, Appendix 2). It also applies for
the CNG consumption after the implementation is calculated and multiplied with the green house gas
coefficient value. The difference of the green house gas before and after the implementation of the
program is the GHG reduction value (see Table 6.6).
Table 6. 6 Green House Gas Reduction from the CNG Program
Fuel Number of
Vehicles Daily needs
(ltr/car) Cost per year
(Rp)* CO2 per year
(ton)
Gasoline 100 9 608,333,333 765
CNG 100 6 141,944,444 87
Saving 466,388,889 677
Notes: *Cost per year is calculated based on the 2004 price. The Premium gasoline is Rp 1,810/liter and CNG is Rp 700/liter for performance equal to premium. The premium gasoline and CNG price in 2008 is Rp 6000/liter and Rp 3000/liter for performance equal to premium.
Source: ICLEI Report, 2004
The analysis conducted by ICLEI in 2004 stated that the CNG program can reduce the green house gas
emission up to 677 ton per year and save around US$54,869 (Currency conversion in 2004, Rp 8500 for
1 USD).
3. Scope of the Project
Total number of vehicles owned by the city government is 400 four-wheeled vehicles and 125 waste
transporter vehicles. In the beginning of the plan, these 400 cars will be converted to CNG fuel by 2008
(see Table 6.7).
Table 6. 7 Targets and Performance Indicators
Phase Targets Time-frame
Performance indicators
Phase 1 100 units of City Government’s vehicles
By 2003 20% of vehicles switched, reduced 684 Ton eCO2
Phase 2 125 vehicles (to transport solid waste)
By 2005 40% of vehicles will be switched, will reduce 6241 Ton eCO2
Phase 3 Another 300 cars of City Government’s
By 2008 100% of vehicles will be switched, will reduce 8293 Ton eCO2
Source: Presentation of Fuel Switching of The City Government’s Vehicles to Support Climate Change Protection : A Case in Surabaya presented in the Regional Exchange on Fostering Local Climate Actions, 21-23 April 2004 in Yogyakart, Indonesia
4. Stakeholders Involvement
The CNG program for city government vehicles only involves related offices and the users of vehicles
owned by city government. The program implementation process is as follows.
a. The signing of Surabaya City CCP – ICLEI Workplan
b. Surabaya City office vehicle inventory

6-13
c. The proposal of the plan of Gas Fuel (CNG) converter for Surabaya City Government vehicles to
Surabaya City Government Budgeting Team
d. Coordinating meeting and dissemination in city government staff
e. Announcement Letter about CNG Program Plan
f. Installation schedule and implementation
Table 6. 8 Outreach Process of CNG Program
Operator
Year/Month Government (city, province, central
govt.)
Community/ NGO etc.
International NGO
15-17 April 2003, Surabaya
Surabaya City Government in cooperation with ICLEI INDO-CCP
- INDO-CCP Workshop “The Implementation of CCP in Some Cities in Indonesia”. Conducted by ICLEI – INDO CCP
19-21 July 2004, Mexico
- - Local Government Innovations in Climate Protection. Conducted by ICLEI
2004, BAQ India - - Speaking on the Strategy of Air Pollution Control in Surabaya City. Conducted by CAI Asia – Network
2006 , BAQ Yogyakarta
- - Poster Presentation. Conducted by CAI – Network
5 – 8 September 2006, Jakarta
The Sixteen Asia Pasific Seminar on Climate Change “Asia Pasific Regional Approach to Climate Friendly on Climate Change Resilient Society”. The event is conducted by the Ministry of Environment in cooperation with Makato City, Japan
- -
Source : Bappeko Surabaya , 2008
The outreach of CNG program both nationally and internationally has been conducted since 2003 to
2006 as described in Table 6.8.
However, in the implementation, the use of CNG must face some constraints as follows.
a. Surabaya City Government does not have its own gas fuel station. The existing gas station is owned
by Zebra Taxi Company, so that the office vehicles converted to Gas Fuel get the fuel from Zebra
Taxi gas station in Brebek and Tanjung Sari Area (far from the city center). This made the CNG
users reluctant to use CNG because they have to travel far to get thei vehicles refueled.
b. It often happens that the gas station pressure is low, therefore private, public, and office vehicles are
not allowed to fill the gas fuel in the gas station; the priority is for Zebra Taxis as the owner of the
gas station
c. The spare parts are difficult to find in Surabaya City.
d. Not all mechanical garages provide the service of converter kit installation, engine tune-up, CNG
vehicle inspection and maintenance.

6-14
Various constraints above caused many CNG
users felt reluctant using this fuel. Whereas,
there was an agreement between Zebra Taxi and
PERTAMINA (State Oil Company - one of the
CNG providers in Surabaya). The agreement
stated that Zebra bought the license as the CNG
distributor from PERTAMINA with minimum
purchase of 1000 litre per day. Then Zebra also
made an agreement with the city government.
The agreement is, the city government will
purchase CNG from Zebra gas station for their
CNG vehicles.
However, along the way, since the vehicles users
are reluctant to use CNG, the sell of CNG were
less than 1000 litre each day which turn Zebra in
loss condition and as a result the contract
agreement is terminated in 2005. Nonetheless in
reality until today, Zebra is still using CNG for
their vehicles but they are not a distributor
anymore, just a regular customer of
PERTAMINA.
Beside Zebra Taxi, the other taxi company using
CNG is Silver Taxi. Silver taxi has 600 units of
operation vehicles. Silver has collaboration with
CNE (an oil and gas company) to provide CNG
but only as a user not as distributor. If any, the City Government can have collaboration with CNE to
supply the gas. However, considering the various constraints mention above the City Government still
pending to continue the CNG program for its vehicles.
5. Financing
The cost needed for a vehicle conversion is about Rp 10 – 12 million, that is to purchase and install the
converter kit and gas tube. The funding for CNG program for city government office vehicles is purely
from Surabaya City Budget of Revenue and Expenditure. By April 2003, Rp. 888.750.000 has been
allocated for switching 100 vehicles to CNG.
6. Project Co-benefits
Besides reducing green house gas, other benefits of this program are the fuel cost saving (see Table 6.6),
better air quality and indirectly it will lead to the improvement of live/health quality of Surabaya citizen.
This dark-skinned gentlement is usually work in Tegalsari, Surabaya, where he earns livelihood for his son and daughter. He has been working as a taxi driver in Silver Taxi for five years. Silver Taxi is one of the taxi companies using cars with gas and gasoline fuels.
He said that the advantage of using gas fuel is the affordable price compared to cars with gasoline fuel; even, the difference of the price of both fuels is 50%. However, the gas fuel station is located in a distant location and it only has limited fuel stock.
According to Bapak Kuswoyo, this program can work properly because it gets the support from a gas company in Jakarta.
Box 6. Voice of Community (Surabaya)

7-1
Chapter 7 Concluding Remarks 1. Decentralization process has put forward the opportunities and challenges for local governments.
Therefore, they have to define efforts to address the problems of development in local level. There
are many opportunities to manage self-programs so that the development needs can be well-
directed. On the other hand, local government is encouraged to be more transparent and reliable for
the community. The city should be creative in introducing city investment and producing income as
well as wisely managing its finance by investing public money to public expenditure and projects
with the most effective cost. In order to achieve those targets, strong leadership from the Mayor is
needed. The Mayor should have the courage to take the lead for implementing the least risk
programs and at the same time improve the in-house technical capacity. In Yogyakarta, Denpasar
and Surabaya, the political will of the Mayors in implementing CCP Programs is evidence, whereas
all Mayors signed City Resolution which stated to reduce GHG through implementing local
programs.
2. In the effort to improve the in-house technical capacity, the City Government of Yogyakarta,
Denpasar and Surabaya have set several programs such as delegates government staffs to attend to
short course and training, workshop and seminar, join the cities association (APEKSI), sister city
and networking with international NGO and donors as well as using the internet to seek and
disseminate information. One important challenge that the city government to face is to improve
the design of public consultation. It is evidence from Streetlight and Biogas Program where proper
public consultation leads to the success of the program implementation.
The city government and the administration has to learn, and learns quickly how to design and
delivers the program in the most effective way. Secondly, the city government must continuously
improve their capacity to implement and monitor the bundled program of environment and local
development. For some years to come the issue of the Millennium Development Goals and poverty
reduction will still dominate the political decision – and this bundled approach will be the most
appropriate strategy in conveying the message for environment improvement.
3. Every long term development objective needs a first step. The city administration experienced that
taking the first step is the most difficult part of the program implementation. Governments and
bureaucracies are normally very nervous when it comes to start the process. Partly because most of
the infrastructure investment is a sunk cost, and partly of because of the pressure from its
stakeholder for output and outcome oriented projects. It is why technical and management capacity
of the city government and its officials need to be improved before capital investment take place. To
this end, technical and financial assistance from various organizations are necessary to ensure the
success of the implementation.
4. From the structure of the Cities budget, fund purely allocated for development merely amounts for
about 5-35% of the total budget. The rest of the budget is used to pay city government staff salary.
And if one looks at the local budget based on the structure of public sector funding, the largest
expense allocation for public service is education and culture sectors. Environment sector is only

7-2
allocated less than 10% from local government expenditure. The amount of the local budget
allocated by the government for the implementation of development programs, including the
environmental programs, gives significant influence to the success of the programmes. Looking at
the minimum amount of development budget (particularly fro environment program), City
Government can make cooperation with private sector and business community where they could
participate in promoting livable city and reducing air pollution problems particularly related to
GHG. This will include private capital investment in infrastructure development and the
development of incentive and disincentive scheme for business entities participating in protecting
the environment.
5. During the course of program planning, there are several lessons learned as follows:
a. City Governments should be willing to take the risk because in every decision that is made,
there will be gainers and losers. There will be people who benefit most from the project and
there are people who will be dis-benefited from the decision. The city has to make sure that the
decision is made with careful consideration, just and equitable principles.
b. Indonesia is currently experiencing a rapid and often unpredicted change in its development. It
is politically changing. Its democracy is challenged by the needs for long term commitment. It
is why we have to navigate our development plan in a fast changing political climate. It needs to
have a robust concept but flexible implementation schemes.
c. The participation of NGO. At the moment we are facing a dilemma with our NGO. We witness
that Indonesian NGO is also in transition. While the city believes that NGO plays an important
role in communicating the voice of interest groups and the community, it is also understood
that they also need to increase their capacity to advocate the principles of sustainable
development. Some of them are providing a substantial contribution during the planning,
implementation and monitoring stages of a project.
d. The importance of the support from appropriate Technical Assistance, both from International
and National organizations as well as local organization like universities. Organizations like
ICLEI are as important as various donor organizations already operating in the cities like The
World Bank, ADB, USAID, GTZ, etc.
e. The cities need to built technical, management and financial capacity to deal with environment
issues. They will not only bring self esteem to the administration, but also creating a trust
between government, private sector and the civil society.

x
References
CO2 Emission of INDO-CCP Member (9 Cities) and CO2 Emission Reduction Program in Transport Sector, ICLEI Report, PUSTRAL UGM, 2004
CO2 Emission of INDO-CCP Member (9 Cities) and CO2 Emission Reduction Program in Transport
Sector, ICLEI Report, PUSTRAL UGM, 2004 CO2 Emission of INDO-CCP Member (9 Cities) and CO2 Emission Reduction Program in Transport
Sector, ICLEI Report, PUSTRAL UGM, 2004 Denpasar City in Figures, Denpasar City Statistic Bureau, 2000-2007 Denpasar City Regional Revenue and Expenditure Budget Archive for 2001 – 2007 Budget Year,
Denpasar City Planning Office (BAPPEDA) Energy Savings from Streetlight Program in Yogyakarta City , ICLEI Report, PUSTRAL UGM, August
2005 Presentation on Air Quality Improving - Experiences of Surabaya City Indonesia, The Sixteenth Asia
Pasific Seminar on Climate Change “Asia Pasific Regional Approach to Climate Friendly and Climate Change - Resilient Society”Jakarta, Indonesia, 5 - 8 September 2006
Presentation on Fuel Switching of The City Government’s Vehicles to Support Climate Change
Protection : A Case in Surabaya, Regional Exchange on Fostering Local Climate Actions, 21-23 Regulation of Denpasar Mayor No 19 of 2005 regarding Denpasar City RPJMD (2005 – 2010) April 2004 in Yogyakart, Indonesia
Regulation of Denpasar Mayor No 19 of 2005 regarding Denpasar City RPJMD (2005 – 2010) Regulation of Yogyakarta Mayor No 17 of 2007 regarding Yogyakarta City RPJMD (2007 – 2011) SEA-CCP Case Outline No. 2, ICLEI Publication, October 2004 Surabaya City in Figures (2000-2006), Surabaya Statistics Bureau Surabaya City RPJMD (2006 – 2010) SEA-CCP Case Outline No. 10, ICLEI Publication, October 2004 USAID, EGAT/ESP/GCC, An End of Program Evaluation of The Cooperative Agreement between
USAID/EGAT and The International Council For Local Environmental Initiatives (ICLEI), 2005
World Bank, Spending for Development: Making the most of Indonesia’s new opportunities”, Indonesia
Public Expenditure Review, 2007 Zudianto and Parikesit, PROMOTING LIVABLE CITY: Integrating local/global environmental concerns
and local development challenges, Presented at MAPES - MAYOR’S ASIA-PACIFIC ENVIRONMENTAL SUMMIT, Honolulu, September22-24, 2003
Yogyakarta City in Figures, Yogyakarta City Statistic Bureau. 2000-2007 Yogyakarta City Regional Revenue and Expenditure Budget Archive for 2001 – 2007 Budget Year,
Yogyakarta City Planning Office (BAPPEDA)
http://www.balifokus.or.id/ubung.htm
http://www.denpasarkota.go.id/
http://www.jogja.go.id/
http://www.surabaya.go.id/

Annex-1
Annex 1 List of Respondents No Name Position Affiliation Phone/Fax/Mobil
e Email
1. Drs. Suhartono, ST
Chairman Commission III of City Council
+62-274-540650
+62-274-540651
+62-81578651330
2. Mr. Hari Setyowacono, ST., MT
The Head of Control, Evaluation and Report Section
BAPPEDA Yogyakarta City
+62-274-515865
+62-274-515866
+62-81578706180
3. Sumedi, S.T Staff Yogyakarta City Infrastructure Office
+62-274-586 795
+62-815 787 060 71
4. Pieter Lawoasal Head of Environmental Monitoring and Liquid Waste Management Division
Yogyakarta City Environmental Office
+62-274- 515876
+62-816676573
5. Ir. Aris Edi S., MT.
Assistant Manager of Marketing
PT. PLN Persero APJ Yogyakarta
+62-274-452200, 452111, 452460
+62-815 777 3341
6. Suparlan Executive Director
WALHI +62-818277178 [email protected]
7. Aris Sustiyono Director LESTARI INDONESIA
+62-274- 6536781
+62-274-547174
+62-81578182988
8. Suwarno Chairman LPMK of Tahunan Village, Kotagede
+62-274-520037
9. Heru, Afandi, Nugroho, Muslim
Community RW-8 – 11 Cokrodiningratan Yogyakarta
10. Firstanto Didik Journalist Bernas Jogja +62-812 271 0534 [email protected]
11. Anik Puspitosari
Journalist Kedaulatan Rakyat Jogja Chapter
+62-274-565685
+62-815 787 90 503
12. Ir. I.B Udiyana Chairman Commission B for Environment Affairs, City Legislative
+62-361-237919
+62-361-237920
13. Ir. Ketut Sugiarta
Vice Chairman Commission B for Environment Affairs, City Legislative
+62-361-237919
+62-361-237920
14. Dewa Puspawan
Head of Sub Division
Settlement and Regional Development, Bappeda Denpasar
+62-361-416400

Annex-2
No Name Position Affiliation Phone/Fax/Mobile Email
15. Ir. Nyoman Brandi
Head of Sub Division
Administration Section of Environment Office
+62-81 7486690
+62-361- 223355
16. Ir. I Wayan Bawa
Instructor Madra Farming, Office of Animal Husbandry
+62-361-229733
17. I Nyoman Suartana, ST
Staff NGO Bali Fokus
18. Asmasluhur Soybean Company Director
Pucuk Sari Neighbourhood
19. Huda Muryanto
Community Pucuk Sari Neighbourhood
+62-81 933037157
20. Ida Community Pucuk Sari Neighbourhood
21. Ir. Togar Arifin Silaban, MEng
Head of Environment Control Office
City Government of Surabaya
+62-818304716
22. Dwi Ratna Staff Bappeko Surabaya
031-72654573 [email protected]
23. Chamida Staff at Environment Control Office
City Government of Surabaya
24. Kuswoyo Taxi Driver Taxi Silver Surabaya
25. M. Imron Mashoed
Marketing Jawa Pos Surabaya
+62888183136

Annex-3
Annex 2 Coefficient Value Energy Coefficient
Fuel Type CO2 (eCO2)N2O (eCO2)CH4 Nox Sox CO VOC
Gasoline (Kg GHG/GJ) 69.174 0.186 0.42 0.6 0.04464 8 1.50E+00
Kerosene (Kg GHG/GJ) 71.736 0.1448 0.0639 0.16612 0 0.0342 0.00821
Solar 73.932 0.186 0.105 0.8 0.13846 1 0.2
Electricity (kg/kWh) 0.741 0.00231 0.00029 0.00218 0.00452 0.00108 4.85E-05
Source: ICLEI, 2002 adopted from IPCC (Intergovernmental Panel for Climate Change) 1999
Energy Density
Fuel Type GJ/liter GJ/ton GJ/m3
Electricity
CHP Heat
Hydrogen 0.0027 0.0142
Natural Gs 45.23 0.0387
CNG 0.007 45.23 0.0387
Landfill methane 0.0386
Sewage gas 0.0386
Biogas 0.0386
Gasoline /petrol 0.0329 44.81
Diesel 0.0367 43.34
Light Fuel oil 0.0289 40.27
Heavy fuel oil 0.0288 40
Kerosene 0.0314 43.76
LPG 0.0247 47.32
Jet fuel 0.0341 44.6
Ethanol (E-10) 0.0329 43
Ethanol (E-85) 0.0318 29.5
Ethanol (E-100) 0.0296 26.8
Coal 21.23
Anthracite 26.65
Bituminous coal 26.65
Sub-Bituminous coal 18.01
Lignite 10.61
Peat 8.38
Charcoal 29
Coke 23.31
Wood (Oven dry) 0.0092 20
Wood (Freshly dry) 0.005 10.9
Fuelwood (air dry) 0.0069 15
MSW 11
Refuse derived waste 11
Agricultural waste 15
Bagasse 8
Dung 12
Source: ICLEI, 2002 adopted from IPCC (Intergovernmental Panel for Climate Change) 1999

Annex-4
Annex 3 Tables and Figures of Yogyakarta City
Table Annex 3. 1 Area Distribution of Yogyakarta City
Number of No District Width
(km2) Village Sub Village Neighbourhood 1 Mantrijeron 2.61 3 55 230 2 Kraton 1.40 3 43 175 3 Mergangsan 2.31 3 60 219 4 Umbulharjo 8.12 7 80 318 5 Kotagede 3.07 3 40 161 6 Gondokusuman 3.99 5 65 276 7 Danurejan 1.10 3 43 160 8 Pakualaman 0.63 2 19 84 9 Gondomanan 1.12 2 31 110 10 Ngampilan 0.82 2 21 120 11 Wirobrajan 1.76 3 34 165 12 Gedongtengen 0.96 2 44 163 13 Jetis 1.70 3 36 168 14 Tegalrejo 2.91 4 46 183
TOTAL 32.50 45 617 2,532 Source : Yogyakarta City in Figures, 2001
Table Annex 3. 2 Number of Population of Yogyakarta City
Year No. District
2000 2001 2002 2003 2004 2005 2006 2007
1 Mantrijeron 38,736 39,242 39,693 32,730 32,659 35,718 36,364 41,450 2 Kraton 31,763 32,072 32,184 19,168 19,857 21,700 22,093 29,492 3 Mergangsan 41,155 41,700 42,193 30,093 31,488 34,426 35,049 42,954 4 Umbulharjo 65,252 66,912 69,293 71,375 69,479 75,996 77,371 75,989 5 Kotagede 27,733 28,408 28,980 29,358 27,979 30,608 31,162 33,018 6 Gondokusuman 72,233 72,811 73,730 47,195 48,617 53,160 54,122 76,302 7 Danurejan 30,431 30,642 30,840 18,517 19,822 21,673 22,064 32,884 8 Pakualaman 14,608 14,790 14,762 9,736 10,628 11,621 11,831 14.923 9 Gondomanan 20,130 20,532 20,625 14,266 13,935 15,222 15,498 17.873 10 Ngampilan 22,989 23,052 23,189 17,558 17,627 19,262 19,611 23.758 11 Wirobrajan 29,778 30,139 30,533 26,329 26,693 29,217 29,746 32.343 12 Gedongtengen 25,915 26,448 26,398 17,330 17,926 19,592 19,947 26.876 13 Jetis 37,552 37,959 38,268 23,736 26,038 28,480 28,995 38.531 14 Tegalrejo 38,350 39,128 39,726 34,848 35,256 38,561 39,258 42.396
Total 496,625 503,835 510,414 392,239 398,004 435,236 443,111 528,789
Source: Yogyakarta City in Figures, 2000 - 2007

Annex-5
Table Annex 3. 3 Population Density of Regencies/Cities in DIY Province
Width Year Regency/ City Km2 % 2000 2001 2002 2003 2004 2005 2006 2007
Kulonprogo 586.27 18.4 NA NA 631.59 639.9 641.14 NA 638 NA
Bantul 506.85 15.91 1,450 1,461 1,468 1,486 1,491 1,510 1,484 NA
Gunungkidul 1,485.36 46.63 NA NA 453.23 461.57 462.33 NA 460 NA
Sleman 574.82 10.04 1,433 1,454 1,475 1,490 1,510 1,528 1754 NA
Yogyakarta 32.5 1.02 15,281 15,503 15,705 12,069 12,246 13,392 13,634 16,270
DIY Province 1700.44 100 NA NA 1,084.82 1,101.47 1,103.47 NA NA NA
Source: Bantul, Sleman, Yogyakarta in Figures, 2000 – 2007, http://www.pemda-diy.go.id/, and DIY Province in Figures 2007
Table Annex 3. 4 Condition of Primary and Secondary Education in Yogyakarta City, Year 2007
KINDERGARTEN ELEMENTARY JUNIOR HIGH SCHOOL SENIOR HIGH SCHOOL DISTRICT
UNIT STU-DENTS
TEA-CHER
UNIT STU-DENTS
TEA-CHER
UNIT STU-DENTS
TEA-CHER
UNIT STU-DENTS
TEA-CHER
Mantrijeron 18 945 70 13 2215 159 4 1089 94 4 1114 133
Kraton 13 498 49 11 2152 164 2 1019 76 1 43 15
Mergangsan 17 788 65 16 3158 200 6 855 111 3 789 94
Umbulharjo 29 1895 152 25 6117 415 9 2644 227 8 2447 268
Kotagede 17 1016 71 19 3403 225 3 1302 114 3 1139 106
Gondokusuman 24 1267 128 23 8258 436 11 4914 382 9 5306 469
Danurejan 10 354 30 10 2048 141 3 1818 156 - - -
Pakualaman 9 358 35 6 967 73 1 397 32 - - -
Gondomanan 6 646 37 9 2363 132 2 1372 80 4 1589 127
Ngampilan 8 526 35 9 1976 126 2 1056 63 1 250 31
Wirobrajan 16 759 56 13 2791 183 2 1030 76 5 2293 186
Gedongtengen 11 567 36 8 1484 70 3 1464 105 2 64 30
Jetis 15 766 57 19 4520 288 7 2238 201 4 1254 144
Tegalrejo 14 916 77 16 3772 240 3 1154 96 4 2620 200
TOTAL 207 11,301 898 197 45,224 2,852 58 22,352 1,813 48 18,908 1,803
Source: Yogyakarta in Figures, 2007
Table Annex 3. 5 Inflation Rate of Yogyakarta City in 2003-2007
Year Inflation Rate (%)
Yogyakarta DIY Province Indonesia
2003 5.73 5.73 6.60 2004 6.95 6.95 6.06 2005 14.98 14.98 10.40 2006 10.41 NA NA 2007 7.99 NA NA
Source : Yogyakarta City in Figures, 2007, Indonesian Statistic Data, 2008

Annex-6
Table Annex 3. 6 Result of Ambient Air Quality Test in Yogyakarta City for the Period of January - August 2006
Parameter
No. Location CO
µg/m3
Dust
µg/m3
SO2
µg/m3
Pb
µg/m3
1 Malioboro Street 10,390 142.67 5.67 1.50
2 Simpang Gramedia 10,220 226.57 10.927 0.56
3 Batas Kota Laksda Adi Sutjipto
10,292 289.89 21.12 0.52
4 Borobudur Plaza 9,122 149.60 5.40 0.14
5 Kusumanegara Street 10,990 398.14 33.688 0.56
6 Kantor Pos Besar 10,200 278.81 24.03 0.37
7 Simpang Wirobrajan 10,700 172.88 20.308 0.38
8 Jlagran 10,600 203.50 34.96 0.24
9 Simpang Tugu 13,500 266.57 10.92 1.60
10 Simpang Kotagede 11,500 284.75 6.56 0.42
11 C Simanjuntak Street 6,900 119.82 27.97 1.40
Note : Standard Value of Ambient Quality CO : 30.000 µg/m3 Dust : 230 µg/m3 SO2 : 1300 µg/m3 Pb : 2 µg/m3 Source : Environmental Office of Yogyakarta City, 2006

Annex-7
Table Annex 3. 7 Policies and Programmes of Regional Development in Environment Sector and Public Streetlight Programme
INDICATIVE CEILING (million IDR) MISSION POLICY PROGRAMME
2007 2008 2009 2010 2011 Total
Improving development and control on activities that potentially will result in environment pollution.
Improvement of control on environment pollution and destruction
2,500
2,850 3,000 3,550 4,300 16,200
Development of waste management performance
2,700
2,850 3,000 3,250 4,100 15,900 Improving the quality of environment in order to guarantee the ability, prosperity and life quality of the current generation and the next generation.
Development of liquid waste management
2,160
2,280 2,400 3,000 3,250 13,090
Mission 4 Developing Yogyakarta City into a comfortable and environmentally-friendly city
Integrating natural environment and religious, social, cultural and local wisdom value environment into the development process.
Green Space Management 1,700
1,900 2,000 2,500 3,000 11,100
Providing appropriate basic public facilities and infrastructures in inner-city area and urban area in collaboration with the neighbouring region through Joint Secretary of KARTAMANTUL, or private sector.
Improvement/maintenance of irrigation and drainage tunnel
2,217
2,340 2,464 5,710 2,587 15,318
Improving the structure of area in accordance to the Urban Regional Spatial Plan.
Development of details of Regional Spatial Plan and Regional Detail Plan
610
644 678 945 1,000 3,877
Rehabilitation/maintenance of road and bridge
9,615 10,149 10,684 11,752 11,217 53,417
Programme on transportation facilities and infrastructure development
2,837 1,056 837 1,967 1,917 8,614
Programme on Road Traffic Facilities and Infrastructures rehabilitation and maintenance
303 439 439 750 440 2,371
Mission 8 Realizing the development of quality facilities and infrastructures
Improving quality of and accessibility to public facilities and infrastructures.
Programme on traffic management improvement
781 564 570 750 422 3,087

Annex-8
Table Annex 3. 7 Continued
INDICATIVE CEILING (million Rupiah) MISSION POLICY PROGRAMME
2007 2008 2009 2010 2011 Total
Improving the function of kampong as the subject of regional-based development and as a place for community interaction in terms of social, cultural, economy and environmental aspect
Management of basic settlement facilities and infrastructures, Maintenance and development of housing and settlement
2,349 2,479 2,610 3,190 3,740 14,368
Improvement/ maintenance of public streetlight
7,246
7,649 8,052 8,157 8,454 39,558
Programme on transportation service improvement
718 1,053 1,053 1,303 1,473 5,600
Improving partnership with community and private sectors in developing basic settlement and urban facilities and infrastructures.
Programme on Improvement of Alertness toward Natural Disaster Tackling
500 986 659 675 700 3,520
Source: Regulation of Yogyakarta Mayor No. 17 of 2007 regarding Yogyakarta City RPJMD

Annex-9
Table Annex 3. 8 Revenues of City Government of Yogyakarta (IDR)
DESCRIPTION 2001 2002 2003 2004 2005 2006 2007
I REGIONAL ORIGINAL REVENUES
1 Regional Tax Revenue NA NA 33,526,514,267 40,581,980,256 46,106,723,374 43,997,150,025 54,783,202,892
2 Regional Retribution Revenue NA NA 6,093,220,398 18,995,046,383 22,797,438,571 24,704,781,396 29,197,466,013
3 Regional Profit-Share Revenue NA NA 4,081,649,388 5,285,786,650 6,651,534,800 7,722,505,202 8,783,239,359
4 Other Regional Original Revenues NA NA 14,920,180,256 15,048,605,811 13,640,720,038 19,995,019,680 21,334,442,677
Total Original Revenue NA NA 68,621,564,311 79,911,419,100 89,196,416,784 96,419,456,304 114,098,350,942
II BALANCING FUND
1 Tax and Non-Tax Sharing NA NA 32,300,731,328 37,889,440,614 37,894,010,508 40,145,140,985 47,329,224,538
2 General Allocation Fund NA NA 196,100,000,000 197,787,000,000 201,231,000,000 316,832,000,000 365,042,000,000
3 Special Allocation Fund NA NA 4,200,000,000 5,500,000,000 6,600,000,000 4,800,000,000 26,788,000,000
4 Tax and Grant Sharing from Provincial Government
NA NA 20,912,000,015 28,791,189,586 43,532,610,253 35,373,712,961
Total Balancing Fund NA NA 253,512,731,343 269,967,630,200 289,257,620,761 397,150,853,946 439,159,224,538
III OTHER LEGITIMATE REVENUES
1 Contingency Grant/Balancing from the Government
NA NANA 6,471,829,733 - - 15,604,974,000
2 Ad Hock Adjustment Fund NA NA NA 13,299,000,000 11,943,000,000 15,000,000,000 2,917,756,400
3 Grant NA NA NA - - 10,451,927,071 6,288,730,100
4 Fund of Tax Sharing from Provincial and other Regional Government
NA NA NA - - - 37,579,816,500
5 Emergency Fund NA NA NA - - - -
Total Other Legitimate Revenues
NA NA16,496,466,000 19,770,829,733 13,432,864,500 25,451,927,071 62,391,277,000
TOTAL REVENUE 243,769,299,493 303,020,070,537 338.630.761.654 369,649,879,034 391,886,902,046 519,022,237,321 615,648,852,480
Source: Report of Regional Revenue and Expenditure Plan Implementation, BAPPEDA of Yogyakarta City, 2008

Annex-10
Table Annex 3. 9 Expenditure of City Government of Yogyakarta (IDR)
DESCRIPTION 2001 2002 2003 2004 2005 2006 2007
I REGIONAL APPARATUS EXPENDITURE
1 General Administration Expenditure NA NA 19,447,043,068 29,273,749,713 28,980,600,331 36,737,618,808 NA
2 Operational and Maintenance Expenditure NA NA 16,480,358,307 18,633,614, 20,844,064,912 17,833,888,429 NA
3 Capital/Developmental Expenditure NA NA 17,023,110,756 10,444,241,517 14,566,259,826 3,294,805,480 NA
Total Regional Apparatus Expenditure NA NA 52,950,512,131 58,351,605,850 64,390,925,069 57,866,312,717 NA
II PUBLIC SERVICE EXPENDITURE
1 General Administration Expenditure NA NA 166,942,266,025 188,939,446,086 188,968,325,856 238,144,704,482 NA
2 Operational and Maintenance Expenditure NA NA 26,813,257,737 36,817,724,255 43,301,882,300 55,504,444,118 NA
3 Capital/Developmental Expenditure NA NA 41,117,455,909 50,260,339,372 55,621,387,991 76,107,251,594 NA
4 Profit Share and Financial Grant Expenditure NA NA 17,172,995,474 30,974,792,481 45,118,547,802 59,411,518,162 NA
5 Incidental Expenditure NA NA 354,545,150 4,996,667,725 1,843,536,350 9,734,745,979 NA
Total Public Service Expenditure NA NA 252,400,520,295 311,988,969,919 334,853,680,300 438,902,664,335 NA
TOTAL EXPENDITURE 243,769,299,493 303,020,070,537 305,351,032,427 370,340,575,770 399,244,605,370 496,768,977,052 483,453,112,088
Source: Report of Regional Revenue and Expenditure Plan Implementation, BAPPEDA of Yogyakarta City, 2008

Annex-11
Table Annex 3. 10 Financing of City Government of Yogyakarta (IDR)
DESCRIPTION 2001 2002 2003 2004 2005 2006 2007
I FINANCING REVENUE
1 Residual Surplus of Previous Year Budget Calculation
- - 57,456,145,471 77,137,955,980 73,659,073,376 76,983,970,898 90,610,460,325
2 Transfer to Reserved Fund - - - 18,500,000,000 19,036,041,445 - -
3 Load and Obligation Revenue - - - - - - -
4 Earnings from Separated Regional Asset Sale
- - - - - - -
5 Grant - - 10,769,529,417 - - - -
Total Financing Revenue - - 68,225,674,888 95,637,955,980 92,695,114,821 76,983,970,898 90,610,460,325
II FINANCING EXPENDITURE
1 Transfer to Reserved Fund - - 5,530,465,622 11,267,142,598 - - - 2 Capital Participation - - 17,836,550,642 8,489,379,793 6,446,041,672 2,245,004,321 -
3 Payment of Short-term Debt - - 1,000,431,870 2,568,468,483 1,032,398,926 5,083,766,520 958,824,221
4 Residual Surplus of Budget Calculation
- - 77,137,955,980 72,622,268,370 76,983,970,898 90,610,460,325 -
5 Credit for Region - - - - 875,000,000 1,298,000,000 1,412,000,000
Total Financing Expenditure - - 101,505,404,115 94,947,259,245 85,337,411,497 96,992,226,845 2,370,824,221
TOTAL FINANCING - - (33,279,729,226) 690,696,735 7,357,703,324 (20,008,255,947) 88,239,636,104
Source: Report of Regional Revenue and Expenditure Plan Implementation, BAPPEDA of Yogyakarta City, 2008

Annex-12
Table Annex 3. 11 Public Sector Financing Sector Based (IDR)
2001 2002 2003 2004 2005 2006 2007 Sector
Nominal % Nominal % Nominal % Nominal % Nominal % Nominal % Nominal % Government Public Administration
NA NA NA NA 80,459,489,053 26% 99,001,680,520 27% 102,075,282,643 26% 166,195,220,469 33% 186,615,707,898 33%
Agriculture NA NA NA NA 2,187,291,332 1% 2,482,865,538 1% 3,835,197,420 1% 3,085,233,914 1% 7,595,291,865 1%
Industry and Commerce
NA NA NA NA 10,185,489,032 3% 10,737,129,547 3% 11,938,736,836 3% 11,902,912,801 2% 15,942,909,352 3%
Manpower NA NA NA NA 1,772,515,076 1% 2,064,474,431 1% 2,180,813,399 1% 2,909,564,664 1% 3,137,077,667 1%
Health NA NA NA NA 17,167,113,626 6% 28,596,327,796 8% 33,449,200,916 8% 40,038,690,934 8% 48,532,382,954 9%
Education and Culture
NA NA NA NA 112,221,684,579 37% 130,147,568,785 35% 131,475,751,735 33% 141,937,967,797 29% 176,274,696,442 31%
Social NA NA NA NA 3,630,156,188 1% 5,469,416,429 1% 7,165,381,036 2% 5,277,658,678 1% 4,734,965,379 1%
Settlement NA NA NA NA 1,669,984,302 1% 1,691,616,701 0% 1,813,538,404 0% 2,506,437,563 1% 6,418,223,717 1%
Public Works NA NA NA NA 49,294,972,427 16% 49,863,540,602 13% 61,832,427,995 15% 91,671,107,959 18% 36,480,898,629 6%
Transportation NA NA NA NA 4,070,491,823 1% 8,644,456,031 2% 6,471,289,737 2% 5,178,623,142 1% 16,557,734,035 3%
Environment 12,769,217,488 4% 16,059,024,650 4% 19,608,126,760 5% 18,614,461,442 4% 22,280,994,286 4%
Demography NA NA NA NA 1,950,223,678 1% 4,033,754,435 1% 4,213,402,115 1% 4,113,365,196 1% 4,714,575,851 1%
Sports NA NA NA NA 4,333,081,580 1% 6,966,539,756 2% 8,864,641,822 2% 981,529,841 0% 952,782,976 0%
Tourism NA NA NA NA 3,562,504,176 1% 4,501,336,239 1% 4,145,441,038 1% 2,231,924,502 0% 3,044,346,744 1%
Land NA NA NA NA 76,818,068 0% 80,844,310 0% 175,353,515 0% 124,278,150 0% -
Local Gov Business NA NA NA NA - - - - - - - - 28,965,129,428 5%
Loan/Debt and Interest instalment
NA NA NA NA - - - - - - - - -
Expenditure excluded from other sector
NA NA NA NA - - - - - - - - 6,872,655,335 1%
Contingency expenditure
NA NA NA NA - - - - - - - - -
Subsidy and Grant Reward
NA NA NA NA - - - - - - - - -
Nation Integrity and Domestic Politics
NA NA NA NA - - - - - - - - -
Total 243,769,299,494 100% 303,020,070,538 100% 305,351,032,427 100% 370,340,575,770 100% 399,244,585,370 496,768,977,052 100% 569,120,372,558 100%
Source: Report of Regional Revenue and Expenditure Plan Implementation, BAPPEDA of Yogyakarta City, 2008

Annex-13
Annex 4 Tables and Figures of Denpasar City
Table Annex 4. 1 Area Distribution of Denpasar City
Number of No District Width (km2)
Village Banjar
Village Official Tradition Official Tradition
1 West Denpasar 49.99 3 11 2 112 106 2 North Denpasar 22.54 3 11 10 98 99 3 East Denpasar 24.13 4 11 12 85 97 4 South Denpasar 31.12 6 10 11 104 84
TOTAL 127.78 16 43 35 399 386 Source: Denpasar City in Figures, 2007
Table Annex 4. 2 Number of Population of Denpasar City
Year No. District
2000 2001 2002 2003 2004 2005 2006
1 South Denpasar 149,653 156,896 161,111 167,802 161,424 163,138 167,358
2 East Denpasar 140,549 147,603 149,042 155,233 149,332 153,212 110,272
3 West Denpasar 232,179 261,136 251,661 262,113 252,151 258,605 168,580
4 North Denpasar - - - - - - 137,390
Number/Total 522,381 565,635 561,814 585,148 562,907 574,955 583,600
Source: Denpasar City in Figures, 2000 - 2006, processed data
Table Annex 4. 3 Population Density of Regencies/Cities in Bali Province
Width Year Regency/
City Km2 % 2000 2001 2002 2003 2004 2005 2006
Jembrana 841.80 14.94 256 257 259 261 263 267 299
Tabanan 839.33 14.90 456 461 466 469 474 483 489
Badung 418.52 7.43 760 782 817 839 856 895 886
Denpasar 123.98 2.20 3,218 3,378 3,450 2,516 3,599 3,742 3,697
Gianyar 368.00 6.53 999 1,008 1,014 1,021 1,030 1,042 1,052
Klungkung 315.00 5.59 524 526 529 533 540 542 548
Bangli 520.81 9.25 381 382 383 402 403 405 407
Karangasem 839.54 14.90 440 451 458 463 464 471 482
Buleleng 1,365.88 24.25 426 428 431 437 445 453 471
Bali Province 5,632.86 100 532 541 549 557 565 537 579
Source: Denpasar City in Figures, 2003 - 2007

Annex-14
Table Annex 4. 4 Condition of Primary and Secondary Education in Denpasar City, 2006
KINDERGARTEN ELEMENTARY
SCHOOL JUNIOR HIGH SCHOOL SENIOR HIGH
SCHOOL DISTRICT
UNIT
STU DENTS
TEA CHER
UNIT
STU DENTS
TEA CHER UNIT
STU DENTS
TEA CHER
UNIT
STU DENTS
TEA CHER
South Denpasar 38 1,028 94 53 18,179 655 10 5,444 381 13 7,561 530
East Denpasar 45 839 250 47 15,259 677 16 7,923 543 23 13,752 1,007
West Denpasar 59 1,485 379 54 24,360 922 18 13,160 810 10 7,625 338
North Denpasar 53 867 317 53 16,003 781 - - - - - -
TOTAL 195 4,219 1,040 207 73,801 3,035 44 26,527 1,734 46 28,938 195
Source: Denpasar City in Figures, 2006, processed data
Table Annex 4. 5 Inflation Rate of Denpasar City in 2002-2006
Year Inflation rate (%)
Denpasar Bali Province Indonesia
2002 12.49 12.49 NA
2003 4.56 4.56 6.60
2004 5.97 5.97 6.06
2005 11.31 11.31 10.40
2006 4.30 NA NA
Source: Denpasar City in Figures, 2007
Table Annex 4. 6 Result of Ambient Air Quality Test in Denpasar City in 2006
Parameter
No. Location Dust
µg/m3
Pb
µg/m3
CO
µg/m3
SO2
µg/m3
NO2
µg/m3
O3
µg/m3
1 Gunung Agung Street (In front of West Denpasar District Office)
687,700 0.472 432,400 153,773 41,395 25,690
2 Gajah Mada Street (In front of Denpasar Mayor Office)
323,625 0.566 432,432 110,221 25,641 16,345
3 Jempiring Street (In front of City Environment Office)
121,359 0.660 384,384 104,138 29,821 19,675
4 Supratman Street (In front of East Denpasar District Office)
323,625 0.114 624,625 122,490 32,407 14,708
5 Sudirman Street (SMAN 2 Denpasar)
525,890 0.692 480,480 122,490 26,447 31,048
6 Melati Street (In front of GOR Ngurah Rai)
289,885 0.843 1280 18,730 67,036 -
7 A Yani Street 185,360 0.157 746,660 56,570 37,950 -
8 Imam Bonjol Street 180,180 0.254 480,000 53,670 25,710 -
Source: Denpasar City Environment Office, 2006
Note: Standard Value of Ambient Quality CO : 30,000 µg/m3 Dust : 230 µg/m3 SO2 : 1300 µg/m3 Pb : 2 µg/m3

Annex-15
Table Annex 4. 7 Revenues of City Government of Denpasar (IDR)
DESCRIPTION 2001 2002 2003 2004 2005 2006 2007
I REGIONAL ORIINAL REVENUE
1 Regional Tax Revenue 50,880,000,000 61,800,000,000 53,850,000,000 56,380,000,000 59,880,000,000 69,770,000,000 71,450,000,000
2 Regional Retribution Revenue 10,345,820,000 22,088,351,011 21,171,000,000 26,398,945,000 23,552,905,996 31,729,805,000 37,535,955,000
3 Regional Profit-Share Revenue 600,000,000 3,284,037,799.49 3,360,381,855 3,279,000,000 3,609,716,000 4,138,193,000 4,640,659,423
4 Other Regional Original Revenues 757,465,000 3,865,475,000 4,221,324,800 7,294,200,000 2,884,450,000 4,792,330,000 6,089,338,079
Total Original Revenue 62,583,285,000 91,037,863,810 82,602,706,655 93,352,145,000 89,927,071,996 110,430,328,000 119,715,952,502
II BALANCING FUND
1 Tax and Non-Tax Sharing 12,184,000,000 21,819,064,958
28,534,000,000 30,500,000,000 34,100,000,000 39,600,000,000 51,068,805,631
2 General allocation Fund 147,137,600,000 166,770,000,000 176,987,000,000 176,990,000,000 187,085,000,000 283,845,000,000 331,448,000,000
3 Special Allocation Fund - - - - 7,420,000,000 18,850,000,000 7,935,000,000
4 Tax and Grant Sharing from Provincial Government
- - - 17,184,040,000 26,781,994,000 32,090,720,000 -
Total Balancing Fund 62,583,285,000 188,589,064,958 205,521,000,000 224,674,040,000 255,386,994,000 374,385,720,000 390,451,805,631
III OTHER LEGITIMATE REVENUES
1 Contingency Grant/Balancing from the Government
74,167,841,693.33 33,393,604,180 23,693,934,350 16,731,000,000 10,170,000,000 2,143,000,000 1,754,840,000
2 Ad Hoc Adjustment Fund 0 0 0 0 0 0 0
3 Grant 0 0 0 0 0 0 0
4 Fund of Tax Sharing from Provincial and other regional Government
952,998,666.67 12,463,197,000 11,403,634,000 0 0 0 36,731,184,000
5 Emergency Fund 0 0 0 0 0 0 0
Total Other Legitimate Revenues
75,120,840,360 45,856,801,180 35,097,568,350 16,731,000,000 10,170,000,000 2,143,000,000 39,356,154,000
TOTAL REVENUES 200,287,410,360 325,483,729,948 323,221,275,005 334,757,185,000 355,484,065,996 486,959,048,000 549,523,912,133
Source: Denpasar City BAPPEDA, 2008

Annex-16
Table Annex 4. 8 Expenditure of City Government of Denpasar (IDR)
DESCRIPTION 2001 2002 2003 2004 2005 2006 2007
I REGIONAL APPARATUS EXPENDITURE
1 General administration Expenditure NA NA NA 202,125,007,100 216,855,415,746 267,283,383,350 NA
2 Operational and Maintenance Expenditure NA NA NA 18,972,280,650 19,143,388,810 21,222,926,650 NA
3 Capital /Developmental Expenditure NA NA NA 1,928,528,500 2,184,861,800 10,738,409,400 NA
Total Regional Apparatus Expenditure NA NA NA 223,025,816,250 238,183,666,356 299,244,719,400 NA
II PUBLIS SERVICE EXPENDITURE
1 General administration Expenditure
NA NA NA 19,506,514,500 13,460,840,000 13,126,978,000 NA 2
Operational and Maintenance Expenditure
NA NA NA 48,967,839,645 55,263,028,705 106,292,918,320 NA 3
Capital /Developmental Expenditure
NA NA NA 15,378,646,450 9,244,276,720 38,464,316,610 NA 4
Profit Share and Financial Grant Expenditure
NA NA NA 31,206,144,000 38,074,085,060 39,357,807,070 NA 5 Incidental Expenditure NA NA NA 2,500,000,000 2,500,000,000 1,500,000,000 NA
Total Public Service Expenditure
NA NA NA 117,559,144,595 118,542,230,485 198,742,020,000 NA TOTAL EXPENDITURE 200,287,410,360 325,483,729,948 323,221,275,005 340,584,960,845 356,725,896,841 497,986,739,400 554,160,700,933
Source: Denpasar City BAPPEDA, 2008

Annex-17
Table Annex 4. 9 Financing of City Government of Denpasar (IDR)
DESCRIPTION 2001 2002 2003 2004 2005 2006 2007
I FINANCING REVENUE
1 Residual Surplus of Previous Year Budget Calculation - - - 6,797,775,845 1,241,830,845 11,027,691,400 6,636,788,800
2 Transfer to Reserved Fund - - - - - - -
3 Loan and Obligation Revenue - - - - - - -
4 Earnings from Separated Regional Asset Sale
- - - - - - -
5 Grant - - - - - - -
Total Financing Revenue - - - 6,797,775,845 1,241,830,845 11,027,691,400 6,636,788,800
II FINANCING EXPENDITURE
1 Transfer to Reserved Fund - - - - - - -
2 Capital Participation - - - 970,000,000 - - 2,000,000,000
3 Payment of Short-term Debt - - - - - - -
4 Residual Surplus of Budget Calculation - - - - - - -
5 Credit for Region - - - - - - -
Total Financing Expenditure - - - 970,000,000 - - -
TOTAL FINANCING - - - 5,827,775,845 1,241,830,845 11,027,691,400 4,636,788,800
Source: Denpasar City BAPPEDA, 2008

Annex-18
Table Annex 4. 10 Public Sector Financing by Sectors of Denpasar City (IDR)
2004 2005 2006 2007 Sector
Nominal % Nominal % Nominal % Nominal % Governmental Public Administration
125,467,726,650 37% 131,895,242,747 38% 147,033,051,077 30% 111,851,372,720 22%
Agriculture 4,685,375,050 1% 5,447,251,787 2% 10,685,458,500 2% 11,178,884,812 2%
Industry and Commerce
1,472,120,200 0% 1,603,926,250 0% 2,770,811,300 1% 3,238,768,092 1%
Cooperation 1,397,235,000 0% 1,181,122,000 0% 1,530,439,400 0% 2,511,486,117 0%
Manpower 706,722,500 0% 778,729,000 0% 1,062,034,000 0% 1,218,606,416 0%
Health 32,756,417,500 10% 36,406,915,680 11% 57,759,002,693 12% 67,346,185,242 13%
Education and Culture
124,442,602,700 37% 125,039,933,460 36% 165,463,300,000 33% 186,671,514,703 37%
Social 1,730,383,000 1% 1,443,697,000 0% 2,217,330,700 0% 2,443,661,045 0%
Settlement 2,961,949,000 1% 2,581,238,000 1% 4,192,797,300 1% 4,373,610,178 1%
Public Works 11,290,391,845 3% 2,581,238,000 1% 44,954,025,880 9% 41,680,445,926 8%
Transportation 8,265,239,500 2% 6,820,406,736 2% 15,780,492,150 3% 22,371,463,304 4%
Environment 20,505,640,400 6% 22,244,741,525 6% 35,331,931,900 7% 42,864,529,761 8%
Demography 2,910,767,000 1% 3,097,994,600 1% 6,520,627,200 1% 3,992,154,404 1%
Tourism 1,992,390,500 1% 2,047,025,000 1% 2,685,437,300 1% 3,733,560,485 1%
Total 340,584,960,845 100% 356,725,896,841 100% 497,986,739,400 100% 505,476,243,205 100%
Source: BAPPEDA of Denpasar City, 2008

Annex-19
Annex 5 Tables and Figures of Surabaya City
Table Annex 5. 1 Area Distribution of Surabaya City
Number of
No District
Width (km2) Village Neighbourhood
Sub Vilage
Central Surabaya
1 Tegalsari 4.29 5 338 52
2 Genteng 4.04 5 318 64
3 Bubutan 3.86 5 418 53
4 Simokerto 2.59 5 368 61 North Surabaya
5 Pabean Cantian 6.8 5 322 52
6 Semampir 8.76 5 567 72
7 Krembangan 8.34 5 400 37
8 Kenjeran 14.42 4 350 33
9 Bulak - 5 110 22 East Surabaya
10 Tambak Sari 8.99 6 626 74
11 Gubeng 7.99 6 518 63
12 Rungkut 21.08 6 355 67
13 Tenggilis Mejoyo 5.52 5 154 25
14 Gunung Anyar 9.71 4 156 29
15 Sukolilo 23.69 7 344 65
16 Mulyorejo 14.21 6 272 54 South Surabaya
17 Sawahan 6.93 6 554 71
18 Wonokromo 8.47 6 513 58
19 Karangpilang 9.23 4 181 29
20 Dukuh Pakis 9.94 4 153 30
21 Wiyung 12.46 4 144 30
22 Wonocolo 6.78 5 223 41
23 Gayungan 6.07 4 165 33
24 Jambangan 4.19 4 116 24 West Surabaya
25 Tandes 11.07 12 305 51
26 Sukomanunggal 9.23 5 262 24
27 Asemrowo 15.44 5 110 17
28 Benowo 45.79 5 122 22 29 Lakarsantri 36.48 6 150 30
30 Pakal - 5 155 30 31 Sambikerep - 4 203 37
TOTAL 326.37 163
Source: Surabaya in Figures 2006

Annex-20
Table Annex 5. 2 Number of Population of Surabaya City
Year Population
2000 2,618,930
2001 2,633,070
2002 2,647,280
2003 2,660,381
2004 2,681,092
2005 2,698,972
2006 2,716,971
2007 2,861,928
Source: Surabaya in Figures 2000 - 2007
Table Annex 5. 3 Condition of Primary and Secondary Education in Surabaya City, 2006
UNIT STU
DENTS TEA CHER
SENIOR HIGH SCHOOL DISTRICT
UNIT STU
DENTS TEA
CHER UNIT
STU DENTS
TEA CHER
UNIT STU
DENTS TEA
CHER UNIT
STU DENTS
TEA CHER
Central of Surabaya Tegalsari 50 3,384 181 54 12,564 496 13 4,656 265 2 2,429 125 Genteng 41 1,991 131 38 7,894 339 14 6,485 445 18 11,003 766 Bubutan 53 2,217 138 50 10,210 490 14 2,540 261 5 831 91 Simokerto 47 1,810 91 36 7,542 363 8 2,109 183 4 1,202 94 North Surabaya Pabean Cantian 25 1,396 53 25 5,341 237 7 3,266 225 3 1,955 133 Semampir 60 3,487 162 78 17,985 821 17 2,891 319 5 2,421 148 Krembangan 43 2,703 120 54 14,852 557 19 7,842 541 10 5,764 93 Kenjeran 49 3,071 117 35 12,941 426 10 7,336 368 3 1,490 84 East Surabaya Tambak Sari 97 5,679 245 72 19,530 687 21 7,496 745 10 3,302 288 Gubeng 76 4,244 336 56 14,702 586 16 5,233 478 13 4,769 378 Rungkut 47 3,082 209 23 5,687 310 8 4,225 363 4 1,793 148 Tenggilis Mejoyo 30 2,225 142 20 7,541 229 6 2,021 137 2 1,709 129 Gunung Anyar 21 1,454 84 14 6,341 184 6 690 80 0 0 0 Sukolilo 44 2,861 169 31 8,602 306 10 4,968 342 8 5,142 199 Mulyorejo 39 2,367 218 28 6,945 247 12 3,495 283 4 2,749 200 South Surabaya Sawahan 88 4,352 232 78 19,536 693 16 4,019 301 10 4,557 290 Wonokromo 76 4,064 217 60 13,622 631 18 8,141 580 8 4,501 281 Karangpilang 35 2,419 161 23 7,521 306 8 1,070 243 3 517 54 Dukuh Pakis 38 2,212 140 27 6,742 253 11 2,712 193 4 1,761 117 Wiyung 31 2,036 142 19 5,364 180 3 1,216 81 2 826 57 Wonocolo 27 2,330 111 27 8,524 336 9 3,139 239 6 2,406 199 Gayungan 26 1,365 86 14 5,980 157 4 2,037 109 2 2,447 184 Jambangan 12 1,047 39 16 6,321 169 7 3,156 284 5 1,323 146 West Surabaya Tandes 43 2,390 135 47 10,897 510 10 2,609 240 6 1,424 175 Sukomanunggal 42 3,297 176 39 9,654 332 12 5,324 555 6 2,201 166 Asemrowo 15 705 33 16 4,724 206 4 609 62 0 0 0 Benowo 22 1,106 59 17 4,824 237 1 37 13 2 890 36 Lakarsantri 23 1,406 79 18 8,325 203 8 2,848 294 5 1,289 84 Pakal 23 806 74 27 5,867 301 4 2,881 185 3 516 68 Sambikerep 16 736 57 16 4,638 164 7 1,996 170 3 534 85
TOTAL 1250 73,011 4,173 1,076 287,239 11,185 307 108,752 8,716 158 72,855 4,904 Source : Surabaya City in Fifures, 2006

Annex-21
Table Annex 5. 4 Inflation Rate of Surabaya City 2002-2006
Year Inflation rate (%)
Surabaya East Java Indonesia
2002 9.3 NA NA
2003 7.68 3.6 6.60
2004 6.96 4.6 6.06
2005 14.12 5.8 10.40
2006 6.71 5.8 NA
Source :Surabaya City in Figures, 2006 and Bappeko Surabaya (2005), quoted from Study of Surabaya City GDP Formulation, 2004
Table Annex 5. 5 Location of Air Pollutant Monitoring Stations in Surabaya City
Station Monitoring Location Area Area of SUF 1 Prestasi Park Yard, Ketabang
Kali Street Centre Surabaya Downtown, settlement, offices
SUF 2 Perak Timur Village Office Yard, Jl. Selangor
North Surabaya
Offices, industrial area nearby, warehousing
SUF 3 Assistant Mayor Office Yard of West Surabaya, Sukomanunggal Street
West Surabaya
Setllement, sub-urban area
SUF 4 Gayungan District Yard, Gayungan Street
South Surabaya Settlement – near Suarabaya – Gempol Tollroad
SUF 5 Convention Hall Yard, Arif Rahman Hakim Street
East Surabaya Setllement, Campus, Offices
Source: LSAP UAQi, Technical Cooperation Project Between Indonesia – Asian Development Bank (ADB), 2006
Source: LSAP UAQi, TECHNICAL COOPERATION PROJECT BETWEEN INDONESIA – ASIAN DEVELOPMENT BANK (ADB), 2006
Figure Annex 5. 1 The Average Daily Concentration of NO2 in several Monitoring Locations in Surabaya City, 2001-2005

Annex-22
Source: LSAP UAQi, Technical Cooperation Project between Indonesia – Asian Development Bank (ADB), 2006
Figure Annex 5. 2 The Average Daily Concentration of PM10 in Monitoring location of Surabaya City, 2001-2005

Annex-23
Table Annex 5. 6 Revenues of City Government of Surabaya (IDR)
DESCRIPTION 2001 2002 2003 2004 2005* 2006 2007 2008
I REGIONAL ORIGINAL REVENUES
1 Regional Tax Revenue 116,042,920,000 151,482,940,000 200,141,170,000 237,206,400,000 260,671,200,000 305,405,046,483 340,833,935,422 370,425,732,979
2 Regional Retribution
Revenue 76,056,670,000 96,580,000,000 115,900,030,000 135,137,940,000 146,492,020,000 166,977,821,383 176,785,881,531 188,445,303,626
3 Regional Profit-Share
Revenue 6,022,090,000 11,392,400,000 12,619,240,000 14,253,960,000 33,081,260,000
21,479,455,260 38,385,988,072 39,433,930,448
4 Other Regional
Original Revenues 9,871,650,000 18,407,830,000 19,649,570,000 30,778,720,000 28,811,660,000
44,507,612,555 52,289,781,666 43,494,980,014
Total Original Revenue 207,993,330,000 277,863,170,000 348,310,010,000 417,377,020,000 469,056,140,000
538,369,935,681 608,295,586,691
641,799,947,067
II BALANCING FUND
1 Tax and Non-Tax
Sharing 178,949,820,000 207,277,980,000 282,324,950,000 351,162,060,000 321,267,090,000 432,387,358,243 527,146,589,791 449,212,395,797
2 General Allocation
Fund 331,374,600,000 334,343,350,000 331,570,000,000 342,168,000,000 359,520,000,000 453,753,000,000 639,590,000,000 713,590,300,000
3 Special Allocation
Fund - - - - - 9,550,000,000 7,408,900,000
8,075,000,000
4 Tax and Grant Sharing
from Provincial Government
46,081,890,000 100,706,310,000 151,280,350,000 184,102,530,000 169,889,310,000
Total Balancing Fund 556,406,310,000 642,327,640,000 765,175,300,000 877,432,590,000 850,676,400,000 895,690,358,243 1,174,145,489,791 1,170,877,695,797
III OTHER LEGITIMATE REVENUES
1 Contingency
Grant/Balancing from the Government
77,850,000 75,000,000 37,490,790,000 35,541,140,000 41,690,410,000
2 Ad Hock Adjustment
Fund - - - - - - 6,679,368,800
3 Grant - - - - - - -
4 Fund of Tax Sharing from Provincial and other Regional Government
- - - - - 278,157,214,465 240,436,422,287 244,321,460,651
5 Emergency Fund - - - - - - -
Total Other Legitimate Revenues
77,850,000 75,000,000 37,490,790,000 35,541,140,000 41,690,410,000 278,157,214,465 247,115,791,087 244,321,460,651
TOTAL REVENUE 764,477,490,000 920,265,810,000 1,150,976,100,000 1,330,350,750,000 1,361,422,950,000 1,712,217,508,389 2,029,556,867,569 2,056,999,103,515
Notes : *Local Budget of Revenue and Revenue/APBD after Budget Amendment Source: The Budget Year of 2001-2005 Document on Local Budget of Revenue and Expenditure Calculation taken from 2006-2010 Surabaya City Medium Term Development Planning and Bappeko Surabaya

Annex-24
Table Annex 5. 7 The Expenditure of Surabaya City Government (IDR)
Description 2001 2002 2003 2004 2005* 2006** 2007** 2008
I REGIONAL APPARATUS EXPENDITURE
1 General Administration Expenditure
NA NA NA 65,832,490,000 99,505,090,000 181,975,857,392 180,072,430,727 226,984,615,446
2 Operational and Maintenance Expenditure
NA NA NA 66,630,790,000 90,217,950,000 11,807,618,903 8,381,589,344 12,490,754,000
3 Capital/Developmental Expenditure
NA NA NA 19,591,340,000 27,764,900,000 32,879,045,200 30,640,610,795 44,504,395,205
Total Regional Apparatus Expenditure
NA NA NA 152,054,620,000 217,487,940,000 226,662,521,495 219,094,630,866 283,979,764,651
II PUBLIC SERVICE EXPENDITURE
1 General Administration Expenditure
NA NA NA 419,875,230,000 486,951,950,000 414,089,483,270 563,852,749,321 790,002,072,622
2 Operational and Maintenance Expenditure
NA NA NA 383,776,700,000 666,728,340,000 599,183,627,378 520,568,899,331 905,337,904,629
3 Capital/Developmental Expenditure
NA NA NA 157,915,490,000 252,850,010,000 143,867,225,157 248,491,110,956 1,014,214,966,836
4 Profit Share and Financial Grant Expenditure
NA NA NA 48,801,490,000 37,496,760,000 1,570,161,540 1,333,620,429 1,800,000,000
5 Incidental Expenditure NA NA NA 3,505,790,000 24,856,490,000 967,947,620 3,131,079,266 30,025,502,165
Total Public Service Expenditure
NA NA NA 1,013,874,700,000 1,468,883,550,000 1,159,678,444,965 1,337,377,459,303 2,741,380,446,252
TOTAL EXPENDITURE NA NA NA 1,165,929,320,000 1,686,371,490,000 1,386,340,966,460 1,556,472,090,169 3,025,360,210,903
Note: * Local Budget of Revenue and Revenue/APBD after Budget Amendment ** Projection Source: The Budget Year of 2001-2005 Document on Local Budget of Revenue and Expenditure Calculation taken from 2006-2010 Surabaya City Medium Term Development Planning

Annex-25
Table Annex 5. 8 Financing of City Government of Surabaya (IDR)
DESCRIPTION 2006 2007 2008
I FINANCING REVENUE
1 Residual Surplus of Previous Year Budget Calculation
525,402,078,095
836,530,514,333
983,267,856,388
2 Transfer to Reserved Fund - - -
3 Loan and Obligation Revenue -
1,631,200,000 -
4 Earnings from Separated Regional Asset Sale
-
-
-
5 Grant
-
-
- Total Financing Revenue 525,402,078,095 838,161,714,333 983,267,856,388
II FINANCING EXPENDITURE 1 Transfer to Reserved Fund - -
2 Capital Participation 3,170,677,903 3,945,504,104 3,946,000,000
3 Payment of Short-term Debt
11,520,818,052
11,496,214,730
10,960,749,000
4 Residual Surplus of Budget Calculation
5 Credit for Region - 5,100,000,000 -
Total Financing Expenditure 14,691,495,955 20,541,718,834 14,906,749,000
TOTAL FINANCING 510,710,582,140 817,619,995,499 968,361,107,388
Source: Surabaya City Planning Office, 2008

Annex-26
Annex 6 Questionnaires and Summary of Results Interviewees: The Cities Government Agencies and the Cities Representatives Council
No. Questions Yogyakarta Surabaya Denpasar
1 Do you know about ICLEI? Yes, ICLEI often initiate program related to environment issues. For a program in Yogyakarta City, ICLEI focusses on the decreasing of air pollution and energy saving. ICLEI program is in line with Streetlights Management Scheme and Kampong Street Light Management Program by installing kWh meter and changing lamps type.
Yes. No, never heard of it.
2 How do you know it? The information is acquired from City Infrastructure Office, the ICLEI workshop in Jakarta around 2000-2001, the visit of ICLEI delegation from Manila. ICLEI is an agency that concerned with the environment and climate change issues, therefore it should be supported.
Knowing ICLEI program from Mr. Litfi Lesilono (Indonesia Project Coordinator of INDO CCP ICLEI) when he was visiting Surabaya city. The Mayor wwas very supportive with the program. Then, the city government staffs had been invited to meetings and seminars held by ICLEI ever since.
-
3 What are the benefits that the government staff acquired from the cooperation with ICLEI?
The most important thing is inspiring City Government of Yogyakarta in formulating its programs. Those programs are: trees planting on road sides; the government policy on saving of AC and electricity in buildings; budget saving on the streetlights management scheme. Beside that, giving motivation to the community to jointly participate in climate change protection through decreasing the GHG
Its benefit is the opportunity to involve in reducing green house emission, protecting climate; cost saving for city, business, and city residents; improving the city’s air quality
-

Annex-27
No. Questions Yogyakarta Surabaya Denpasar
5 Please provide input and suggestion concerning future ICLEI cooperation.
More involvement from the stakeholders, meaning that, ICLEI is more involved on the programs dissemination to the community, not only expands the programs to other cities. In creating an environment is not only relying on city government facilities, but also the involvement of the community. Moreover, the evaluation on ICLEI programs implementation should be done continuously for the programs continuity in the future. It should also add programs on global warming mitigation, not only for cities which are the the member of ICLEI, but throughout Indonesia through APEKSI.
There should be ICLEI coordinator for Indonesia which gives technical assistant in Indonesia, more training and workshops are needed.
-
6 Do you know about the Streetlights Management Scheme (for Yogyakarta respondents), the CNG program for city government vehicles (for Surabaya respondents) , and Community-Based Biogas Project (for Denpasar respondents)?
Streetlights Management Scheme in Yogyakarta City are the kWh meter installation and the changing lamps for energy saving until 2011. For the Kampong street light management program, the fund acquired from the saving of PLJU payment is led to the neighborhood street light, where the lighting (lamps, etc) is given to the community for free. At present, PLJU installation is about 7500 points. With the presence of the program, there is an energy saving, because the installation of Kwh meter and energy saving lamps. This program is continued with Kampong street light management program, beginning from 450 lamps in 2004/2005, added 500 lamps in 2006. It is still needed 15,000 points in city area.
CNG program for city government vehicles in Surabaya City has been implemented for 100 government vehicles, each of which provided with:
1. Converter Kit 2. CNG tube 3. Switch on/off so that it can use
either gasoline or CNG for fuel
Yes, the energy crisis which is caused by the diminishing fossil fule, while waste can be an alternative to create energy (Metan).
7 What is the background for the program implementation? Is it from the community or a national policy encouraging the implementation of the
The program is conducted because of the very high of streetlight payment. This program is the initiative of city government. There is a wasting payment on the streetlight management because of contract system
The background of Fuel Switching (CNG) for City Government Vehicles of Surabaya: 1. Sustainable Transportation Study, the
cooperation of BAPPEKO and GTZ 2. The presence of test drive of public
The community started complaining about the careless waste disposal by 56 soybean companies in Ubung area. The initiative came from NGO Bali Fokus and City Government respond to the

Annex-28
No. Questions Yogyakarta Surabaya Denpasar
program? payment, where the city government must pay for 12 hours of streetlight usage, regardless whether the lights are actually on or off. Therefore, a measuring device is installed, so what is paid is what is used. Moreover, the electricity used for streetlight can be measured and evaluated. Beside the meter installation, there is also energy- saving lamps installation. The saving of payment and then used to finance Kampong Streetlight Program.
transportation using CNG 3. Report of by Center for Energy Studies
UGM in the National Transportation Seminar result and Coordination Meeting of INDO CCP, on 30 July 2002 in Universitas Gajah Mada (UGM) Yogyakarta on the test result of CNG vehicles compared to gasoline vehicles, that the reduction of CO level using BBG is 40-50% from the CO level using gasoline.
4. Work plan on CO2 emission reduction on ICLEI-CCP program of Surabaya City 2002/2010 which signed by Surabaya Mayor, that are: a. Inspection and maintenance for
motor vehicles. b. Efficiency on fuel using on office
vehicles in City Government of Surabaya with BBG (CNG) converter kit installation.
c. Surabaya Car Free day d. Campaign on Blue Sky Program
program very well.
8 Please briefly explain the process of the program implementation, starting from the idea, preparation, to the implementation.
The idea is from the city government, then, the master plan is made and consulted to the related stakeholders. After that, discussion is made in the higher level such as City Council. The idea is from the government (related agency), then fully supported by the Mayor. There is also cooperation with related agencies especially City’s Development Planning Board, City Council, and State electricity Company. After that, the budget is agreed for implementation.
The implementation process of CNG program on office vehicles of Government City of Surabaya as explained in No.6 and: 1. The signing of Surabaya City CCP –
ICLEI Workplan 2. Surabaya City office vehicle inventory 3. The proposal of the plan of Gas Fuel
(CNG) converter for Surabaya City Government vehicles to Surabaya City Government Budgeting Team
4. Coordinating meeting and dissemination in city government staff
5. Announcement Letter about CNG
The community expressed their ideas, and then there is a meeting in the village, sub-district, and regency levels. After that the Environment Agency processed and proposed the issues to the Council.

Annex-29
No. Questions Yogyakarta Surabaya Denpasar
Program Plan 6. Installation Schedule 7. Installation Implementation Constraints: a. Surabaya City Government does not
have its own gas fuel station. The existing gas station is owned by Zebra Taxi Company, so that the office vehicles converted to Gas Fuel get the fuel from Zebra Taxi gas station in Brebek and Tanjung Sari Area.
b. It often happens that the gas station pressure is low, therefore private, public, and office vehicles are not allowed to fill the gas fuel in the gas station; the priority is for Zebra Taxis as the owner of the gas station.
c. The spare parts are difficult to find in Surabaya City.
d. Since 2005, Zebra gas station is no longer in service, so office vehicles use gasoline again.
9 Do you know the methodology to reduce green house gas emission?
Not specifically, because at that time, the emission calculation is conducted by ICLEI
We do not know the methodology used in the CNG Program to reduce green house gas emission. The calculation was made by ICLEI and UGM Yogyakarta as ICLEI technical assistance. It was calculated in 2004, the saving per year is 677 ton per year or around US$54,869.
No
10 What is the scope of the program in each city?
The scope of Streetlights Management Scheme Program is all main streets and neighborhood in 14 sub-districts of Yogyakarta City. The Streetlights Management Scheme in all main streets has been conducted 100%; 75% for Village Street and 55% for kampong street. It is expected
The number of office vehicles of Government City of Surabaya equipped with converter kit, BBG tube so they can use two kinds of fuel (gas or gasoline) is 100 office vehicles. Constraints: 1. There are only two gas stations owned
One area/village (several household) in one village

Annex-30
No. Questions Yogyakarta Surabaya Denpasar
that in 2011 KWh meter and energy saving lamps will have been installed in all street from protocol street to kampong or village street. Kampong Streetlight program involved the entire sub-districts in Yogyakarta city. The city government implemented the program, with the assistance of Institution for Urban Community Development (LPMK), so not all the work is conducted by the city government. LPMK monitors the relationship between the city government and the society and then gives report about the areas in need of the streetlight program.
by Zebra Taxi Company in Surabaya City which can be used to fill the BBG for private, public, and office vehicles.
2. It often happens that the gas station pressure is low, therefore private, public, and office vehicles are not allowed to fill the gas fuel in the gas station; the priority is for Zebra Taxis as the owner of the gas station.
3. It is only around 60-70% of office vehicles that fill BBG, because of the lack number of gas stations (there are only two gas stations, in far distance). Moreover, it often happens that the gas station pressure is low when the office vehicle reach the gas station so cannot fill the gas. It is wasting money/ time/ energy.
4. The spare parts are difficult to find in Surabaya City so not all office vehicles using CNG.
11 Do you know the reduction of green house gas emission derived from the programs?
Not specifically, because at that time the the technical assistance of GHG calculation is conducted by ICLEI
With 100 office vehicles operated in five days a week dan the BBG needed estimation is 9 lt/day ; it can reduce 645 ton CO2 emission /year.
No
12 How is the involvement of the stakeholders before and during the implementation of this program?
All stakeholders have been involved, but by now the involvement of stakeholders is considered not optimal.
The involvement of stakeholders before and during the program implementation is very good.
Always be involved since the beginning. Beside that, The government kept monitoring from the beginning to the end of the program implementation.
13 What is the methodology used to involve stakeholders? Who were invited?
Through workshops, seminars, and hearings. Besides the community and NGOs, the invited parties are technical agencies and local authorities. The ccoordinating agency which is City infrastructure Office held a meeting with the community to gather information from
Meetings, since the stakeholders are the staffs of City Government.
At the beginning, there is a meeting and dissemination among community figures, the local community, and soy beans entrepreneurs where Bali Fokus NGO as the facilitator. Workshop and training was also

Annex-31
No. Questions Yogyakarta Surabaya Denpasar
the community related to streetlight maintenance. The community figures and the chairman of LPMK are invited in that meeting. Moreover, the process is combined with the socialization of Blue Sky Program. The result of the meeting is disseminated to the community.
conducted. The invited parties are the related community (soy beans entrepreneurs), NGOs, Environment Office, Engineers, and the Agency of Commerce, Mining, Farming, and Agriculture.
14 How much is the cost of the Program? Is it allocated in the City Budget each year? Since when?
The funding of the program is already budgeted in the City Budget since the programme was started in 2001 until the final phase of the programme in 2011 as mentioned in RPJMD. The total cost is 4,026,726 USD
The cost needed for a vehicle conversion is about Rp 10 – 12 million. The funding for CNG program for city government office vehicles is purely from Surabaya City Budget. By April 2003, Rp. 888.750.000 has been allocated for switching 100 vehicles to CNG.
The development of 1 unit biogas equipment costs about Rp 85 million (8,655 USD), in which the soybean entrepreneurs contribute 5% and the rest if funded by BORDA through Bali Fokus. For biogas project in Peguyangan animal husbandry, the construction cost amounting Rp 5,000,000 (510 USD) borne by the government through APBD.
15 How is the mechanism of the funding for these programs? Is there private sector investment, donor, or purely government investment?
The funding mechanism of the Streetlights Management Scheme is from APBD. the payment of streetlight bill was monthly collected from the Streetlight Tax (8% from total electricity bill per month) of PLN customers. The mechanism is as follows: PLN receive payment from the community including the tax and 8% shall be deposited to the City Government to be included in the APBD in the PAD post. Subsequently, the City Government will pay for the streetlight bill to PLN. Since the implementation of streetlight programmed in 2001, by the installation of KWh meter and energy efficiency lamps, the City Government has been quite successful in saving Rp 500 – 900 million per year
It is purely from Surabaya City budget
Beside APBD, also assistance from NGO
16 Are there any benefits from the implementation of the Program?
The co-benefits of the program besides saving energy are: (1) for the government: providing services to the community, enabling night tourism, so that local tourists are safe to go to
The benefits from the Government City of Surabaya, there are: 1. Saving from the fuel cost aspect,
around Rp 50,000/day/vehicle..
To the community, the program is very useful to save energy. Moreover, waste is reducing because it can be converted into energy and it save energy. The

Annex-32
No. Questions Yogyakarta Surabaya Denpasar
the City Square (alun-alun) at night. Saving energy means saving cost. Then, the government funding can be allocated for other programs; (4) for the community: improving the community activities at night, improving the economic, encouraging the community creativity, meeting the needs for safety. Beside that, the image of Yogyakarta City as the city of tourism is promoted, financial saving, and electricity use is controllable with kWH meter.
2. The improvement of air quality because the reducing of CO2 level in Surabaya City with the calculation 645 ton/year.
3. Improving the quality of life/health of Surabaya City residents.
4. Protecting the climate change.
government is assisted in handling the environment problem.
17 Please explain long term plan for the development of the program, the duration for the programs and is there any similar program?
The long term plan of the program will be conducted in 2007-2011 stages as describing in RJPMD. There is no similar program so far. The target for installation to all villages, to small lanes, is expected to be finished by 2011. Other environment program is the regulation on emission gas limit (it is expected that highway patrol and garages has emission gas measurement device), one million tree planting program, and using bicycle for transportation.
The long term plan of Continuity Transportation Program is using train based on the concept arranged by BAPPEKO Surabaya
The program will be replicated in other areas and not just for soybean industries but also for animal (cow) husbandry and slaughterhouse. Moreover, it can be also developed to reduce unemployment.
18 In the implementation of the Program, is there any conflict among the local community?
In general there is no conflict, except jealousy between the community who has got the street light and the one who hasn’t. The community is informed that program is conducted in stages, so it cannot reach all community at the same time. So, they have to wait, and temporarily, they are expected to provide street light from their houses. Such a conflict is ended with deliberation. So far, the community has been very supportive.
There is no conflict among stakeholders.
No conflict, in fact, they support each other.
19 Is the decision making process within the city government, especially in the implementation of programs
In the decision making of the city government, especially concerning with environment, the planning is top down, but the community always be involved in the
The decision making in City Government of Surabaya especially in implementation program related to environment is conducted in the combination of bottom up
The combination of two: structureal (top-down) and cultural (bottom-up).

Annex-33
No. Questions Yogyakarta Surabaya Denpasar
related to environment bottom-up or top-down?
planning. and top down.
20 What are the constraints and challenges for the introduction of a new program?
Not many constraints for the introduction of new program. Because dissemination is always conducted for new program introduction. Beside that, NGOs are always be actively involved in the planning. If there is any constraint of a new program introduction, it is on the budget of the city government, but there is no problem in the field.
In the dissemination stages, need a good public consultation method.
Sometimes, there is negative thinking by the community who has not understood the objectives and the functions of the program introduced. The people have no trust before they see the evidence. The other constraints are the lack of HRD, funding, facilities, and infrastructure
21 Does the city government staff always collect information about various kinds of programs conducted in other cities, as well as the information about both local and international experts and organization available for any cooperation in developing program?
Yes, there are visits to other cities, comparative studies or national meetings to share information. In those meetings, there are innovative ideas as the guidelines to other cities. The city government also opened cooperation with local or abroad NGOs which in line with the programs of city government. We shared information through comparative studies, e.g. to Jakarta and Solo. Moreover, the information is taken from the internet, APEKSI forum (management level). The forum such as workshop is held by foreign NGO. For example ICLEI gave many contributions to the government city staff in getting information about the latest programs. Besides that, the internet usage is very helpful. Then, the information concerning experts and local and international institution is got from central government, that is the National Development Planning Agency.
Not always. The information is sometimes taken from the result of workshop, seminar, and meetings.
The city government staff collect information from other cities through the websites and conduct comparative studies.
22 Is there any process of public consultation, workshop, or other activities in the frame of program introduction?
Yes, dialogs with the local community were held twice before the MUSRENBANG. Then, there are process of public consultation through Musrenbang, workshop, and
The CNG program for city government vehicles only involves related offices and the users of vehicles owned by city government. The program implementation process is as
To introduce the program to the community, NGO Bali Fokus conducted discussion, presentation and participatory approach using RPA

Annex-34
No. Questions Yogyakarta Surabaya Denpasar
seminar. There are ideas or inputs from stakeholders and the community representatives in the forum. At Musrenbang, the community is asked about the areas without street lights. The list of them then is proposed to the village office. For Streetlights Management Scheme and or Kampong Street Light Management Program, the process of public consultation is conducted in February 2007, in the framework of the introduction of streetlight management scheme. The disemination program of city government is conducted by Regional Information Agency (BID). The city government also cooperated with the media such as Kedaulatan Rakyat, Bernas, and Kompas newspapers.
follows. a. The signing of Surabaya City CCP –
ICLEI Workplan b. Surabaya City office vehicle inventory c. The proposal of the plan of Gas Fuel
(CNG) converter for Surabaya City Government vehicles to Surabaya City Government Budgeting Team
d. Coordinating meeting and dissemination in city government staff
e. Announcement Letter about CNG Program Plan
f. Installation schedule and implementation
(Rapid Participatory Assessment) method was conducted during April-June 2003 period. Meetings between Bali Fokus and entrepreneurs have been conducted for 12 (twelve) times. In the meetings, the City Government serves as the facilitator.
23 Is there any program or media to share information intercity related to environment program? In what ways?
The city government of Yogyakarta conducted monthly meeting with the regency governments in the entire Yogyakarta Special Province to share information about activities or programs in their regencies. Moreover, the city government of Yogyakarta belongs to Association of Indonesian Municipalities (APEKSI: Asosiasi Pemerintah Kota Seluruh Indonesia). The APEKSI meeting is done every year with APEKSI members took turn as the host. The relation between the Environment Ministry and the city government staff of Yogyakarta is well coordinated. Besides that, information sharing is also conducted through the internet. From the website of the related cities, all the program reports can be accessed through the website. And, there are also Sister City Programs from many cities and inter executives. By giving
APEKSI, sister cities Yes, there are mass media and internet. (www.denpasar.go.id).Moreover, there are pamphlets, seminar, and periodical dissemination ( once in two months)

Annex-35
No. Questions Yogyakarta Surabaya Denpasar
motivation to environment activities and meeting with environmentalist.
24 What has the city government staff done to improve their capability in doing their routine jobs?
The City government staffs improve themselves through workshop, seminar, trainings, brief education and internet. Moreover, every staff of city government is given unlimited chances, through internet or other activities to get the information from other countries. They are also given an opportunity to improve their education quality by taking a higher education (funded by the city government).
In improving the quality in doing the routine jobs, the city government staff is joining trainings, brief courses, workshop, seminar, etc.
The quality improvement is conducted through trainings, courses, seminar on management, and through internet to access programs in other cities.
25 Through what media does the city government staff search for information? How often does he/she look for new information (the frequency)? If there is new information, what does he/she do for the follow-up?
Through seminar, internet, and new information related to the programs that can de developed in Yogyakarta City, the city government soon coordinated with the related staff and agencies to follow up the program.
Looking for information through internet, email, telepon. The frequencies cannot be determined, depending on the demand. It there is new information, it is used as an input.
Through internet, seminars, and workshop, depend on the invitation letters. Electronic information (internet, RKPD Radio Station-101,50Hz and email).
26 How is the relation between city governments with NGOs? What benefits they got from such a relation?
The relation between the city government and NGos is very good. NGOs gave much benefit to the city government. Moreover, NGOs often helped the city government in handling many community problems especially in program dissemination.
The relation between the city government and the local, national, and international NGOs is good. The benefit of the new program is used as the input.
Complementary each others. And have cooperated for a long time. The NGOs are planning a program and the city government implemented it. At the beginning, the funding is from NGOs. Further funding is by the city government.
27 Except ICLEI, is there any similar program, in which the city staff government in Indonesia can share information?
APEKSI, CAI-Asia Besides ICLEI, there is Kitakyushu Initiative Network, IGES, UNESCAP, Clean Air Initiative (CAI) Network.
No information

Annex-36
Interviewees: NGO and Media
No. Questions Yogyakarta City) Surabaya Denpasar
1 Do you know about the program?
This program is about distributing lighting to streets until it reaches villages and it is closely related with land acquisition and the shifting of function in the community productive land. The areas with street light will soon be open areas that attract people, because lighting is a vital needs in urban life.
Yes, but not been involved in this specific project.
Yes
2 What is the background for the program implementation? Is it from the community or a national policy encouraging the implementation of the program?
Besides as the lighting function, it is also supported Yogyakarta as the tourism city. The initiative can be from the city government or community. The community needed lighting, and in other hand, the city government was actively mapping the areas needed streetlight.
To reduce air pollution To reduce pollution in tahu-tempe industrial area in Ubung. The initiative is from the NGO in cooperation with the government as the facilitator.
3 Is the community, media, or NGO involved in the planning and the implementation of the program?
On the planning of the programs, so far, the Yogyakarta City Government has not involved the community in wider scope. The community is viewed as the object of the implemented program, where it should be the community as the subject of the programs. A forum for the government city in sharing information is viewed as less effective because today the information media still belonged to certain community
Do not know in specific details. Yes.
4 If it is, how is the involvement (through meetings, workshop, focus group discussion, etc.)?
Do not not very specific. Do not know in specific details. The Mekar Sari enterpreneur group (Tahu Tempe enterpreneurs) and NGOs are involved, but not the media. Beside that, through meetings in Bale Banjar and house to house visit.
5 What are the benefits for the community regarding the implementation of the program?
The benefits are related to the aspect of security, comfort, order, etc.
- It reduces pollution and provide fuel for energy.

Annex-37
No. Questions Yogyakarta City) Surabaya Denpasar
6 In the implementation of the program, is there any conflict among the local community?
So far the city government of Yogyakarta has involved the community and many elements of it to arrange the programs, especially through Musrenbang. In the more common programs, conflicts with the community happened when the new program is introduced, but it is normal. The most important thing is the ways to overcome it.
- Yes, there is. At the socialization, there are often happened cross opinions. But the conflict is just happened at the time of land acquisition and construction time. The solution is by conducting meeting frequently.
7 What are the constraints and challenges for the introduction of a new program?
It was the jealosy among regions with street light and the ones without.
Do not know in specific details. The community is not well informed about environmental issues.
8 Is there any process of public consultation, workshop, or other activities in the frame of program introduction?
Yes, through seminar and dissemination meeting in the level of neighborhoods to city.
Do not know in specific details. Do not know in specific details.
9 How is the relation between city governments with NGOs? What benefits they got from such a relation?
The relation is good as partners to reach the same objectives. If the vision of the government is in line with the NGO’s, they will support the program.
So far the relation is good. The good coordination between government, NGO, Media and private will contribute to the success of environment program. One of the examples is the Green and Clean Program in Surabaya. With appropriate synergy among the government, Jawa Pos, and Unilever, the program is successful. The majority of the community support and participate.
In complementary function and the government has worked for a long time with the NGO in planning a program and the government implement it. The funding is initially from the NGO, and will be continued by the city government.

Annex-38
Interviewees: The Communities in Yogyakarta, Surabaya, and Denpasar
No. Questions Yogyakarta City) Surabaya Denpasar
1 Do you know about the program? Yes. The disbursement of neighborhood streetlight is the streetlight program that will be distributed to village or areas with the coordination of LPMK. At the beginning, the disbursement is through LPMK’s account, but later the account is paid through the Settlement and Regional Infrastructure Agency, it will be easier for the maintenance and bring the service close to the society. Each sub-village is responsible to the maintenance, and the the Settlement and Regional Infrastructure Agency gave more or less Rp 7000-Rp 8000 for cleaning the areas and changing the unused lamps. LPMK is monitoring the implementation of the streetlight maintenance.
Yes Yes. The program is make use of the liquid waste and transform it to methane. We can use it for cooking and therefore we can save money to buy kerosene or LPG.
2 What is the background for the program implementation? Is it from the community or a national policy encouraging the implementation of the program?
Do not know for specific details, but both the government and the community have equally important interests: the government should provide services to the community, while community needs the street light program.
Air pollution by vehicles. Since there are soybean curd industries and poultry slaughterhouse that produce waste, the area seems extremely dirty. To minimize and make use of the waste and avoid the smell, the biogas program is designed and implemented.
3 Is the community, media, or NGO involved in the planning and the implementation of the program?
Meeting with the City Infrastructure Office, in which the city government asking input from the community related to streetlight maintenance. The community figures and the chairman of LPMK are invited in that meeting. The community is often involved in the program through meetings, and also focus group discussion, this meeting is the routine meeting from sub-village. So the community aspiration is from the
Do not know in specific details. Yes, with Bali Fokus

Annex-39
No. Questions Yogyakarta City) Surabaya Denpasar
neighborhood level, and then to the sub-village, to the village level. In its planning, the city government mapped all the streetlight need in the entire villages of Yogyakarta City. The implementation is based on the priority scale in which the area with the highest number of streetlight shortage will get the first priority.
4 If it is, how is the involvement (through meetings, workshop, focus group discussion, etc.)?
The community is often involved in the program through meetings and focus group discussion. These meetings are routine meetings in sub-village, but for the Streetlight Program dissemination, it is one spcialized agenda separated from routine programs dissemination.
Do not know in specific details. Through meetings in Bale Banjar and home visit.
5 What are the benefits for the community regarding the implementation of the program?
It reduces crimes and improve tourism activities.
The affordable price compared to cars with gasoline fuel; even, the difference of the price of both fuels is 50%.
Saving money
6 In the implementation of the program, is there any conflict among the local community?
In any programs, conflict is a normal thing. In the street light program, a conflict was happened because the residents in an area had independently provided streetlights, but then the streetlight program was introduced. Beside that, the people wanted all areas of the community to be provided with street light. However, the conflict was settled in peace through deliberation.
No serious conflict. All conflicts are manageable.
All parties are very supportive, no conflict.
7 What are the constraints and challenges for the introduction of a new program?
The main challenge is on the dissemination process or program introduction. The community awareness on environmental program is still low. At the beginning, there is suspicion to the new program.
At the dissemination process, where the community usually suspicious on the new program.
The community has not aware on environmental issues.
8 Is there any process of public consultation, workshop, or other activities in the frame of program introduction?
Yes, through MUSRENBANGDA.
No information