final report on hud52667 spreadsheet update...zipcodetodegreeday-ver02.xls. 1.4 updating the...
TRANSCRIPT
GARD Analytics 1 Utility Allowance Model Update
Final Report on HUD52667 Spreadsheet Update GARD Analytics February 12, 2007
The U.S. Department of Housing and Urban Development (HUD) operates the Housing Choice Vouchers
program, also called Section 8. The Housing and Community Development Act of 1974 authorized the
Section 8 program which has been modified several times including by the Quality Housing and Work
Responsibility Act of 1998 which resulted in the current Housing Choice Vouchers program. As part of the
Housing Choice Vouchers program, the participant is reimbursed for a share of the total housing cost. The
total housing cost includes not only rent, but also an allowance for utilities such as electricity, natural gas and
other fuels. The local public housing authorities must routinely update the allowances for utility costs. To
make this easier, HUD provided a standard form called HUD-52667 and guidance in the instructions for that
form. The guidance included the amount of energy consumed by heating, water heating, lighting and
refrigeration, cooking, etc. These individual energy consumptions are also called end-uses. The allowances
are often portrayed in a tabular format with values in dollars per month for each end use by the number of
bedrooms. The tables are then reproduced for each type of housing, such as single family detached,
townhouse, or apartment. This is also the format used in the HUD 52667 form.
The history of the guidance provided in the instructions for HUD 52667 dated originally back to the era of
the original Housing and Community Development Act of 1974. This was soon after the beginning of the
energy crisis in the 1970’s. Housing from this era had few conservation features that people now take for
granted, such as sufficient wall and roof insulation, double-paned “thermal” windows, and efficient furnaces
and water heaters. The guidance provided for determining the utility allowances had not been significantly
updated since that time yet the common use of more energy conserving building practices, due in part to the
energy crisis, had reduced the amount of energy used for heating, cooking and water heating in a typical
residence. This resulted in the utility allowances being larger than necessary to cover the energy costs for the
residents. Of course, housing stock has also changed between the 1970’s and now, specifically the floor area
of newer homes has increased.
In 2002 and 2003, GARD Analytics worked with HUD to create a spreadsheet version of HUD Form 52667
primarily using data from the U.S. Department of Energy’s Residential Energy Consumption Survey (RECS)
from 1997. The approach used the RECS data that serves as the basis of the report “A Look at Residential
Energy Consumption in 1997” published by the U.S. Department of Energy - Energy Information
Administration. Multiple linear regression was used with the RECS data to derive correlations for most of the
end-uses shown on the 52667 form. For heating energy consumption, for example, the relationship developed
was based on heating degree-days and number of bedrooms. Correlations were developed for each of the
building types.
Since that time, the spreadsheet has been updated and enhanced several times. The latest round of
enhancements includes revising the method by which heat pump efficiencies are computed based on climate,
updating the heating energy use calculation to reflect the complex issues with climate, and compare the
results of the spreadsheet with actual data.
1. Revise Heat Pump Efficiency Adjustment
1.1 Overview
A new formula was added to the HUD 52667 spreadsheet that adjusted the electricity used for heating based
on climate when a heat pump was specified. Prior to this update, the HSPF (heating seasonal performance
factor) was used as a direct adjustment factor for the heat pump energy consumption calculation. The HSPF
measure is based on combining efficiencies under different conditions, but it does not provide a heating
seasonal efficiency for all climates. Since heat pumps are a refrigeration-based system, they lose capacity and
efficiency at lower temperatures. Because of loss of capacity at low temperatures in northern climates, the
heat pump supplemental heat, which is electric resistance, is used extensively at lower outside air

GARD Analytics 2 Utility Allowance Model Update
temperatures. This makes the actual seasonal efficiency lower in colder northern climates and higher in
warmer climates.
1.2 Simulation Results
Recently, the Florida Solar Energy Center (FSEC) examined this exact issue of the influence of climate on
heat pump efficiency. A paper titled "Climatic Impacts on Heating Seasonal Performance Factor (HSPF) and
Seasonal Energy Efficiency Ratio (SEER) for Air-Source Heat Pumps" was published in 2004 by ASHRAE
and was written by Philip Fairey, Danny Parker, Bruce Wilcox and Matthew Lombardi. All but Wilcox are
researchers at FSEC. The paper is available from ASHRAE or at:
http://www.fsec.ucf.edu/bldg/pubs/hspf/
The paper describes the use of the DOE-2 building energy simulation program to examine the issue of how
heating energy performance changes in different climates for heat pumps. FSEC is considered one of the
premier research institutions on heat pump models used in building energy simulation programs. They used
DOE-2 simulations with a heat pump model that includes modifications based on their experience in real
world field studies and laboratory research. The paper examined heat pump heating performance in:
Miami
Houston
Ft Worth
Phoenix
Los Angeles
Atlanta
Las Vegas
St. Louis
New York City
Seattle
Fresno
Detroit
Minneapolis
Denver
San Francisco.
The paper showed that the HSPF should be modified by a factor based on heating design temperature and the
nominal HSPF. A subset of the paper’s results was used to find the performance for heat pumps nominally
rated at 6.8 HSPF. The decrease in performance is shown in the Degradation column on Table 1.
GARD Analytics 3 Utility Allowance Model Update
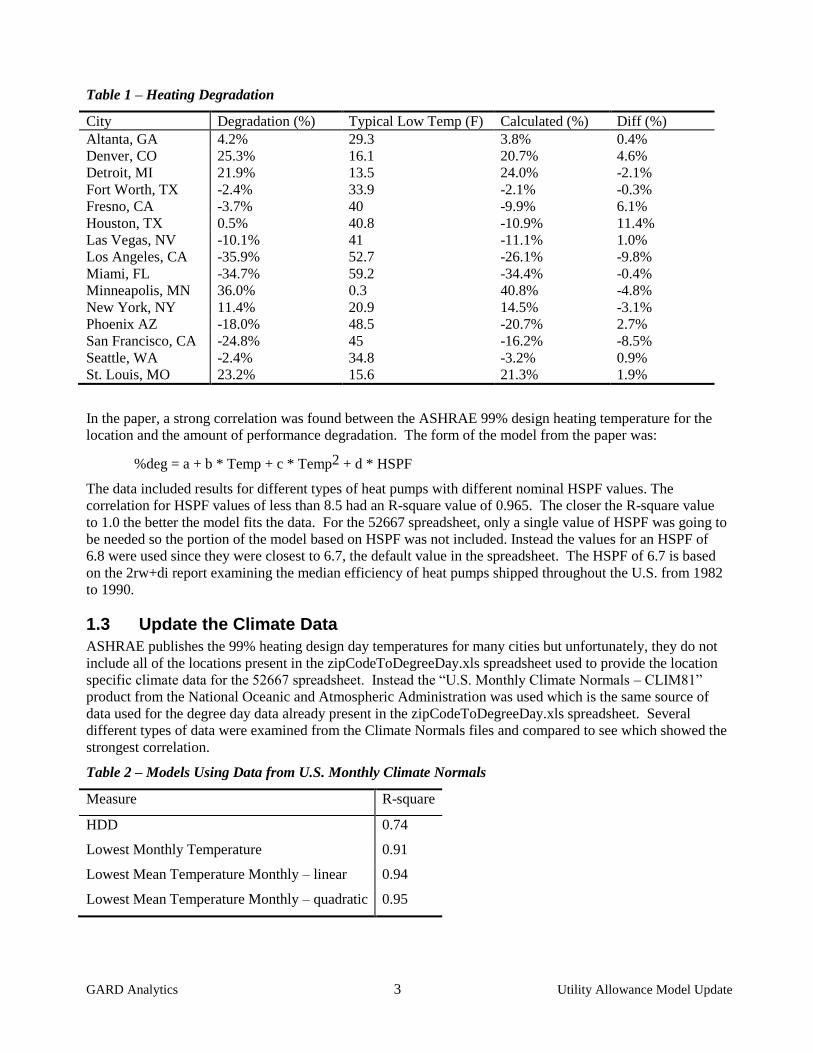
Table 1 – Heating Degradation
City Degradation (%) Typical Low Temp (F) Calculated (%) Diff (%)
Altanta, GA 4.2% 29.3 3.8% 0.4%
Denver, CO 25.3% 16.1 20.7% 4.6%
Detroit, MI 21.9% 13.5 24.0% -2.1%
Fort Worth, TX -2.4% 33.9 -2.1% -0.3%
Fresno, CA -3.7% 40 -9.9% 6.1%
Houston, TX 0.5% 40.8 -10.9% 11.4%
Las Vegas, NV -10.1% 41 -11.1% 1.0%
Los Angeles, CA -35.9% 52.7 -26.1% -9.8%
Miami, FL -34.7% 59.2 -34.4% -0.4%
Minneapolis, MN 36.0% 0.3 40.8% -4.8%
New York, NY 11.4% 20.9 14.5% -3.1%
Phoenix AZ -18.0% 48.5 -20.7% 2.7%
San Francisco, CA -24.8% 45 -16.2% -8.5%
Seattle, WA -2.4% 34.8 -3.2% 0.9%
St. Louis, MO 23.2% 15.6 21.3% 1.9%
In the paper, a strong correlation was found between the ASHRAE 99% design heating temperature for the
location and the amount of performance degradation. The form of the model from the paper was:
%deg = a + b * Temp + c * Temp2 + d * HSPF
The data included results for different types of heat pumps with different nominal HSPF values. The
correlation for HSPF values of less than 8.5 had an R-square value of 0.965. The closer the R-square value
to 1.0 the better the model fits the data. For the 52667 spreadsheet, only a single value of HSPF was going to
be needed so the portion of the model based on HSPF was not included. Instead the values for an HSPF of
6.8 were used since they were closest to 6.7, the default value in the spreadsheet. The HSPF of 6.7 is based
on the 2rw+di report examining the median efficiency of heat pumps shipped throughout the U.S. from 1982
to 1990.
1.3 Update the Climate Data
ASHRAE publishes the 99% heating design day temperatures for many cities but unfortunately, they do not
include all of the locations present in the zipCodeToDegreeDay.xls spreadsheet used to provide the location
specific climate data for the 52667 spreadsheet. Instead the “U.S. Monthly Climate Normals – CLIM81”
product from the National Oceanic and Atmospheric Administration was used which is the same source of
data used for the degree day data already present in the zipCodeToDegreeDay.xls spreadsheet. Several
different types of data were examined from the Climate Normals files and compared to see which showed the
strongest correlation.
Table 2 – Models Using Data from U.S. Monthly Climate Normals
Measure R-square
HDD 0.74
Lowest Monthly Temperature 0.91
Lowest Mean Temperature Monthly – linear 0.94
Lowest Mean Temperature Monthly – quadratic 0.95
GARD Analytics 4 Utility Allowance Model Update
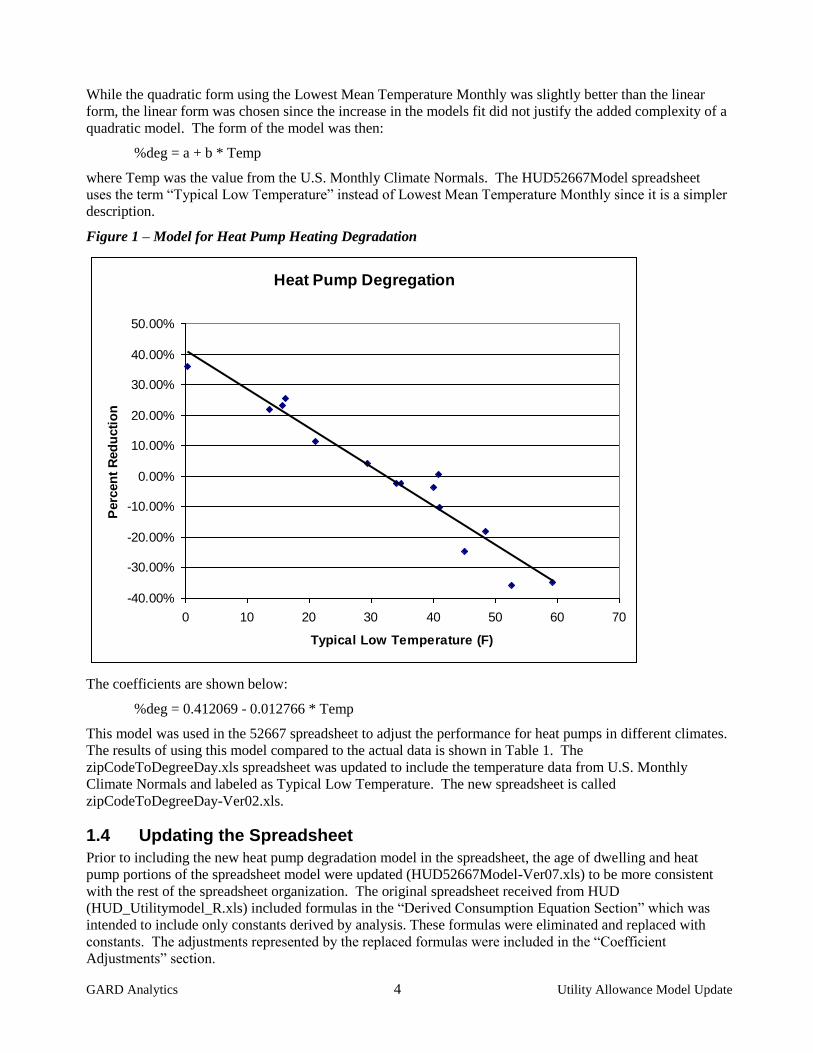
While the quadratic form using the Lowest Mean Temperature Monthly was slightly better than the linear
form, the linear form was chosen since the increase in the models fit did not justify the added complexity of a
quadratic model. The form of the model was then:
%deg = a + b * Temp
where Temp was the value from the U.S. Monthly Climate Normals. The HUD52667Model spreadsheet
uses the term “Typical Low Temperature” instead of Lowest Mean Temperature Monthly since it is a simpler
description.
Figure 1 – Model for Heat Pump Heating Degradation
Heat Pump Degregation
-40.00%
-30.00%
-20.00%
-10.00%
0.00%
10.00%
20.00%
30.00%
40.00%
50.00%
0 10 20 30 40 50 60 70
Typical Low Temperature (F)
Perc
en
t R
ed
ucti
on
The coefficients are shown below:
%deg = 0.412069 - 0.012766 * Temp
This model was used in the 52667 spreadsheet to adjust the performance for heat pumps in different climates.
The results of using this model compared to the actual data is shown in Table 1. The
zipCodeToDegreeDay.xls spreadsheet was updated to include the temperature data from U.S. Monthly
Climate Normals and labeled as Typical Low Temperature. The new spreadsheet is called
zipCodeToDegreeDay-Ver02.xls.
1.4 Updating the Spreadsheet
Prior to including the new heat pump degradation model in the spreadsheet, the age of dwelling and heat
pump portions of the spreadsheet model were updated (HUD52667Model-Ver07.xls) to be more consistent
with the rest of the spreadsheet organization. The original spreadsheet received from HUD
(HUD_Utilitymodel_R.xls) included formulas in the “Derived Consumption Equation Section” which was
intended to include only constants derived by analysis. These formulas were eliminated and replaced with
constants. The adjustments represented by the replaced formulas were included in the “Coefficient
Adjustments” section.
GARD Analytics 5 Utility Allowance Model Update
The updated spreadsheet was tested against the original spreadsheet received from HUD
(HUD_Utilitymodel_R.xls) to ensure that the calculations were consistent. For the Atlanta (Hartfield)
location, 24 combinations of age of dwelling, heat pump or no heat pump, and unit type were compared and
no differences were found. The unit types tested were detached, townhouse, apartment, and manufactured.
The age of units tested included before 1980, 1980 to 1996, and 1996 or newer. No differences were found
in these comparisons.
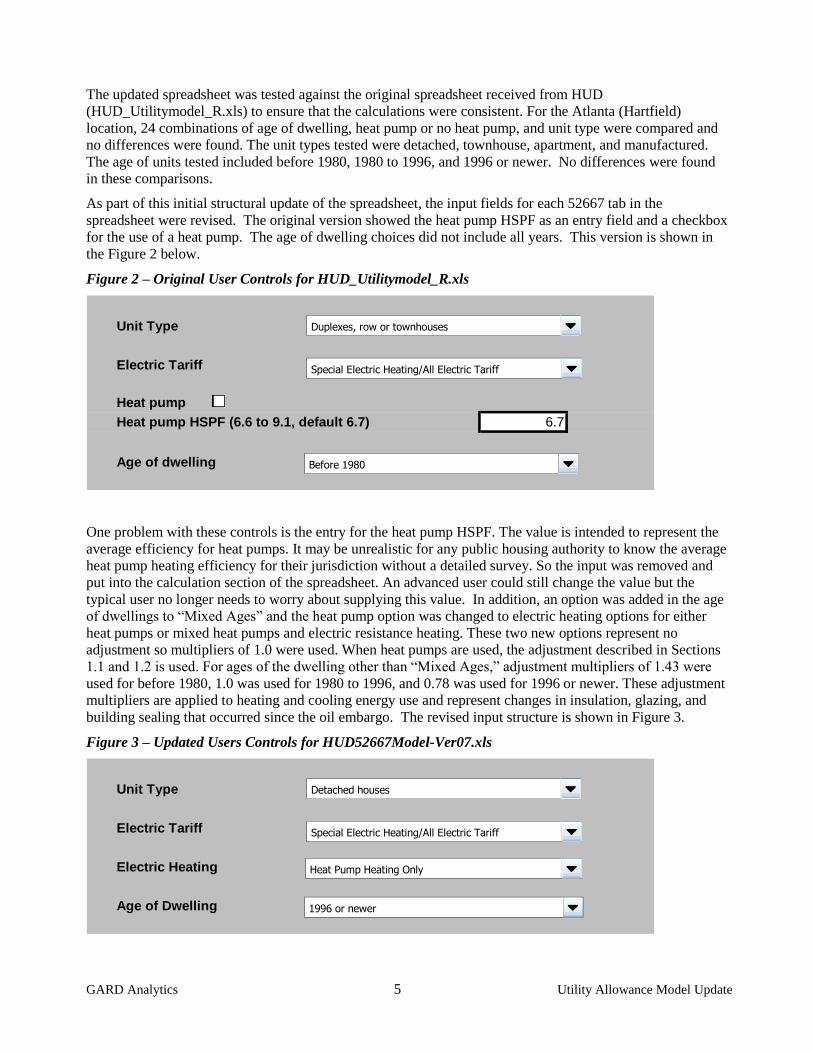
As part of this initial structural update of the spreadsheet, the input fields for each 52667 tab in the
spreadsheet were revised. The original version showed the heat pump HSPF as an entry field and a checkbox
for the use of a heat pump. The age of dwelling choices did not include all years. This version is shown in
the Figure 2 below.
Figure 2 – Original User Controls for HUD_Utilitymodel_R.xls
Unit Type
Electric Tariff
Heat pump
Heat pump HSPF (6.6 to 9.1, default 6.7) 6.7
Age of dwelling
Duplexes, row or townhouses
Special Electric Heating/All Electric Tariff
Before 1980
One problem with these controls is the entry for the heat pump HSPF. The value is intended to represent the
average efficiency for heat pumps. It may be unrealistic for any public housing authority to know the average
heat pump heating efficiency for their jurisdiction without a detailed survey. So the input was removed and
put into the calculation section of the spreadsheet. An advanced user could still change the value but the
typical user no longer needs to worry about supplying this value. In addition, an option was added in the age
of dwellings to “Mixed Ages” and the heat pump option was changed to electric heating options for either
heat pumps or mixed heat pumps and electric resistance heating. These two new options represent no
adjustment so multipliers of 1.0 were used. When heat pumps are used, the adjustment described in Sections
1.1 and 1.2 is used. For ages of the dwelling other than “Mixed Ages,” adjustment multipliers of 1.43 were
used for before 1980, 1.0 was used for 1980 to 1996, and 0.78 was used for 1996 or newer. These adjustment
multipliers are applied to heating and cooling energy use and represent changes in insulation, glazing, and
building sealing that occurred since the oil embargo. The revised input structure is shown in Figure 3.
Figure 3 – Updated Users Controls for HUD52667Model-Ver07.xls
Unit Type
Electric Tariff
Electric Heating
Age of Dwelling
Detached houses
Special Electric Heating/All Electric Tariff
1996 or newer
Heat Pump Heating Only
GARD Analytics 6 Utility Allowance Model Update
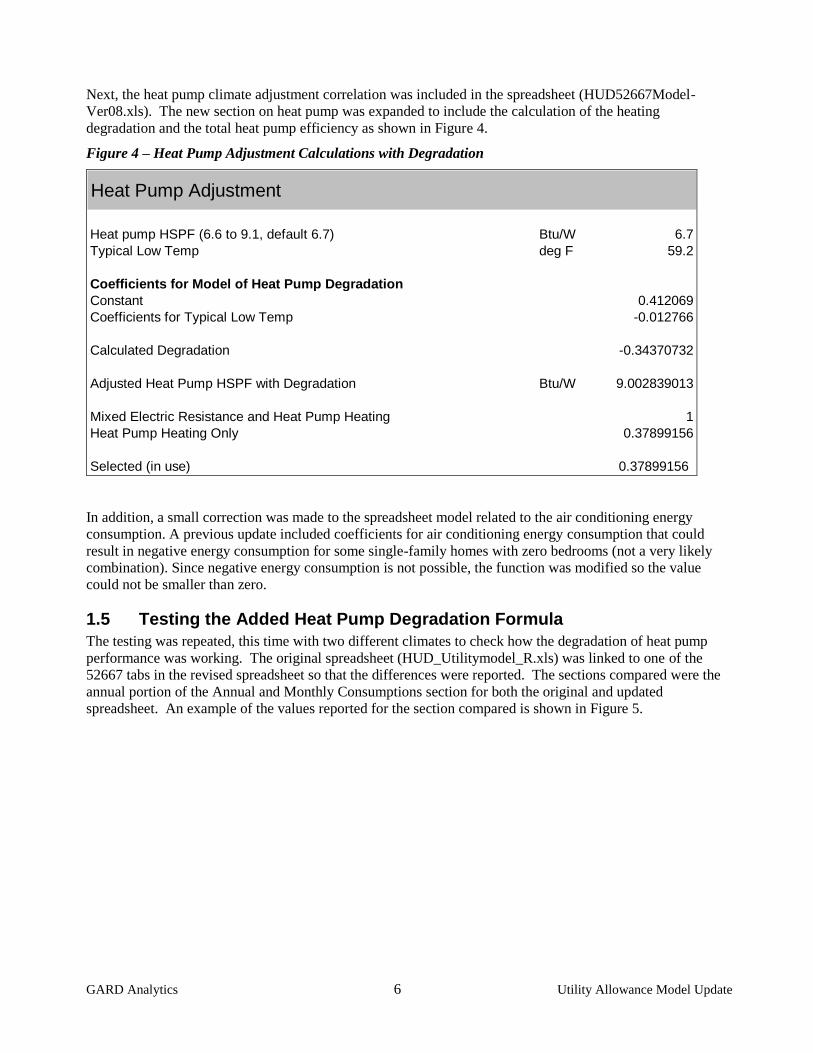
Next, the heat pump climate adjustment correlation was included in the spreadsheet (HUD52667Model-
Ver08.xls). The new section on heat pump was expanded to include the calculation of the heating
degradation and the total heat pump efficiency as shown in Figure 4.
Figure 4 – Heat Pump Adjustment Calculations with Degradation
Heat Pump Adjustment
Heat pump HSPF (6.6 to 9.1, default 6.7) Btu/W 6.7
Typical Low Temp deg F 59.2
Coefficients for Model of Heat Pump Degradation
Constant 0.412069
Coefficients for Typical Low Temp -0.012766
Calculated Degradation -0.34370732
Adjusted Heat Pump HSPF with Degradation Btu/W 9.002839013
Mixed Electric Resistance and Heat Pump Heating 1
Heat Pump Heating Only 0.37899156
Selected (in use) 0.37899156
In addition, a small correction was made to the spreadsheet model related to the air conditioning energy
consumption. A previous update included coefficients for air conditioning energy consumption that could
result in negative energy consumption for some single-family homes with zero bedrooms (not a very likely
combination). Since negative energy consumption is not possible, the function was modified so the value
could not be smaller than zero.
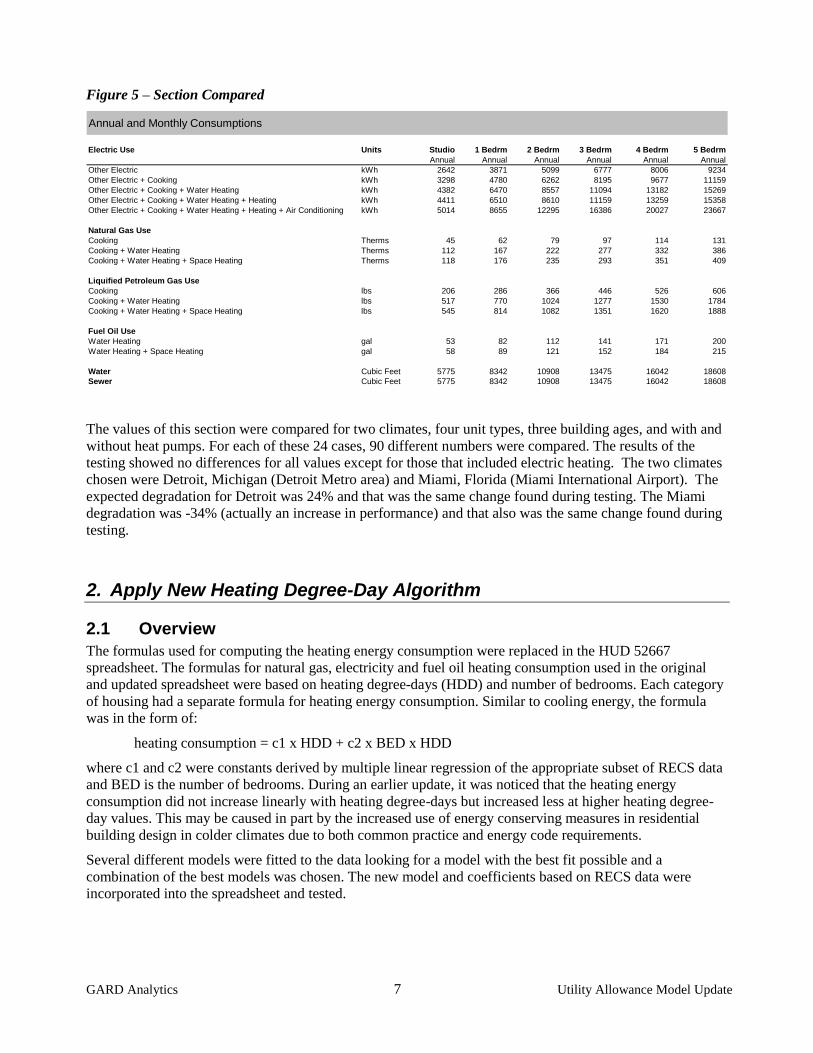
1.5 Testing the Added Heat Pump Degradation Formula
The testing was repeated, this time with two different climates to check how the degradation of heat pump
performance was working. The original spreadsheet (HUD_Utilitymodel_R.xls) was linked to one of the
52667 tabs in the revised spreadsheet so that the differences were reported. The sections compared were the
annual portion of the Annual and Monthly Consumptions section for both the original and updated
spreadsheet. An example of the values reported for the section compared is shown in Figure 5.
GARD Analytics 7 Utility Allowance Model Update
Figure 5 – Section Compared
Annual and Monthly Consumptions
Electric Use Units Studio 1 Bedrm 2 Bedrm 3 Bedrm 4 Bedrm 5 Bedrm
Annual Annual Annual Annual Annual Annual
Other Electric kWh 2642 3871 5099 6777 8006 9234
Other Electric + Cooking kWh 3298 4780 6262 8195 9677 11159
Other Electric + Cooking + Water Heating kWh 4382 6470 8557 11094 13182 15269
Other Electric + Cooking + Water Heating + Heating kWh 4411 6510 8610 11159 13259 15358
Other Electric + Cooking + Water Heating + Heating + Air Conditioning kWh 5014 8655 12295 16386 20027 23667
Natural Gas Use
Cooking Therms 45 62 79 97 114 131
Cooking + Water Heating Therms 112 167 222 277 332 386
Cooking + Water Heating + Space Heating Therms 118 176 235 293 351 409
Liquified Petroleum Gas Use
Cooking lbs 206 286 366 446 526 606
Cooking + Water Heating lbs 517 770 1024 1277 1530 1784
Cooking + Water Heating + Space Heating lbs 545 814 1082 1351 1620 1888
Fuel Oil Use
Water Heating gal 53 82 112 141 171 200
Water Heating + Space Heating gal 58 89 121 152 184 215
Water Cubic Feet 5775 8342 10908 13475 16042 18608
Sewer Cubic Feet 5775 8342 10908 13475 16042 18608
The values of this section were compared for two climates, four unit types, three building ages, and with and
without heat pumps. For each of these 24 cases, 90 different numbers were compared. The results of the
testing showed no differences for all values except for those that included electric heating. The two climates
chosen were Detroit, Michigan (Detroit Metro area) and Miami, Florida (Miami International Airport). The
expected degradation for Detroit was 24% and that was the same change found during testing. The Miami
degradation was -34% (actually an increase in performance) and that also was the same change found during
testing.
2. Apply New Heating Degree-Day Algorithm
2.1 Overview
The formulas used for computing the heating energy consumption were replaced in the HUD 52667
spreadsheet. The formulas for natural gas, electricity and fuel oil heating consumption used in the original
and updated spreadsheet were based on heating degree-days (HDD) and number of bedrooms. Each category
of housing had a separate formula for heating energy consumption. Similar to cooling energy, the formula
was in the form of:
heating consumption = c1 x HDD + c2 x BED x HDD
where c1 and c2 were constants derived by multiple linear regression of the appropriate subset of RECS data
and BED is the number of bedrooms. During an earlier update, it was noticed that the heating energy
consumption did not increase linearly with heating degree-days but increased less at higher heating degree-
day values. This may be caused in part by the increased use of energy conserving measures in residential
building design in colder climates due to both common practice and energy code requirements.
Several different models were fitted to the data looking for a model with the best fit possible and a
combination of the best models was chosen. The new model and coefficients based on RECS data were
incorporated into the spreadsheet and tested.
GARD Analytics 8 Utility Allowance Model Update
2.2 Choosing the Model
The spreadsheet named heatingRegressionRevised.xls contains the derivation, selection and testing of the
new heating energy formulas found in the HUD 52667 spreadsheet.
The Energy Information Administration of the U.S. Department of Energy performs a survey every few year
titled Residential Energy Consumption Survey (RECS). The detailed results of the survey from 2001 are
available on the website:
http://www.eia.doe.gov/
Or more specifically at:
http://www.eia.doe.gov/emeu/recs/recs2001/publicuse2001.html
Three of the files were used and certain fields were extracted from each:
File 1 – Section A: Housing Unit Characteristics
HDD65 - Heating Degree-Days to base 65, 1-04 TO 12-04
TYPEHUQ - Type of Home: as report by Respondent (Mobile Home, Single-Family
detached, Single-Family Attached, Apartment in Building containing 2-4 units,
Apartment in Building Containing 5 or more units)
BEDROOMS - Number of bedrooms
File 4 – Section D: Space heating
FUELHEAT - Main fuel used for heating home
File 11 – Energy Consumption
BTUELSPH - Electric Space Heat Use (Estimated)
BTUNGSPH- Natural Gas Space Heat Use (Estimated)
BTUFOSPH - Fuel Oil Space Heat Use (Estimated)
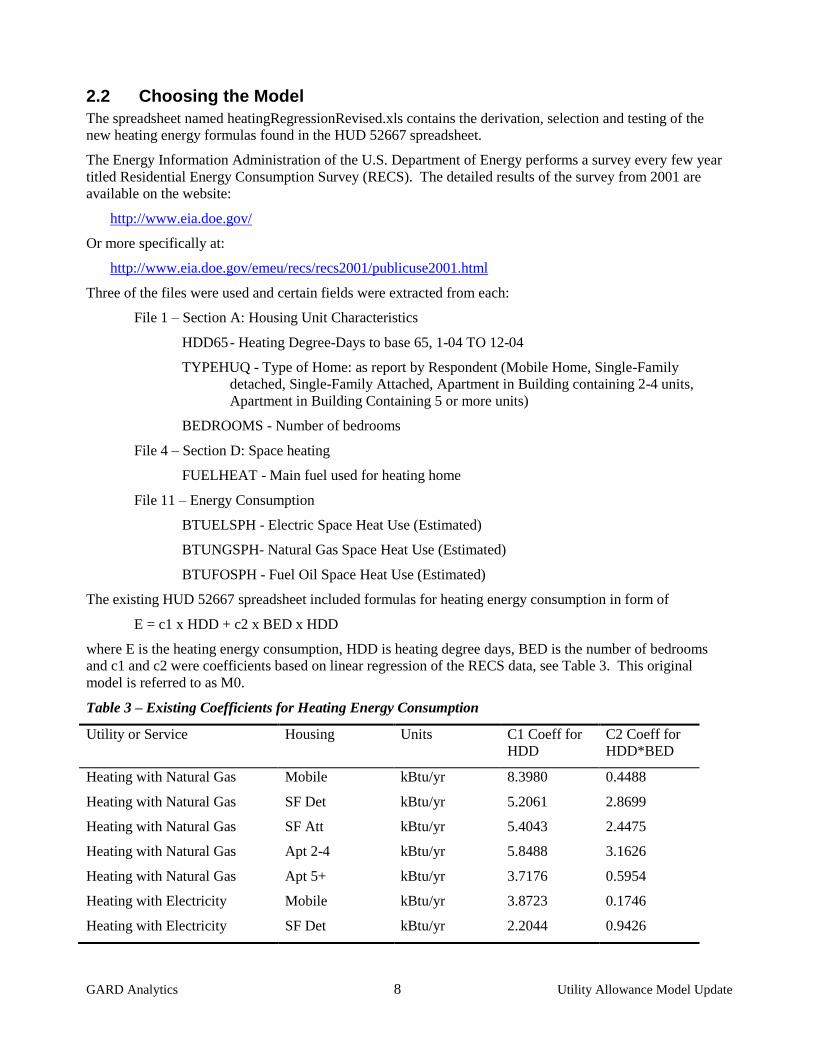
The existing HUD 52667 spreadsheet included formulas for heating energy consumption in form of
E = c1 x HDD + c2 x BED x HDD
where E is the heating energy consumption, HDD is heating degree days, BED is the number of bedrooms
and c1 and c2 were coefficients based on linear regression of the RECS data, see Table 3. This original
model is referred to as M0.
Table 3 – Existing Coefficients for Heating Energy Consumption
Utility or Service Housing Units C1 Coeff for
HDD
C2 Coeff for
HDD*BED
Heating with Natural Gas Mobile kBtu/yr 8.3980 0.4488
Heating with Natural Gas SF Det kBtu/yr 5.2061 2.8699
Heating with Natural Gas SF Att kBtu/yr 5.4043 2.4475
Heating with Natural Gas Apt 2-4 kBtu/yr 5.8488 3.1626
Heating with Natural Gas Apt 5+ kBtu/yr 3.7176 0.5954
Heating with Electricity Mobile kBtu/yr 3.8723 0.1746
Heating with Electricity SF Det kBtu/yr 2.2044 0.9426
GARD Analytics 9 Utility Allowance Model Update
Heating with Electricity SF Att kBtu/yr 1.6030 0.8226
Heating with Electricity Apt 2-4 kBtu/yr 1.6186 0.5653
Heating with Electricity Apt 5+ kBtu/yr 1.1652 0.6768
Heating with Fuel Oil Mobile kBtu/yr 8.4437 0.0000
Heating with Fuel Oil SF Det kBtu/yr 5.6093 2.4951
Heating with Fuel Oil SF Att kBtu/yr 3.2605 3.3847
Heating with Fuel Oil Apt 2-4 kBtu/yr 5.3947 3.8621
Heating with Fuel Oil Apt 5+ kBtu/yr 2.8670 1.5561
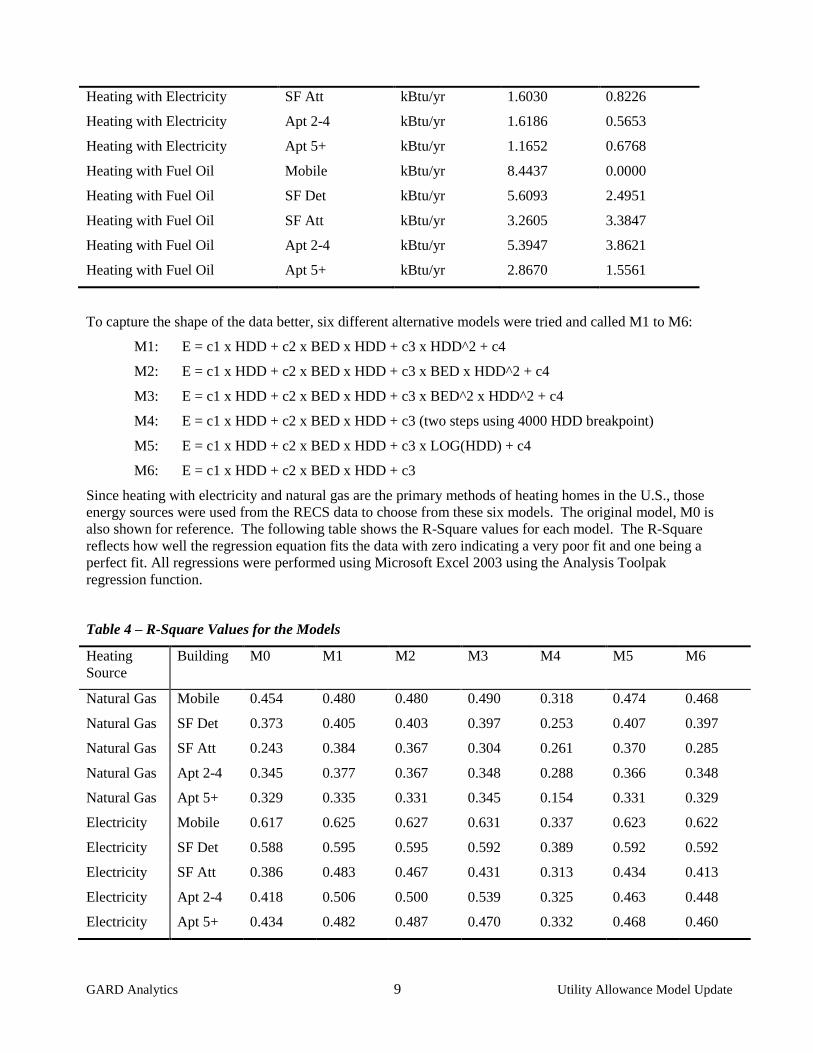
To capture the shape of the data better, six different alternative models were tried and called M1 to M6:
M1: E = c1 x HDD + c2 x BED x HDD + c3 x HDD^2 + c4
M2: E = c1 x HDD + c2 x BED x HDD + c3 x BED x HDD^2 + c4
M3: E = c1 x HDD + c2 x BED x HDD + c3 x BED^2 x HDD^2 + c4
M4: E = c1 x HDD + c2 x BED x HDD + c3 (two steps using 4000 HDD breakpoint)
M5: E = c1 x HDD + c2 x BED x HDD + c3 x LOG(HDD) + c4
M6: E = c1 x HDD + c2 x BED x HDD + c3
Since heating with electricity and natural gas are the primary methods of heating homes in the U.S., those
energy sources were used from the RECS data to choose from these six models. The original model, M0 is
also shown for reference. The following table shows the R-Square values for each model. The R-Square
reflects how well the regression equation fits the data with zero indicating a very poor fit and one being a
perfect fit. All regressions were performed using Microsoft Excel 2003 using the Analysis Toolpak
regression function.
Table 4 – R-Square Values for the Models
Heating
Source
Building M0 M1 M2 M3 M4 M5 M6
Natural Gas Mobile 0.454 0.480 0.480 0.490 0.318 0.474 0.468
Natural Gas SF Det 0.373 0.405 0.403 0.397 0.253 0.407 0.397
Natural Gas SF Att 0.243 0.384 0.367 0.304 0.261 0.370 0.285
Natural Gas Apt 2-4 0.345 0.377 0.367 0.348 0.288 0.366 0.348
Natural Gas Apt 5+ 0.329 0.335 0.331 0.345 0.154 0.331 0.329
Electricity Mobile 0.617 0.625 0.627 0.631 0.337 0.623 0.622
Electricity SF Det 0.588 0.595 0.595 0.592 0.389 0.592 0.592
Electricity SF Att 0.386 0.483 0.467 0.431 0.313 0.434 0.413
Electricity Apt 2-4 0.418 0.506 0.500 0.539 0.325 0.463 0.448
Electricity Apt 5+ 0.434 0.482 0.487 0.470 0.332 0.468 0.460

GARD Analytics 10 Utility Allowance Model Update
Many of the new models offered better R-square values compared to the original (M0) model but the
improvements are relatively small. This indicates that much of the variation in the energy consumption
cannot be explained by only heating degree day and number of bedrooms. Other variables from the RECS
database that were not included may have a significant affect along with the random variation one would
expect with any survey.
For M4, the average value of the R-square for two regressions was used since that model consisted of linear
models above and below 4000 HDD. The M4 model did not predict the heating energy well even though it
was the original form of the model suggested by looking at the data. The reason is that by dividing the data
into two groups, above and below 4000 HDD, the data for each regression was “rounder” than the combined
data set.
The M1 model had the most R-square values that were either the highest or second highest. After that M2,
M3, and M5 were selected less often, in that order.
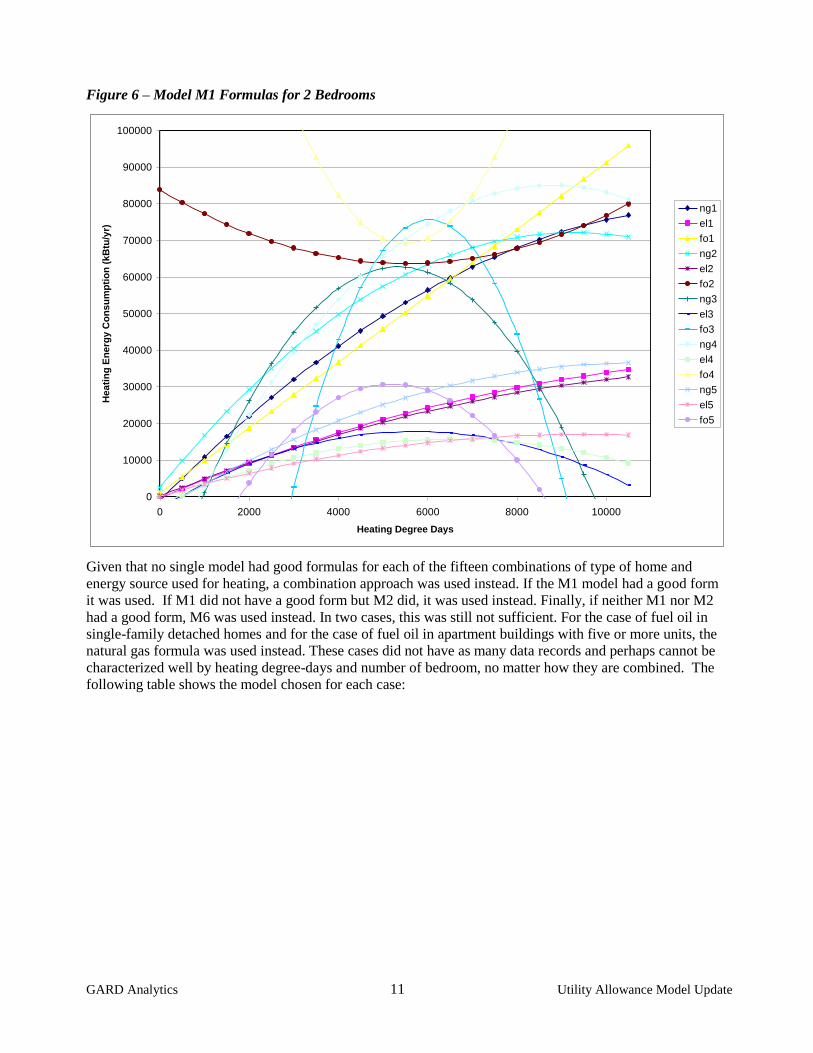
The next step was to examine the actual formulas graphically. The following figure shows an example of the
M1 model for each of the fifteen combinations of type of home and energy source used for heating. While
most climates in the United States are under 10,000 HDD, annually, Alaska ranges from 10,000 HDD in the
more populated areas to almost 20,000 in Barrow on the Artic Ocean. According to the 2001 Residential
Energy Consumption Survey by the U.S. Department of Energy, approximately 10% of the residential energy
use for the United States is for home located above 7000 annual HDD.
The specific curves are not as important as the fact that some of the resulting models are not shaped in a
sensible way. From an engineering perspective, as the number of heating degree days increase the heating
energy consumption should also increase though not always at the same rate. Some of the formulas resulted
in curves that decreased at either low values or at higher values of heating degree days. This test was
repeated for 0, 1, 2, 3, and 4 bedrooms. If the resulting formula did not make engineering sense for all of
these cases, it was eliminated. Unfortunately, for the M1 model, this eliminated 10 of the 15 combinations.
M2, M5 and M6 were also tested with only M6 having reasonable, although linear, formulas for almost all
cases.
GARD Analytics 11 Utility Allowance Model Update
Figure 6 – Model M1 Formulas for 2 Bedrooms
0
10000
20000
30000
40000
50000
60000
70000
80000
90000
100000
0 2000 4000 6000 8000 10000
Heating Degree Days
He
ati
ng
En
erg
y C
on
su
mp
tio
n (
kB
tu/y
r)
ng1
el1
fo1
ng2
el2
fo2
ng3
el3
fo3
ng4
el4
fo4
ng5
el5
fo5
Given that no single model had good formulas for each of the fifteen combinations of type of home and
energy source used for heating, a combination approach was used instead. If the M1 model had a good form
it was used. If M1 did not have a good form but M2 did, it was used instead. Finally, if neither M1 nor M2
had a good form, M6 was used instead. In two cases, this was still not sufficient. For the case of fuel oil in
single-family detached homes and for the case of fuel oil in apartment buildings with five or more units, the
natural gas formula was used instead. These cases did not have as many data records and perhaps cannot be
characterized well by heating degree-days and number of bedroom, no matter how they are combined. The
following table shows the model chosen for each case:

GARD Analytics 12 Utility Allowance Model Update
Table 5 – Model Chosen
Utility or Service Housing type Model Chosen
Heating with Natural Gas Mobile M1
Heating with Electricity Mobile M1
Heating with Fuel Oil Mobile M1
Heating with Natural Gas SF Det M2
Heating with Electricity SF Det M1
Heating with Fuel Oil SF Det M2 (Natural Gas)
Heating with Natural Gas SF Att M6
Heating with Electricity SF Att M6
Heating with Fuel Oil SF Att M6
Heating with Natural Gas Apt 2-4 M2
Heating with Electricity Apt 2-4 M6
Heating with Fuel Oil Apt 2-4 M6
Heating with Natural Gas Apt 5+ M1
Heating with Electricity Apt 5+ M6
Heating with Fuel Oil Apt 5+ M1 (Natural Gas)
GARD Analytics 13 Utility Allowance Model Update
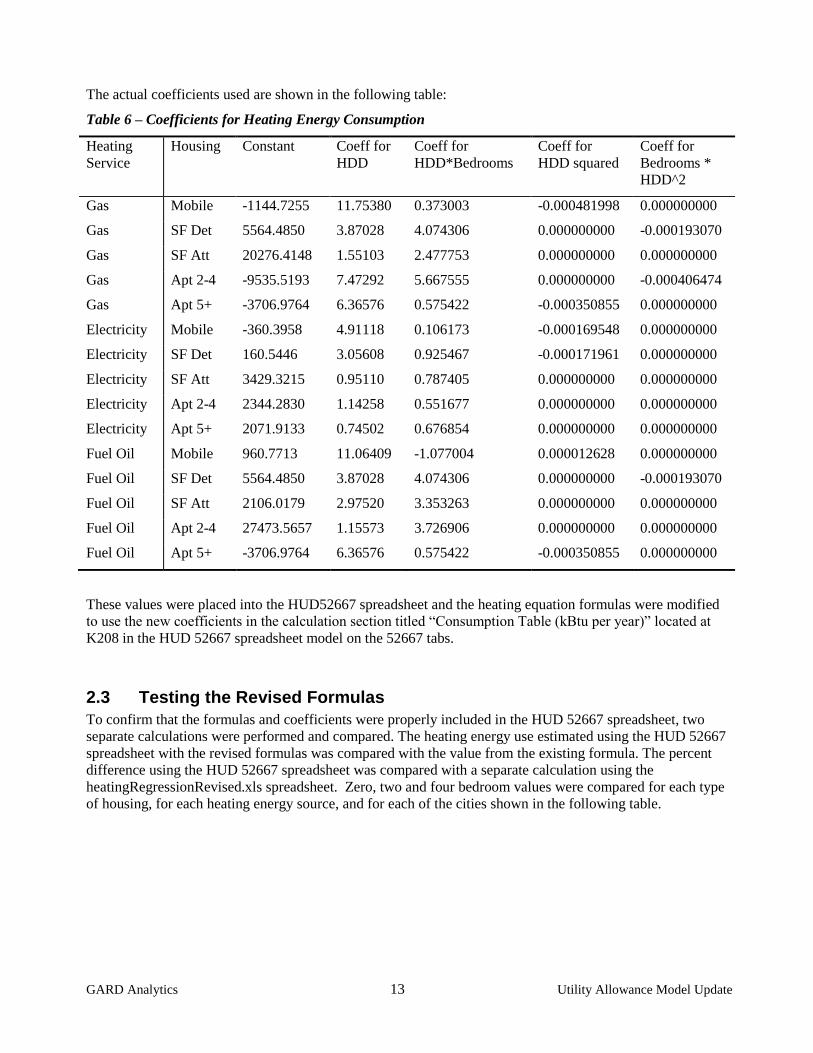
The actual coefficients used are shown in the following table:
Table 6 – Coefficients for Heating Energy Consumption
Heating
Service
Housing Constant Coeff for
HDD
Coeff for
HDD*Bedrooms
Coeff for
HDD squared
Coeff for
Bedrooms *
HDD^2
Gas Mobile -1144.7255 11.75380 0.373003 -0.000481998 0.000000000
Gas SF Det 5564.4850 3.87028 4.074306 0.000000000 -0.000193070
Gas SF Att 20276.4148 1.55103 2.477753 0.000000000 0.000000000
Gas Apt 2-4 -9535.5193 7.47292 5.667555 0.000000000 -0.000406474
Gas Apt 5+ -3706.9764 6.36576 0.575422 -0.000350855 0.000000000
Electricity Mobile -360.3958 4.91118 0.106173 -0.000169548 0.000000000
Electricity SF Det 160.5446 3.05608 0.925467 -0.000171961 0.000000000
Electricity SF Att 3429.3215 0.95110 0.787405 0.000000000 0.000000000
Electricity Apt 2-4 2344.2830 1.14258 0.551677 0.000000000 0.000000000
Electricity Apt 5+ 2071.9133 0.74502 0.676854 0.000000000 0.000000000
Fuel Oil Mobile 960.7713 11.06409 -1.077004 0.000012628 0.000000000
Fuel Oil SF Det 5564.4850 3.87028 4.074306 0.000000000 -0.000193070
Fuel Oil SF Att 2106.0179 2.97520 3.353263 0.000000000 0.000000000
Fuel Oil Apt 2-4 27473.5657 1.15573 3.726906 0.000000000 0.000000000
Fuel Oil Apt 5+ -3706.9764 6.36576 0.575422 -0.000350855 0.000000000
These values were placed into the HUD52667 spreadsheet and the heating equation formulas were modified
to use the new coefficients in the calculation section titled “Consumption Table (kBtu per year)” located at
K208 in the HUD 52667 spreadsheet model on the 52667 tabs.
2.3 Testing the Revised Formulas
To confirm that the formulas and coefficients were properly included in the HUD 52667 spreadsheet, two
separate calculations were performed and compared. The heating energy use estimated using the HUD 52667
spreadsheet with the revised formulas was compared with the value from the existing formula. The percent
difference using the HUD 52667 spreadsheet was compared with a separate calculation using the
heatingRegressionRevised.xls spreadsheet. Zero, two and four bedroom values were compared for each type
of housing, for each heating energy source, and for each of the cities shown in the following table.
GARD Analytics 14 Utility Allowance Model Update
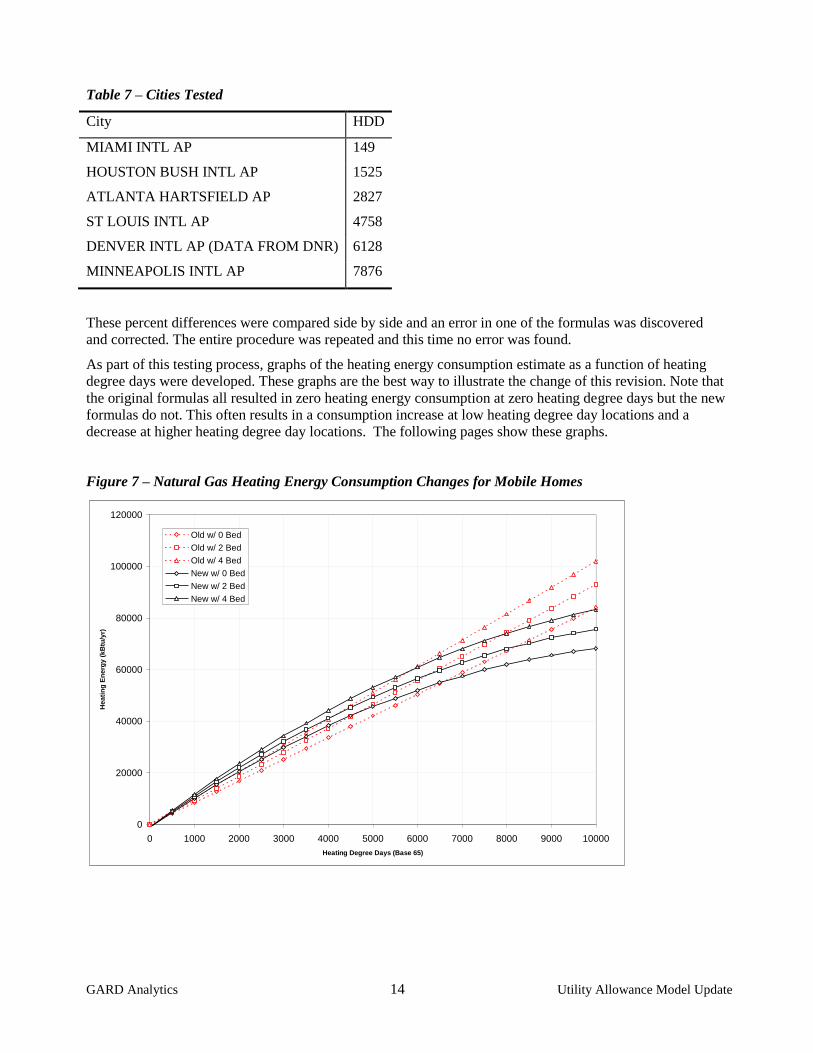
Table 7 – Cities Tested
City HDD
MIAMI INTL AP 149
HOUSTON BUSH INTL AP 1525
ATLANTA HARTSFIELD AP 2827
ST LOUIS INTL AP 4758
DENVER INTL AP (DATA FROM DNR) 6128
MINNEAPOLIS INTL AP 7876
These percent differences were compared side by side and an error in one of the formulas was discovered
and corrected. The entire procedure was repeated and this time no error was found.
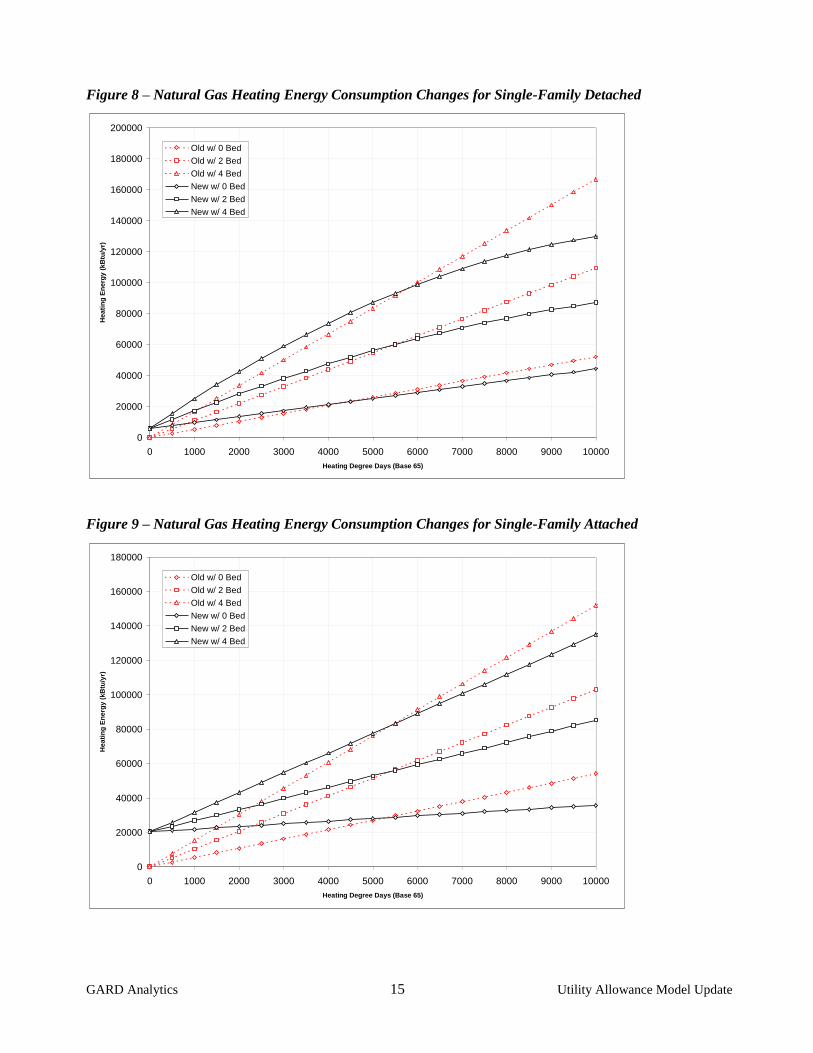
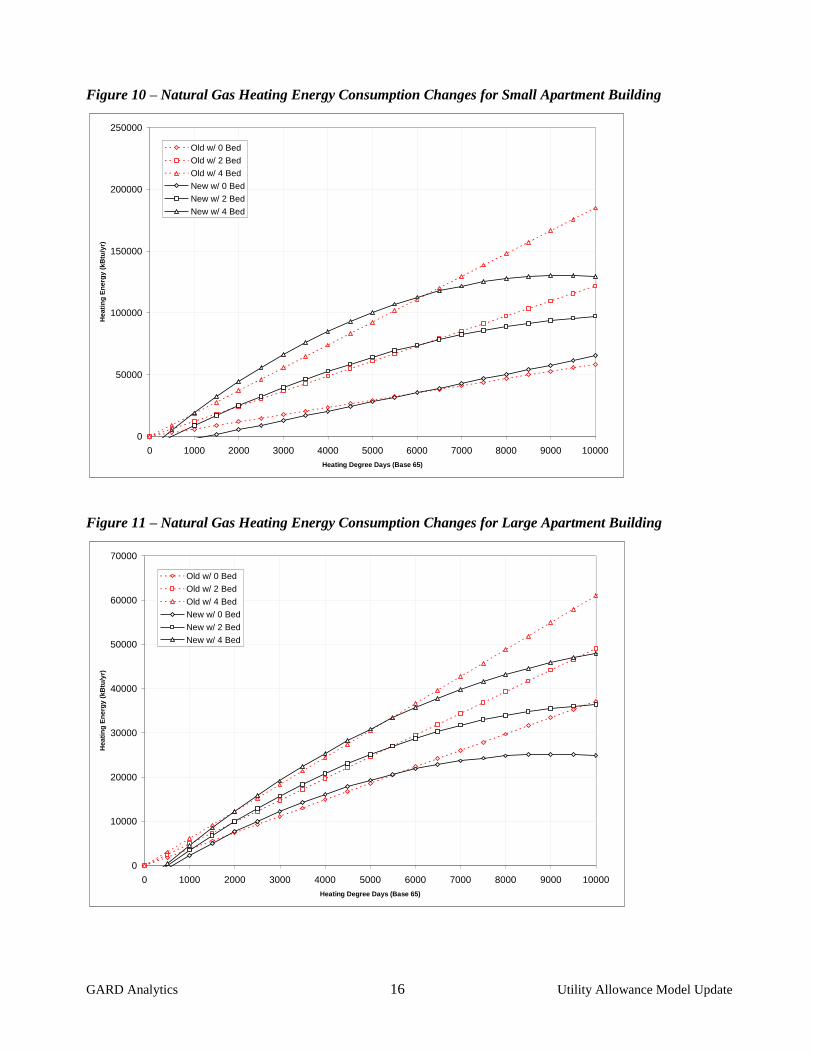
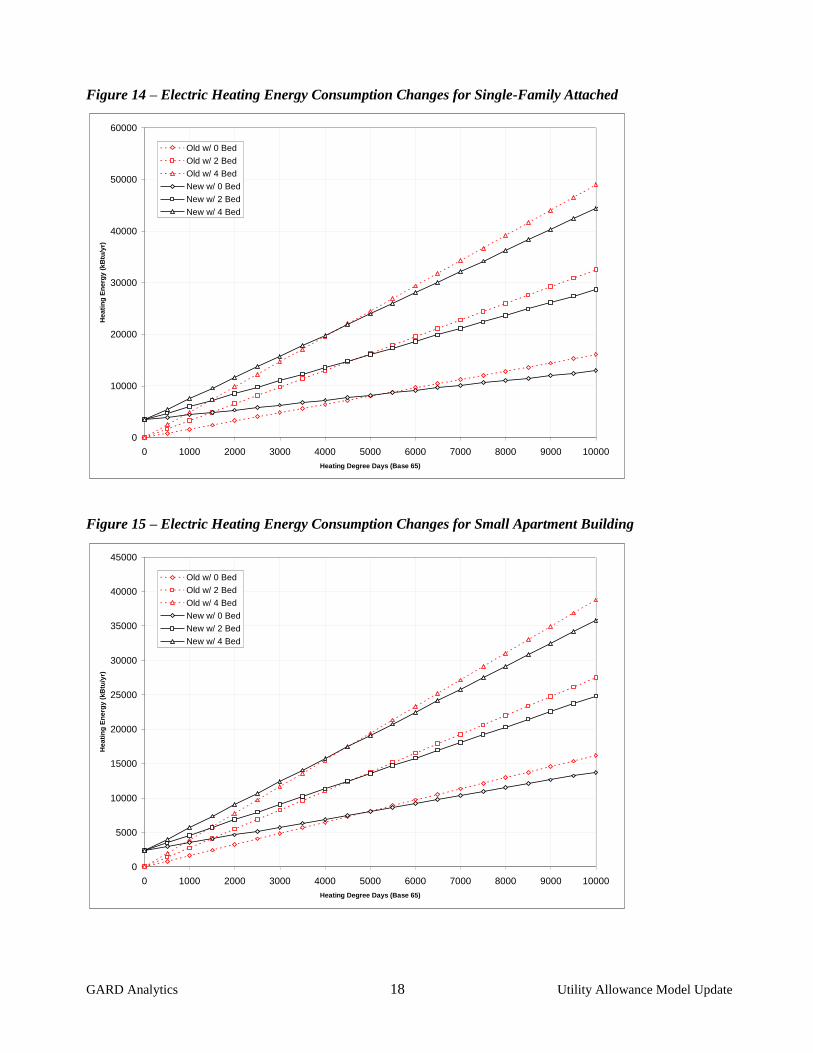
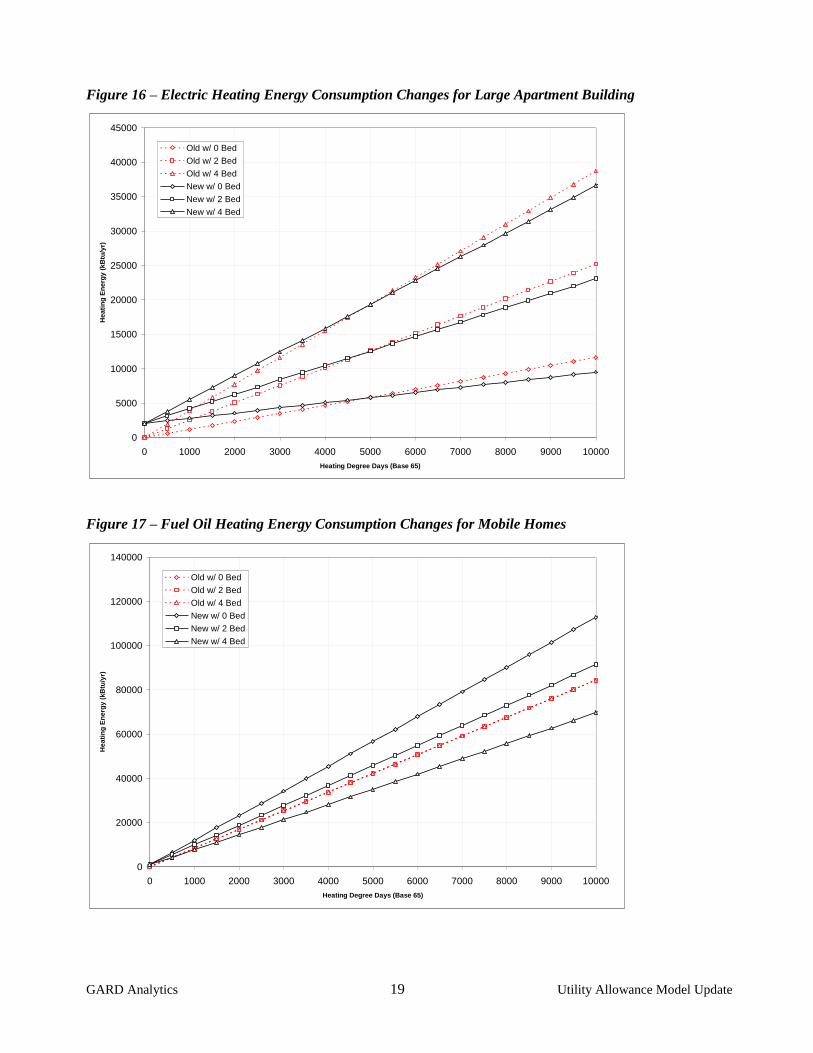
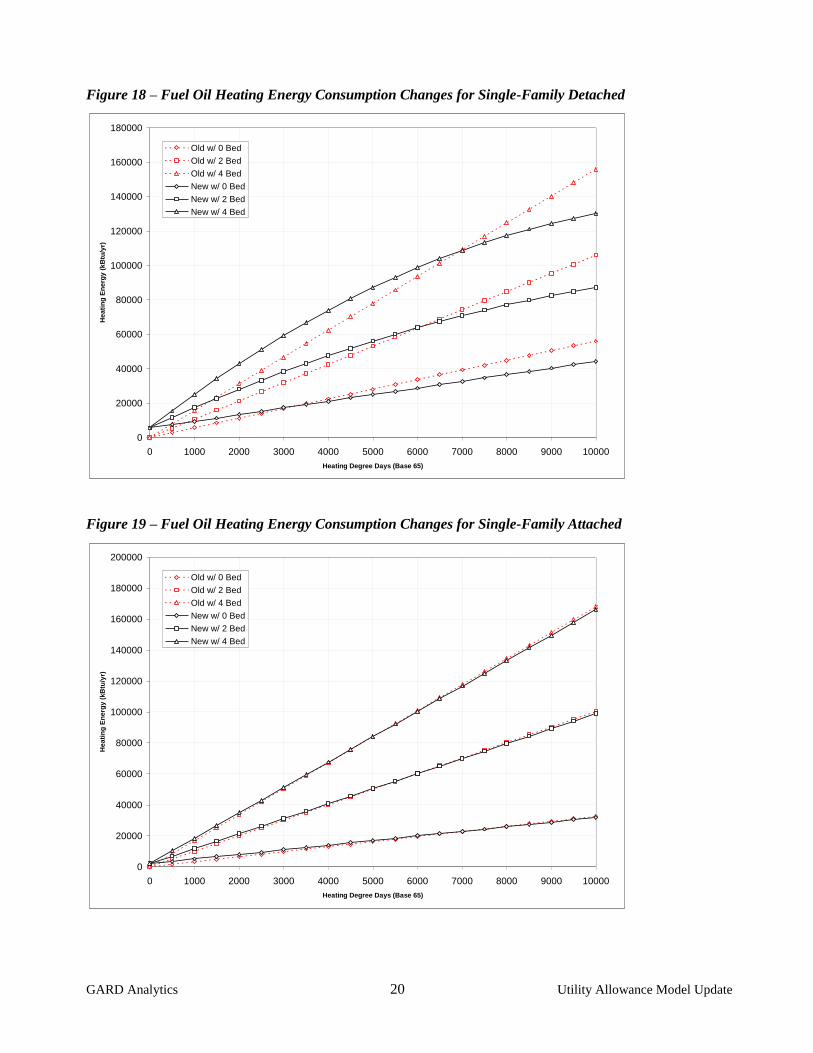
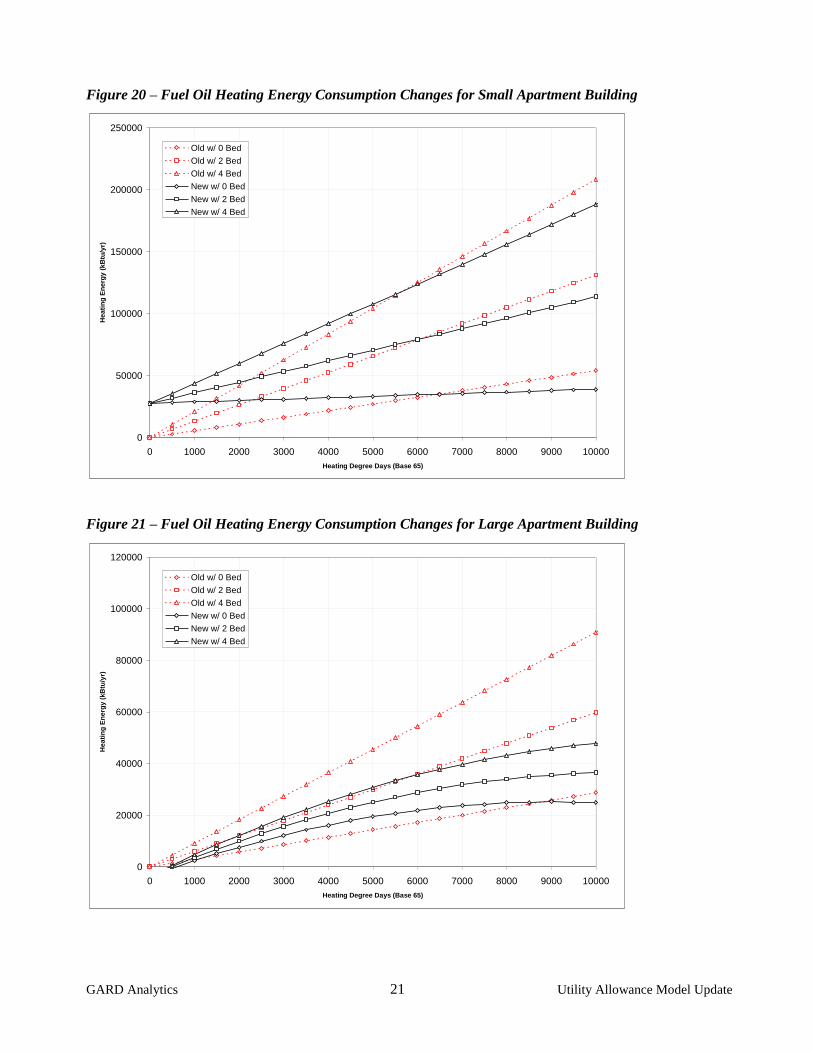
As part of this testing process, graphs of the heating energy consumption estimate as a function of heating
degree days were developed. These graphs are the best way to illustrate the change of this revision. Note that
the original formulas all resulted in zero heating energy consumption at zero heating degree days but the new
formulas do not. This often results in a consumption increase at low heating degree day locations and a
decrease at higher heating degree day locations. The following pages show these graphs.
Figure 7 – Natural Gas Heating Energy Consumption Changes for Mobile Homes
0
20000
40000
60000
80000
100000
120000
0 1000 2000 3000 4000 5000 6000 7000 8000 9000 10000
Heating Degree Days (Base 65)
He
ati
ng
En
erg
y (
kB
tu/y
r)
Old w/ 0 Bed
Old w/ 2 Bed
Old w/ 4 Bed
New w/ 0 Bed
New w/ 2 Bed
New w/ 4 Bed
GARD Analytics 15 Utility Allowance Model Update
Figure 8 – Natural Gas Heating Energy Consumption Changes for Single-Family Detached
0
20000
40000
60000
80000
100000
120000
140000
160000
180000
200000
0 1000 2000 3000 4000 5000 6000 7000 8000 9000 10000
Heating Degree Days (Base 65)
He
ati
ng
En
erg
y (
kB
tu/y
r)
Old w/ 0 Bed
Old w/ 2 Bed
Old w/ 4 Bed
New w/ 0 Bed
New w/ 2 Bed
New w/ 4 Bed
Figure 9 – Natural Gas Heating Energy Consumption Changes for Single-Family Attached
0
20000
40000
60000
80000
100000
120000
140000
160000
180000
0 1000 2000 3000 4000 5000 6000 7000 8000 9000 10000
Heating Degree Days (Base 65)
He
ati
ng
En
erg
y (
kB
tu/y
r)
Old w/ 0 Bed
Old w/ 2 Bed
Old w/ 4 Bed
New w/ 0 Bed
New w/ 2 Bed
New w/ 4 Bed
GARD Analytics 16 Utility Allowance Model Update
Figure 10 – Natural Gas Heating Energy Consumption Changes for Small Apartment Building
0
50000
100000
150000
200000
250000
0 1000 2000 3000 4000 5000 6000 7000 8000 9000 10000
Heating Degree Days (Base 65)
He
ati
ng
En
erg
y (
kB
tu/y
r)
Old w/ 0 Bed
Old w/ 2 Bed
Old w/ 4 Bed
New w/ 0 Bed
New w/ 2 Bed
New w/ 4 Bed
Figure 11 – Natural Gas Heating Energy Consumption Changes for Large Apartment Building
0
10000
20000
30000
40000
50000
60000
70000
0 1000 2000 3000 4000 5000 6000 7000 8000 9000 10000
Heating Degree Days (Base 65)
He
ati
ng
En
erg
y (
kB
tu/y
r)
Old w/ 0 Bed
Old w/ 2 Bed
Old w/ 4 Bed
New w/ 0 Bed
New w/ 2 Bed
New w/ 4 Bed

GARD Analytics 17 Utility Allowance Model Update
Figure 12 – Electric Heating Energy Consumption Changes for Mobile Homes
0
10000
20000
30000
40000
50000
60000
0 1000 2000 3000 4000 5000 6000 7000 8000 9000 10000
Heating Degree Days (Base 65)
He
ati
ng
En
erg
y (
kB
tu/y
r)
Old w/ 0 Bed
Old w/ 2 Bed
Old w/ 4 Bed
New w/ 0 Bed
New w/ 2 Bed
New w/ 4 Bed
Figure 13 – Electric Heating Energy Consumption Changes for Single-Family Detached
0
10000
20000
30000
40000
50000
60000
70000
0 1000 2000 3000 4000 5000 6000 7000 8000 9000 10000
Heating Degree Days (Base 65)
He
ati
ng
En
erg
y (
kB
tu/y
r)
Old w/ 0 Bed
Old w/ 2 Bed
Old w/ 4 Bed
New w/ 0 Bed
New w/ 2 Bed
New w/ 4 Bed
GARD Analytics 18 Utility Allowance Model Update
Figure 14 – Electric Heating Energy Consumption Changes for Single-Family Attached
0
10000
20000
30000
40000
50000
60000
0 1000 2000 3000 4000 5000 6000 7000 8000 9000 10000
Heating Degree Days (Base 65)
He
ati
ng
En
erg
y (
kB
tu/y
r)
Old w/ 0 Bed
Old w/ 2 Bed
Old w/ 4 Bed
New w/ 0 Bed
New w/ 2 Bed
New w/ 4 Bed
Figure 15 – Electric Heating Energy Consumption Changes for Small Apartment Building
0
5000
10000
15000
20000
25000
30000
35000
40000
45000
0 1000 2000 3000 4000 5000 6000 7000 8000 9000 10000
Heating Degree Days (Base 65)
He
ati
ng
En
erg
y (
kB
tu/y
r)
Old w/ 0 Bed
Old w/ 2 Bed
Old w/ 4 Bed
New w/ 0 Bed
New w/ 2 Bed
New w/ 4 Bed
GARD Analytics 19 Utility Allowance Model Update
Figure 16 – Electric Heating Energy Consumption Changes for Large Apartment Building
0
5000
10000
15000
20000
25000
30000
35000
40000
45000
0 1000 2000 3000 4000 5000 6000 7000 8000 9000 10000
Heating Degree Days (Base 65)
He
ati
ng
En
erg
y (
kB
tu/y
r)
Old w/ 0 Bed
Old w/ 2 Bed
Old w/ 4 Bed
New w/ 0 Bed
New w/ 2 Bed
New w/ 4 Bed
Figure 17 – Fuel Oil Heating Energy Consumption Changes for Mobile Homes
0
20000
40000
60000
80000
100000
120000
140000
0 1000 2000 3000 4000 5000 6000 7000 8000 9000 10000
Heating Degree Days (Base 65)
He
ati
ng
En
erg
y (
kB
tu/y
r)
Old w/ 0 Bed
Old w/ 2 Bed
Old w/ 4 Bed
New w/ 0 Bed
New w/ 2 Bed
New w/ 4 Bed
GARD Analytics 20 Utility Allowance Model Update
Figure 18 – Fuel Oil Heating Energy Consumption Changes for Single-Family Detached
0
20000
40000
60000
80000
100000
120000
140000
160000
180000
0 1000 2000 3000 4000 5000 6000 7000 8000 9000 10000
Heating Degree Days (Base 65)
He
ati
ng
En
erg
y (
kB
tu/y
r)
Old w/ 0 Bed
Old w/ 2 Bed
Old w/ 4 Bed
New w/ 0 Bed
New w/ 2 Bed
New w/ 4 Bed
Figure 19 – Fuel Oil Heating Energy Consumption Changes for Single-Family Attached
0
20000
40000
60000
80000
100000
120000
140000
160000
180000
200000
0 1000 2000 3000 4000 5000 6000 7000 8000 9000 10000
Heating Degree Days (Base 65)
He
ati
ng
En
erg
y (
kB
tu/y
r)
Old w/ 0 Bed
Old w/ 2 Bed
Old w/ 4 Bed
New w/ 0 Bed
New w/ 2 Bed
New w/ 4 Bed
GARD Analytics 21 Utility Allowance Model Update
Figure 20 – Fuel Oil Heating Energy Consumption Changes for Small Apartment Building
0
50000
100000
150000
200000
250000
0 1000 2000 3000 4000 5000 6000 7000 8000 9000 10000
Heating Degree Days (Base 65)
He
ati
ng
En
erg
y (
kB
tu/y
r)
Old w/ 0 Bed
Old w/ 2 Bed
Old w/ 4 Bed
New w/ 0 Bed
New w/ 2 Bed
New w/ 4 Bed
Figure 21 – Fuel Oil Heating Energy Consumption Changes for Large Apartment Building
0
20000
40000
60000
80000
100000
120000
0 1000 2000 3000 4000 5000 6000 7000 8000 9000 10000
Heating Degree Days (Base 65)
He
ati
ng
En
erg
y (
kB
tu/y
r)
Old w/ 0 Bed
Old w/ 2 Bed
Old w/ 4 Bed
New w/ 0 Bed
New w/ 2 Bed
New w/ 4 Bed
GARD Analytics 22 Utility Allowance Model Update
3. Compare Allowances
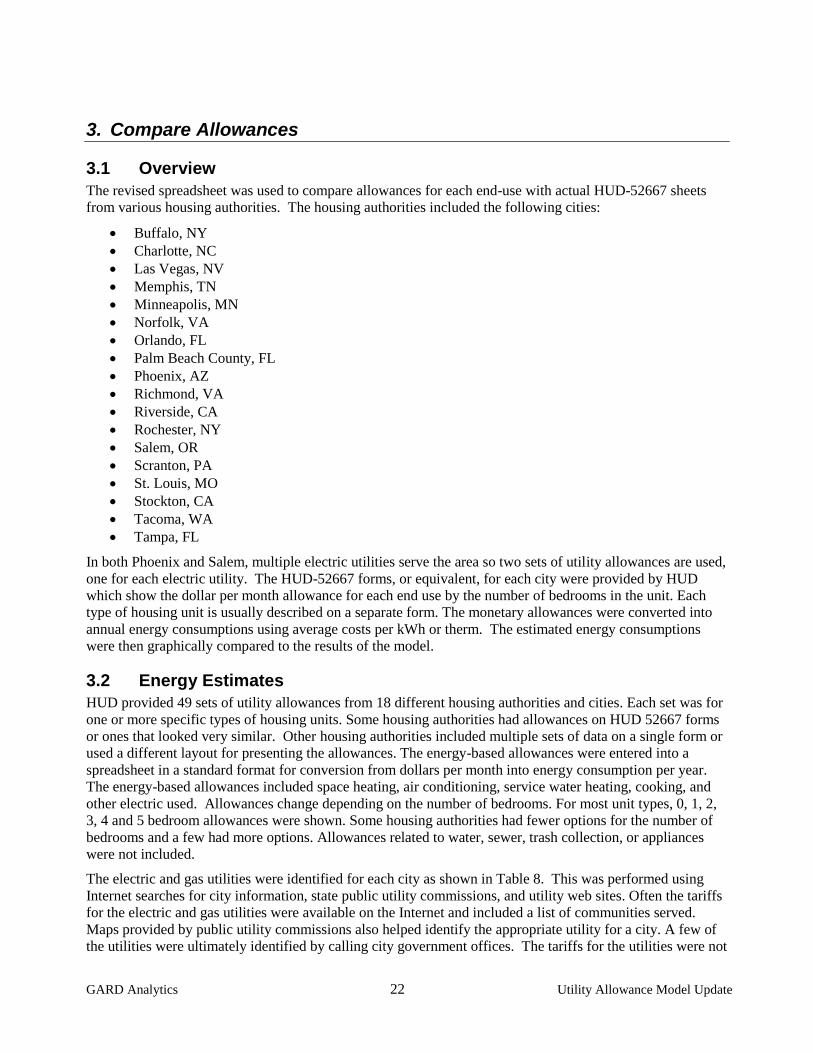
3.1 Overview
The revised spreadsheet was used to compare allowances for each end-use with actual HUD-52667 sheets
from various housing authorities. The housing authorities included the following cities:
Buffalo, NY
Charlotte, NC
Las Vegas, NV
Memphis, TN
Minneapolis, MN
Norfolk, VA
Orlando, FL
Palm Beach County, FL
Phoenix, AZ
Richmond, VA
Riverside, CA
Rochester, NY
Salem, OR
Scranton, PA
St. Louis, MO
Stockton, CA
Tacoma, WA
Tampa, FL
In both Phoenix and Salem, multiple electric utilities serve the area so two sets of utility allowances are used,
one for each electric utility. The HUD-52667 forms, or equivalent, for each city were provided by HUD
which show the dollar per month allowance for each end use by the number of bedrooms in the unit. Each
type of housing unit is usually described on a separate form. The monetary allowances were converted into
annual energy consumptions using average costs per kWh or therm. The estimated energy consumptions
were then graphically compared to the results of the model.
3.2 Energy Estimates
HUD provided 49 sets of utility allowances from 18 different housing authorities and cities. Each set was for
one or more specific types of housing units. Some housing authorities had allowances on HUD 52667 forms
or ones that looked very similar. Other housing authorities included multiple sets of data on a single form or
used a different layout for presenting the allowances. The energy-based allowances were entered into a
spreadsheet in a standard format for conversion from dollars per month into energy consumption per year.
The energy-based allowances included space heating, air conditioning, service water heating, cooking, and
other electric used. Allowances change depending on the number of bedrooms. For most unit types, 0, 1, 2,
3, 4 and 5 bedroom allowances were shown. Some housing authorities had fewer options for the number of
bedrooms and a few had more options. Allowances related to water, sewer, trash collection, or appliances
were not included.
The electric and gas utilities were identified for each city as shown in Table 8. This was performed using
Internet searches for city information, state public utility commissions, and utility web sites. Often the tariffs
for the electric and gas utilities were available on the Internet and included a list of communities served.
Maps provided by public utility commissions also helped identify the appropriate utility for a city. A few of
the utilities were ultimately identified by calling city government offices. The tariffs for the utilities were not

GARD Analytics 23 Utility Allowance Model Update
used directly. Tariffs are complicated and require significant interpretation and the level of accuracy gained
by using actual tariffs was not consistent with other assumptions in the comparison. In addition, the utility
allowances were not using the latest rates and utilities rarely post historical tariffs.
Table 8 – Electric and Gas Utilities
Location Electric Utility Name Gas Utility
Tampa FL TECO Tampa Electric TECO People Energy
Orlando FL Progress energy TECO People Energy
Palm Beach County FL Florida Power and Light Florida Public Utilities Company
Richmond VA Dominion Virginia Power Virginia natural gas
Norfolk VA Dominion Virginia Power Virginia natural gas
Charlotte NC Duke Energy Piedmont Natural Gas
Scranton PA PPL UGI Penn Natural Gas
Rochester NY Rochester Gas & Electric Corp. Rochester Gas & Electric Corp.
Buffalo NY National Grid National Fuel Gas Distribution Co.
Minneapolis MN Xcel Energy CenterPoint Energy/Minnegasco
Memphis TN Memphis Light Gas and Water Memphis Light Gas and Water
St. Louis MO Ameren LaClede Gas
Las Vegas NV Nevada Power Southwest Gas
Phoenix AZ - APS Arizona Public Service Southwest Gas
Phoenix AZ - SRP Salt River Project Southwest Gas
Riverside CA Riverside Public Utilities Southern California Gas
Salem OR – PGE Portland General Electric Northwest Natural Gas
Salem OR – SE Salem Electric Northwest Natural Gas
Tacoma WA Tacoma Power Puget Sound Energy
Stockton CA Pacific Gas and Electric Pacific Gas and Electric
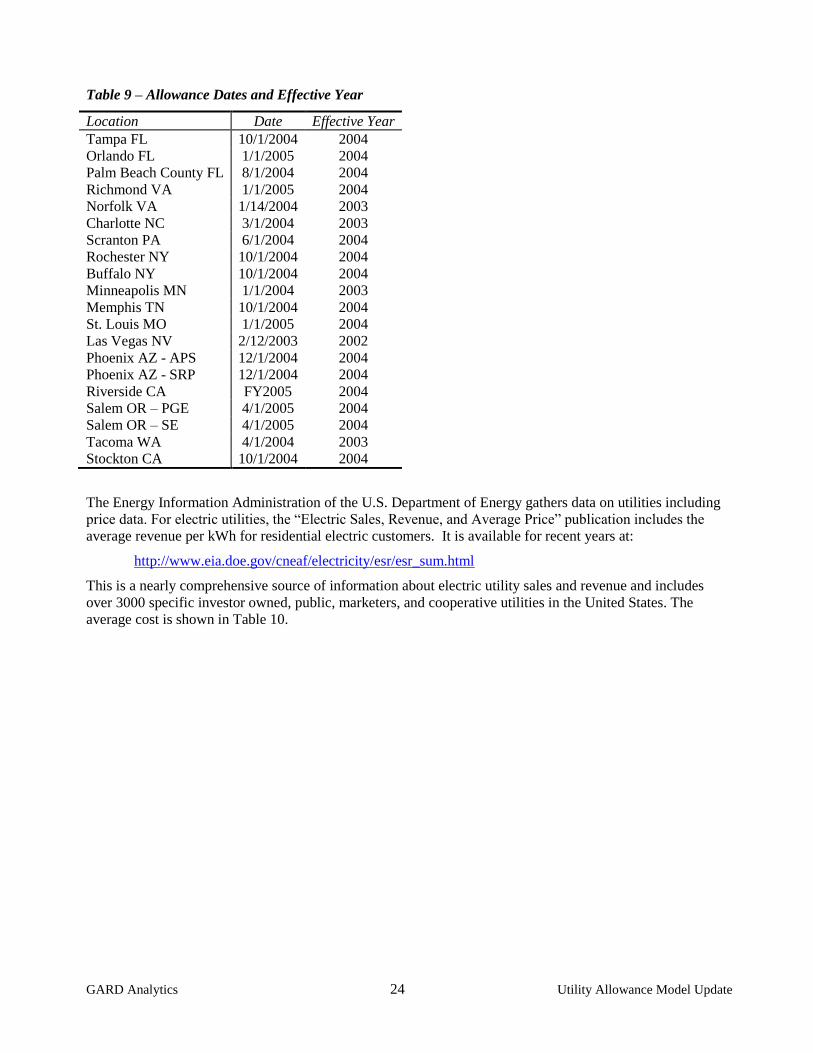
The dates for the allowances are shown in Table 9. Also shown in Table 9 is the effective year for the
average utility price data. The average utility price data is computed annually so the effective year is either
the previous year if before June 1 or the current year if the date is after June 1.
GARD Analytics 24 Utility Allowance Model Update
Table 9 – Allowance Dates and Effective Year
Location Date Effective Year
Tampa FL 10/1/2004 2004
Orlando FL 1/1/2005 2004
Palm Beach County FL 8/1/2004 2004
Richmond VA 1/1/2005 2004
Norfolk VA 1/14/2004 2003
Charlotte NC 3/1/2004 2003
Scranton PA 6/1/2004 2004
Rochester NY 10/1/2004 2004
Buffalo NY 10/1/2004 2004
Minneapolis MN 1/1/2004 2003
Memphis TN 10/1/2004 2004
St. Louis MO 1/1/2005 2004
Las Vegas NV 2/12/2003 2002
Phoenix AZ - APS 12/1/2004 2004
Phoenix AZ - SRP 12/1/2004 2004
Riverside CA FY2005 2004
Salem OR – PGE 4/1/2005 2004
Salem OR – SE 4/1/2005 2004
Tacoma WA 4/1/2004 2003
Stockton CA 10/1/2004 2004
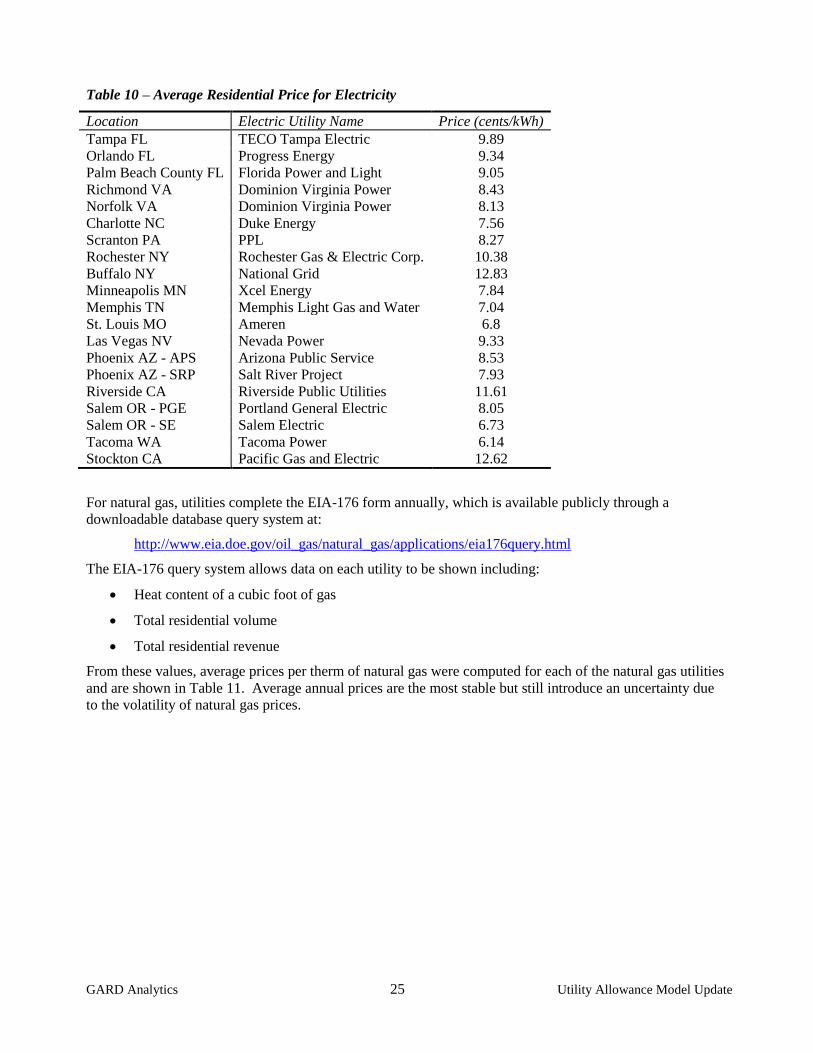
The Energy Information Administration of the U.S. Department of Energy gathers data on utilities including
price data. For electric utilities, the “Electric Sales, Revenue, and Average Price” publication includes the
average revenue per kWh for residential electric customers. It is available for recent years at:
http://www.eia.doe.gov/cneaf/electricity/esr/esr_sum.html
This is a nearly comprehensive source of information about electric utility sales and revenue and includes
over 3000 specific investor owned, public, marketers, and cooperative utilities in the United States. The
average cost is shown in Table 10.
GARD Analytics 25 Utility Allowance Model Update
Table 10 – Average Residential Price for Electricity
Location Electric Utility Name Price (cents/kWh)
Tampa FL TECO Tampa Electric 9.89
Orlando FL Progress Energy 9.34
Palm Beach County FL Florida Power and Light 9.05
Richmond VA Dominion Virginia Power 8.43
Norfolk VA Dominion Virginia Power 8.13
Charlotte NC Duke Energy 7.56
Scranton PA PPL 8.27
Rochester NY Rochester Gas & Electric Corp. 10.38
Buffalo NY National Grid 12.83
Minneapolis MN Xcel Energy 7.84
Memphis TN Memphis Light Gas and Water 7.04
St. Louis MO Ameren 6.8
Las Vegas NV Nevada Power 9.33
Phoenix AZ - APS Arizona Public Service 8.53
Phoenix AZ - SRP Salt River Project 7.93
Riverside CA Riverside Public Utilities 11.61
Salem OR - PGE Portland General Electric 8.05
Salem OR - SE Salem Electric 6.73
Tacoma WA Tacoma Power 6.14
Stockton CA Pacific Gas and Electric 12.62
For natural gas, utilities complete the EIA-176 form annually, which is available publicly through a
downloadable database query system at:
http://www.eia.doe.gov/oil_gas/natural_gas/applications/eia176query.html
The EIA-176 query system allows data on each utility to be shown including:
Heat content of a cubic foot of gas
Total residential volume
Total residential revenue
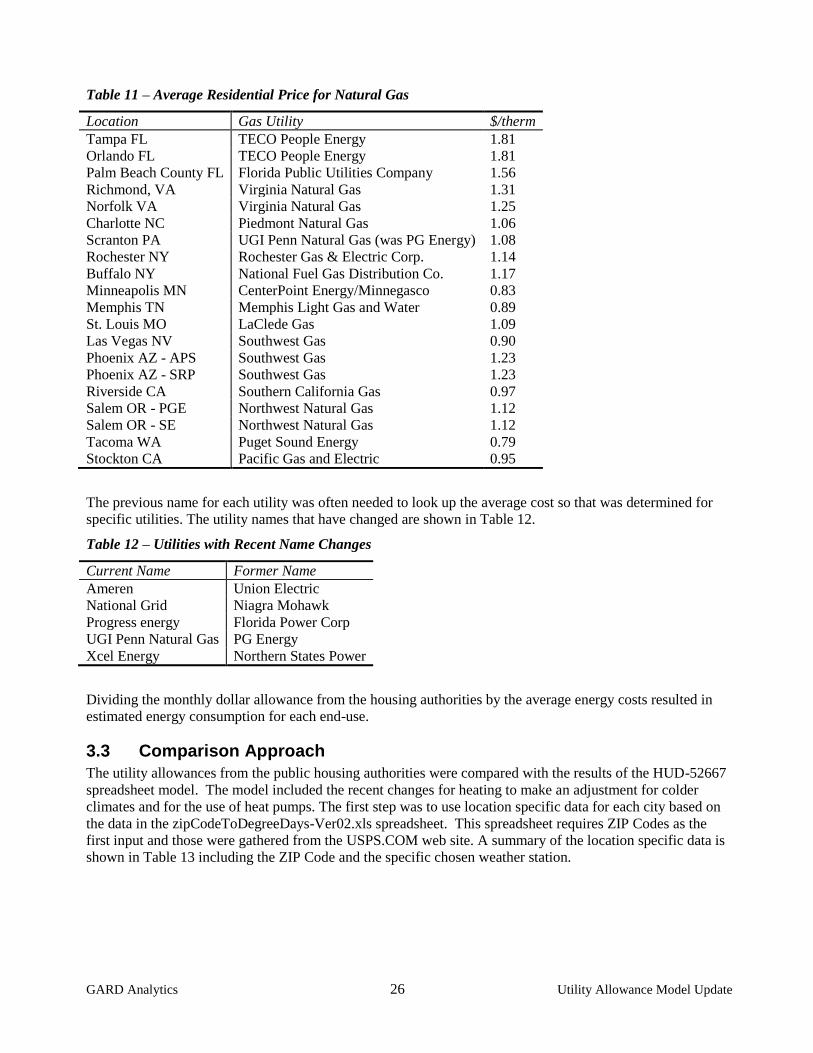
From these values, average prices per therm of natural gas were computed for each of the natural gas utilities
and are shown in Table 11. Average annual prices are the most stable but still introduce an uncertainty due
to the volatility of natural gas prices.
GARD Analytics 26 Utility Allowance Model Update
Table 11 – Average Residential Price for Natural Gas
Location Gas Utility $/therm
Tampa FL TECO People Energy 1.81
Orlando FL TECO People Energy 1.81
Palm Beach County FL Florida Public Utilities Company 1.56
Richmond, VA Virginia Natural Gas 1.31
Norfolk VA Virginia Natural Gas 1.25
Charlotte NC Piedmont Natural Gas 1.06
Scranton PA UGI Penn Natural Gas (was PG Energy) 1.08
Rochester NY Rochester Gas & Electric Corp. 1.14
Buffalo NY National Fuel Gas Distribution Co. 1.17
Minneapolis MN CenterPoint Energy/Minnegasco 0.83
Memphis TN Memphis Light Gas and Water 0.89
St. Louis MO LaClede Gas 1.09
Las Vegas NV Southwest Gas 0.90
Phoenix AZ - APS Southwest Gas 1.23
Phoenix AZ - SRP Southwest Gas 1.23
Riverside CA Southern California Gas 0.97
Salem OR - PGE Northwest Natural Gas 1.12
Salem OR - SE Northwest Natural Gas 1.12
Tacoma WA Puget Sound Energy 0.79
Stockton CA Pacific Gas and Electric 0.95
The previous name for each utility was often needed to look up the average cost so that was determined for
specific utilities. The utility names that have changed are shown in Table 12.
Table 12 – Utilities with Recent Name Changes
Current Name Former Name
Ameren Union Electric
National Grid Niagra Mohawk
Progress energy Florida Power Corp
UGI Penn Natural Gas PG Energy
Xcel Energy Northern States Power
Dividing the monthly dollar allowance from the housing authorities by the average energy costs resulted in
estimated energy consumption for each end-use.
3.3 Comparison Approach
The utility allowances from the public housing authorities were compared with the results of the HUD-52667
spreadsheet model. The model included the recent changes for heating to make an adjustment for colder
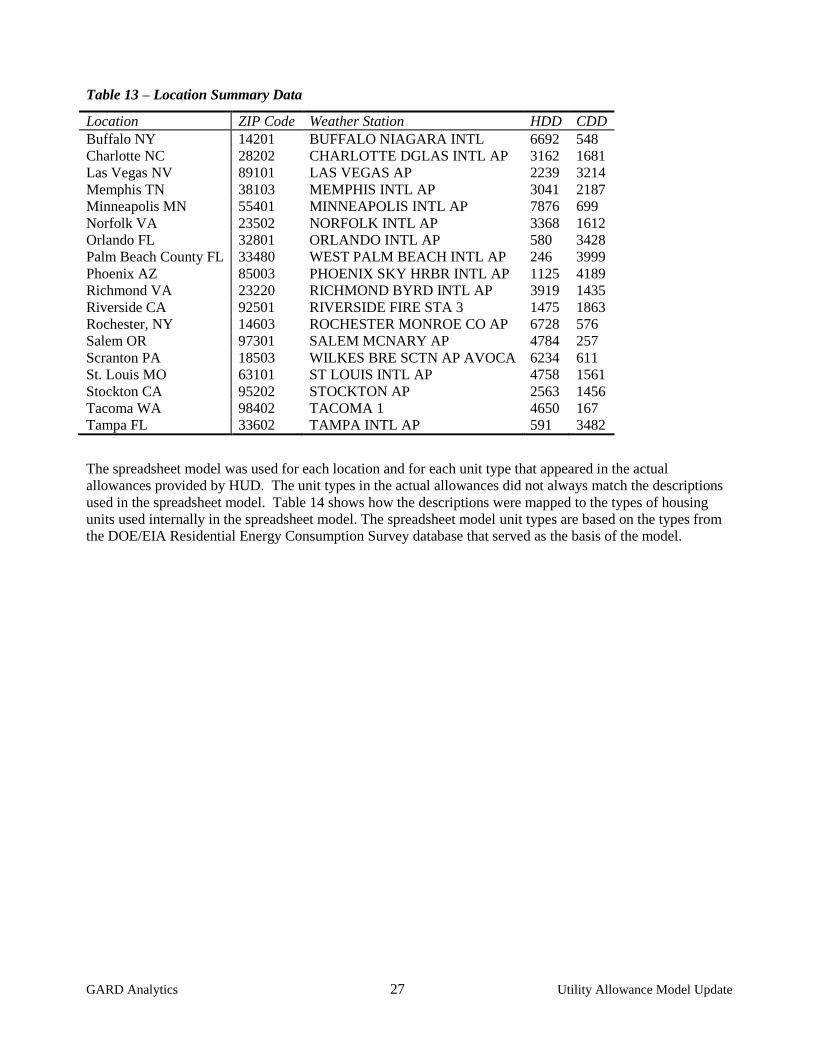
climates and for the use of heat pumps. The first step was to use location specific data for each city based on
the data in the zipCodeToDegreeDays-Ver02.xls spreadsheet. This spreadsheet requires ZIP Codes as the
first input and those were gathered from the USPS.COM web site. A summary of the location specific data is
shown in Table 13 including the ZIP Code and the specific chosen weather station.
GARD Analytics 27 Utility Allowance Model Update
Table 13 – Location Summary Data
Location ZIP Code Weather Station HDD CDD
Buffalo NY 14201 BUFFALO NIAGARA INTL 6692 548
Charlotte NC 28202 CHARLOTTE DGLAS INTL AP 3162 1681
Las Vegas NV 89101 LAS VEGAS AP 2239 3214
Memphis TN 38103 MEMPHIS INTL AP 3041 2187
Minneapolis MN 55401 MINNEAPOLIS INTL AP 7876 699
Norfolk VA 23502 NORFOLK INTL AP 3368 1612
Orlando FL 32801 ORLANDO INTL AP 580 3428
Palm Beach County FL 33480 WEST PALM BEACH INTL AP 246 3999
Phoenix AZ 85003 PHOENIX SKY HRBR INTL AP 1125 4189
Richmond VA 23220 RICHMOND BYRD INTL AP 3919 1435
Riverside CA 92501 RIVERSIDE FIRE STA 3 1475 1863
Rochester, NY 14603 ROCHESTER MONROE CO AP 6728 576
Salem OR 97301 SALEM MCNARY AP 4784 257
Scranton PA 18503 WILKES BRE SCTN AP AVOCA 6234 611
St. Louis MO 63101 ST LOUIS INTL AP 4758 1561
Stockton CA 95202 STOCKTON AP 2563 1456
Tacoma WA 98402 TACOMA 1 4650 167
Tampa FL 33602 TAMPA INTL AP 591 3482
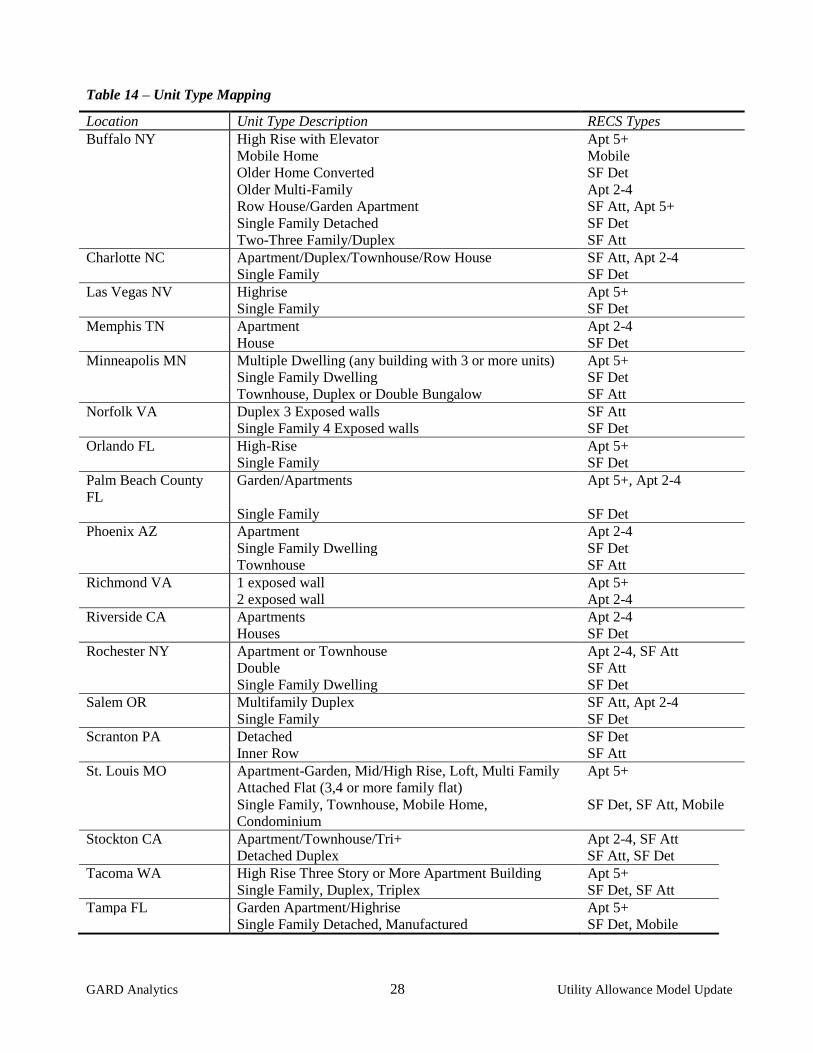
The spreadsheet model was used for each location and for each unit type that appeared in the actual
allowances provided by HUD. The unit types in the actual allowances did not always match the descriptions
used in the spreadsheet model. Table 14 shows how the descriptions were mapped to the types of housing
units used internally in the spreadsheet model. The spreadsheet model unit types are based on the types from
the DOE/EIA Residential Energy Consumption Survey database that served as the basis of the model.
GARD Analytics 28 Utility Allowance Model Update
Table 14 – Unit Type Mapping
Location Unit Type Description RECS Types
Buffalo NY High Rise with Elevator Apt 5+
Mobile Home Mobile
Older Home Converted SF Det
Older Multi-Family Apt 2-4
Row House/Garden Apartment SF Att, Apt 5+
Single Family Detached SF Det
Two-Three Family/Duplex SF Att
Charlotte NC Apartment/Duplex/Townhouse/Row House SF Att, Apt 2-4
Single Family SF Det
Las Vegas NV Highrise Apt 5+
Single Family SF Det
Memphis TN Apartment Apt 2-4
House SF Det
Minneapolis MN Multiple Dwelling (any building with 3 or more units) Apt 5+
Single Family Dwelling SF Det
Townhouse, Duplex or Double Bungalow SF Att
Norfolk VA Duplex 3 Exposed walls SF Att
Single Family 4 Exposed walls SF Det
Orlando FL High-Rise Apt 5+
Single Family SF Det
Palm Beach County
FL
Garden/Apartments Apt 5+, Apt 2-4
Single Family SF Det
Phoenix AZ Apartment Apt 2-4
Single Family Dwelling SF Det
Townhouse SF Att
Richmond VA 1 exposed wall Apt 5+
2 exposed wall Apt 2-4
Riverside CA Apartments Apt 2-4
Houses SF Det
Rochester NY Apartment or Townhouse Apt 2-4, SF Att
Double SF Att
Single Family Dwelling SF Det
Salem OR Multifamily Duplex SF Att, Apt 2-4
Single Family SF Det
Scranton PA Detached SF Det
Inner Row SF Att
St. Louis MO Apartment-Garden, Mid/High Rise, Loft, Multi Family
Attached Flat (3,4 or more family flat)
Apt 5+
Single Family, Townhouse, Mobile Home,
Condominium
SF Det, SF Att, Mobile
Stockton CA Apartment/Townhouse/Tri+ Apt 2-4, SF Att
Detached Duplex SF Att, SF Det
Tacoma WA High Rise Three Story or More Apartment Building Apt 5+
Single Family, Duplex, Triplex SF Det, SF Att
Tampa FL Garden Apartment/Highrise Apt 5+
Single Family Detached, Manufactured SF Det, Mobile

GARD Analytics 29 Utility Allowance Model Update
3.4 Comparison and Conclusion
The spreadsheet model results, prior to being converted into energy costs were used based on the values
shown in the section titled “Consumption Table (kBtu per year)” starting at cell K208 on each building type
tab of the spreadsheet. The actual allowances and the modeled results used the same units so they could be
directly compared. The method of comparison chosen was to show the values of the actual allowances and
the modeled allowances on the same graph so they could be visually compared. The model results are shown
as either a single line if they do not change by climate such as for cooking or other electric use or by a high
and low line showing the complete range of model results for heating, air-conditioning, and water heating
end-uses when climate variation is a factor. The high and low lines were calculated by looking at the end-use
across the same climates as the actual results and choosing the highest and lowest climate for each end use.
The actual results are shown for each housing authority that had data for the housing unit and end-use shown.
Ideally, the actual results from each housing authority would appear between the high and low lines on
graphs that show them.
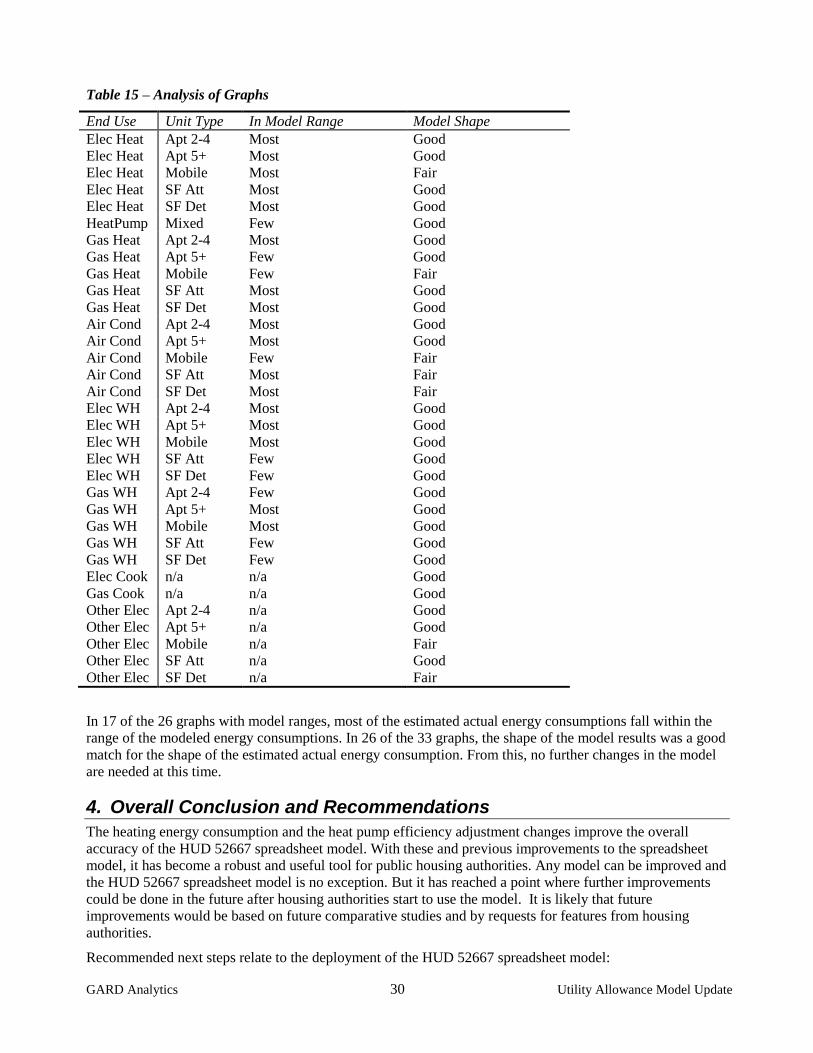
The Appendix A shows the results of each end-use and unit type. The Appendix is an exhaustive exploration
of the data which shows every graph produced during the analysis. The table below qualitatively shows how
well the model matches the range and shape the of estimated actual energy consumptions.
GARD Analytics 30 Utility Allowance Model Update
Table 15 – Analysis of Graphs
End Use Unit Type In Model Range Model Shape
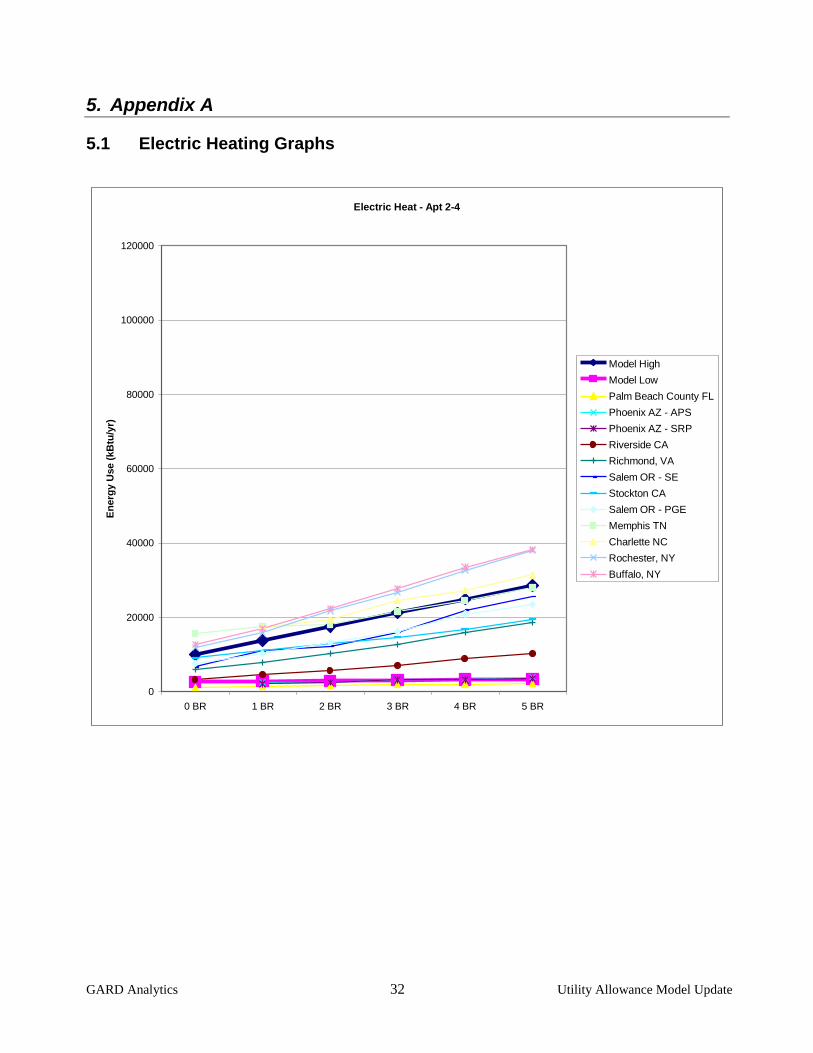
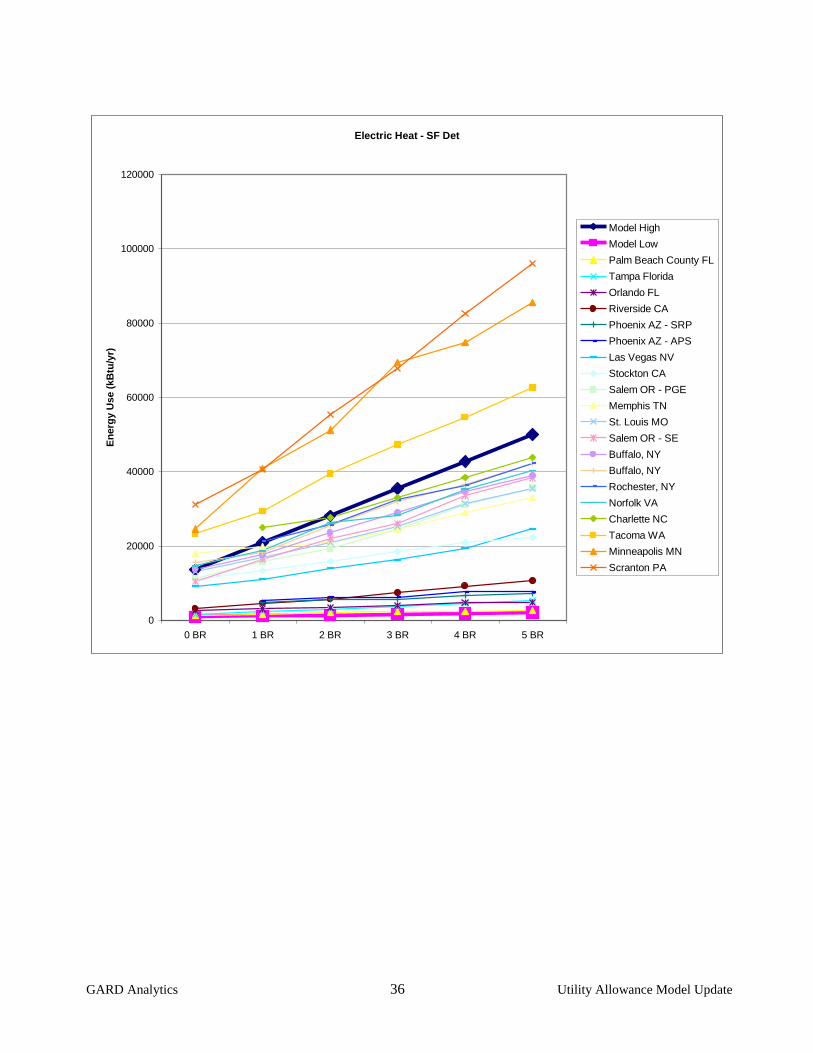
Elec Heat Apt 2-4 Most Good
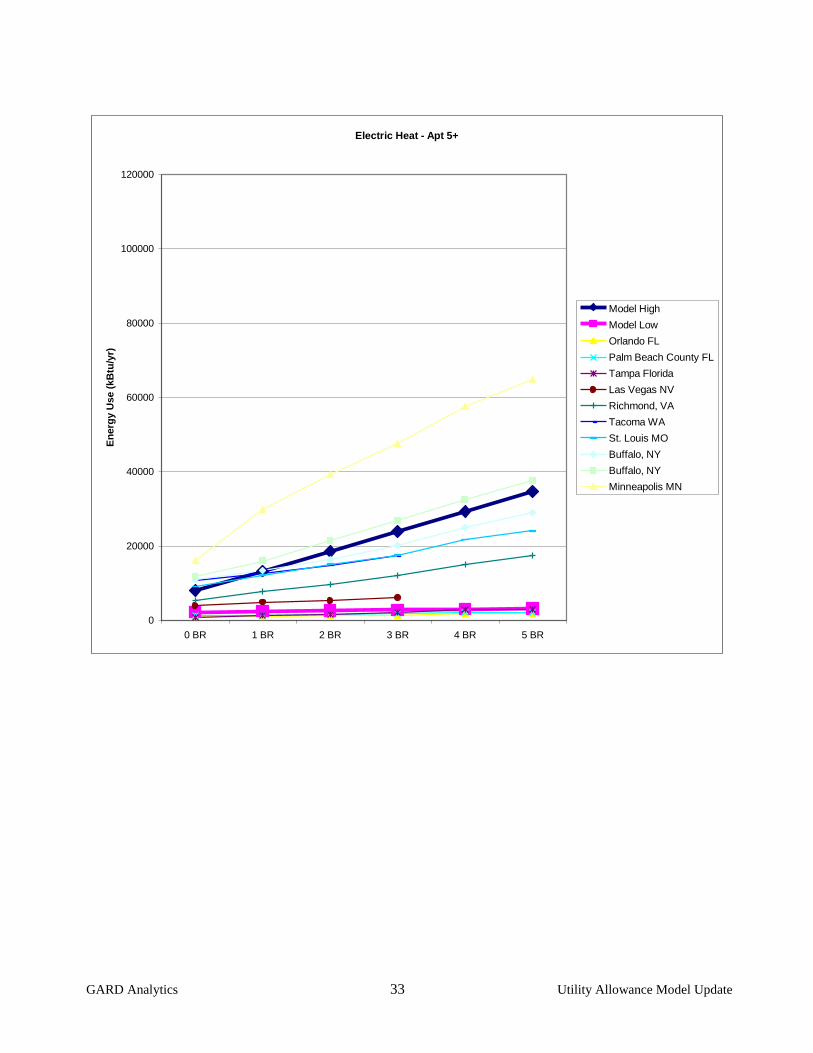
Elec Heat Apt 5+ Most Good
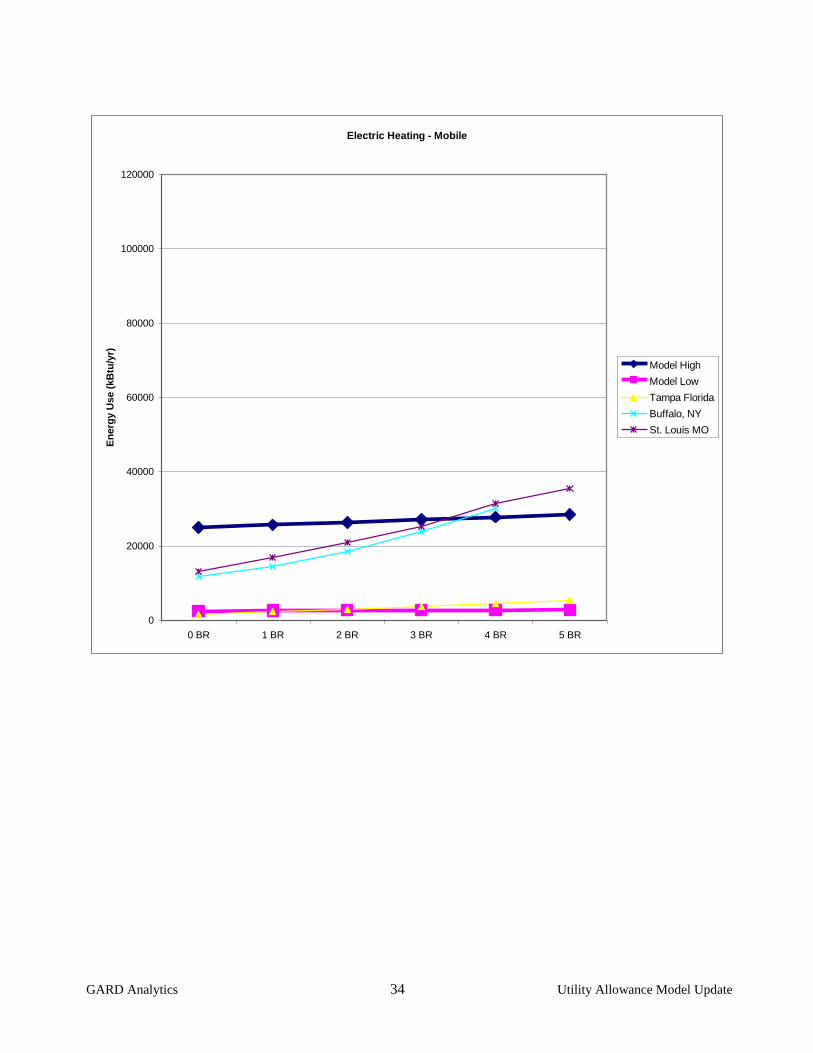
Elec Heat Mobile Most Fair
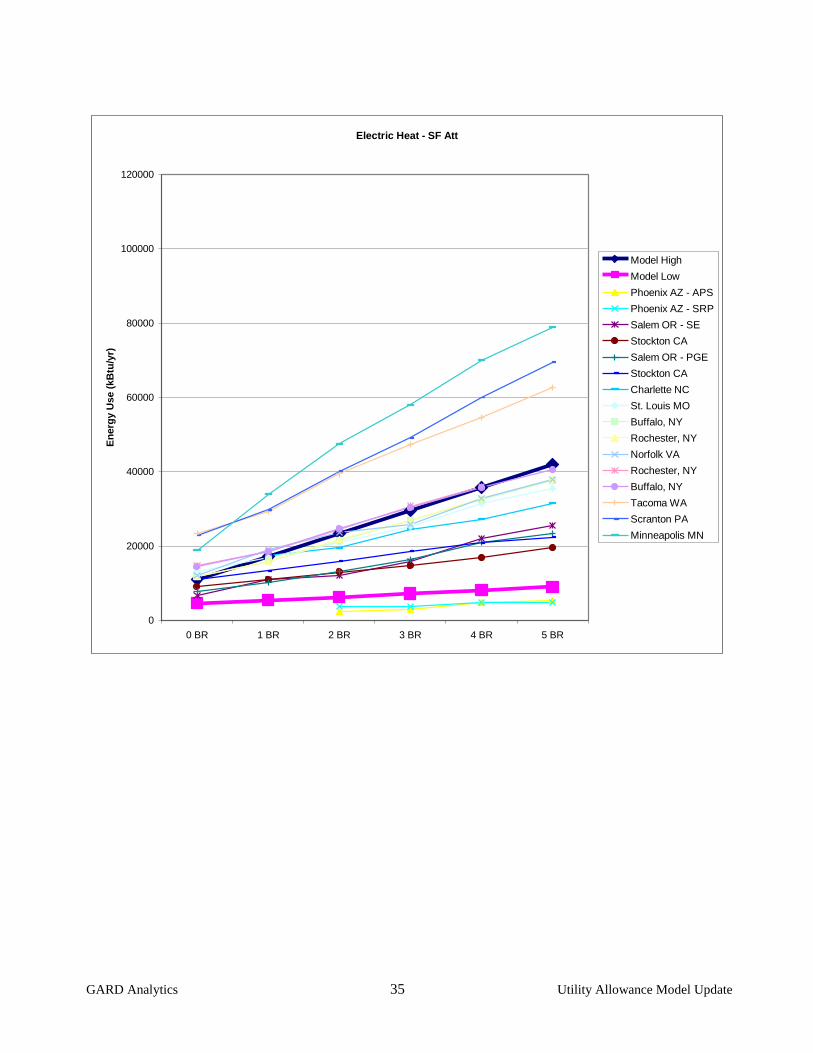
Elec Heat SF Att Most Good
Elec Heat SF Det Most Good
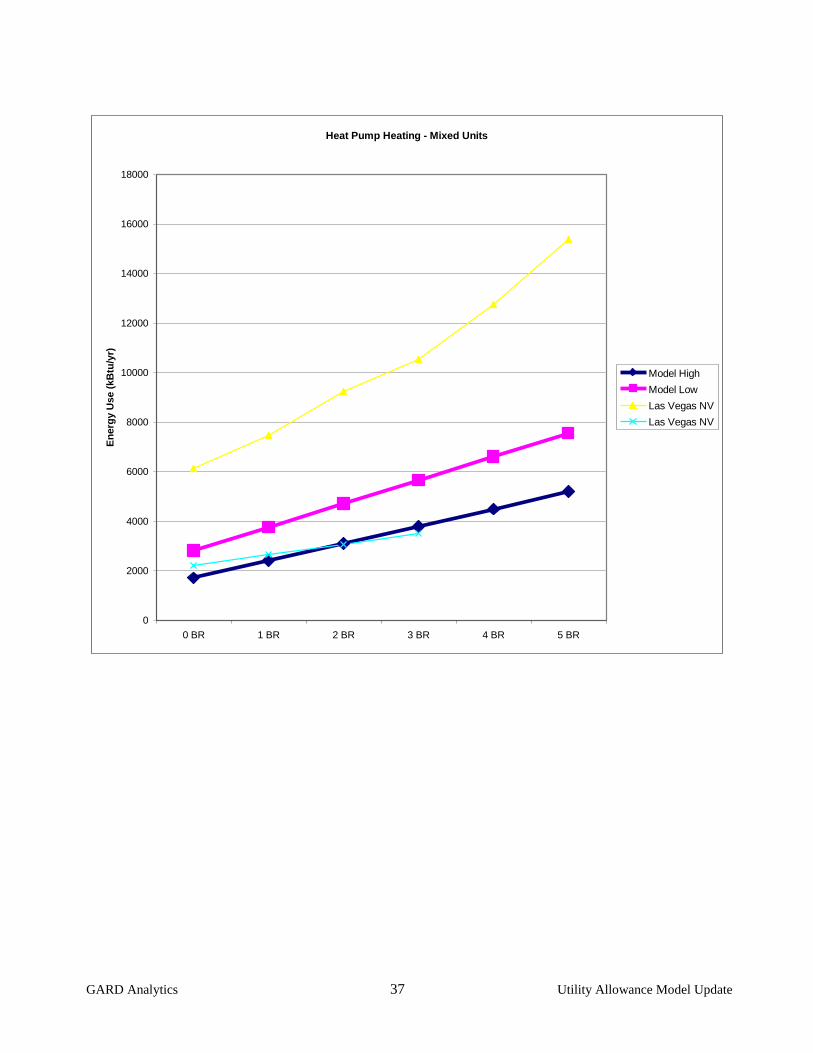
HeatPump Mixed Few Good
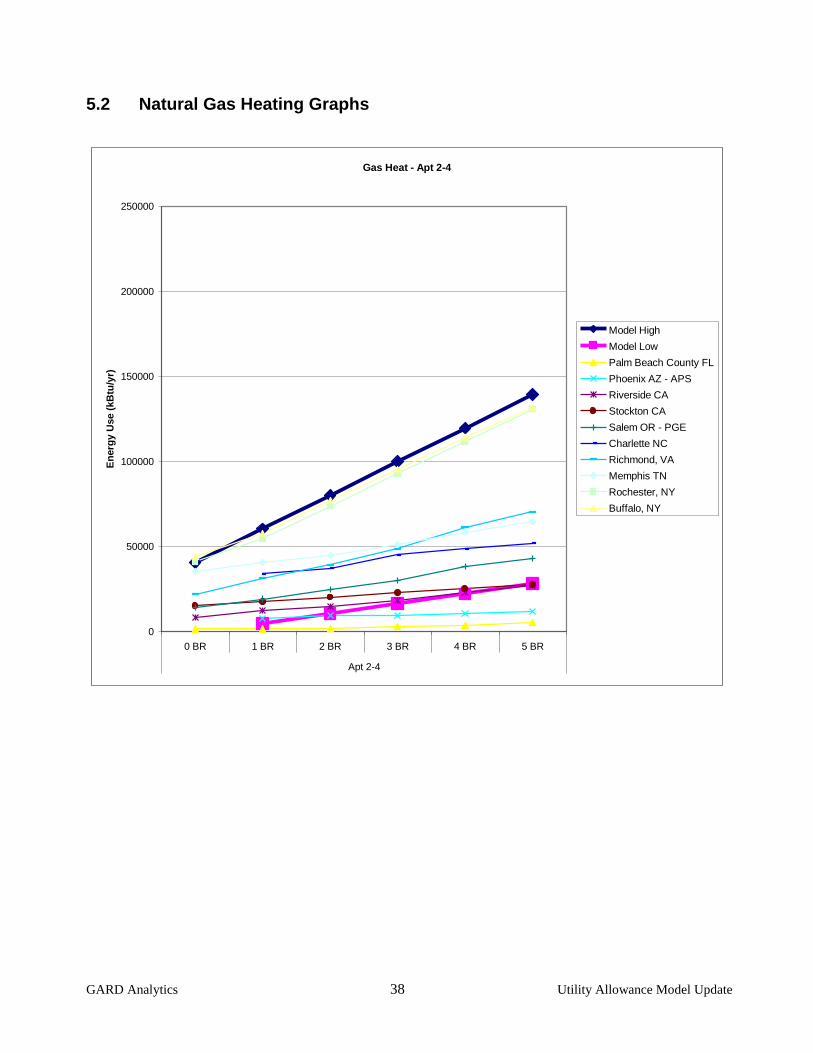
Gas Heat Apt 2-4 Most Good
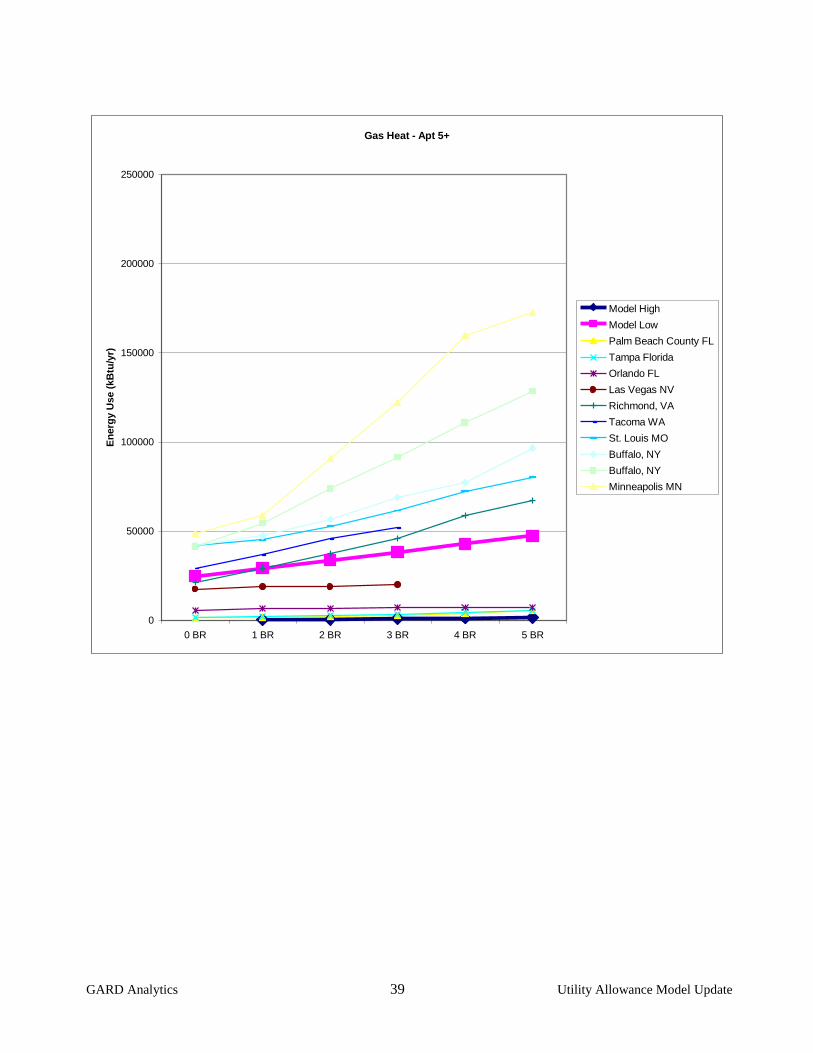
Gas Heat Apt 5+ Few Good
Gas Heat Mobile Few Fair
Gas Heat SF Att Most Good
Gas Heat SF Det Most Good
Air Cond Apt 2-4 Most Good
Air Cond Apt 5+ Most Good
Air Cond Mobile Few Fair
Air Cond SF Att Most Fair
Air Cond SF Det Most Fair
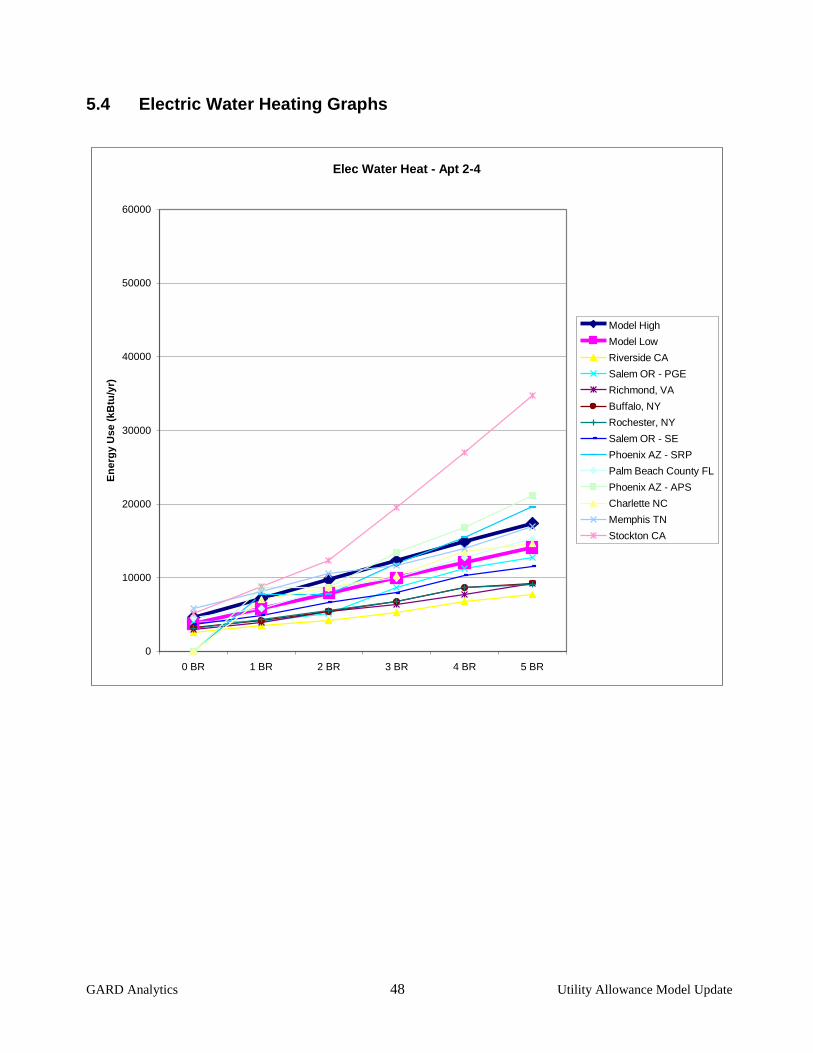
Elec WH Apt 2-4 Most Good
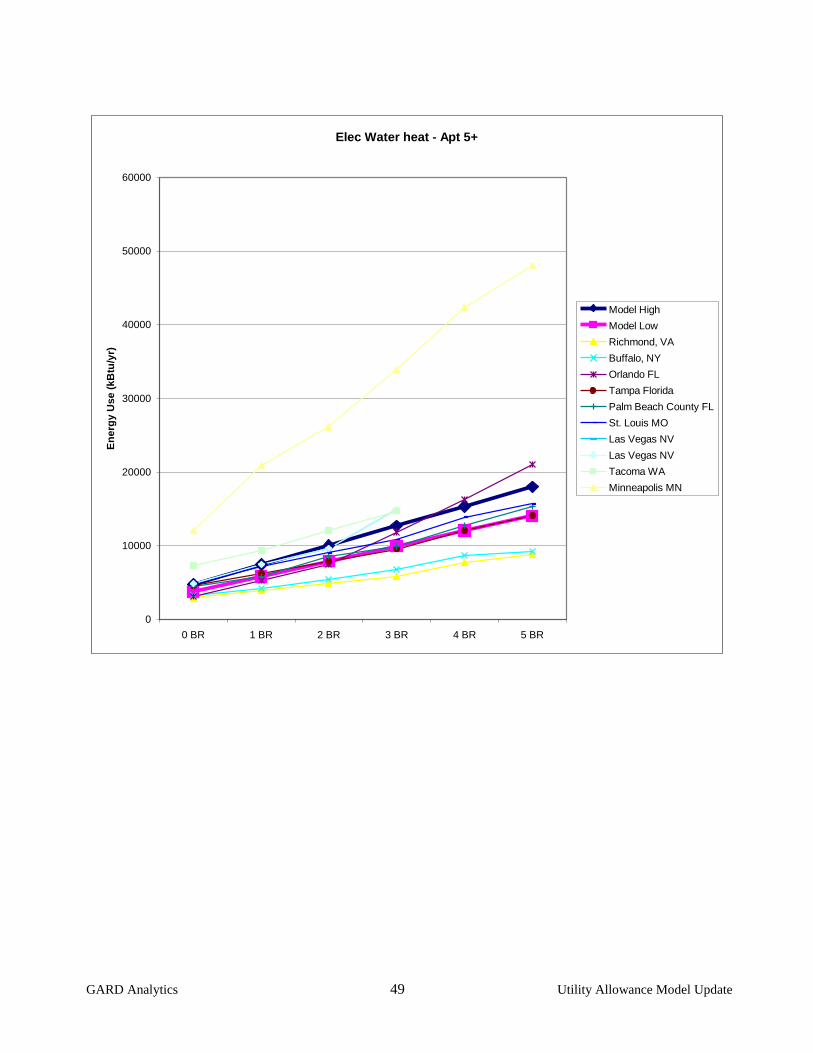
Elec WH Apt 5+ Most Good
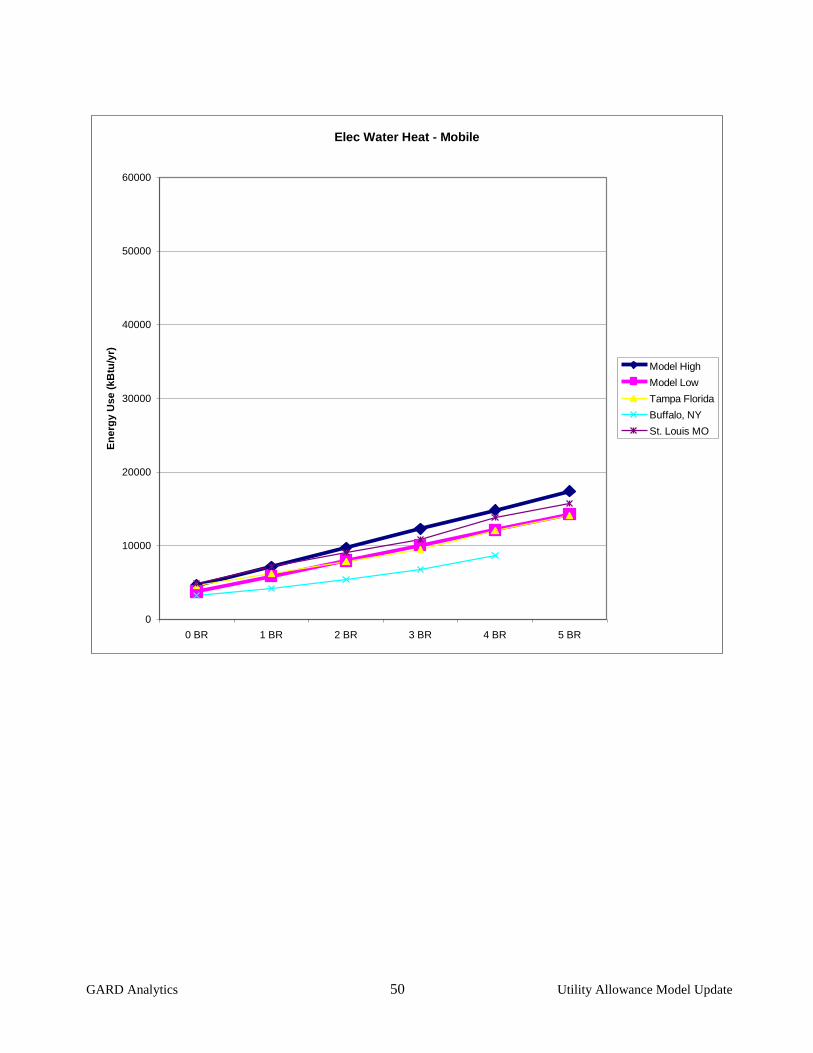
Elec WH Mobile Most Good
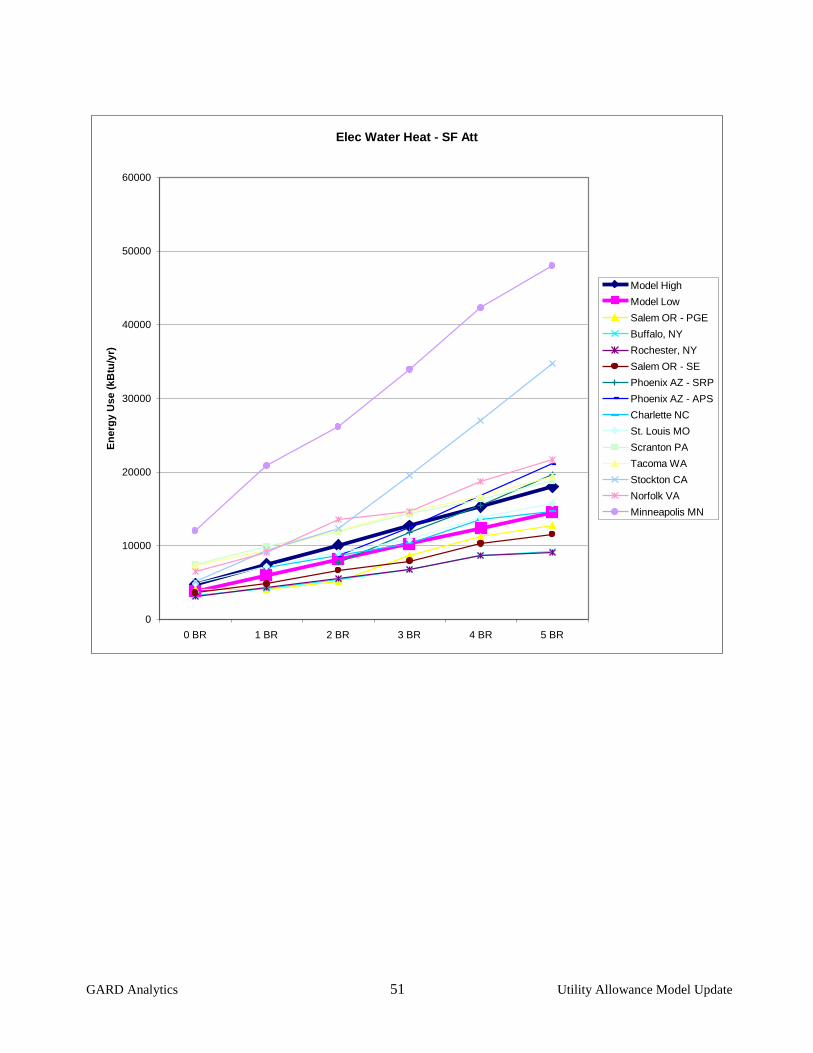
Elec WH SF Att Few Good
Elec WH SF Det Few Good
Gas WH Apt 2-4 Few Good
Gas WH Apt 5+ Most Good
Gas WH Mobile Most Good
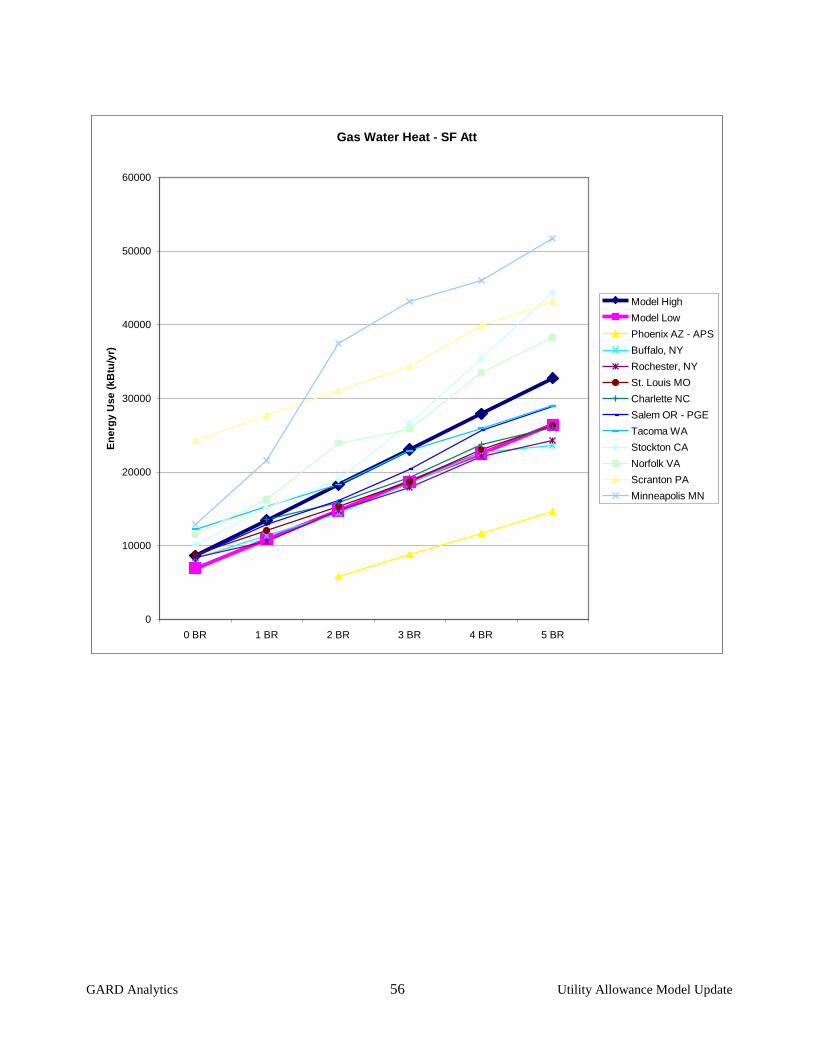
Gas WH SF Att Few Good
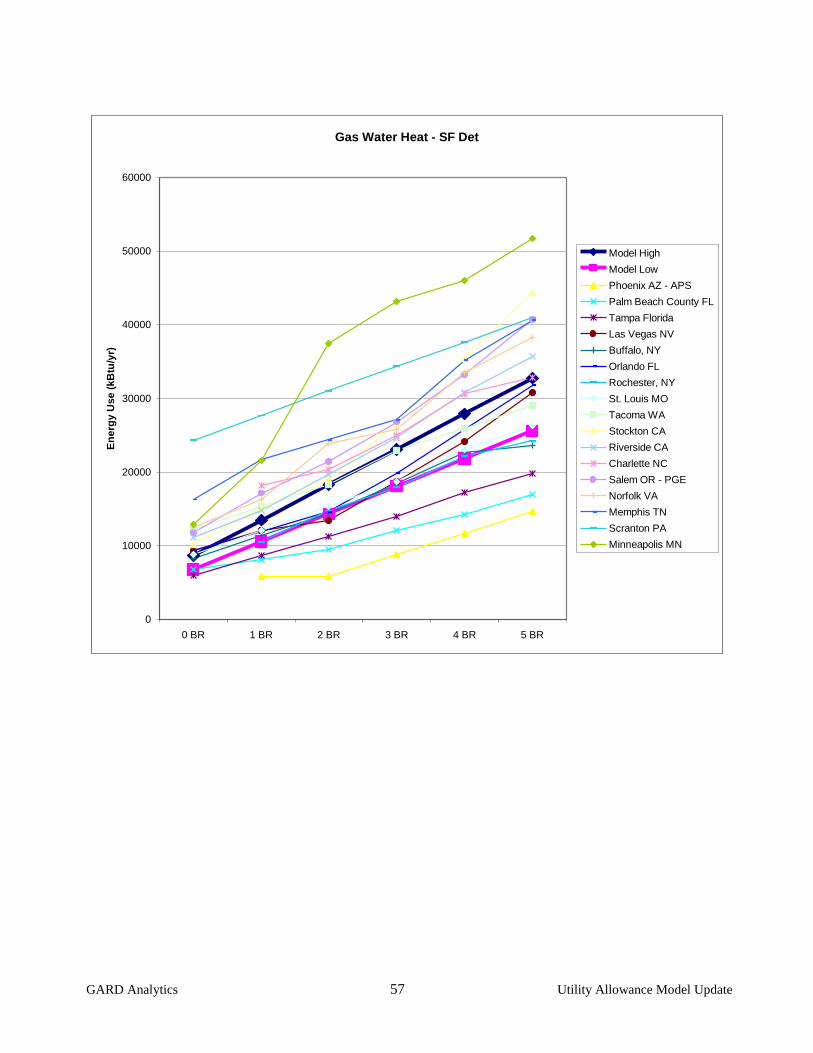
Gas WH SF Det Few Good
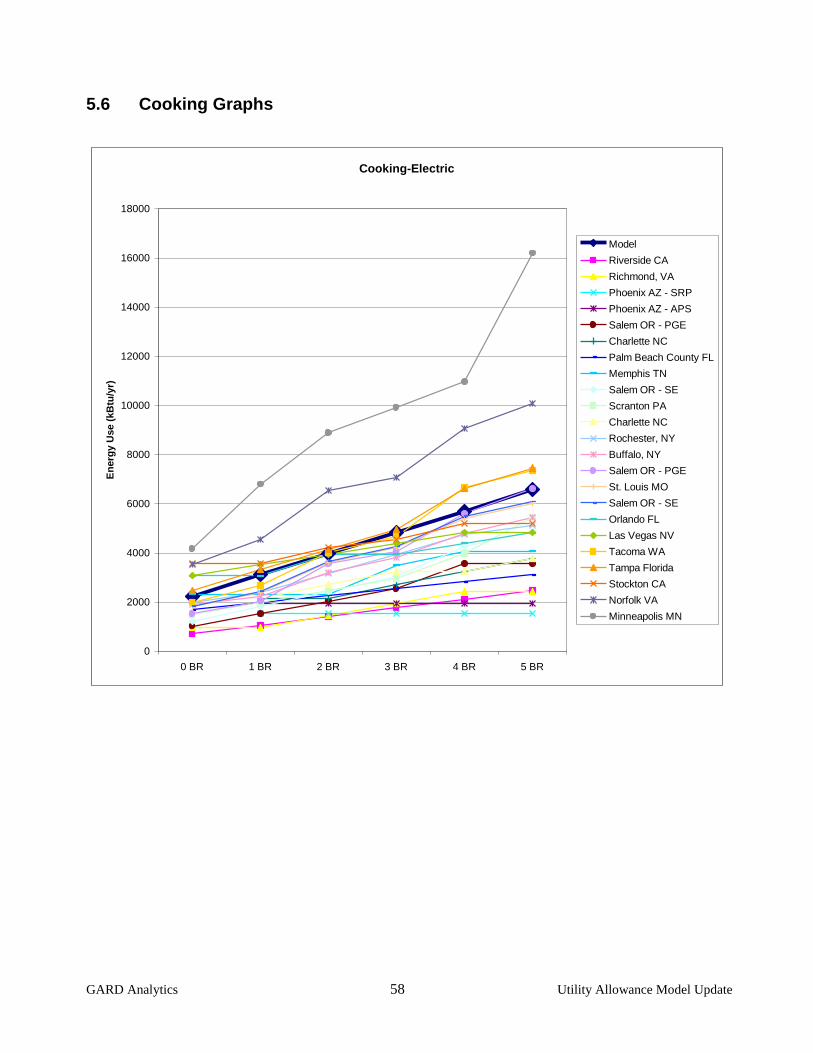
Elec Cook n/a n/a Good
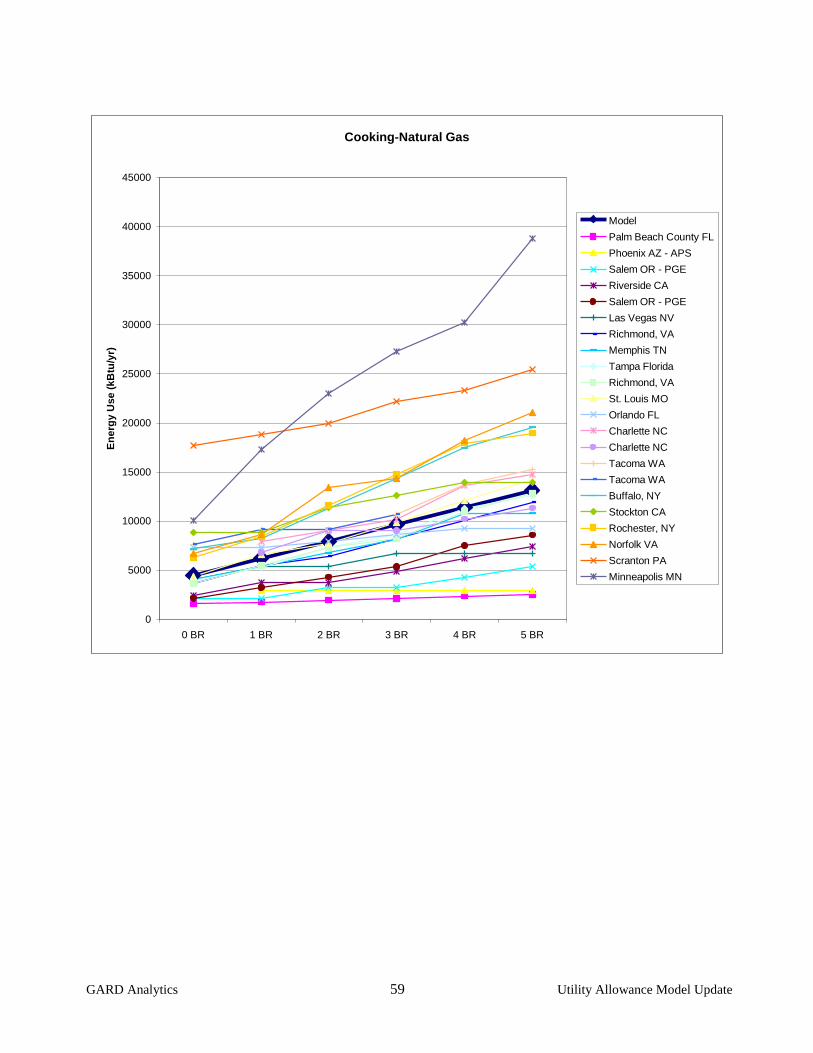
Gas Cook n/a n/a Good
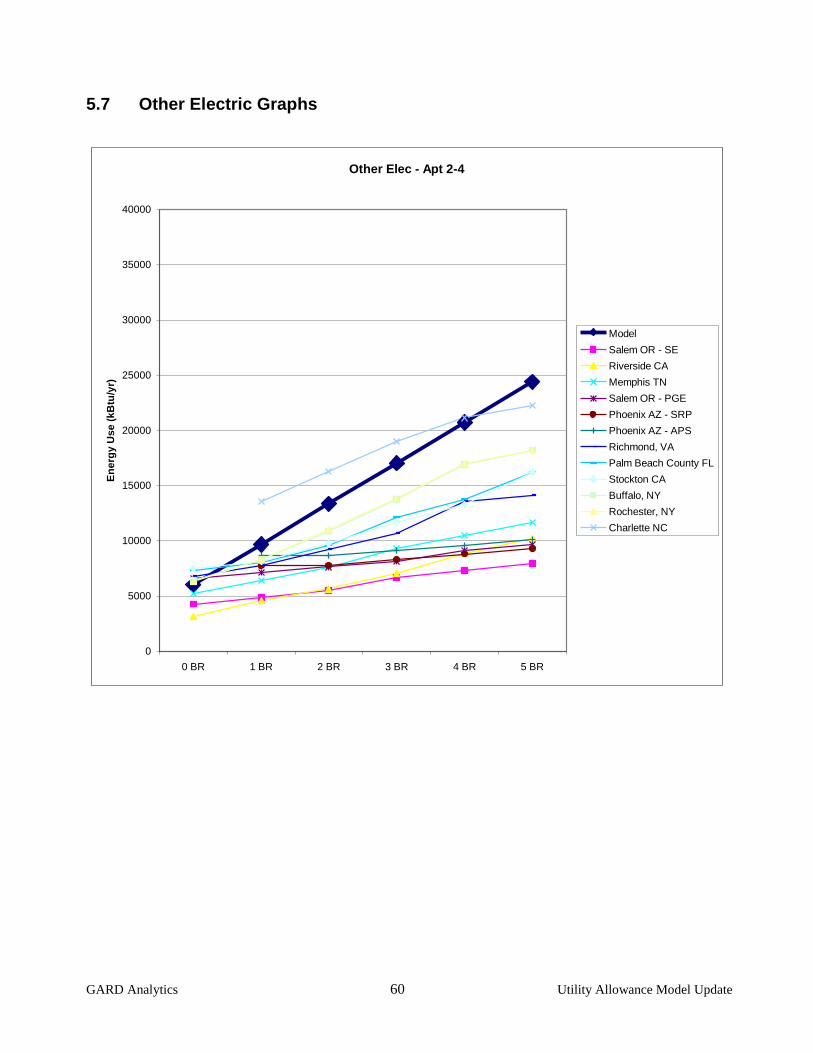
Other Elec Apt 2-4 n/a Good
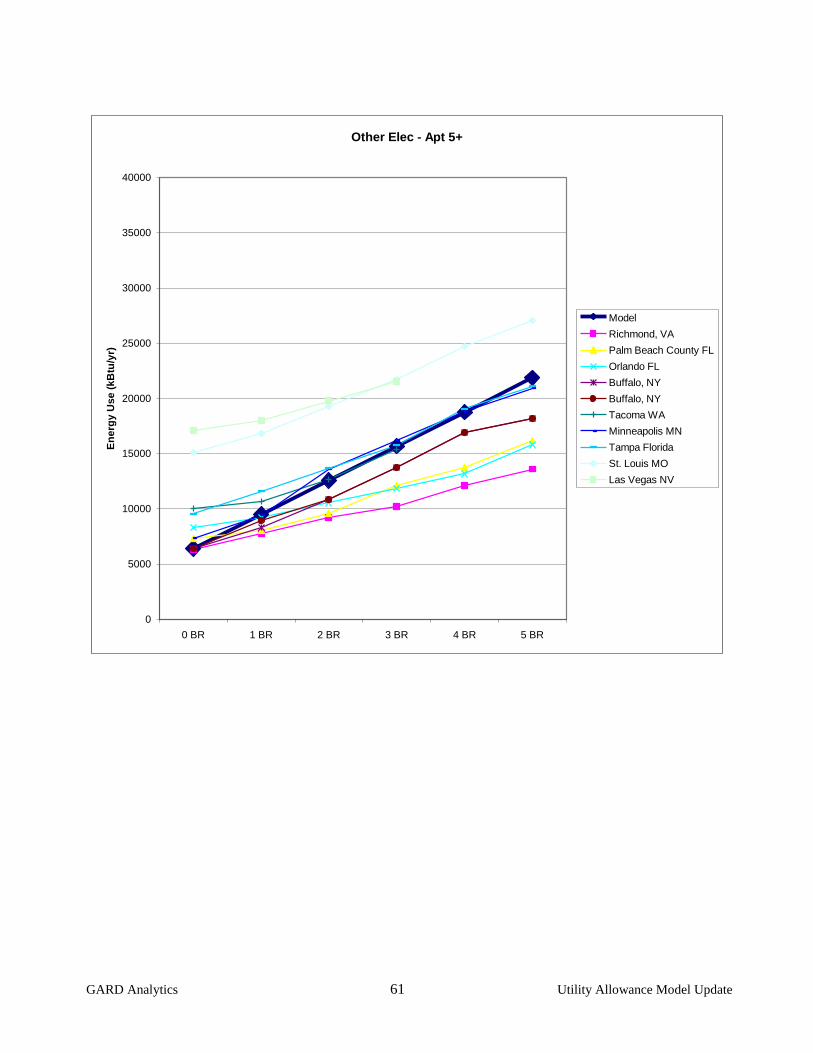
Other Elec Apt 5+ n/a Good
Other Elec Mobile n/a Fair
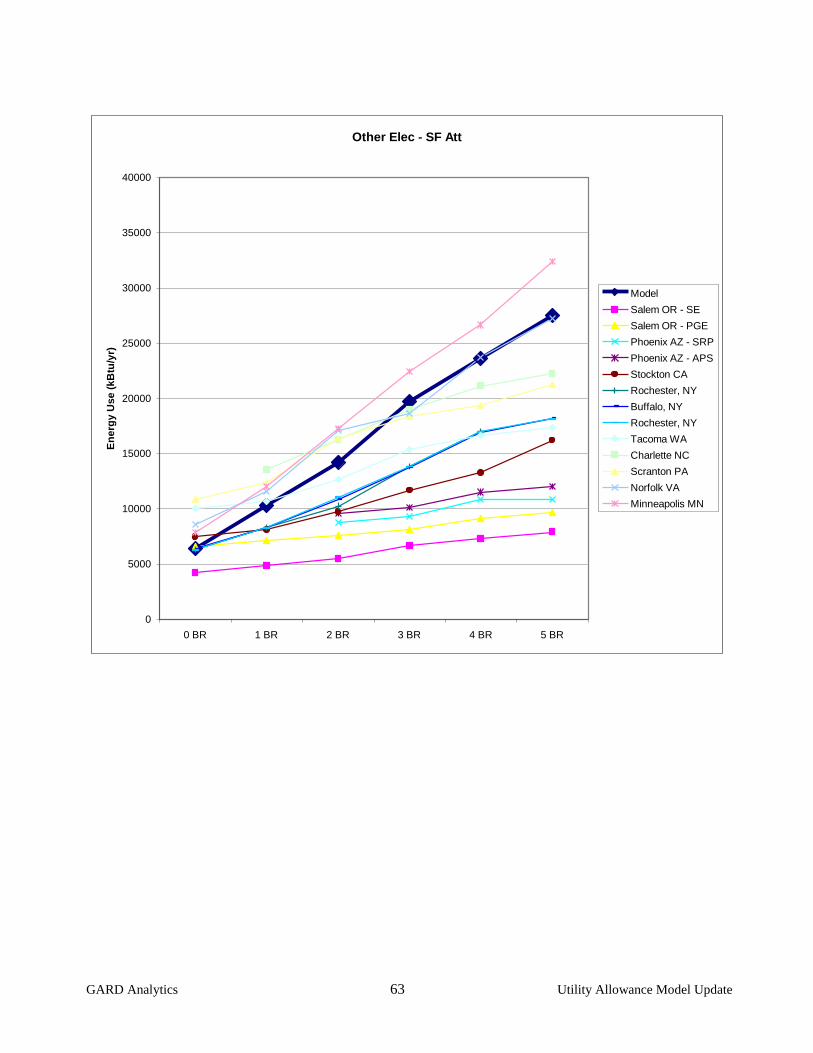
Other Elec SF Att n/a Good
Other Elec SF Det n/a Fair
In 17 of the 26 graphs with model ranges, most of the estimated actual energy consumptions fall within the
range of the modeled energy consumptions. In 26 of the 33 graphs, the shape of the model results was a good
match for the shape of the estimated actual energy consumption. From this, no further changes in the model
are needed at this time.
4. Overall Conclusion and Recommendations
The heating energy consumption and the heat pump efficiency adjustment changes improve the overall
accuracy of the HUD 52667 spreadsheet model. With these and previous improvements to the spreadsheet
model, it has become a robust and useful tool for public housing authorities. Any model can be improved and
the HUD 52667 spreadsheet model is no exception. But it has reached a point where further improvements
could be done in the future after housing authorities start to use the model. It is likely that future
improvements would be based on future comparative studies and by requests for features from housing
authorities.
Recommended next steps relate to the deployment of the HUD 52667 spreadsheet model:

GARD Analytics 31 Utility Allowance Model Update
a) Develop introductory training materials including slide presentations with speaker notes and internet
training systems such as screencasting.
b) Develop more detailed introductory documentation and make available on the internet.
c) Contact small set of housing authorities to test and provide feedback on the spreadsheet model.
d) Refine the model, the training materials, and the documentation based on feedback.
e) Deploy widely for use by housing authorities across the country.
Other steps relate to providing a robust model and continued support for it.
f) Provide support email address for answering questions from housing authorities.
g) Regularly perform validation studies comparing the results with measured residential energy usage.
h) Update the spreadsheet for new versions of Microsoft Excel.
i) Update the spreadsheet when new editions of DOE/EIA’s Residential Energy Consumption Survey
data become available.
GARD Analytics 32 Utility Allowance Model Update
5. Appendix A
5.1 Electric Heating Graphs
Electric Heat - Apt 2-4
0
20000
40000
60000
80000
100000
120000
0 BR 1 BR 2 BR 3 BR 4 BR 5 BR
En
erg
y U
se (
kB
tu/y
r)
Model High
Model Low
Palm Beach County FL
Phoenix AZ - APS
Phoenix AZ - SRP
Riverside CA
Richmond, VA
Salem OR - SE
Stockton CA
Salem OR - PGE
Memphis TN
Charlette NC
Rochester, NY
Buffalo, NY
GARD Analytics 33 Utility Allowance Model Update
Electric Heat - Apt 5+
0
20000
40000
60000
80000
100000
120000
0 BR 1 BR 2 BR 3 BR 4 BR 5 BR
En
erg
y U
se (
kB
tu/y
r)
Model High
Model Low
Orlando FL
Palm Beach County FL
Tampa Florida
Las Vegas NV
Richmond, VA
Tacoma WA
St. Louis MO
Buffalo, NY
Buffalo, NY
Minneapolis MN
GARD Analytics 34 Utility Allowance Model Update
Electric Heating - Mobile
0
20000
40000
60000
80000
100000
120000
0 BR 1 BR 2 BR 3 BR 4 BR 5 BR
En
erg
y U
se (
kB
tu/y
r)
Model High
Model Low
Tampa Florida
Buffalo, NY
St. Louis MO
GARD Analytics 35 Utility Allowance Model Update
Electric Heat - SF Att
0
20000
40000
60000
80000
100000
120000
0 BR 1 BR 2 BR 3 BR 4 BR 5 BR
En
erg
y U
se (
kB
tu/y
r)
Model High
Model Low
Phoenix AZ - APS
Phoenix AZ - SRP
Salem OR - SE
Stockton CA
Salem OR - PGE
Stockton CA
Charlette NC
St. Louis MO
Buffalo, NY
Rochester, NY
Norfolk VA
Rochester, NY
Buffalo, NY
Tacoma WA
Scranton PA
Minneapolis MN
GARD Analytics 36 Utility Allowance Model Update
Electric Heat - SF Det
0
20000
40000
60000
80000
100000
120000
0 BR 1 BR 2 BR 3 BR 4 BR 5 BR
En
erg
y U
se (
kB
tu/y
r)
Model High
Model Low
Palm Beach County FL
Tampa Florida
Orlando FL
Riverside CA
Phoenix AZ - SRP
Phoenix AZ - APS
Las Vegas NV
Stockton CA
Salem OR - PGE
Memphis TN
St. Louis MO
Salem OR - SE
Buffalo, NY
Buffalo, NY
Rochester, NY
Norfolk VA
Charlette NC
Tacoma WA
Minneapolis MN
Scranton PA
GARD Analytics 37 Utility Allowance Model Update
Heat Pump Heating - Mixed Units
0
2000
4000
6000
8000
10000
12000
14000
16000
18000
0 BR 1 BR 2 BR 3 BR 4 BR 5 BR
En
erg
y U
se (
kB
tu/y
r)
Model High
Model Low
Las Vegas NV
Las Vegas NV
GARD Analytics 38 Utility Allowance Model Update
5.2 Natural Gas Heating Graphs
Gas Heat - Apt 2-4
0
50000
100000
150000
200000
250000
0 BR 1 BR 2 BR 3 BR 4 BR 5 BR
Apt 2-4
En
erg
y U
se (
kB
tu/y
r)
Model High
Model Low
Palm Beach County FL
Phoenix AZ - APS
Riverside CA
Stockton CA
Salem OR - PGE
Charlette NC
Richmond, VA
Memphis TN
Rochester, NY
Buffalo, NY
GARD Analytics 39 Utility Allowance Model Update
Gas Heat - Apt 5+
0
50000
100000
150000
200000
250000
0 BR 1 BR 2 BR 3 BR 4 BR 5 BR
En
erg
y U
se (
kB
tu/y
r)
Model High
Model Low
Palm Beach County FL
Tampa Florida
Orlando FL
Las Vegas NV
Richmond, VA
Tacoma WA
St. Louis MO
Buffalo, NY
Buffalo, NY
Minneapolis MN
GARD Analytics 40 Utility Allowance Model Update
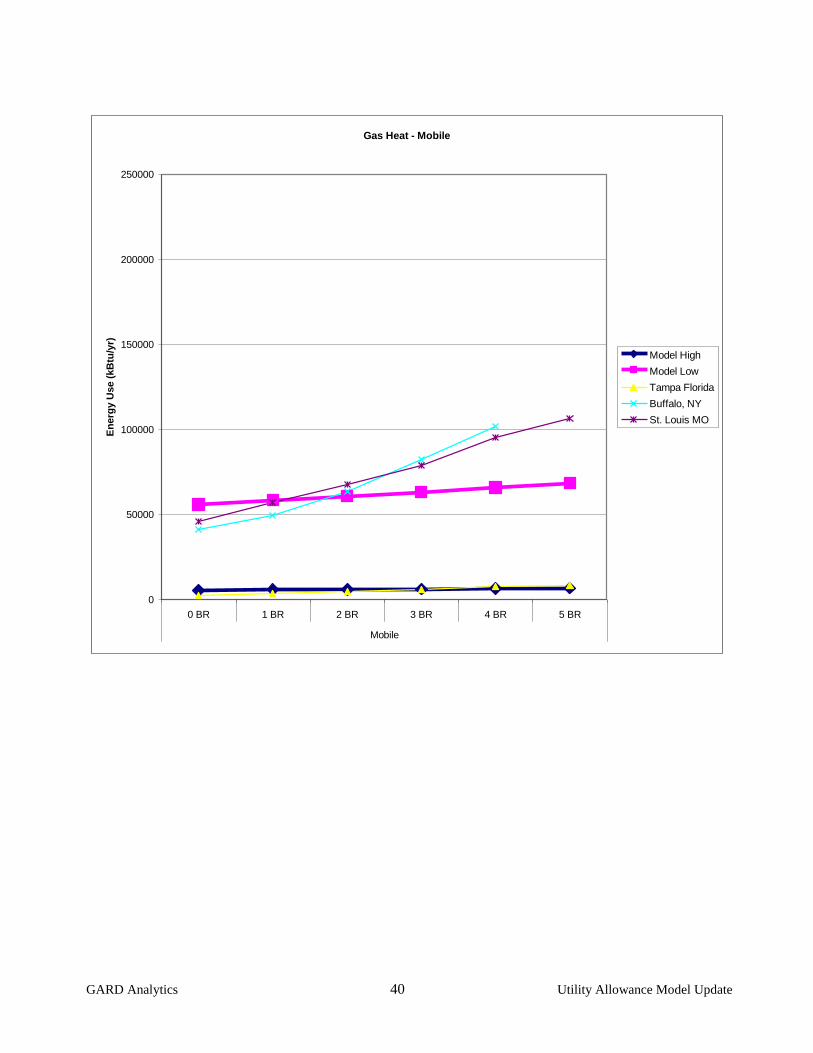
Gas Heat - Mobile
0
50000
100000
150000
200000
250000
0 BR 1 BR 2 BR 3 BR 4 BR 5 BR
Mobile
En
erg
y U
se (
kB
tu/y
r)
Model High
Model Low
Tampa Florida
Buffalo, NY
St. Louis MO
GARD Analytics 41 Utility Allowance Model Update
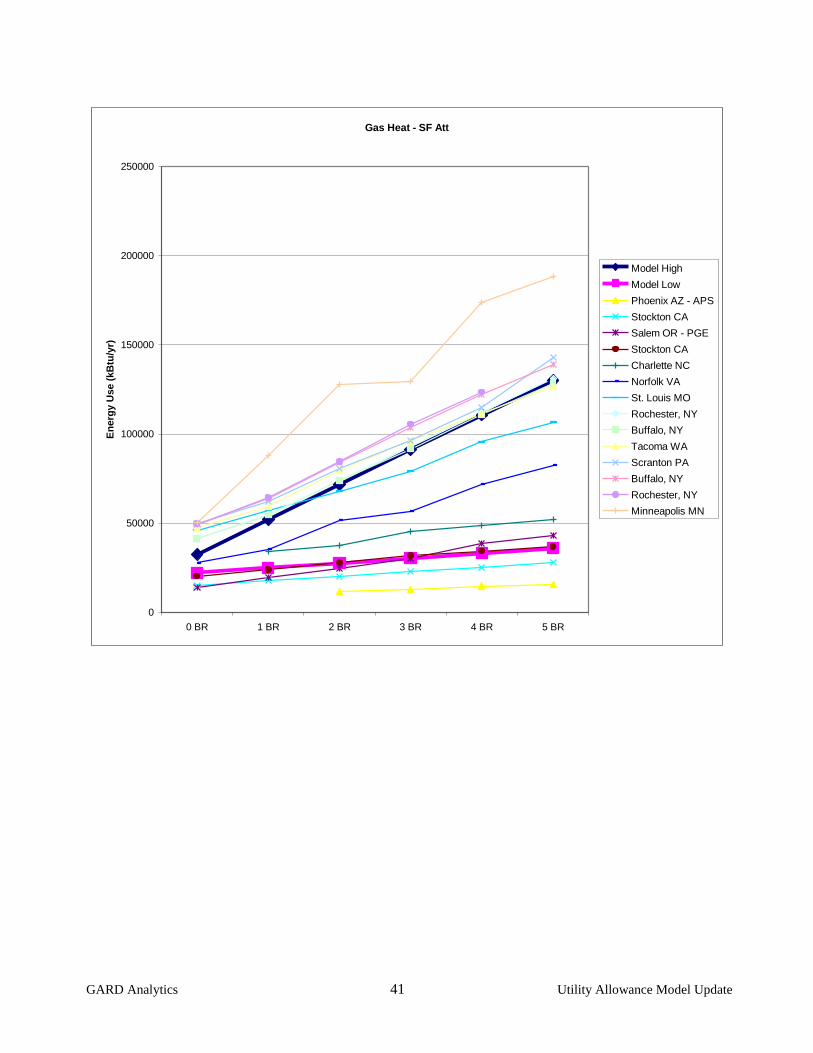
Gas Heat - SF Att
0
50000
100000
150000
200000
250000
0 BR 1 BR 2 BR 3 BR 4 BR 5 BR
En
erg
y U
se (
kB
tu/y
r)
Model High
Model Low
Phoenix AZ - APS
Stockton CA
Salem OR - PGE
Stockton CA
Charlette NC
Norfolk VA
St. Louis MO
Rochester, NY
Buffalo, NY
Tacoma WA
Scranton PA
Buffalo, NY
Rochester, NY
Minneapolis MN
GARD Analytics 42 Utility Allowance Model Update
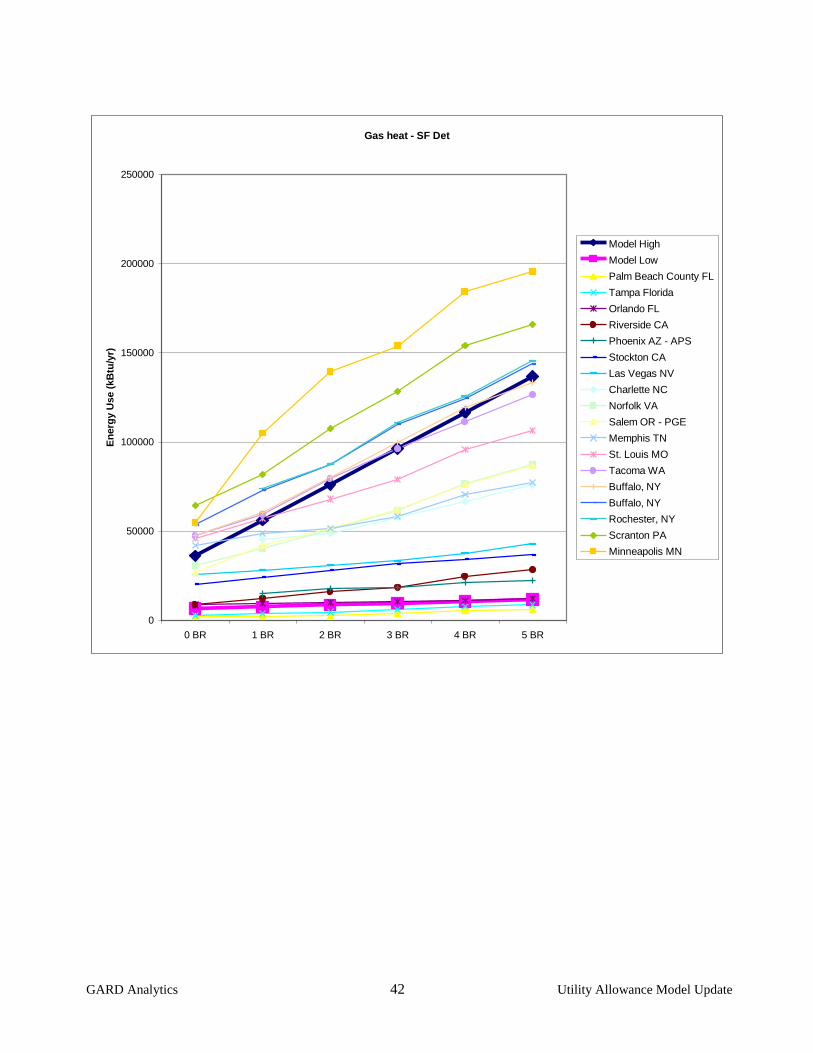
Gas heat - SF Det
0
50000
100000
150000
200000
250000
0 BR 1 BR 2 BR 3 BR 4 BR 5 BR
En
erg
y U
se (
kB
tu/y
r)
Model High
Model Low
Palm Beach County FL
Tampa Florida
Orlando FL
Riverside CA
Phoenix AZ - APS
Stockton CA
Las Vegas NV
Charlette NC
Norfolk VA
Salem OR - PGE
Memphis TN
St. Louis MO
Tacoma WA
Buffalo, NY
Buffalo, NY
Rochester, NY
Scranton PA
Minneapolis MN
GARD Analytics 43 Utility Allowance Model Update
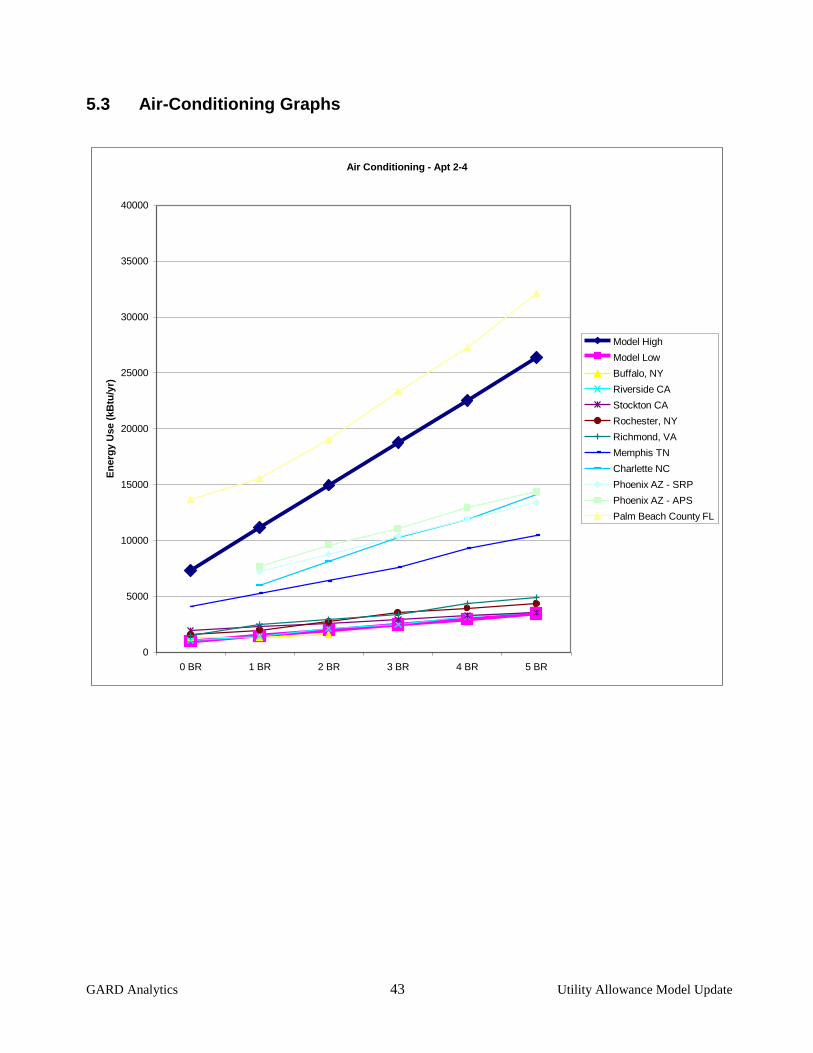
5.3 Air-Conditioning Graphs
Air Conditioning - Apt 2-4
0
5000
10000
15000
20000
25000
30000
35000
40000
0 BR 1 BR 2 BR 3 BR 4 BR 5 BR
En
erg
y U
se (
kB
tu/y
r)
Model High
Model Low
Buffalo, NY
Riverside CA
Stockton CA
Rochester, NY
Richmond, VA
Memphis TN
Charlette NC
Phoenix AZ - SRP
Phoenix AZ - APS
Palm Beach County FL
GARD Analytics 44 Utility Allowance Model Update
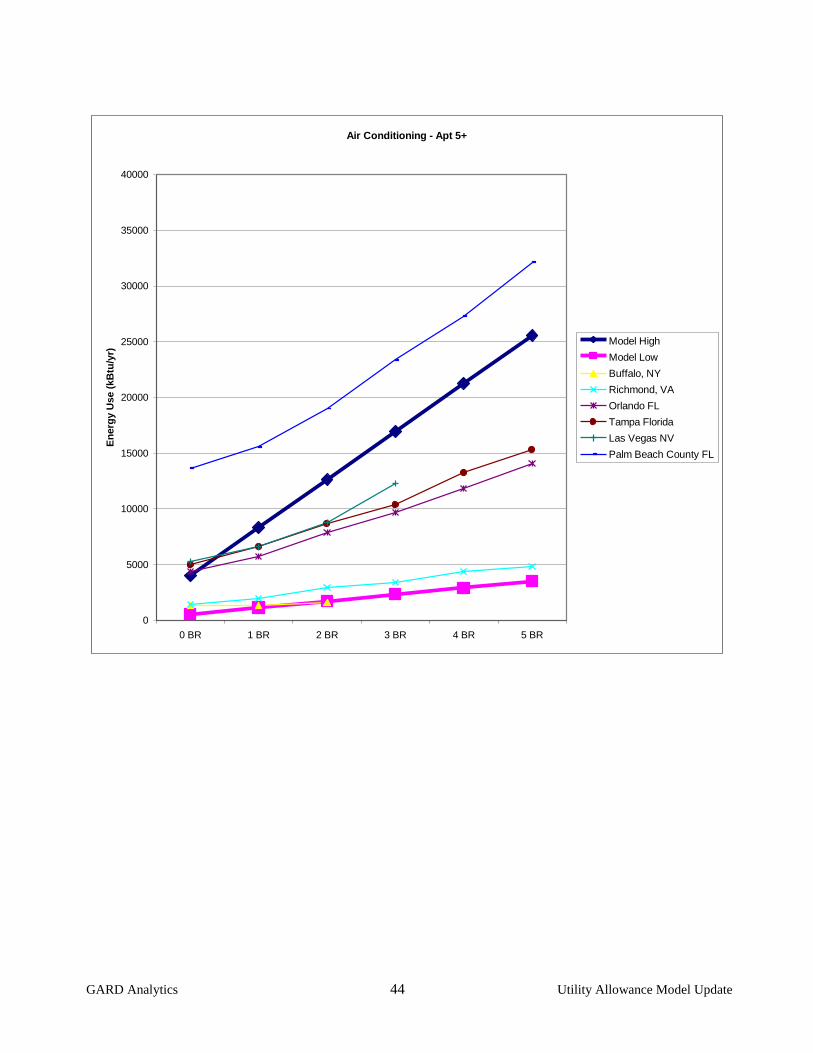
Air Conditioning - Apt 5+
0
5000
10000
15000
20000
25000
30000
35000
40000
0 BR 1 BR 2 BR 3 BR 4 BR 5 BR
En
erg
y U
se (
kB
tu/y
r)
Model High
Model Low
Buffalo, NY
Richmond, VA
Orlando FL
Tampa Florida
Las Vegas NV
Palm Beach County FL
GARD Analytics 45 Utility Allowance Model Update
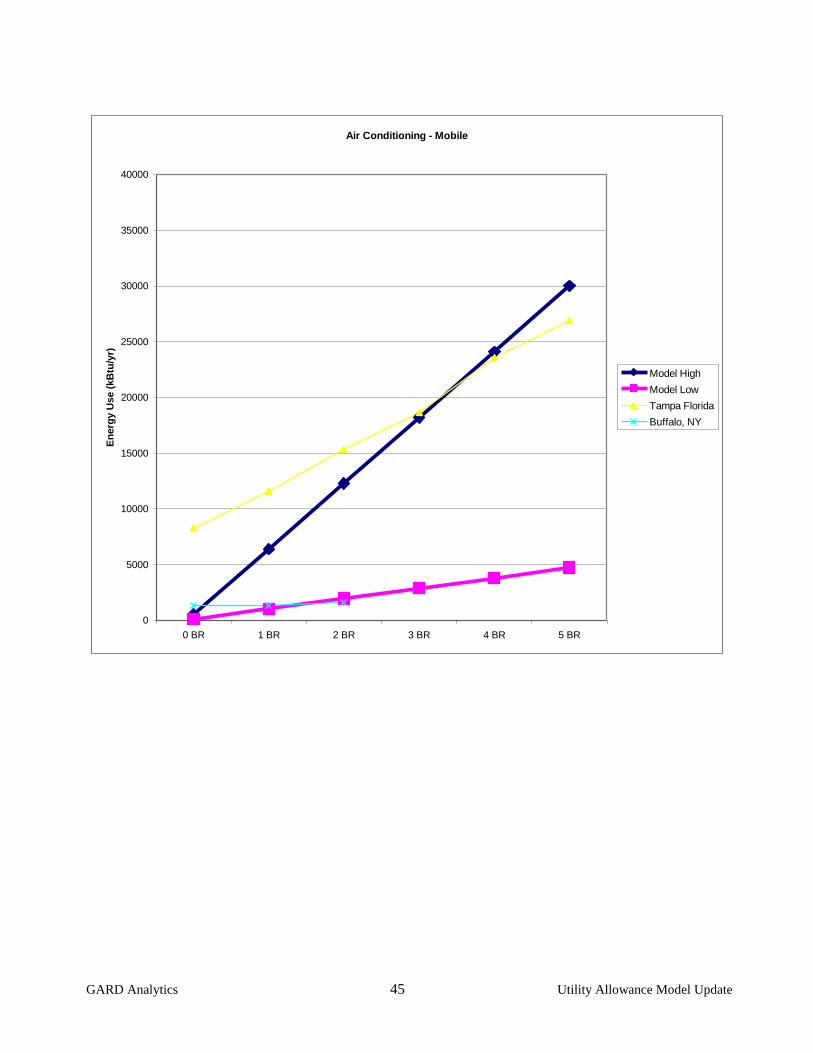
Air Conditioning - Mobile
0
5000
10000
15000
20000
25000
30000
35000
40000
0 BR 1 BR 2 BR 3 BR 4 BR 5 BR
En
erg
y U
se (
kB
tu/y
r)
Model High
Model Low
Tampa Florida
Buffalo, NY
GARD Analytics 46 Utility Allowance Model Update
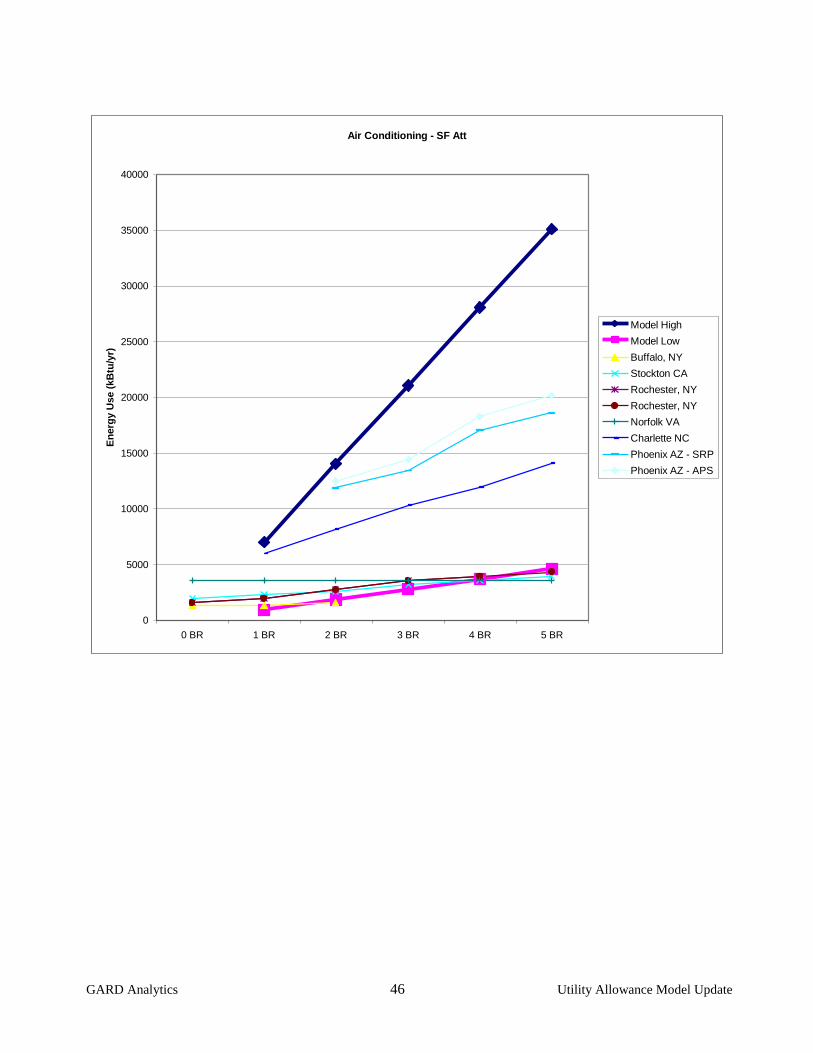
Air Conditioning - SF Att
0
5000
10000
15000
20000
25000
30000
35000
40000
0 BR 1 BR 2 BR 3 BR 4 BR 5 BR
En
erg
y U
se (
kB
tu/y
r)
Model High
Model Low
Buffalo, NY
Stockton CA
Rochester, NY
Rochester, NY
Norfolk VA
Charlette NC
Phoenix AZ - SRP
Phoenix AZ - APS
GARD Analytics 47 Utility Allowance Model Update
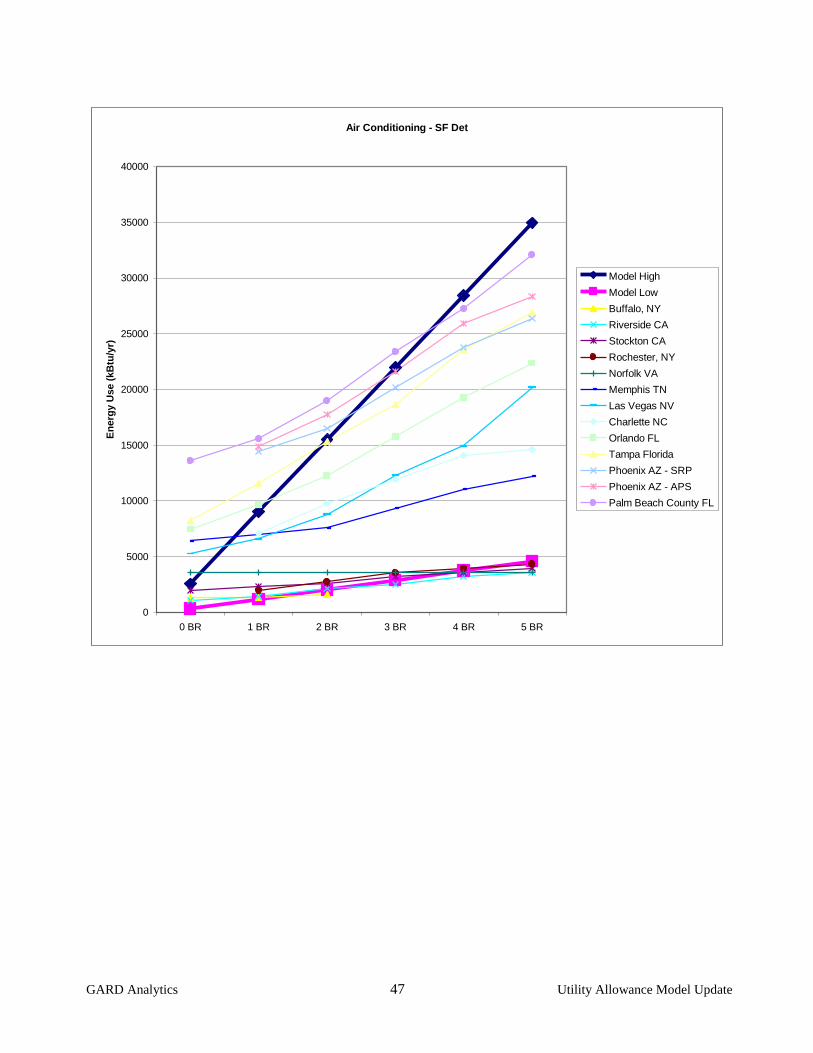
Air Conditioning - SF Det
0
5000
10000
15000
20000
25000
30000
35000
40000
0 BR 1 BR 2 BR 3 BR 4 BR 5 BR
En
erg
y U
se (
kB
tu/y
r)
Model High
Model Low
Buffalo, NY
Riverside CA
Stockton CA
Rochester, NY
Norfolk VA
Memphis TN
Las Vegas NV
Charlette NC
Orlando FL
Tampa Florida
Phoenix AZ - SRP
Phoenix AZ - APS
Palm Beach County FL
GARD Analytics 48 Utility Allowance Model Update
5.4 Electric Water Heating Graphs
Elec Water Heat - Apt 2-4
0
10000
20000
30000
40000
50000
60000
0 BR 1 BR 2 BR 3 BR 4 BR 5 BR
En
erg
y U
se
(k
Btu
/yr)
Model High
Model Low
Riverside CA
Salem OR - PGE
Richmond, VA
Buffalo, NY
Rochester, NY
Salem OR - SE
Phoenix AZ - SRP
Palm Beach County FL
Phoenix AZ - APS
Charlette NC
Memphis TN
Stockton CA
GARD Analytics 49 Utility Allowance Model Update
Elec Water heat - Apt 5+
0
10000
20000
30000
40000
50000
60000
0 BR 1 BR 2 BR 3 BR 4 BR 5 BR
En
erg
y U
se
(k
Btu
/yr)
Model High
Model Low
Richmond, VA
Buffalo, NY
Orlando FL
Tampa Florida
Palm Beach County FL
St. Louis MO
Las Vegas NV
Las Vegas NV
Tacoma WA
Minneapolis MN
GARD Analytics 50 Utility Allowance Model Update
Elec Water Heat - Mobile
0
10000
20000
30000
40000
50000
60000
0 BR 1 BR 2 BR 3 BR 4 BR 5 BR
En
erg
y U
se
(k
Btu
/yr)
Model High
Model Low
Tampa Florida
Buffalo, NY
St. Louis MO
GARD Analytics 51 Utility Allowance Model Update
Elec Water Heat - SF Att
0
10000
20000
30000
40000
50000
60000
0 BR 1 BR 2 BR 3 BR 4 BR 5 BR
En
erg
y U
se
(k
Btu
/yr)
Model High
Model Low
Salem OR - PGE
Buffalo, NY
Rochester, NY
Salem OR - SE
Phoenix AZ - SRP
Phoenix AZ - APS
Charlette NC
St. Louis MO
Scranton PA
Tacoma WA
Stockton CA
Norfolk VA
Minneapolis MN
GARD Analytics 52 Utility Allowance Model Update
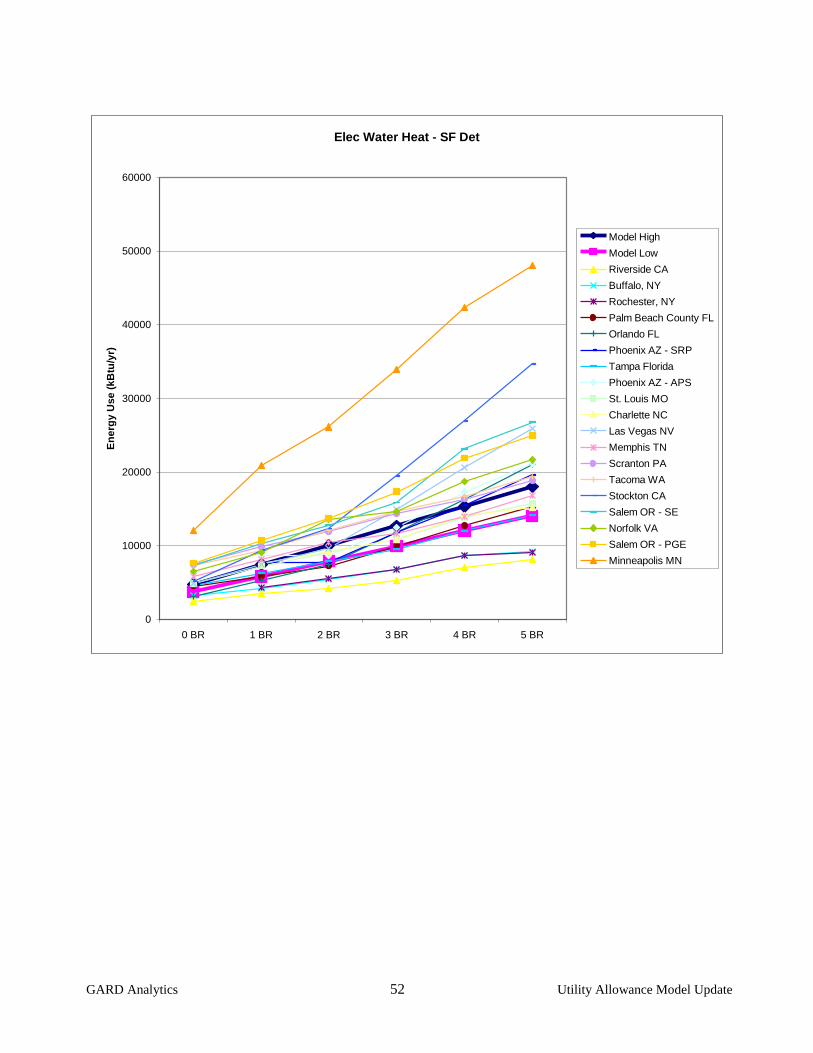
Elec Water Heat - SF Det
0
10000
20000
30000
40000
50000
60000
0 BR 1 BR 2 BR 3 BR 4 BR 5 BR
En
erg
y U
se
(k
Btu
/yr)
Model High
Model Low
Riverside CA
Buffalo, NY
Rochester, NY
Palm Beach County FL
Orlando FL
Phoenix AZ - SRP
Tampa Florida
Phoenix AZ - APS
St. Louis MO
Charlette NC
Las Vegas NV
Memphis TN
Scranton PA
Tacoma WA
Stockton CA
Salem OR - SE
Norfolk VA
Salem OR - PGE
Minneapolis MN
GARD Analytics 53 Utility Allowance Model Update
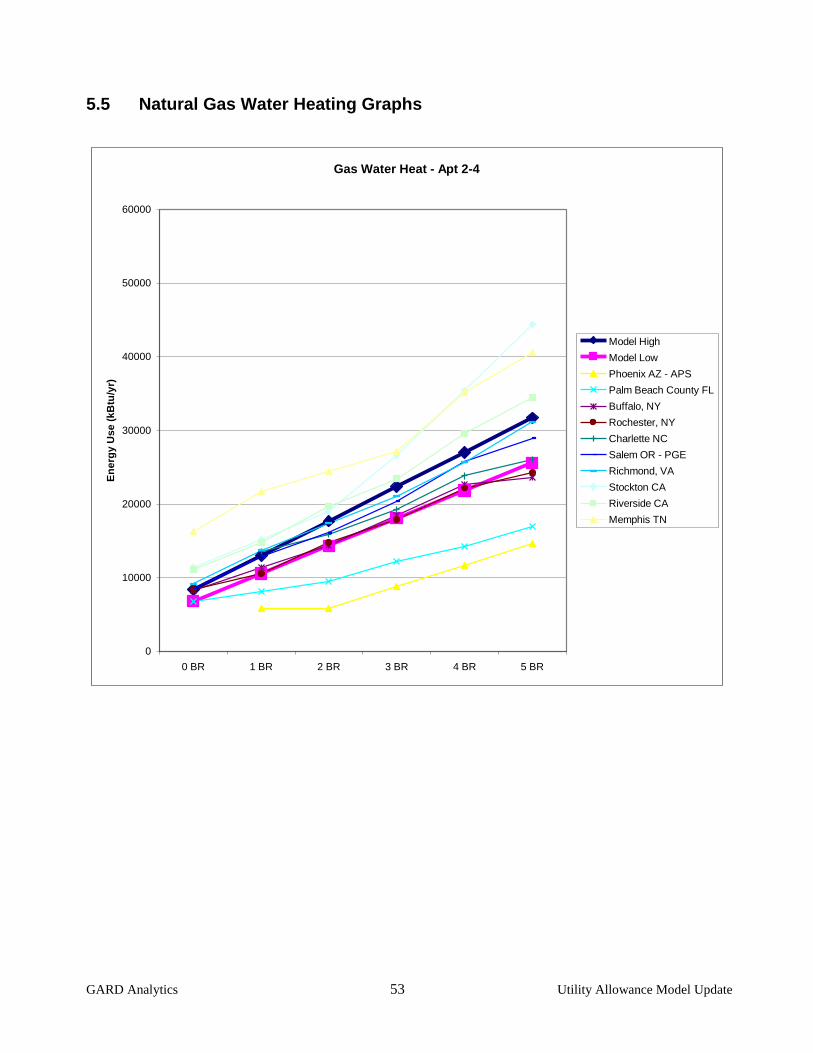
5.5 Natural Gas Water Heating Graphs
Gas Water Heat - Apt 2-4
0
10000
20000
30000
40000
50000
60000
0 BR 1 BR 2 BR 3 BR 4 BR 5 BR
En
erg
y U
se
(k
Btu
/yr)
Model High
Model Low
Phoenix AZ - APS
Palm Beach County FL
Buffalo, NY
Rochester, NY
Charlette NC
Salem OR - PGE
Richmond, VA
Stockton CA
Riverside CA
Memphis TN
GARD Analytics 54 Utility Allowance Model Update
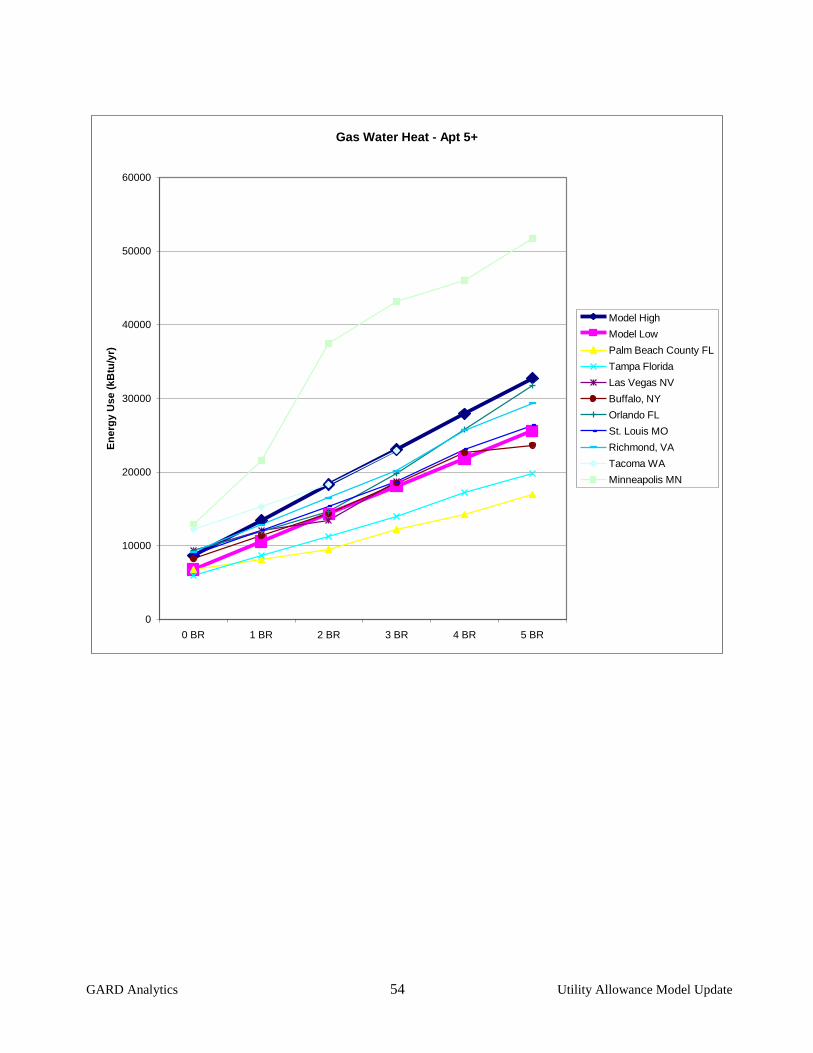
Gas Water Heat - Apt 5+
0
10000
20000
30000
40000
50000
60000
0 BR 1 BR 2 BR 3 BR 4 BR 5 BR
En
erg
y U
se
(k
Btu
/yr)
Model High
Model Low
Palm Beach County FL
Tampa Florida
Las Vegas NV
Buffalo, NY
Orlando FL
St. Louis MO
Richmond, VA
Tacoma WA
Minneapolis MN
GARD Analytics 55 Utility Allowance Model Update
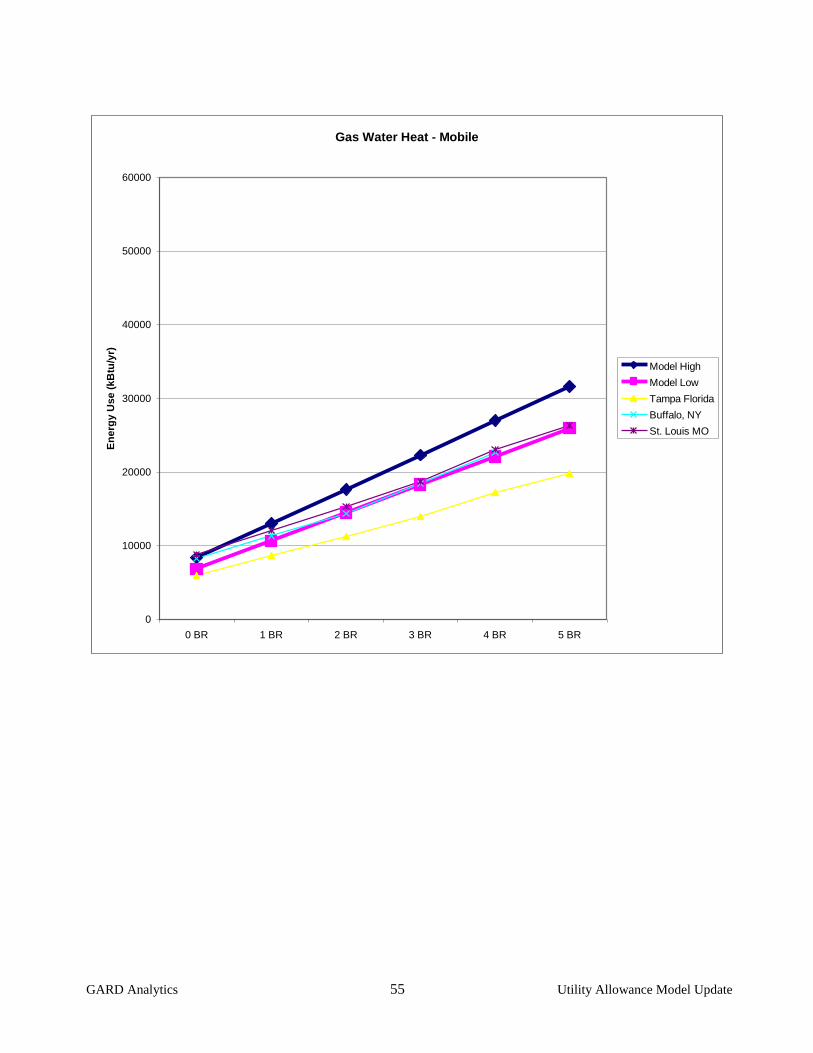
Gas Water Heat - Mobile
0
10000
20000
30000
40000
50000
60000
0 BR 1 BR 2 BR 3 BR 4 BR 5 BR
En
erg
y U
se
(k
Btu
/yr)
Model High
Model Low
Tampa Florida
Buffalo, NY
St. Louis MO
GARD Analytics 56 Utility Allowance Model Update
Gas Water Heat - SF Att
0
10000
20000
30000
40000
50000
60000
0 BR 1 BR 2 BR 3 BR 4 BR 5 BR
En
erg
y U
se
(k
Btu
/yr)
Model High
Model Low
Phoenix AZ - APS
Buffalo, NY
Rochester, NY
St. Louis MO
Charlette NC
Salem OR - PGE
Tacoma WA
Stockton CA
Norfolk VA
Scranton PA
Minneapolis MN
GARD Analytics 57 Utility Allowance Model Update
Gas Water Heat - SF Det
0
10000
20000
30000
40000
50000
60000
0 BR 1 BR 2 BR 3 BR 4 BR 5 BR
En
erg
y U
se
(k
Btu
/yr)
Model High
Model Low
Phoenix AZ - APS
Palm Beach County FL
Tampa Florida
Las Vegas NV
Buffalo, NY
Orlando FL
Rochester, NY
St. Louis MO
Tacoma WA
Stockton CA
Riverside CA
Charlette NC
Salem OR - PGE
Norfolk VA
Memphis TN
Scranton PA
Minneapolis MN
GARD Analytics 58 Utility Allowance Model Update
5.6 Cooking Graphs
Cooking-Electric
0
2000
4000
6000
8000
10000
12000
14000
16000
18000
0 BR 1 BR 2 BR 3 BR 4 BR 5 BR
En
erg
y U
se (
kB
tu/y
r)
Model
Riverside CA
Richmond, VA
Phoenix AZ - SRP
Phoenix AZ - APS
Salem OR - PGE
Charlette NC
Palm Beach County FL
Memphis TN
Salem OR - SE
Scranton PA
Charlette NC
Rochester, NY
Buffalo, NY
Salem OR - PGE
St. Louis MO
Salem OR - SE
Orlando FL
Las Vegas NV
Tacoma WA
Tampa Florida
Stockton CA
Norfolk VA
Minneapolis MN
GARD Analytics 59 Utility Allowance Model Update
Cooking-Natural Gas
0
5000
10000
15000
20000
25000
30000
35000
40000
45000
0 BR 1 BR 2 BR 3 BR 4 BR 5 BR
En
erg
y U
se
(k
Btu
/yr)
Model
Palm Beach County FL
Phoenix AZ - APS
Salem OR - PGE
Riverside CA
Salem OR - PGE
Las Vegas NV
Richmond, VA
Memphis TN
Tampa Florida
Richmond, VA
St. Louis MO
Orlando FL
Charlette NC
Charlette NC
Tacoma WA
Tacoma WA
Buffalo, NY
Stockton CA
Rochester, NY
Norfolk VA
Scranton PA
Minneapolis MN
GARD Analytics 60 Utility Allowance Model Update
5.7 Other Electric Graphs
Other Elec - Apt 2-4
0
5000
10000
15000
20000
25000
30000
35000
40000
0 BR 1 BR 2 BR 3 BR 4 BR 5 BR
En
erg
y U
se
(k
Btu
/yr)
Model
Salem OR - SE
Riverside CA
Memphis TN
Salem OR - PGE
Phoenix AZ - SRP
Phoenix AZ - APS
Richmond, VA
Palm Beach County FL
Stockton CA
Buffalo, NY
Rochester, NY
Charlette NC
GARD Analytics 61 Utility Allowance Model Update
Other Elec - Apt 5+
0
5000
10000
15000
20000
25000
30000
35000
40000
0 BR 1 BR 2 BR 3 BR 4 BR 5 BR
En
erg
y U
se
(k
Btu
/yr)
Model
Richmond, VA
Palm Beach County FL
Orlando FL
Buffalo, NY
Buffalo, NY
Tacoma WA
Minneapolis MN
Tampa Florida
St. Louis MO
Las Vegas NV
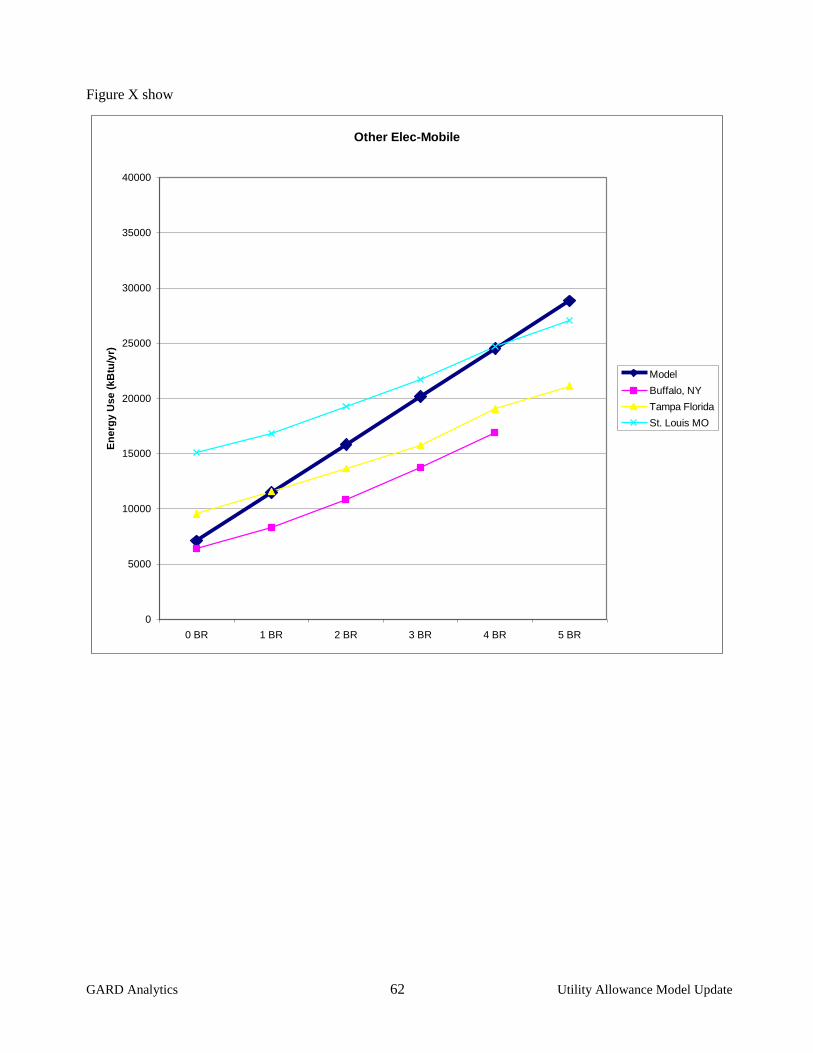
GARD Analytics 62 Utility Allowance Model Update
Figure X show
Other Elec-Mobile
0
5000
10000
15000
20000
25000
30000
35000
40000
0 BR 1 BR 2 BR 3 BR 4 BR 5 BR
En
erg
y U
se
(k
Btu
/yr)
Model
Buffalo, NY
Tampa Florida
St. Louis MO
GARD Analytics 63 Utility Allowance Model Update
Other Elec - SF Att
0
5000
10000
15000
20000
25000
30000
35000
40000
0 BR 1 BR 2 BR 3 BR 4 BR 5 BR
En
erg
y U
se
(k
Btu
/yr)
Model
Salem OR - SE
Salem OR - PGE
Phoenix AZ - SRP
Phoenix AZ - APS
Stockton CA
Rochester, NY
Buffalo, NY
Rochester, NY
Tacoma WA
Charlette NC
Scranton PA
Norfolk VA
Minneapolis MN
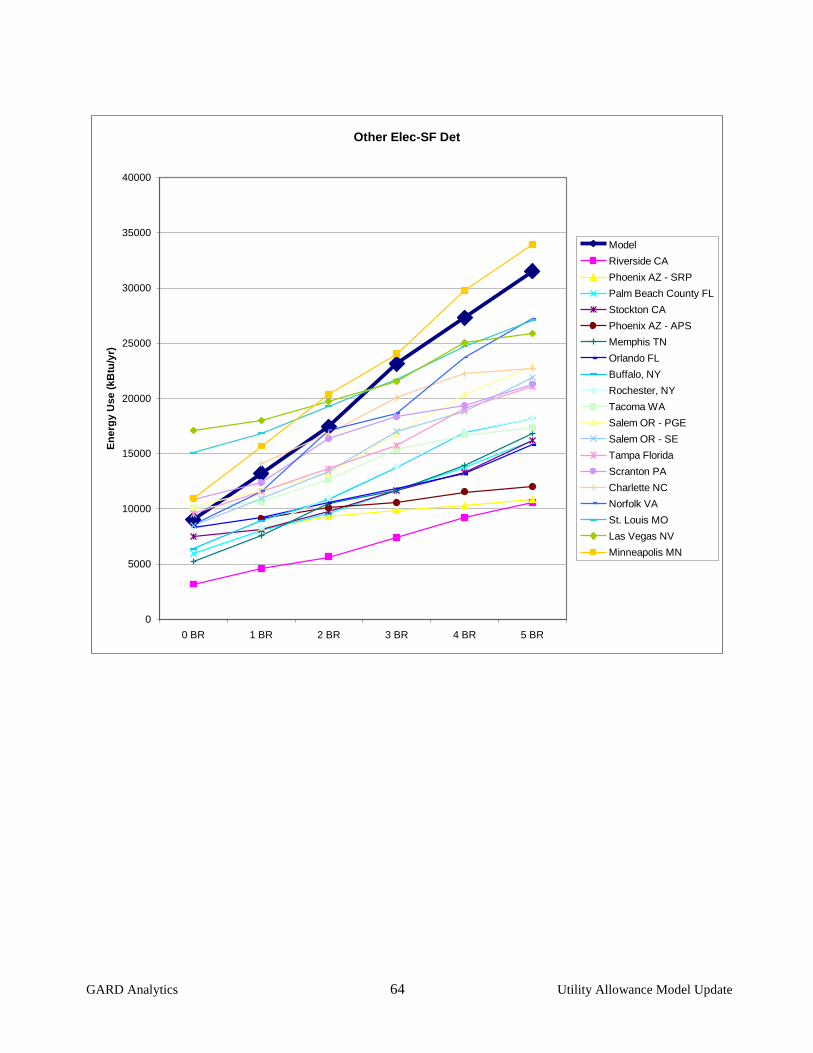
GARD Analytics 64 Utility Allowance Model Update
Other Elec-SF Det
0
5000
10000
15000
20000
25000
30000
35000
40000
0 BR 1 BR 2 BR 3 BR 4 BR 5 BR
En
erg
y U
se
(k
Btu
/yr)
Model
Riverside CA
Phoenix AZ - SRP
Palm Beach County FL
Stockton CA
Phoenix AZ - APS
Memphis TN
Orlando FL
Buffalo, NY
Rochester, NY
Tacoma WA
Salem OR - PGE
Salem OR - SE
Tampa Florida
Scranton PA
Charlette NC
Norfolk VA
St. Louis MO
Las Vegas NV
Minneapolis MN