final report - ig-18-011 - nasa oig no. ig-18-011 nasa's surface water ... researchers...
TRANSCRIPT
NASA Office of Inspector General
Office of Audits
Report No. IG-18-011
NASA'S SURFACE WATER AND OCEAN TOPOGRAPHY MISSION
January 17, 2018
National Aeronautics and Space Administration

Office of Inspector General
To report, fraud, waste, abuse, or mismanagement, contact the NASA OIG Hotline at 800-424-9183 or 800-535-8134 (TDD) or visit https://oig.nasa.gov/hotline.html. You can also write to NASA Inspector General, P.O. Box 23089, L’Enfant Plaza Station, Washington, D.C. 20026. The identity of each writer and caller can be kept confidential, upon request, to the extent permitted by law.
To suggest ideas for or to request future audits contact the Assistant Inspector General for Audits at https://oig.nasa.gov/aboutAll.html.
RESULTS IN BRIEF NASA’s Surface Water and Ocean Topography Mission
January 17, 2018 NASA Office of Inspector General
Office of Audits IG-18-011 (A-17-007-00)
The volume and flow of water in the Earth’s atmosphere, on the planet’s surface, and beneath the surface has direct effects on weather, human health, sea level, fresh water availability, and agriculture. The Surface Water and Ocean Topography (SWOT) satellite mission, scheduled to launch in April 2021, will produce the first global survey of Earth’s surface water, observe details of the ocean’s surface topography, and measure how water bodies change over time. Project data will increase understanding of how fresh water flows to identify reservoirs of drinkable water and help researchers understand the impact of floods, hurricanes, and how the oceans impact climate change.
The SWOT mission, assigned to the Jet Propulsion Laboratory (JPL), has a $755 million estimated life-cycle cost to NASA and about $400 million in contributions from the French space agency Centre National d’Etudes Spatiales (CNES) and the Canadian Space Agency (CSA). To accomplish its objectives, SWOT will deploy a suite of scientific instruments, including the Ka-band Radar Interferometer (KaRIn), the satellite’s primary instrument developed by NASA.
In this audit we evaluated NASA’s management of SWOT relative to achieving technical objectives, meeting milestones, and controlling costs. Specifically, we assessed whether (1) emerging challenges may prevent NASA from achieving these goals and (2) the project’s baseline plan was developed from accurate cost, schedule, and risk information. To complete this work, we reviewed documents and reports related to the Project, NASA policies, JPL analyses, and risk and cost data. We also evaluated the Project’s Integrated Master Schedule, sampled earned value cost account variances, assessed usage rates for project reserves, and interviewed Project personnel and other NASA officials.
Since SWOT entered development in May 2016, technical issues with NASA-developed instruments and key components from international partners have increased the Project’s development costs and consumed schedule margin. In the near term, these issues pose a risk to the Project’s readiness for its Critical Design Review (CDR), the point at which NASA will determine whether SWOT’s design is sufficiently mature to proceed to full scale fabrication, assembly, integration, and testing. These challenges threaten to increase SWOT’s life-cycle costs and potentially delay the launch schedule.
Specifically, the Project has experienced mechanical and electrical issues with KaRln. In our judgment, NASA and its international partners underestimated SWOT’s technical complexity and the Project is likely to encounter additional challenges as it proceeds to integration, the point in a project’s development where NASA missions historically experience schedule delays and the greatest cost growth. In addition, Project management at JPL has been challenged to maintain the staffing required to address KaRIn’s development tasks and address concerns related to its payload mass. Further, the Project’s international partners have experienced technical issues, including unexpected modifications identified during development of the Duplexer instrument, the delayed availability of components needed to develop the Extended Interaction Klystron instrument, and untimely revised shock level specifications provided by JPL.
WHY WE PERFORMED THIS AUDIT
WHAT WE FOUND
Project managers attribute SWOT’s increased costs and deteriorated schedule to a tactical decision to shift complex development tasks earlier than initially planned with the expectation that the Project’s cost and schedule will recover once they begin performing less complex tasks. However, we question this expectation and are concerned the Project’s cost and schedule may deteriorate further.
NASA used an estimation tool known as a joint cost and schedule confidence level (JCL) analysis to generate a statistical representation of the likelihood the Project will achieve its objectives within budget and on time. We found SWOT’s JCL analysis did not include detailed tasks for integration and testing of the payload module with the spacecraft bus, which represents the final 10 percent of the Project’s development tasks, nor did it include other risks associated with working with international partners and delivery of the satellite’s launch vehicle. Consequently, incomplete or unreliable information may have been used to establish the Project’s baseline, likely resulting in underestimated cost and schedule.
Further, SWOT’s current metrics indicate the Project is performing below expectations and the estimated cost to complete Project development has increased by $25 million. Although the Project Manager indicated the degraded cost performance was due to management’s decision to re-order tasks, since SWOT entered development in May 2016 the Project’s cost and schedule performance has steadily degraded. If not addressed, these cost and schedule challenges could result in the Project exceeding its overall cost and could delay the Project’s launch date.
For the SWOT mission to achieve its technical objectives, meet its milestones, and control its costs, we recommended the Associate Administrator for Science require the SWOT Project Manager to (1) perform a formal assessment of the schedule impact of all ongoing technical issues to determine whether the current CDR schedule is still viable, (2) assess the revised CNES and CSA schedules and provide resources necessary to ensure timely delivery of critical components, (3) reassess the criticality assigned to the risk of NASA exceeding its payload mass allocation and develop a plan to manage the risk that correlates with revised criticality levels, and (4) evaluate past performance and future risks to determine whether current cost and schedule projections are attainable or need to be revised. We also recommended the Associate Administrator require the Standing Review Board to monitor and document variances from NASA’s JCL policy and any potential cost and schedule impacts. Finally, we recommended the JPL Director evaluate current and future technical staffing requirements and make adjustments as necessary.
We provided a draft of this report to NASA management who concurred with our recommendations and described actions the Agency plans to take to address them. Overall, we consider management’s comments responsive. However, consistent with our findings in this and prior reports, we continue to believe international partner and launch vehicle risks should be included in JCL analyses. Therefore, one recommendation will remain open pending further discussion with NASA management about a change in Agency practice and policy. The other recommendations are resolved and will be closed upon verification and completion of the proposed corrective actions.
WHAT WE RECOMMENDED
For more information on the NASA Office of Inspector General and to view this and other reports visit http://oig.nasa.gov/.
NASA Office of Inspector General IG-18-011 i
TABLE OF CONTENTS
Introduction .................................................................................................................................................. 1
Background ............................................................................................................................................... 2
SWOT is Experiencing Cost Growth and Schedule Delays Due to the Technical Complexity of Project Instruments ............................................................................................................................... 11
SWOT’s Technically Complex Instruments Are Experiencing Development Issues ................................ 11
Impact of Technical Challenges to Project Schedule .............................................................................. 17
International Partners Developing Critical Technologies Are Facing Schedule Delays and Cost Growth ..................................................................................................................................... 18
SWOT Faces Unaccounted-for Risks That May Further Negatively Impact Cost and Schedule .............. 20
Deficiencies in SWOT’s Baseline Estimate .............................................................................................. 20
Earned Value Management Performance Metrics Indicate SWOT’s Performance Could Deteriorate Further ................................................................................................................................. 22
Conclusion .................................................................................................................................................. 24
Recommendations, Management’s Response, and Our Evaluation ........................................................ 25
Appendix A: Scope and Methodology ...................................................................................................... 27
Appendix B: SWOT Instruments ............................................................................................................... 29
Appendix C: Technology Readiness Levels ............................................................................................... 31
Appendix D: NASA OIG Calculation of Estimated Cost to Complete Project Development ................... 32
Appendix E: Management’s Comments ................................................................................................... 34
Appendix F: Report Distribution ............................................................................................................... 39
NASA Office of Inspector General IG-18-011 ii
Acronyms ANSI/EIA American National Standards Institute/Electronic Industries Alliance
CDR Critical Design Review
CNES Centre National d’Etudes Spatiales
CPI Cost Performance Index
CSA Canadian Space Agency
EIK Extended Interaction Klystron
EVM Earned Value Management
GAO Government Accountability Office
HVPS High Voltage Power Supply
JCL Joint Cost and Schedule Confidence Level
JPL Jet Propulsion Laboratory
KaRIn Ka-band Radar Interferometer
KDP Key Decision Point
NPR NASA Procedural Requirements
NRC National Research Council
OIG Office of Inspector General
OSTM Ocean Surface Topography Mission
PDR Preliminary Design Review
RFU Radio Frequency Unit
SRB Standing Review Board
SWOT Surface Water and Ocean Topography
TOPEX Ocean Topography Experiment
TRL Technology Readiness Level
NASA Office of Inspector General IG-18-011 1
INTRODUCTION
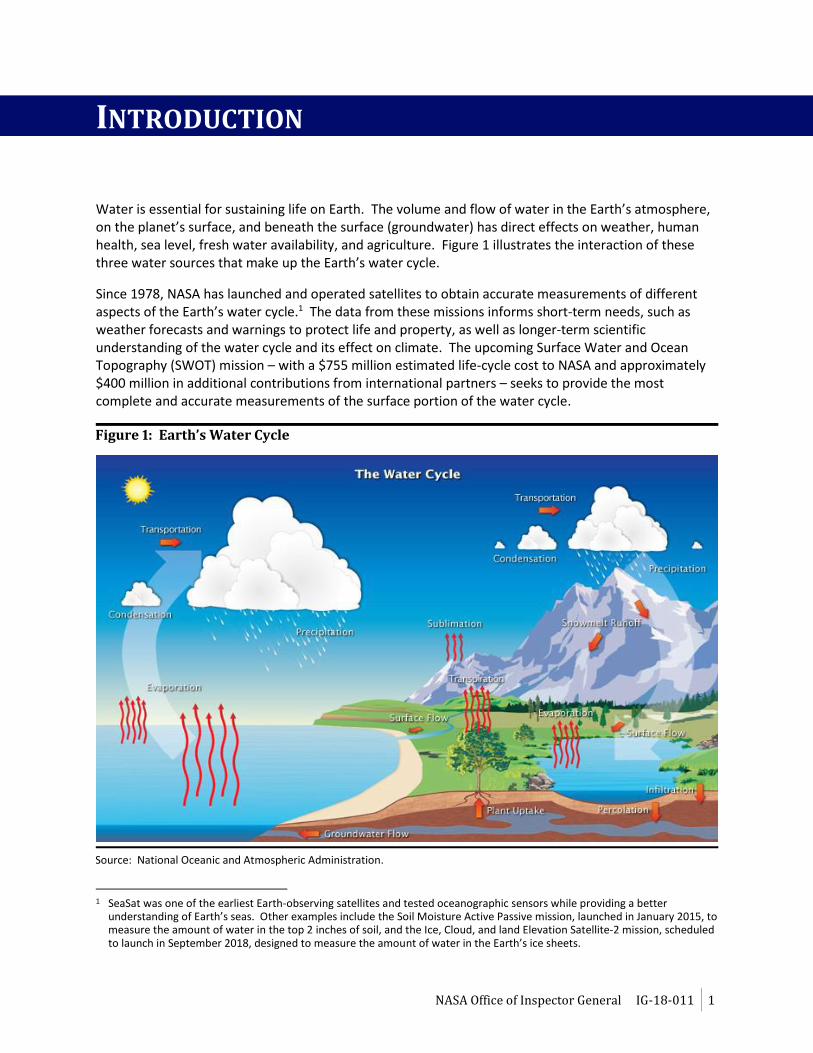
Water is essential for sustaining life on Earth. The volume and flow of water in the Earth’s atmosphere, on the planet’s surface, and beneath the surface (groundwater) has direct effects on weather, human health, sea level, fresh water availability, and agriculture. Figure 1 illustrates the interaction of these three water sources that make up the Earth’s water cycle.
Since 1978, NASA has launched and operated satellites to obtain accurate measurements of different aspects of the Earth’s water cycle.1 The data from these missions informs short-term needs, such as weather forecasts and warnings to protect life and property, as well as longer-term scientific understanding of the water cycle and its effect on climate. The upcoming Surface Water and Ocean Topography (SWOT) mission – with a $755 million estimated life-cycle cost to NASA and approximately $400 million in additional contributions from international partners – seeks to provide the most complete and accurate measurements of the surface portion of the water cycle.
Figure 1: Earth’s Water Cycle
Source: National Oceanic and Atmospheric Administration.
1 SeaSat was one of the earliest Earth-observing satellites and tested oceanographic sensors while providing a better
understanding of Earth’s seas. Other examples include the Soil Moisture Active Passive mission, launched in January 2015, to measure the amount of water in the top 2 inches of soil, and the Ice, Cloud, and land Elevation Satellite-2 mission, scheduled to launch in September 2018, designed to measure the amount of water in the Earth’s ice sheets.
NASA Office of Inspector General IG-18-011 2
We initiated this audit to evaluate NASA’s management of SWOT relative to achieving technical objectives, meeting milestones, and controlling costs. In addition, we assessed whether (1) emerging challenges may prevent NASA from achieving these goals and (2) the project’s baseline plan was developed from accurate cost, schedule, and risk information. See Appendix A for details on the audit’s scope and methodology.
Background NASA’s Science Mission Directorate conducts scientific exploration by developing projects and missions that monitor and visit other planets and bodies in the solar system, observe and analyze stars and exoplanets in the Milky Way and beyond, and study the Earth and its component systems such as the atmosphere, climate, and water cycle. These missions are developed within the Directorate’s Astrophysics, Earth Science, Heliophysics, and Planetary Science Divisions and focus on answering questions related to the origins and destiny of the universe, the Sun and its effects on Earth and the rest of the solar system, the Earth’s climate, the history of the solar system, and the potential for life elsewhere. In doing so, the Directorate manages about 76 operating missions and 49 others in various phases of development while also funding research drawn from the data provided by these projects.
The selection and balance of NASA’s science missions is heavily influenced by stakeholders external to the Agency, including the President, Congress, the science community, and, to a lesser extent, other Federal and international agencies. The President and Congress provide direction through the budgeting and appropriation process. The science community – as represented by the National Research Council (NRC) – establishes mission priorities based on a broad consensus within various research disciplines set forth in decadal surveys that track the Directorate’s four Divisions.2
In 2007, the NRC completed the first comprehensive survey of all Earth sciences that could benefit from spaceborne observations. This 2007 Earth Science Decadal Survey (Decadal Survey) recommended 15 missions in three tiers of priority.3 The SWOT mission was included in the second tier identified for launch between 2013 and 2016.4
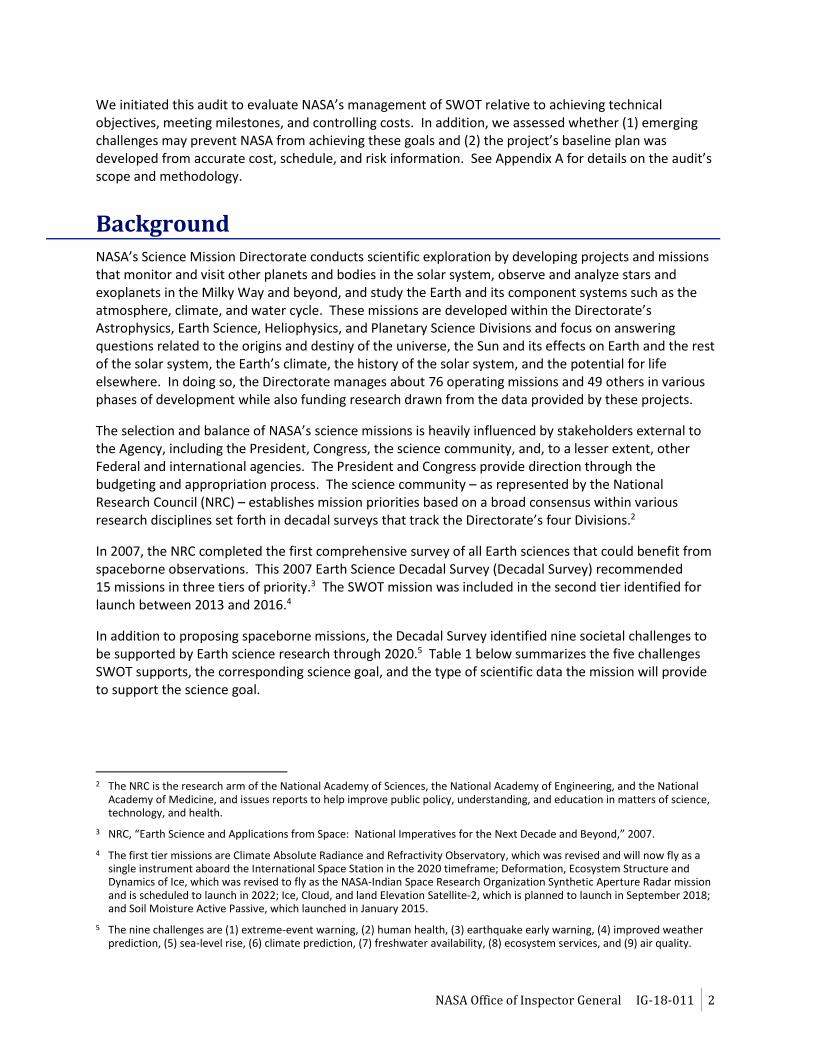
In addition to proposing spaceborne missions, the Decadal Survey identified nine societal challenges to be supported by Earth science research through 2020.5 Table 1 below summarizes the five challenges SWOT supports, the corresponding science goal, and the type of scientific data the mission will provide to support the science goal.
2 The NRC is the research arm of the National Academy of Sciences, the National Academy of Engineering, and the National
Academy of Medicine, and issues reports to help improve public policy, understanding, and education in matters of science, technology, and health.
3 NRC, “Earth Science and Applications from Space: National Imperatives for the Next Decade and Beyond,” 2007.
4 The first tier missions are Climate Absolute Radiance and Refractivity Observatory, which was revised and will now fly as a single instrument aboard the International Space Station in the 2020 timeframe; Deformation, Ecosystem Structure and Dynamics of Ice, which was revised to fly as the NASA-Indian Space Research Organization Synthetic Aperture Radar mission and is scheduled to launch in 2022; Ice, Cloud, and land Elevation Satellite-2, which is planned to launch in September 2018; and Soil Moisture Active Passive, which launched in January 2015.
5 The nine challenges are (1) extreme-event warning, (2) human health, (3) earthquake early warning, (4) improved weather prediction, (5) sea-level rise, (6) climate prediction, (7) freshwater availability, (8) ecosystem services, and (9) air quality.
NASA Office of Inspector General IG-18-011 3
Table 1: SWOT Contributions to Societal Challenges – 2007 Decadal Survey
Societal Challenge Decadal Survey Science Goal Measurements SWOT Will
Provide to Support Science Goal
Extreme-Event Warning
Longer-term, more reliable storm track forecasts; storm intensification predictions; and volcanic eruption and landslide warnings to enable effective evacuation planning
Global sea-level heights and changes Ocean eddies and currents estimates
Human Health More reliable forecasts of infectious disease outbreaks for disease control and response
River discharge estimates
Sea-Level Rise
Climate predictions based on better understanding of ocean temperature and ice sheet volume changes and feedback to enable effective coastal community planning
Global sea-level heights and changes
Fresh Water Availability Improved precipitation and drought forecasts to improve water resource management
River discharge estimates
Ecosystem Services
Improved land use and forecasts of agricultural and ocean productivity to improve planting and harvesting schedules and management of fisheries
Ocean eddies and currents estimates
Source: NRC.
NASA’s Study of Earth’s Surface Water
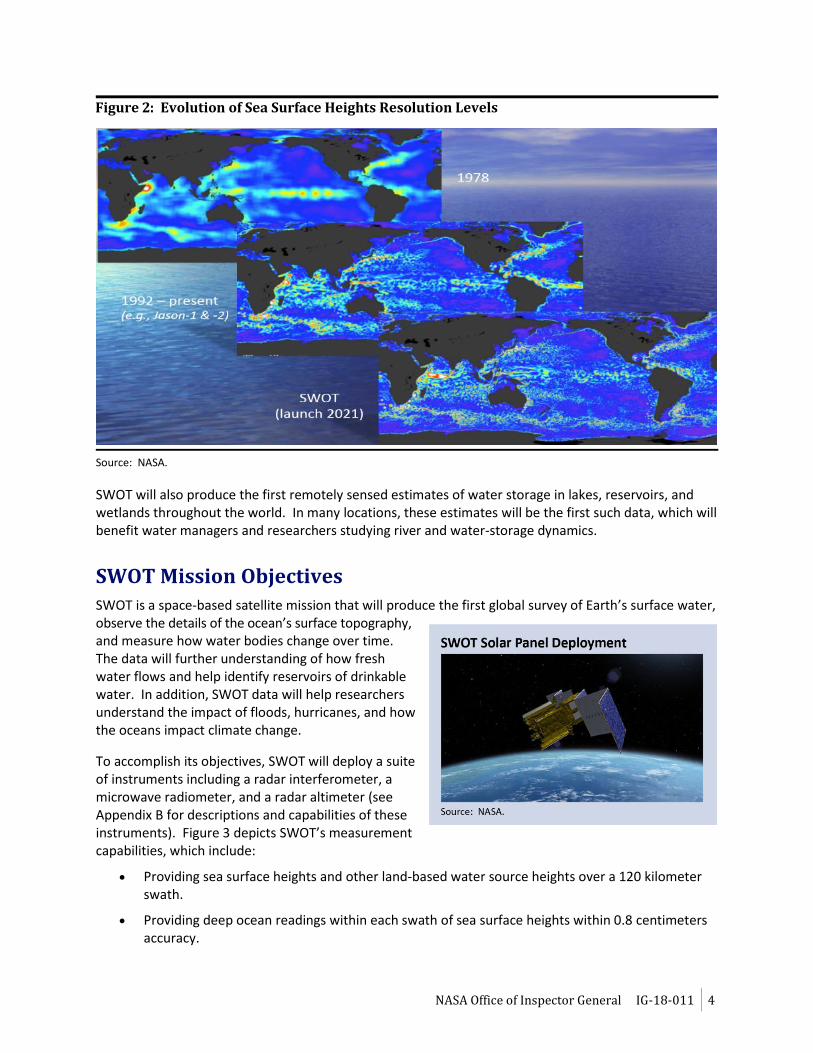
NASA has observed the Earth’s surface water from space since 1978 when it launched the SeaSat mission that tested a variety of oceanographic sensors to better understand the oceans. In addition, the Ocean Topography Experiment (TOPEX)/Poseidon, Jason-1, Ocean Surface Topography Mission (OSTM)/Jason-2, and Jason-3 satellites – launched in August 1992, December 2001, June 2008, and January 2016, respectively – provide ocean topography measurements to gain insight into ocean circulation and climate change. However, instruments on these satellites are not able to provide the detailed data required to assess water levels of rivers and near coastlines. SWOT’s instruments will enable scientists to analyze water surfaces over oceans and land at much higher resolution than previous missions – from its orbit 891 kilometers above the Earth’s surface, SWOT will be able to measure water levels over oceans, large lakes, and rivers to within about one centimeter or the width of a person’s thumbnail. Figure 2 provides a graphic representation of SWOT’s sea height measurement resolution compared to previously available data.
NASA Office of Inspector General IG-18-011 4
Figure 2: Evolution of Sea Surface Heights Resolution Levels
Source: NASA.
SWOT will also produce the first remotely sensed estimates of water storage in lakes, reservoirs, and wetlands throughout the world. In many locations, these estimates will be the first such data, which will benefit water managers and researchers studying river and water-storage dynamics.
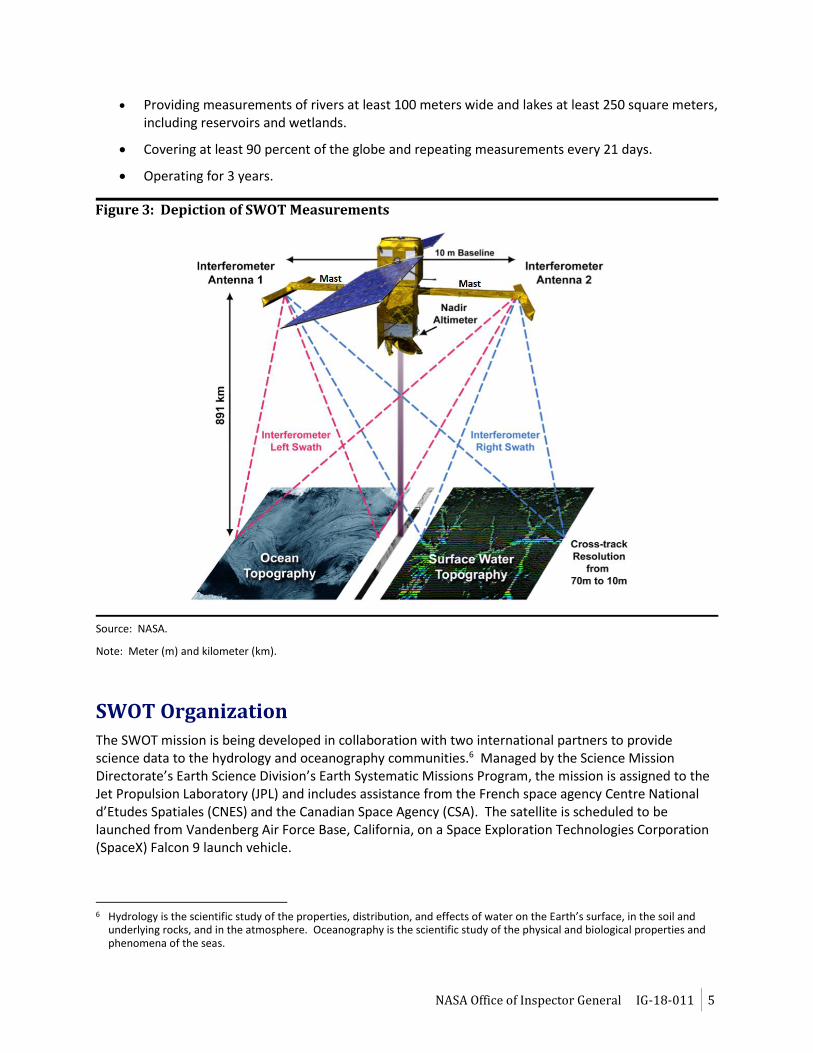
SWOT Mission Objectives
SWOT is a space-based satellite mission that will produce the first global survey of Earth’s surface water, observe the details of the ocean’s surface topography, and measure how water bodies change over time. The data will further understanding of how fresh water flows and help identify reservoirs of drinkable water. In addition, SWOT data will help researchers understand the impact of floods, hurricanes, and how the oceans impact climate change.
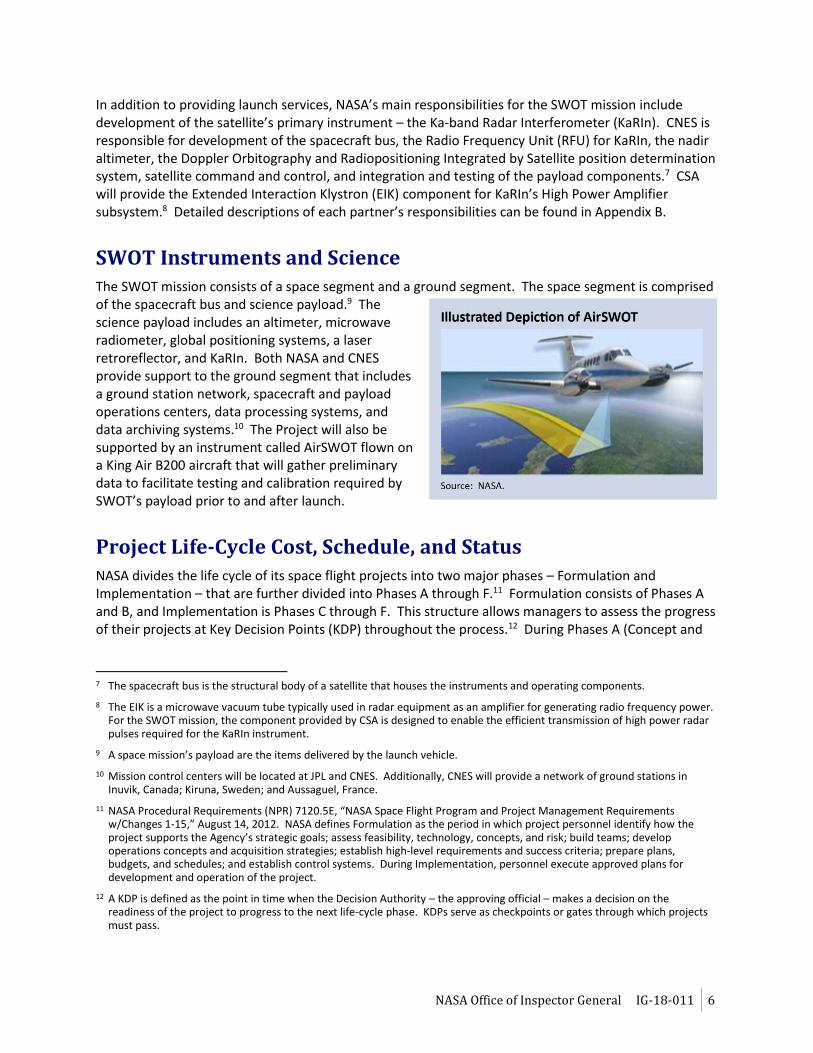
To accomplish its objectives, SWOT will deploy a suite of instruments including a radar interferometer, a microwave radiometer, and a radar altimeter (see Appendix B for descriptions and capabilities of these instruments). Figure 3 depicts SWOT’s measurement capabilities, which include:
Providing sea surface heights and other land-based water source heights over a 120 kilometer swath.
Providing deep ocean readings within each swath of sea surface heights within 0.8 centimeters accuracy.
NASA Office of Inspector General IG-18-011 5
Providing measurements of rivers at least 100 meters wide and lakes at least 250 square meters, including reservoirs and wetlands.
Covering at least 90 percent of the globe and repeating measurements every 21 days.
Operating for 3 years.
Figure 3: Depiction of SWOT Measurements
Source: NASA.
Note: Meter (m) and kilometer (km).
SWOT Organization
The SWOT mission is being developed in collaboration with two international partners to provide science data to the hydrology and oceanography communities.6 Managed by the Science Mission Directorate’s Earth Science Division’s Earth Systematic Missions Program, the mission is assigned to the Jet Propulsion Laboratory (JPL) and includes assistance from the French space agency Centre National d’Etudes Spatiales (CNES) and the Canadian Space Agency (CSA). The satellite is scheduled to be launched from Vandenberg Air Force Base, California, on a Space Exploration Technologies Corporation (SpaceX) Falcon 9 launch vehicle.
6 Hydrology is the scientific study of the properties, distribution, and effects of water on the Earth’s surface, in the soil and
underlying rocks, and in the atmosphere. Oceanography is the scientific study of the physical and biological properties and phenomena of the seas.
NASA Office of Inspector General IG-18-011 6
In addition to providing launch services, NASA’s main responsibilities for the SWOT mission include development of the satellite’s primary instrument – the Ka-band Radar Interferometer (KaRIn). CNES is responsible for development of the spacecraft bus, the Radio Frequency Unit (RFU) for KaRIn, the nadir altimeter, the Doppler Orbitography and Radiopositioning Integrated by Satellite position determination system, satellite command and control, and integration and testing of the payload components.7 CSA will provide the Extended Interaction Klystron (EIK) component for KaRIn’s High Power Amplifier subsystem.8 Detailed descriptions of each partner’s responsibilities can be found in Appendix B.
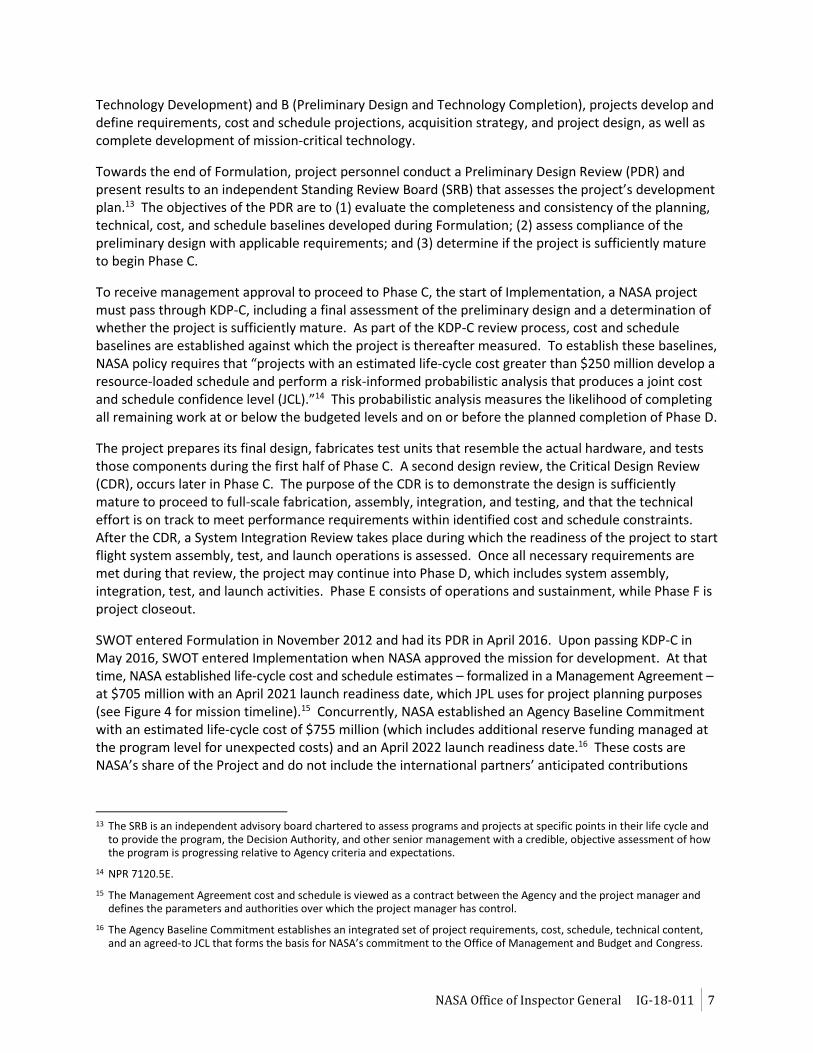
SWOT Instruments and Science The SWOT mission consists of a space segment and a ground segment. The space segment is comprised of the spacecraft bus and science payload.9 The science payload includes an altimeter, microwave radiometer, global positioning systems, a laser retroreflector, and KaRIn. Both NASA and CNES provide support to the ground segment that includes a ground station network, spacecraft and payload operations centers, data processing systems, and data archiving systems.10 The Project will also be supported by an instrument called AirSWOT flown on a King Air B200 aircraft that will gather preliminary data to facilitate testing and calibration required by SWOT’s payload prior to and after launch.
Project Life-Cycle Cost, Schedule, and Status NASA divides the life cycle of its space flight projects into two major phases – Formulation and Implementation – that are further divided into Phases A through F.11 Formulation consists of Phases A and B, and Implementation is Phases C through F. This structure allows managers to assess the progress of their projects at Key Decision Points (KDP) throughout the process.12 During Phases A (Concept and
7 The spacecraft bus is the structural body of a satellite that houses the instruments and operating components.
8 The EIK is a microwave vacuum tube typically used in radar equipment as an amplifier for generating radio frequency power. For the SWOT mission, the component provided by CSA is designed to enable the efficient transmission of high power radar pulses required for the KaRIn instrument.
9 A space mission’s payload are the items delivered by the launch vehicle.
10 Mission control centers will be located at JPL and CNES. Additionally, CNES will provide a network of ground stations in Inuvik, Canada; Kiruna, Sweden; and Aussaguel, France.
11 NASA Procedural Requirements (NPR) 7120.5E, “NASA Space Flight Program and Project Management Requirements w/Changes 1-15,” August 14, 2012. NASA defines Formulation as the period in which project personnel identify how the project supports the Agency’s strategic goals; assess feasibility, technology, concepts, and risk; build teams; develop operations concepts and acquisition strategies; establish high-level requirements and success criteria; prepare plans, budgets, and schedules; and establish control systems. During Implementation, personnel execute approved plans for development and operation of the project.
12 A KDP is defined as the point in time when the Decision Authority – the approving official – makes a decision on the readiness of the project to progress to the next life-cycle phase. KDPs serve as checkpoints or gates through which projects must pass.
NASA Office of Inspector General IG-18-011 7
Technology Development) and B (Preliminary Design and Technology Completion), projects develop and define requirements, cost and schedule projections, acquisition strategy, and project design, as well as complete development of mission-critical technology.
Towards the end of Formulation, project personnel conduct a Preliminary Design Review (PDR) and present results to an independent Standing Review Board (SRB) that assesses the project’s development plan.13 The objectives of the PDR are to (1) evaluate the completeness and consistency of the planning, technical, cost, and schedule baselines developed during Formulation; (2) assess compliance of the preliminary design with applicable requirements; and (3) determine if the project is sufficiently mature to begin Phase C.
To receive management approval to proceed to Phase C, the start of Implementation, a NASA project must pass through KDP-C, including a final assessment of the preliminary design and a determination of whether the project is sufficiently mature. As part of the KDP-C review process, cost and schedule baselines are established against which the project is thereafter measured. To establish these baselines, NASA policy requires that “projects with an estimated life-cycle cost greater than $250 million develop a resource-loaded schedule and perform a risk-informed probabilistic analysis that produces a joint cost and schedule confidence level (JCL).”14 This probabilistic analysis measures the likelihood of completing all remaining work at or below the budgeted levels and on or before the planned completion of Phase D.
The project prepares its final design, fabricates test units that resemble the actual hardware, and tests those components during the first half of Phase C. A second design review, the Critical Design Review (CDR), occurs later in Phase C. The purpose of the CDR is to demonstrate the design is sufficiently mature to proceed to full-scale fabrication, assembly, integration, and testing, and that the technical effort is on track to meet performance requirements within identified cost and schedule constraints. After the CDR, a System Integration Review takes place during which the readiness of the project to start flight system assembly, test, and launch operations is assessed. Once all necessary requirements are met during that review, the project may continue into Phase D, which includes system assembly, integration, test, and launch activities. Phase E consists of operations and sustainment, while Phase F is project closeout.
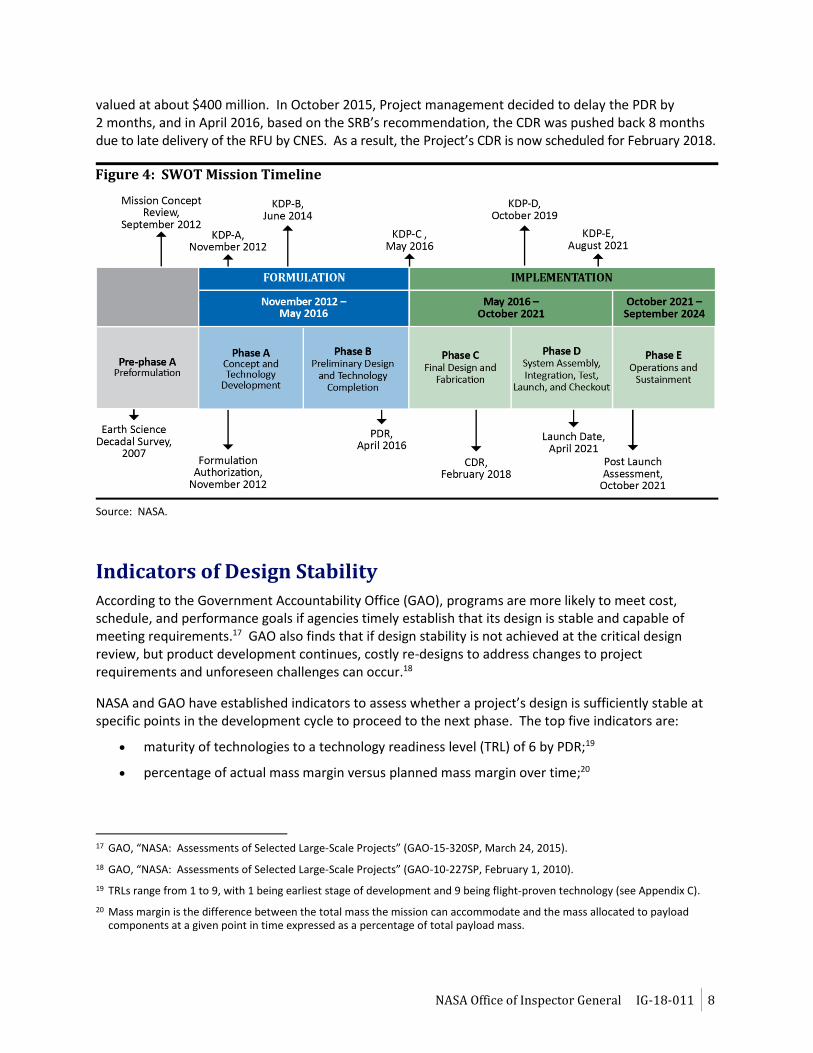
SWOT entered Formulation in November 2012 and had its PDR in April 2016. Upon passing KDP-C in May 2016, SWOT entered Implementation when NASA approved the mission for development. At that time, NASA established life-cycle cost and schedule estimates – formalized in a Management Agreement – at $705 million with an April 2021 launch readiness date, which JPL uses for project planning purposes (see Figure 4 for mission timeline).15 Concurrently, NASA established an Agency Baseline Commitment with an estimated life-cycle cost of $755 million (which includes additional reserve funding managed at the program level for unexpected costs) and an April 2022 launch readiness date.16 These costs are NASA’s share of the Project and do not include the international partners’ anticipated contributions
13 The SRB is an independent advisory board chartered to assess programs and projects at specific points in their life cycle and
to provide the program, the Decision Authority, and other senior management with a credible, objective assessment of how the program is progressing relative to Agency criteria and expectations.
14 NPR 7120.5E.
15 The Management Agreement cost and schedule is viewed as a contract between the Agency and the project manager and defines the parameters and authorities over which the project manager has control.
16 The Agency Baseline Commitment establishes an integrated set of project requirements, cost, schedule, technical content, and an agreed-to JCL that forms the basis for NASA’s commitment to the Office of Management and Budget and Congress.
NASA Office of Inspector General IG-18-011 8
valued at about $400 million. In October 2015, Project management decided to delay the PDR by 2 months, and in April 2016, based on the SRB’s recommendation, the CDR was pushed back 8 months due to late delivery of the RFU by CNES. As a result, the Project’s CDR is now scheduled for February 2018.
Figure 4: SWOT Mission Timeline
Source: NASA.
Indicators of Design Stability
According to the Government Accountability Office (GAO), programs are more likely to meet cost, schedule, and performance goals if agencies timely establish that its design is stable and capable of meeting requirements.17 GAO also finds that if design stability is not achieved at the critical design review, but product development continues, costly re-designs to address changes to project requirements and unforeseen challenges can occur.18
NASA and GAO have established indicators to assess whether a project’s design is sufficiently stable at specific points in the development cycle to proceed to the next phase. The top five indicators are:
maturity of technologies to a technology readiness level (TRL) of 6 by PDR;19
percentage of actual mass margin versus planned mass margin over time;20
17 GAO, “NASA: Assessments of Selected Large-Scale Projects” (GAO-15-320SP, March 24, 2015).
18 GAO, “NASA: Assessments of Selected Large-Scale Projects” (GAO-10-227SP, February 1, 2010).
19 TRLs range from 1 to 9, with 1 being earliest stage of development and 9 being flight-proven technology (see Appendix C).
20 Mass margin is the difference between the total mass the mission can accommodate and the mass allocated to payload components at a given point in time expressed as a percentage of total payload mass.
NASA Office of Inspector General IG-18-011 9
percentage of verification and validation plans complete at PDR and CDR;21
identification, trace, and flowdown of the project’s top-level requirements that define mission success criteria and are imposed by NASA to requirements at the subsystem level by the time of the PDR; and
level of funding reserves and schedule margin at various points in the development life cycle.22
One of the primary indicators of design stability is the readiness of critical technologies. Typically, critical technologies are new technologies the project depends on to meet minimal performance levels. NASA categorizes space technologies into TRLs 1 through 9. As shown in Appendix C, scientific research at TRL 1 is in its early stage. In contrast, at TRL 9 the technology has been proven on a successful operational flight. NASA and GAO guidelines state that critical technologies should be at least at TRL 6 when a project completes PDR – meaning the technology has been demonstrated in a fully integrated prototype in a relevant environment that simulates the conditions in which it will operate. According to GAO, achieving this level of maturity minimizes risks as the system enters the next stage of development. Accordingly, the TRL of critical technologies is an important measure of a project’s design stability and one indicator of the likelihood the project will be able to successfully meet cost and schedule goals.
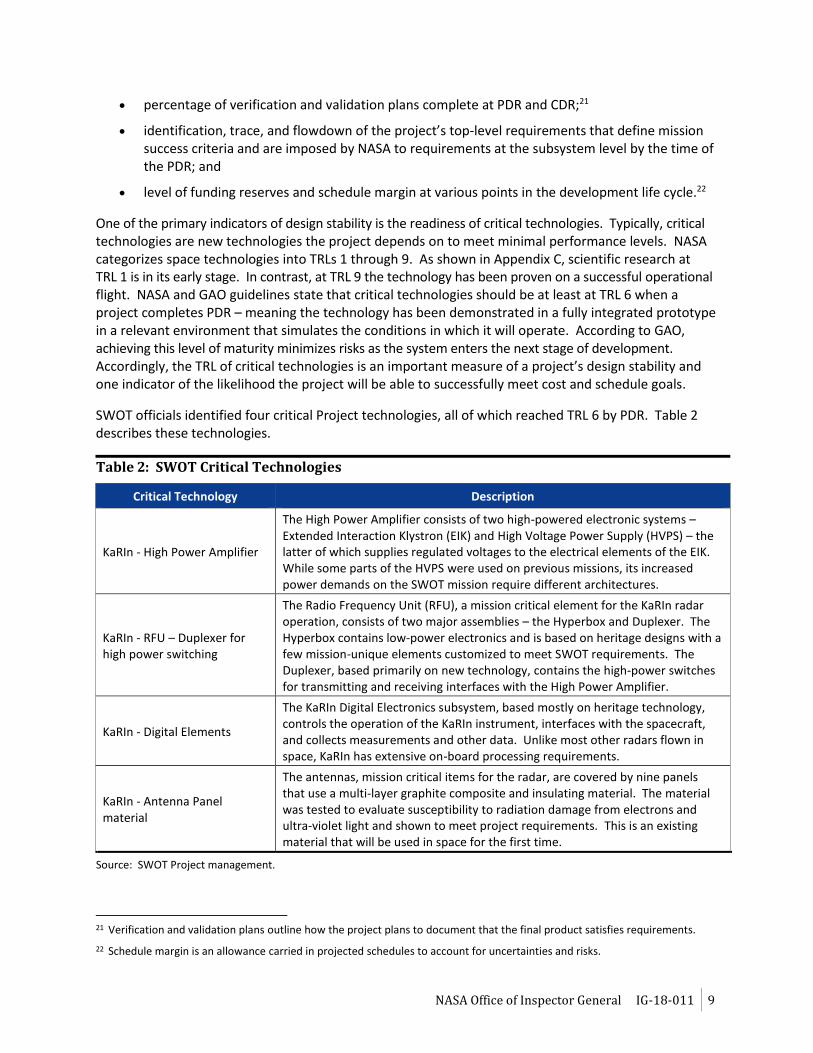
SWOT officials identified four critical Project technologies, all of which reached TRL 6 by PDR. Table 2 describes these technologies.
Table 2: SWOT Critical Technologies
Critical Technology Description
KaRIn - High Power Amplifier
The High Power Amplifier consists of two high-powered electronic systems – Extended Interaction Klystron (EIK) and High Voltage Power Supply (HVPS) – the latter of which supplies regulated voltages to the electrical elements of the EIK. While some parts of the HVPS were used on previous missions, its increased power demands on the SWOT mission require different architectures.
KaRIn - RFU – Duplexer for high power switching
The Radio Frequency Unit (RFU), a mission critical element for the KaRIn radar operation, consists of two major assemblies – the Hyperbox and Duplexer. The Hyperbox contains low-power electronics and is based on heritage designs with a few mission-unique elements customized to meet SWOT requirements. The Duplexer, based primarily on new technology, contains the high-power switches for transmitting and receiving interfaces with the High Power Amplifier.
KaRIn - Digital Elements
The KaRIn Digital Electronics subsystem, based mostly on heritage technology, controls the operation of the KaRIn instrument, interfaces with the spacecraft, and collects measurements and other data. Unlike most other radars flown in space, KaRIn has extensive on-board processing requirements.
KaRIn - Antenna Panel material
The antennas, mission critical items for the radar, are covered by nine panels that use a multi-layer graphite composite and insulating material. The material was tested to evaluate susceptibility to radiation damage from electrons and ultra-violet light and shown to meet project requirements. This is an existing material that will be used in space for the first time.
Source: SWOT Project management.
21 Verification and validation plans outline how the project plans to document that the final product satisfies requirements.
22 Schedule margin is an allowance carried in projected schedules to account for uncertainties and risks.
NASA Office of Inspector General IG-18-011 10
Joint Cost and Schedule Confidence Level Analysis
A JCL analysis generates a statistical representation of the likelihood a project will achieve its objectives within budget and on time. The process uses software tools and models that combine cost, schedule, risk, and uncertainty estimates to evaluate and illustrate how expected threats and unexpected events affect a project’s cost and schedule. To generate this data, project managers develop comprehensive project plans, inputs, and priorities that integrate costs, schedules, risks, and uncertainties. NASA officials believe that gathering this data encourages better communication among project personnel; improves cost, schedule, risk, and uncertainty analyses; and fosters an understanding of how project elements impact one another. NASA requires projects to develop budgets consistent with a 70 percent JCL – in short, a 70 percent likelihood the project will launch on cost and on the planned schedule. In accordance with NASA policy, SWOT performed a JCL in April 2016 during its PDR. In May 2016, at KDP-C, the Decision Authority established an Agency Baseline Commitment life-cycle cost estimate and launch readiness date with an 80 percent confidence level.
Earned Value Management
Earned Value Management (EVM) is a project management tool that measures a project’s performance by comparing the estimated value of a completed task at a specific point in time in the project’s schedule with the actual cost. EVM was developed by the U.S. Department of Defense in the 1960s to provide performance data to help make decisions. NASA projects like SWOT use an EVM system to monitor performance. See Appendix D for a summary of the EVM requirements applicable to NASA.
The concept of earned value is fundamental to understanding how EVM works. The value of a task is how much project personnel initially estimated the task would cost to complete with the project “earning” that value when it completes the task. In other words, earned value is the estimated cost of the actual work completed. EVM produces two key metrics – cost and schedule – using the earned value concept to inform managers and decision-makers about the project’s performance.
Cost Performance
Cost performance is measured by comparing a project’s estimated cost to complete a task (the earned value) with the actual cost of the task. The result of this comparison is a ratio that provides managers and decision-makers with a simple indicator of how efficiently a project is completing its tasks from a cost perspective. When the actual cost of a task equals what was estimated the ratio is one. When a completed task costs less than estimated, the ratio is greater than one and indicates the project is completing tasks below budget. When a completed task costs more than estimated, the ratio is less than one and indicates the project is exceeding its planned budget.
Schedule Performance
Schedule performance is measured by comparing how much work a project has completed at a specific point in time to the work or tasks it had planned to complete by that point. Comparable to cost performance, a ratio greater than one indicates the project is accomplishing more work than planned, while a ratio less than one indicates the project is completing less work than planned.
NASA Office of Inspector General IG-18-011 11
SWOT IS EXPERIENCING COST GROWTH AND SCHEDULE DELAYS DUE TO THE TECHNICAL
COMPLEXITY OF PROJECT INSTRUMENTS
Since SWOT entered development in May 2016, technical issues with NASA-developed instruments as well as key components from international partners have increased the Project’s development costs and consumed schedule margin. In the near term, these issues pose a risk to the Project’s readiness for mission CDR and subsequently threaten to increase life-cycle costs and potentially delay the launch schedule. Specifically, the Project has experienced several mechanical and electrical issues with KaRln during development, technical staffing issues, and payload mass growth risks. In our judgment, NASA and its international partners underestimated SWOT’s technical complexity and the Project is likely to encounter additional challenges as it proceeds to integration, the point in a project’s development where NASA missions historically experience schedule delays and the greatest cost growth.23
SWOT’s Technically Complex Instruments Are Experiencing Development Issues Project personnel at JPL describe the SWOT mission as a “pathfinder” that will employ unprecedented science and technology. They acknowledged the Project’s primary instrument, KaRIn, is complex and will produce tremendous amounts of data, thereby presenting engineers with multiple challenges during SWOT’s design and development. In particular, KaRln is intended to provide data required by both the hydrology and oceanography scientific communities and is a brand new instrument that has not been flown on previous NASA missions.
In response to a questionnaire we provided to SWOT’s international partners, CNES, the French space agency, noted the SWOT mission is far more complex than any of its past cooperative missions with NASA. Moreover, CNES has found developing the Duplexer – a key component of the KaRIn instrument containing the high-power switches for interfacing between emission and reception channels – to be much more complex than it or NASA had envisioned.
As part of an independent assessment of the SWOT mission at PDR, the Aerospace Corporation (Aerospace) established a “complexity index” to compare the Project to other NASA spacecraft development projects.24 According to the Aerospace analysis, SWOT was assessed at the 84th percentile
23 Historical analysis of NASA mission cost performance trends indicate the greatest cost growth occurs during integration and
testing when projects are focused on evaluating hardware and software functionality and the cost to fix problems are higher.
24 Aerospace offers technical and scientific research and advisory services to national security space programs, such as the National Reconnaissance Office, and civil agencies like NASA and the National Oceanic and Atmospheric Administration. For decades, Aerospace has provided NASA with independent assessments of its programs in an effort to reduce risk and improve mission assurance.
NASA Office of Inspector General IG-18-011 12
for complexity. For context, the average complexity rating for failed or impaired NASA missions from 1998 through 2008 was 93 percent, while the average complexity of successful missions was 58 percent. The Aerospace study also concluded that missions with greater complexity had higher costs and longer schedules. Similarly, a NASA Instrument Capability Study concluded that there is a major correlation between instrument complexity and schedule delays.25 The study found that more complex instrument development projects were 3.2 times more likely to have schedule delays of 5 months or more.
In general, complexity can lead to difficulties in developing an instrument or verifying its requirements, two outcomes that translate into increased risk. A project’s technical complexity informs the development of cost estimates and risk mitigation plans; therefore, any misunderstanding of the overall complexity of an instrument affects the reasonableness of these estimates. In a September 2012 audit report, we explained how the technological complexity inherent in most NASA projects makes meeting initial cost and schedule goals so challenging.26 Furthermore, a recent GAO assessment of seven ongoing Science Mission Directorate projects similarly concluded that instrument development issues continue to represent the largest driver of cost growth.27
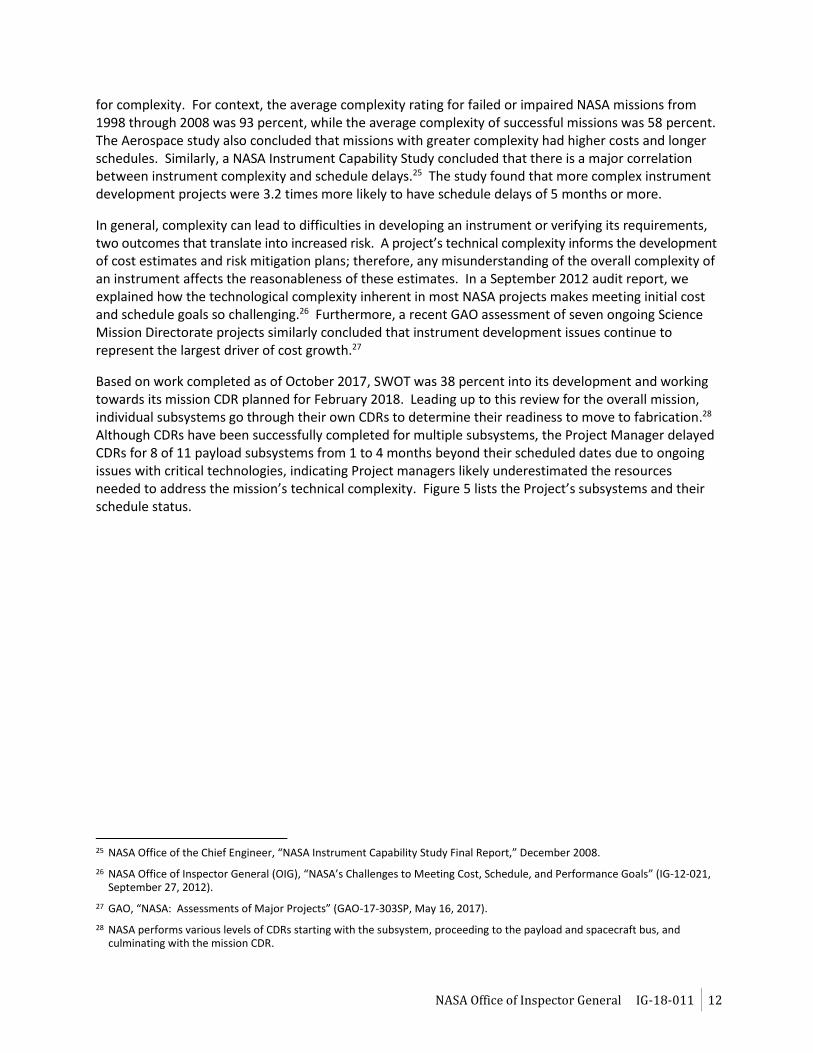
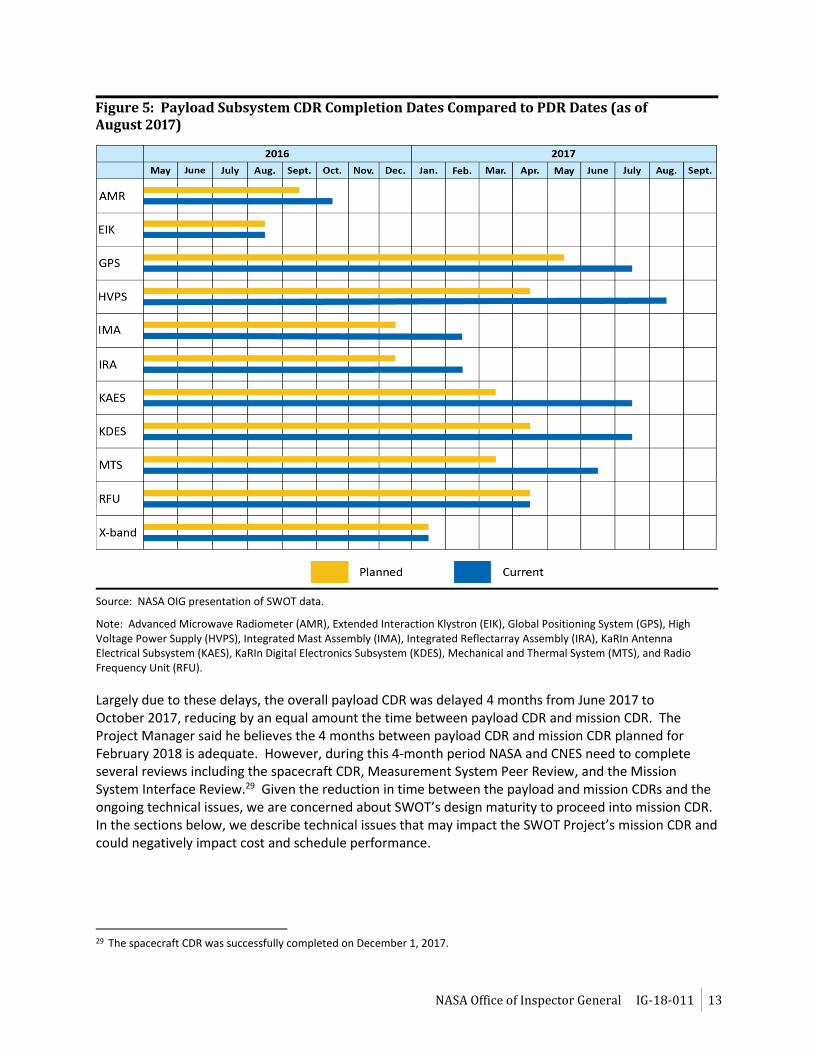
Based on work completed as of October 2017, SWOT was 38 percent into its development and working towards its mission CDR planned for February 2018. Leading up to this review for the overall mission, individual subsystems go through their own CDRs to determine their readiness to move to fabrication.28 Although CDRs have been successfully completed for multiple subsystems, the Project Manager delayed CDRs for 8 of 11 payload subsystems from 1 to 4 months beyond their scheduled dates due to ongoing issues with critical technologies, indicating Project managers likely underestimated the resources needed to address the mission’s technical complexity. Figure 5 lists the Project’s subsystems and their schedule status.
25 NASA Office of the Chief Engineer, “NASA Instrument Capability Study Final Report,” December 2008.
26 NASA Office of Inspector General (OIG), “NASA’s Challenges to Meeting Cost, Schedule, and Performance Goals” (IG-12-021, September 27, 2012).
27 GAO, “NASA: Assessments of Major Projects” (GAO-17-303SP, May 16, 2017).
28 NASA performs various levels of CDRs starting with the subsystem, proceeding to the payload and spacecraft bus, and culminating with the mission CDR.
NASA Office of Inspector General IG-18-011 13
Figure 5: Payload Subsystem CDR Completion Dates Compared to PDR Dates (as of August 2017)
Source: NASA OIG presentation of SWOT data.
Note: Advanced Microwave Radiometer (AMR), Extended Interaction Klystron (EIK), Global Positioning System (GPS), High Voltage Power Supply (HVPS), Integrated Mast Assembly (IMA), Integrated Reflectarray Assembly (IRA), KaRIn Antenna Electrical Subsystem (KAES), KaRIn Digital Electronics Subsystem (KDES), Mechanical and Thermal System (MTS), and Radio Frequency Unit (RFU).
Largely due to these delays, the overall payload CDR was delayed 4 months from June 2017 to October 2017, reducing by an equal amount the time between payload CDR and mission CDR. The Project Manager said he believes the 4 months between payload CDR and mission CDR planned for February 2018 is adequate. However, during this 4-month period NASA and CNES need to complete several reviews including the spacecraft CDR, Measurement System Peer Review, and the Mission System Interface Review.29 Given the reduction in time between the payload and mission CDRs and the ongoing technical issues, we are concerned about SWOT’s design maturity to proceed into mission CDR. In the sections below, we describe technical issues that may impact the SWOT Project’s mission CDR and could negatively impact cost and schedule performance.
29 The spacecraft CDR was successfully completed on December 1, 2017.
NASA Office of Inspector General IG-18-011 14
KaRIn Multipath Propagation Risk
A recent analysis of multipath propagation risks with the KaRIn instrument demonstrated threats for interference with the main antenna signal.30 Project management concluded that the unpredictability of signal distortions during orbit could result in substantial errors in surface water elevation measurements. After considering mitigation options, project system engineers added thin reflective plates to the instrument’s insulation-wrapped mast, the support structure to which the KaRIn antennae are attached (see Figure 3).
Although the plates added mass to the payload, the additional mass is within project allocation and the SWOT Project Manager believes this modification is all that will be needed to address the multipath risk. While the plate material is not technologically complex, the process to mature the design to be ready for CDR adds additional work and requires modification to the mast to affix the plates. Project managers said they do not believe these costs will be significant and believe ample time remains on the mechanical system schedule (more than 9 months) to install the plates before the issue will affect future tasks or the Project launch date. As of September 2017, investigation and rework of the multipath issue has cost the Project $1.6 million (15 percent) more than planned.
KaRIn High Voltage Power Supply Arcing Incident The Project recently experienced two high-voltage electrical discharge (arcing) events during testing of the KaRIn High Voltage Power Supply (HVPS) engineering model that threaten to impact the Project’s cost and schedule. Damage to the wire insulation attached to the high-voltage transformer caused the first arcing incident, which Project personnel said likely occurred during handling of the instrument. Project officials traced the second release of electricity to a capacitor in the high-voltage transformer and successfully repaired the unit with spare components. While the Project completed rework of the engineering model and delivered it to the KaRIn test bed for integration and testing, the HVPS experienced a third arcing incident on a different transformer. Accordingly, the Project had to return the engineering model for repair before delivery back to the KaRIn test bed for additional testing. As of October 2017, the HVPS had met its criteria for design and testing. However, Project managers acknowledged that the corrective actions associated with these three incidents exhausted all remaining unfunded schedule margin on development of the unit, causing the HVPS to become part of the JPL critical path.31
Limited Availability of Key Technical Personnel SWOT’s complex technical issues are exacerbated by the Project’s challenge of maintaining the staffing required to address these development tasks. Project staffing problems are driven by conflicts among several JPL projects (such as the Mars 2020 Rover mission) that require technicians with specific radar skills.32 These conflicts limit the SWOT mission’s ability to obtain necessary talent – primarily in
30 In wireless telecommunications, objects such as mountains and buildings between transmitting and receiving antennas
interfere with the ability to create an ideal line of sight. As a result, signals reflect off objects and create multiple paths that are picked up by the receiving antenna – a phenomenon known as “multipath propagation.” In particular, in the context of tracking elevation targets with a radar, this phenomenon can degrade the measured elevation angle of the intended target – in this case affecting river, lake, and sea measurements.
31 Critical path is the sequence of tasks that determines the longest duration of time needed to complete the project.
32 Mars 2020 is NASA’s next rover mission to the Red Planet and scheduled to launch in 2020.
NASA Office of Inspector General IG-18-011 15
mechanical engineering and radar digital electronics engineering – to design and develop its payload instruments. For example, during Phase B the unavailability of technical workforce caused the Project to fall roughly 1 month behind schedule and Project managers acknowledged the challenge of ramping up the staffing levels.
The Project began tracking this issue as a significant risk in late 2016 and attempted to address the staffing issue by augmenting its workforce in selected areas. Under this approach, low risk development tasks are assigned to existing staff to keep them busy and working on the Project rather than rotating to other JPL assignments. Even when SWOT has been fully staffed to meet its baseline needs, the Project has continued to explore opportunities for securing additional workforce in advance of future needs. The Project Manager acknowledged a desire to sacrifice time and money up front in order to secure needed staff to help protect schedule margins and manage downstream costs.
Given the Project’s technical complexity, we are concerned that the cost and schedule impacts of resolving technical issues later in development and integration will only intensify. The SRB Chairman told us that the Project’s plan to reduce its workforce prior to CDR has not occurred and agreed that keeping the workforce longer than planned can increase costs.
Uncertainty Regarding Ocean Calibration and Validation Implementation
The Project has also been tracking a risk related to the sufficiency of its airborne instrument suite, AirSWOT, to support calibration and validation requirements. Because the SWOT satellite will use remote sensing and other technologies to measure fresh water and map the flow of the oceans, the measuring systems will need to be tested and calibrated before being deployed on the satellite. AirSWOT measurements will be used to help scientists develop software for the satellite to calculate river flow rates, monitor coastal ocean currents, and validate SWOT performance once the satellite is deployed.
However, AirSWOT failed to meet accuracy measurement standards for the oceanography portion of its performance objectives when tested in 2015. Project management is in the process of assessing alternate methods of acquiring the needed data, including in-situ moorings, underwater gliders, and airborne Lidar experiments.33 As a result of AirSWOT’s reduced capability, adding an alternate method to perform the same function will result in increased Project costs.
Risk of Payload Mass Exceeding its Allocation
Mass is a critically important characteristic for any space system and associated payload. If a project exceeds its mass allocation, design changes in the payload or de-scoping the project may be required. As discussed in the Background section, one of the top five metrics identified by NASA and GAO as indicators of design stability is the percentage of allocated mass remaining at CDR. In August 2017, SWOT’s remaining mass allocation for payload was only 11 percent (or 86 of 775 kilograms allocated), very close to JPL’s recommended minimum of 10 percent.34 Additionally, a unique aspect of the SWOT
33 In situ instruments are placed on the ocean floor and provide a limited range of measurements. The underwater gliders are
unmanned drones that travel throughout the ocean to obtain measurements. Light Detection and Ranging or Lidar is an airborne remote sensing method that uses laser light to measure ocean surface height.
34 JPL, “Design, Verification/Validation & Ops Principles for Flight Systems (Design Principles), Rev. 6,” October 4, 2012.
NASA Office of Inspector General IG-18-011 16
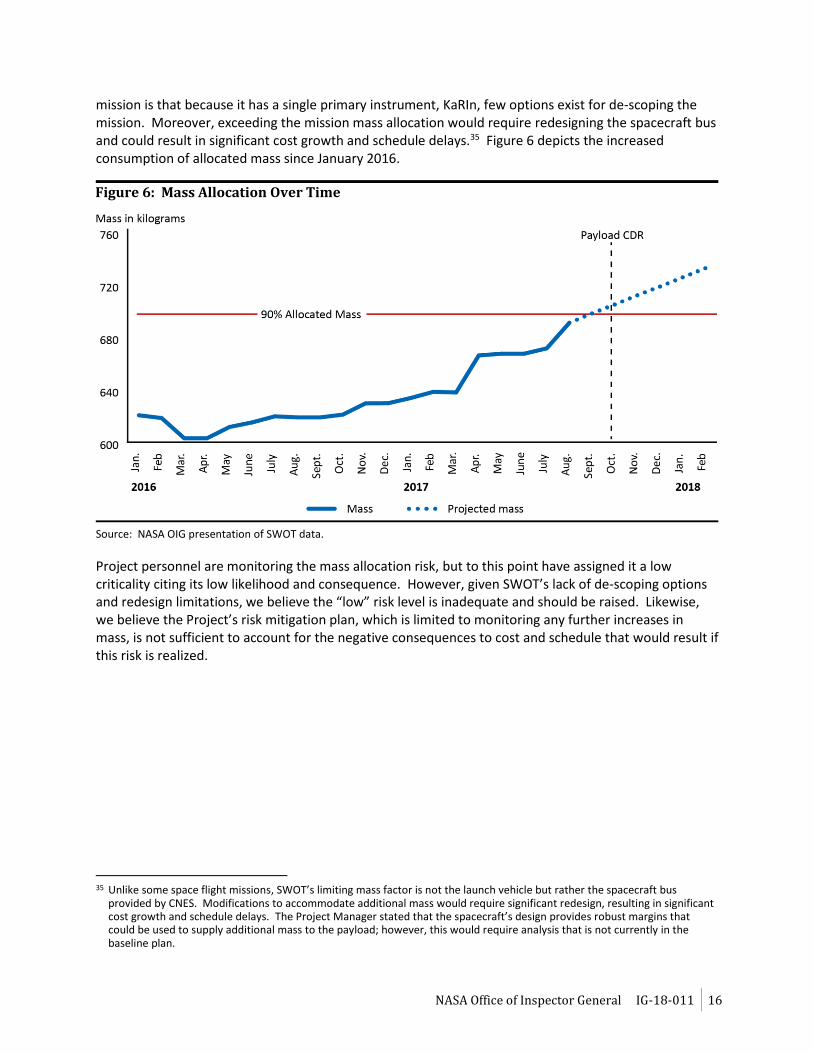
mission is that because it has a single primary instrument, KaRIn, few options exist for de-scoping the mission. Moreover, exceeding the mission mass allocation would require redesigning the spacecraft bus and could result in significant cost growth and schedule delays.35 Figure 6 depicts the increased consumption of allocated mass since January 2016.
Figure 6: Mass Allocation Over Time
Source: NASA OIG presentation of SWOT data.
Project personnel are monitoring the mass allocation risk, but to this point have assigned it a low criticality citing its low likelihood and consequence. However, given SWOT’s lack of de-scoping options and redesign limitations, we believe the “low” risk level is inadequate and should be raised. Likewise, we believe the Project’s risk mitigation plan, which is limited to monitoring any further increases in mass, is not sufficient to account for the negative consequences to cost and schedule that would result if this risk is realized.
35 Unlike some space flight missions, SWOT’s limiting mass factor is not the launch vehicle but rather the spacecraft bus
provided by CNES. Modifications to accommodate additional mass would require significant redesign, resulting in significant cost growth and schedule delays. The Project Manager stated that the spacecraft’s design provides robust margins that could be used to supply additional mass to the payload; however, this would require analysis that is not currently in the baseline plan.
NASA Office of Inspector General IG-18-011 17
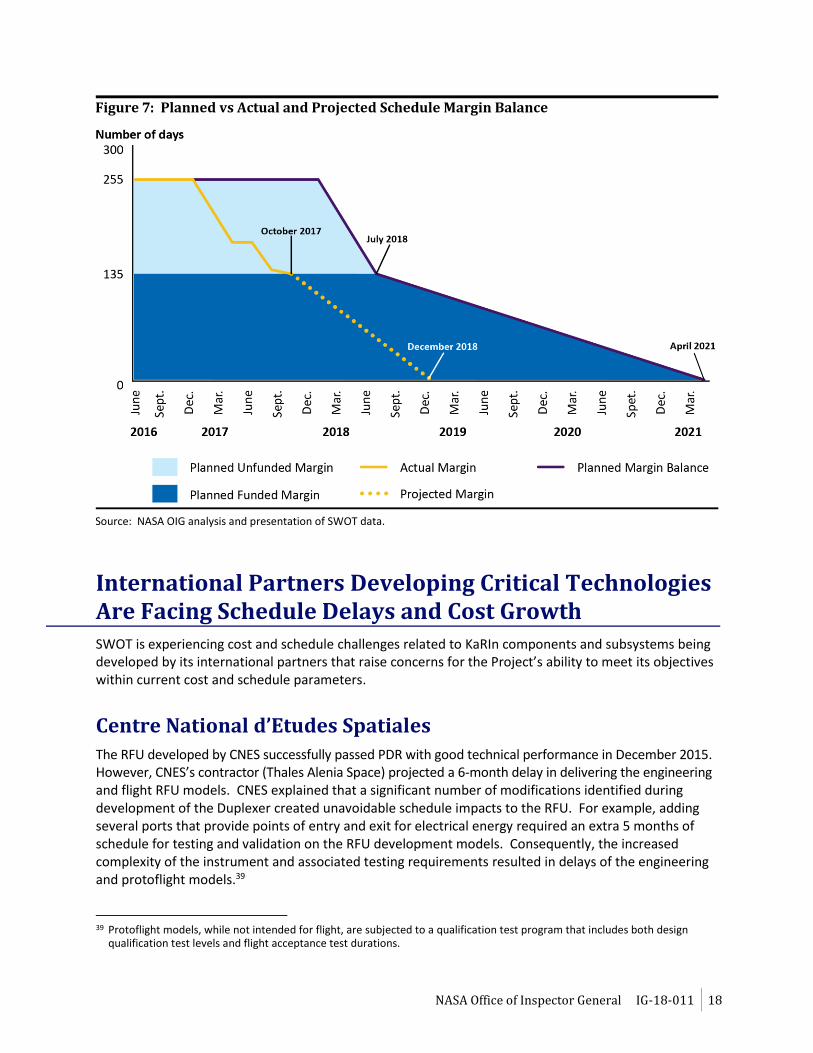
Impact of Technical Challenges to Project Schedule The Project’s baseline schedule of 59 months includes 135 days of schedule margin in the planned critical path.36 In addition, the Project had 120 additional days of unfunded margin due to CNES delaying delivery of the RFU by 6 months prior to NASA establishing the Project baseline at KDP-C.37 As of October 2017 (38 percent into development), the Project has experienced four technical issues (including the mast anomaly and arcing incidents discussed above) that have negatively impacted its schedule margins:
KaRIn Mechanical instrument is 2 months behind schedule due to the mast anomaly.
KaRIn Digital Electronics subsystem has experienced schematic, firmware, and testing delays of 4 months.
High Power Amplifier engineering model testing has consumed 4 months of unfunded margin while the arcing incident will consume another 5 to 7 weeks of unfunded margin.
KaRIn Antenna Electrical system is 2 months behind schedule.
While these issues have not yet affected the Project’s critical path, they illustrate the challenges NASA faces in developing SWOT’s complex KaRIn instrument. As of October 2017, these four issues have consumed the entire 120 days of unfunded margin. Any further delays will deplete the funded margin. Figure 7 shows the erosion of SWOT’s schedule margin and the depletion of unfunded margin from the start of development. Moreover, the rate at which the Project has consumed overall margin as of October 2017 – 120 out of 255 days or 47 percent – exceeds the percentage of Project development tasks completed by this date (38 percent), an indication the current funded margin may be insufficient to meet the April 2021 launch date.38
36 This schedule margin is referred to as funded margin because it includes funding for associated overhead costs in accordance
with JPL Flight Project Practice guidelines and is associated with tasks on the schedule’s critical path. On the other hand, unfunded margin, also referred to as slack, is margin associated with tasks not on the critical path and with no associated overhead costs.
37 Because the delay was identified prior to KDP-C, the baseline schedule was shifted by 6 months but JPL did not change its internal schedule for deliverables and completion of tasks providing the Project an additional 6 months of margin with no associated funding.
38 As of October 2017, Project tasks specifically associated with payload development were 50 percent complete.
NASA Office of Inspector General IG-18-011 18
Figure 7: Planned vs Actual and Projected Schedule Margin Balance
Source: NASA OIG analysis and presentation of SWOT data.
International Partners Developing Critical Technologies Are Facing Schedule Delays and Cost Growth SWOT is experiencing cost and schedule challenges related to KaRIn components and subsystems being developed by its international partners that raise concerns for the Project’s ability to meet its objectives within current cost and schedule parameters.
Centre National d’Etudes Spatiales
The RFU developed by CNES successfully passed PDR with good technical performance in December 2015. However, CNES’s contractor (Thales Alenia Space) projected a 6-month delay in delivering the engineering and flight RFU models. CNES explained that a significant number of modifications identified during development of the Duplexer created unavoidable schedule impacts to the RFU. For example, adding several ports that provide points of entry and exit for electrical energy required an extra 5 months of schedule for testing and validation on the RFU development models. Consequently, the increased complexity of the instrument and associated testing requirements resulted in delays of the engineering and protoflight models.39
39 Protoflight models, while not intended for flight, are subjected to a qualification test program that includes both design
qualification test levels and flight acceptance test durations.
NASA Office of Inspector General IG-18-011 19
After assessing multiple mitigation options with CNES in January 2016, Project management agreed to a 6-month schedule slip in the launch readiness date. The Project Manager indicated that the replanned schedule would allow the Project to maintain reasonable schedule margins for Phases C and D while waiting for delivery of the flight model RFU. While CNES’s delay has a significant impact on SWOT’s overall schedule, Project managers said they are pleased with CNES’s technical progress to date. Nevertheless, CNES has already consumed about half of its 2-month internal margin for delivering the RFU flight model to NASA in July 2018. If CNES slips another month, it could negatively impact the Project’s critical path and subsequently the mission’s launch readiness date.
Canadian Space Agency CSA expressed concern with the delayed availability of several components it needed to develop its EIK instrument. In October 2016, CSA determined that a high-voltage wire it purchased did not meet Project specifications and therefore requested a waiver from JPL. While waiting for a new wire from their supplier, CSA sought to utilize a high-voltage wire from the CloudSat mission as an alternative but did not receive JPL approval to do so until April 2017.40 Similarly, delivery of the EIK isolator-filter, which improves transmission power efficiency and removes interference in the return signal, was delayed after the original unit JPL provided did not perform as expected. These issues caused CSA to expend additional funds and develop workarounds that CSA estimated took 8 months to resolve.
CSA also faced challenges associated with shock level requirements for the EIK.41 Specifically, CSA stated that several weeks prior to its own CDR for the EIK, and following tests of a prototype model, JPL provided revised shock level specifications. While the EIK passed initial tests, the demonstration model used for subsequent testing failed at the revised levels. CSA expressed concern that if the modifications require redesign of the EIK, this could result in 3 to 6 months of schedule delay. Instead, CSA proposed reducing the shock levels to those used on the CloudSat mission, a proposal JPL eventually agreed to, which permitted CSA to proceed with building the EIK flight model.
40 In April 2006, NASA launched CloudSat to study the role that clouds and aerosols play in regulating Earth’s weather, climate,
and air quality. CSA was a contributor to this mission.
41 Shock level requirements identify the gravitational force limits an instrument can experience during handling, launch, and payload separation without a change or deformation in the instrument’s flight characteristics.
NASA Office of Inspector General IG-18-011 20
SWOT FACES UNACCOUNTED-FOR RISKS THAT MAY FURTHER NEGATIVELY IMPACT COST AND SCHEDULE
Project managers attribute SWOT’s increased costs and deteriorated schedule to a tactical decision to shift complex development tasks earlier than initially planned and expect the Project’s cost and schedule to recover once they begin performing less complex tasks. However, we question this expectation and are concerned that the Project’s cost and schedule may deteriorate further. SWOT’s current performance metrics indicate the work the Project has completed so far has cost more than estimated and is less than expected. Moreover, projections based on these performance rates estimate the Project will exceed its management baseline by $25 million or 7 percent.42 If not addressed, these cost and schedule challenges will result in the Project exceeding its overall cost and can delay the Project’s launch date.
Deficiencies in SWOT’s Baseline Estimate NASA’s Science Mission Directorate established SWOT’s baseline cost and schedule by relying in part on the Project’s JCL analysis and the SRB’s JCL analysis that included additional risks not included by the Project. However, we found the JCL analyses failed to fully model the final 10 percent of the Project’s development tasks and did not include some risks associated with working with international partners or timely delivery of the launch vehicle. Consequently, the model may have provided incomplete or unreliable information to establish the Project’s baseline, likely resulting in underestimated cost and schedule.
Not All Required Development Tasks Modeled
The Project elected not to include detailed tasks, risks, or uncertainty related to NASA’s effort in supporting CNES’s integration and testing of the payload module with the spacecraft bus in its JCL analysis. Consequently, in their assessment of the Project’s JCL analysis, the SRB added these risks and uncertainty. NASA plans to deliver the scientific payload to CNES who, with support from NASA Project personnel, will integrate it with the spacecraft bus. CNES will then transport the integrated spacecraft to Vandenberg Air Force Base for integration with the launch vehicle. According to Project personnel, NASA’s involvement in this integration and testing phase represents about 10 percent of the Project’s development tasks. However, JPL’s Cost Estimation and Pricing Group, which is responsible for developing the JCL, did not include detailed tasks and associated risks and uncertainties in the Project’s JCL model because NASA will be supporting rather than leading the integration and testing effort.
42 Project personnel indicated that an additional $23.5 million, realized from savings for launch services, will be reallocated to
Project development.
NASA Office of Inspector General IG-18-011 21
Because these issues could easily impact the Project’s overall cost and schedule, we believe the integration and testing tasks should have factored into the Project’s JCL analysis. In May 2016, the Project’s SRB expressed similar concerns with SWOT’s decision not to include integration and testing tasks in its JCL analysis.
Risks Associated with Working with International Partners
Partnering with international agencies introduces challenges that create additional risks for projects to stay within cost and schedule parameters. However, the SWOT Project did not factor some risks associated with international partner collaboration and coordination in its JCL model.43 Project personnel said they recognize that the lack of proximity and need for routine information exchange introduce complexity into working with foreign partners. Moreover, institutional differences in test methods, design margins, and environmental test levels could adversely impact completion of instrument and payload testing if not sufficiently understood. Late discovery of interface or compatibility problems likely will result in negative schedule impacts. As the Aerospace Corporation cautioned in its May 2016 independent assessment of the SWOT Project, given the numerous international entities that must be coordinated to resolve issues, technical delays may be compounded by coordination delays, which would impact the Project’s integration timeline.
Project managers acknowledged that building a complex scientific instrument with critical components supplied by the French and Canadian space agencies introduces challenges as three different groups work to provide their contributions on-time. CNES Project managers also noted the complexity of coordinating with their contractor, Thales Alenia Space, and the SRB Chairman expressed concern with the inherent management challenges of relying on foreign partners to supply critical hardware. Nonetheless, these risks were not addressed in the Project’s JCL analysis.
Launch Vehicle Delivery Risks
In addition, risks associated with timely delivery of the SpaceX launch vehicle were not included in the Project’s JCL analysis. JPL’s Cost Estimation and Pricing Group told us they did not consider the launch vehicle because it is outside the responsibility of the Project team. However, late delivery of the vehicle would impact the Project’s cost and schedule and, therefore, should have been included in the analysis. For example, the Jason-3 mission, which launched in January 2016, was 13 months late – 4 months of which were attributable to SpaceX.
NASA policy requires the JCL calculation include consideration of risks to all elements of a project, “regardless of whether or not they are funded from appropriations or managed outside of the project” and include the period from KDP-C through the end of on-orbit check out.44 While NASA policy does not specifically state that launch vehicle risks be included in a project’s JCL analysis, in a September 2015 report we noted the negative consequences of not doing so.45 Furthermore, standard operating
43 The Project did include technical risks and uncertainty associated with the international partners’ instrument development in
its JCL analysis.
44 NPR 7120.5E.
45 NASA OIG, “Audit of NASA's Joint Cost and Schedule Confidence Level Process” (IG-15-024, September 29, 2015).
NASA Office of Inspector General IG-18-011 22
procedures for NASA’s SRB review process states, “…with regards to international/inter-Agency contributions, inter-project/program risks, and launch vehicle selection; the project is tasked to include the programmatic risk of cost and schedule impacts to the project stemming from those systems.”46 Given the inherent risk and impact to the Project’s cost and schedule if the SpaceX launch vehicle is delivered late, we believe this risk should have been included in SWOT’s JCL analysis.
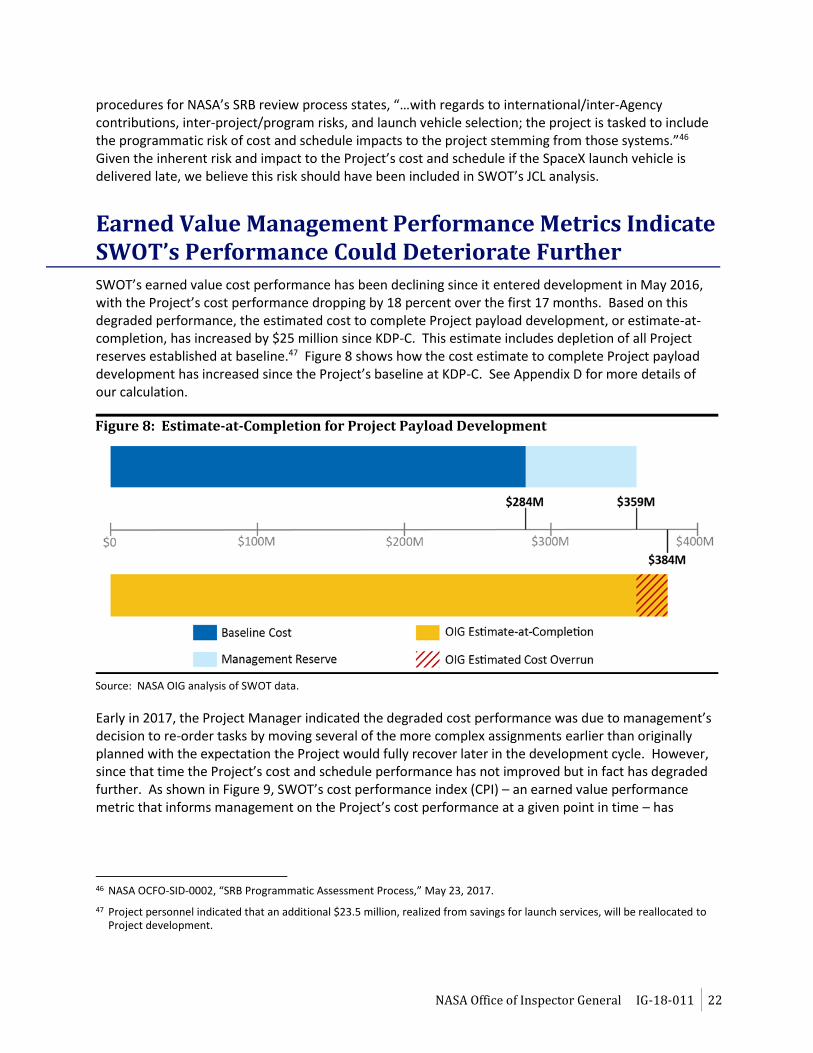
Earned Value Management Performance Metrics Indicate SWOT’s Performance Could Deteriorate Further SWOT’s earned value cost performance has been declining since it entered development in May 2016, with the Project’s cost performance dropping by 18 percent over the first 17 months. Based on this degraded performance, the estimated cost to complete Project payload development, or estimate-at-completion, has increased by $25 million since KDP-C. This estimate includes depletion of all Project reserves established at baseline.47 Figure 8 shows how the cost estimate to complete Project payload development has increased since the Project’s baseline at KDP-C. See Appendix D for more details of our calculation.
Figure 8: Estimate-at-Completion for Project Payload Development
Source: NASA OIG analysis of SWOT data.
Early in 2017, the Project Manager indicated the degraded cost performance was due to management’s decision to re-order tasks by moving several of the more complex assignments earlier than originally planned with the expectation the Project would fully recover later in the development cycle. However, since that time the Project’s cost and schedule performance has not improved but in fact has degraded further. As shown in Figure 9, SWOT’s cost performance index (CPI) – an earned value performance metric that informs management on the Project’s cost performance at a given point in time – has
46 NASA OCFO-SID-0002, “SRB Programmatic Assessment Process,” May 23, 2017.
47 Project personnel indicated that an additional $23.5 million, realized from savings for launch services, will be reallocated to Project development.
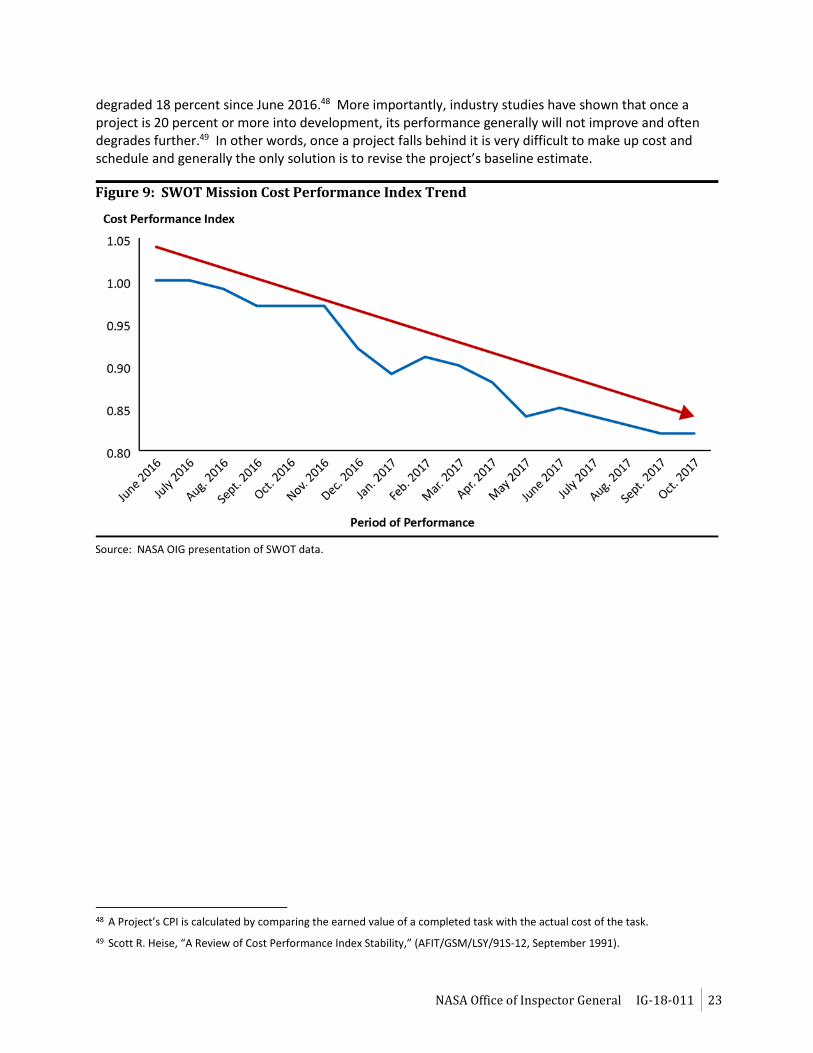
NASA Office of Inspector General IG-18-011 23
degraded 18 percent since June 2016.48 More importantly, industry studies have shown that once a project is 20 percent or more into development, its performance generally will not improve and often degrades further.49 In other words, once a project falls behind it is very difficult to make up cost and schedule and generally the only solution is to revise the project’s baseline estimate.
Figure 9: SWOT Mission Cost Performance Index Trend
Source: NASA OIG presentation of SWOT data.
48 A Project’s CPI is calculated by comparing the earned value of a completed task with the actual cost of the task.
49 Scott R. Heise, “A Review of Cost Performance Index Stability,” (AFIT/GSM/LSY/91S-12, September 1991).
NASA Office of Inspector General IG-18-011 24
CONCLUSION
With 38 percent of overall project development tasks and 50 percent of payload development tasks completed, SWOT is experiencing technical challenges that threaten its readiness for mission CDR and the possibility of further cost growth and schedule delays. Project challenges include development of technically complex instruments, limited or no de-scope options, and the inherent difficulty of working with multiple international partners. Furthermore, current earned value performance metrics are low and indicate the Project’s payload development will exceed its development cost baseline by at least $25 million. Moreover, deficiencies in its baseline estimate and the downward trend in cost performance metrics indicate the Project faces a likelihood of further cost growth and schedule slippage.
NASA Office of Inspector General IG-18-011 25
RECOMMENDATIONS, MANAGEMENT’S RESPONSE, AND OUR EVALUATION
For the SWOT mission to achieve its technical objectives, meet its milestones, and control its costs, we recommended the Associate Administrator for Science require the SWOT Project Manager to do the following:
1. Perform a formal assessment of the schedule impact of all ongoing technical issues to determine whether the current CDR schedule is still viable and ensure the Project does not proceed into CDR prematurely.
2. Reassess and update the Project’s schedule to account for CNES and CSA technical challenges and risks and provide resources necessary to ensure timely delivery of critical components.
3. Reassess the criticality assigned to the risk of NASA exceeding its payload mass allocation and develop a plan to manage the risk that correlates with revised criticality levels.
4. Evaluate past performance and future risks to determine whether current cost and schedule projections are attainable or need to be revised.
To ensure JPL projects have the technical support needed for their missions, we recommended the JPL Director:
5. Evaluate current and future critical technical staffing requirements and make adjustments as necessary.
To ensure NASA science projects are performing accurate and complete JCLs that provide Decision Authorities with reliable information on which to establish development baselines, we recommended the Associate Administrator for Science:
6. Require all SRBs to explicitly monitor and document variances from NASA’s JCL policy – specifically regarding international partners and launch vehicle risks – and their potential cost and schedule impacts.
We provided a draft of this report to NASA management who concurred with our recommendations and described actions the Agency plans to take to address them. Overall we consider management’s comments responsive. However, consistent with our finding in this and prior reports, we continue to believe international partner and launch vehicle risks should be included in JCL analyses. Therefore, recommendation 6 will remain open pending further discussion with NASA management about a change in Agency practice and policy. The other recommendations are resolved and will be closed upon verification and completion of proposed corrective actions.
Management’s comments are reproduced in Appendix E. Technical comments provided by management have also been incorporated, as appropriate.
NASA Office of Inspector General IG-18-011 26
Major contributors to this report include Raymond Tolomeo, Science and Aeronautics Research Director; Gerardo Saucedo, Project Manager; Cyrus Geranmayeh; Jiang Yun Lu; and Lauren Suls.
If you have questions about this report or wish to comment on the quality or usefulness of this report, contact Laurence Hawkins, Audit Operations and Quality Assurance Director, at 202-358-1543 or [email protected].
Paul K. Martin Inspector General
Appendix A
NASA Office of Inspector General IG-18-011 27
APPENDIX A: SCOPE AND METHODOLOGY
We performed this audit from February 2017 through December 2017 in accordance with generally accepted government auditing standards. Those standards require that we plan and perform the audit to obtain sufficient, appropriate evidence to provide a reasonable basis for our findings and conclusions based on our audit objectives. We believe that the evidence obtained provides a reasonable basis for our findings and conclusions based on our audit objectives.
Our overall objective was to evaluate NASA’s management of the mission relative to achieving technical objectives, meeting milestones, and controlling costs. Our specific objective was to assess whether emerging challenges may prevent NASA from achieving these goals and whether the baseline plan for project development was constructed from complete, reliable, and accurate cost, schedule, and risk information.
To evaluate the Project’s management of its goals and objectives, we reviewed key Project planning documents, including the Project and Risk Management Plans. We also reviewed the KDP-C Decision Memorandum that set the Management Agreement and Agency Baseline Commitment budgets and launch readiness milestones for the Project’s life cycle. Additionally, we reviewed NASA Procedural Requirements 7120.5E and the JPL Design Principles.
To assess the SWOT Project’s progress in managing technical, schedule, and cost risks, we reviewed the active risks provided by the Project’s Risk Management Database as of September 2017. For a select number of these risks identified as “Top Level,” we reviewed risk management reports for consequence and likelihood ratings, mitigation plans, and status updates; interviewed Project personnel; and reviewed other relevant documents, such as discussions provided in monthly status reports and independent assessments.
To assess schedule risk and performance, we evaluated the Project’s Integrated Master Schedule against the schedule health check provided by the Project for key indicators of performance. We also interviewed Project personnel, reviewed earned value reports, schedule change logs, and instrument and subsystem development status documents to determine whether the Project is on track to meeting its projected milestones.
To assess the Project’s management of cost risks, we sampled earned value cost account variances and evaluated burn down rates for project reserves to determine if the Project is on track to meeting its projections. We interviewed Project personnel, officials from the Cost Estimation and Pricing Group at JPL, and the Standing Review Board. We also obtained, reviewed, and analyzed cost data prepared for the Directorate Agency Program Management Council, relevant GAO reports, and Project monthly and quarterly status reports, JCL analyses and supporting documentation.
To assess the Project’s compliance with NASA JCL standards, we reviewed the SRB’s 2016 report “Surface Water Ocean Topography (SWOT) Preliminary Design Review (PDR) Standing Review Board (SRB) Assessment,” which provided an assessment of the Project’s JCL model and identified concerns with the cost estimation process.
Appendix A
NASA Office of Inspector General IG-18-011 28
Use of Computer-Processed Data
We used limited computer-processed data such as risk detail reports produced from JPL’s Risk Management system, Earned Value Management system performance metrics, and JCL model cost and schedule data. Generally, we concluded the data was valid and reliable for the purposes of the review.
Review of Internal Controls
We reviewed the internal controls associated with SWOT Project management’s assessment of technical, cost, and schedule risks that could impact the mission’s launch schedule. The findings identified in this report can be adequately addressed by implementation of our recommendations.
Prior Coverage
During the last 5 years, the NASA Office of Inspector General (OIG) and GAO have issued 8 reports of significant relevance to the subject of this report. Unrestricted reports can be accessed at http://oig.nasa.gov/audits/reports and http://www.gao.gov, respectively.
NASA Office of Inspector General
NASA’s Earth Science Mission Portfolio (IG-17-003, November 2, 2016)
NASA’s International Partnerships: Capabilities, Benefits, and Challenges (IG-16-020, May 5, 2016)
Audit of NASA's Joint Cost and Schedule Confidence Level Process (IG-15-024, September 29, 2015)
NASA's Challenges to Meeting Cost, Schedule, and Performance Goals (IG-12-021, September 27, 2012)
Government Accountability Office
NASA: Assessments of Major Projects (GAO-17-303SP, May 16, 2017)
NASA: Assessments of Major Projects (GAO-16-309 SP, March 30, 2016)
NASA: Assessments of Selected Large-Scale Projects (GAO-15-320SP, March 24, 2015)
NASA: Assessments of Selected Large-Scale Projects (GAO-14-338SP, April 15, 2014)
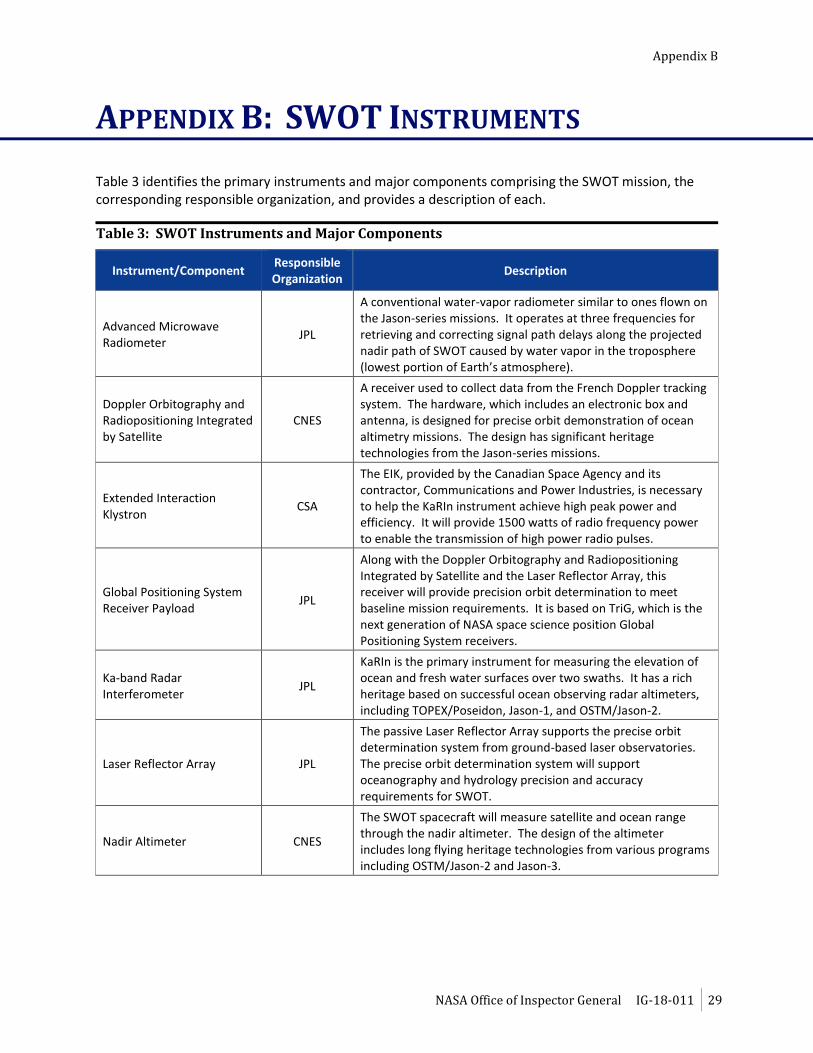
Appendix B
NASA Office of Inspector General IG-18-011 29
APPENDIX B: SWOT INSTRUMENTS
Table 3 identifies the primary instruments and major components comprising the SWOT mission, the corresponding responsible organization, and provides a description of each.
Table 3: SWOT Instruments and Major Components
Instrument/Component Responsible Organization
Description
Advanced Microwave Radiometer
JPL
A conventional water-vapor radiometer similar to ones flown on the Jason-series missions. It operates at three frequencies for retrieving and correcting signal path delays along the projected nadir path of SWOT caused by water vapor in the troposphere (lowest portion of Earth’s atmosphere).
Doppler Orbitography and Radiopositioning Integrated by Satellite
CNES
A receiver used to collect data from the French Doppler tracking system. The hardware, which includes an electronic box and antenna, is designed for precise orbit demonstration of ocean altimetry missions. The design has significant heritage technologies from the Jason-series missions.
Extended Interaction Klystron
CSA
The EIK, provided by the Canadian Space Agency and its contractor, Communications and Power Industries, is necessary to help the KaRIn instrument achieve high peak power and efficiency. It will provide 1500 watts of radio frequency power to enable the transmission of high power radio pulses.
Global Positioning System Receiver Payload
JPL
Along with the Doppler Orbitography and Radiopositioning Integrated by Satellite and the Laser Reflector Array, this receiver will provide precision orbit determination to meet baseline mission requirements. It is based on TriG, which is the next generation of NASA space science position Global Positioning System receivers.
Ka-band Radar Interferometer
JPL
KaRIn is the primary instrument for measuring the elevation of ocean and fresh water surfaces over two swaths. It has a rich heritage based on successful ocean observing radar altimeters, including TOPEX/Poseidon, Jason-1, and OSTM/Jason-2.
Laser Reflector Array JPL
The passive Laser Reflector Array supports the precise orbit determination system from ground-based laser observatories. The precise orbit determination system will support oceanography and hydrology precision and accuracy requirements for SWOT.
Nadir Altimeter CNES
The SWOT spacecraft will measure satellite and ocean range through the nadir altimeter. The design of the altimeter includes long flying heritage technologies from various programs including OSTM/Jason-2 and Jason-3.
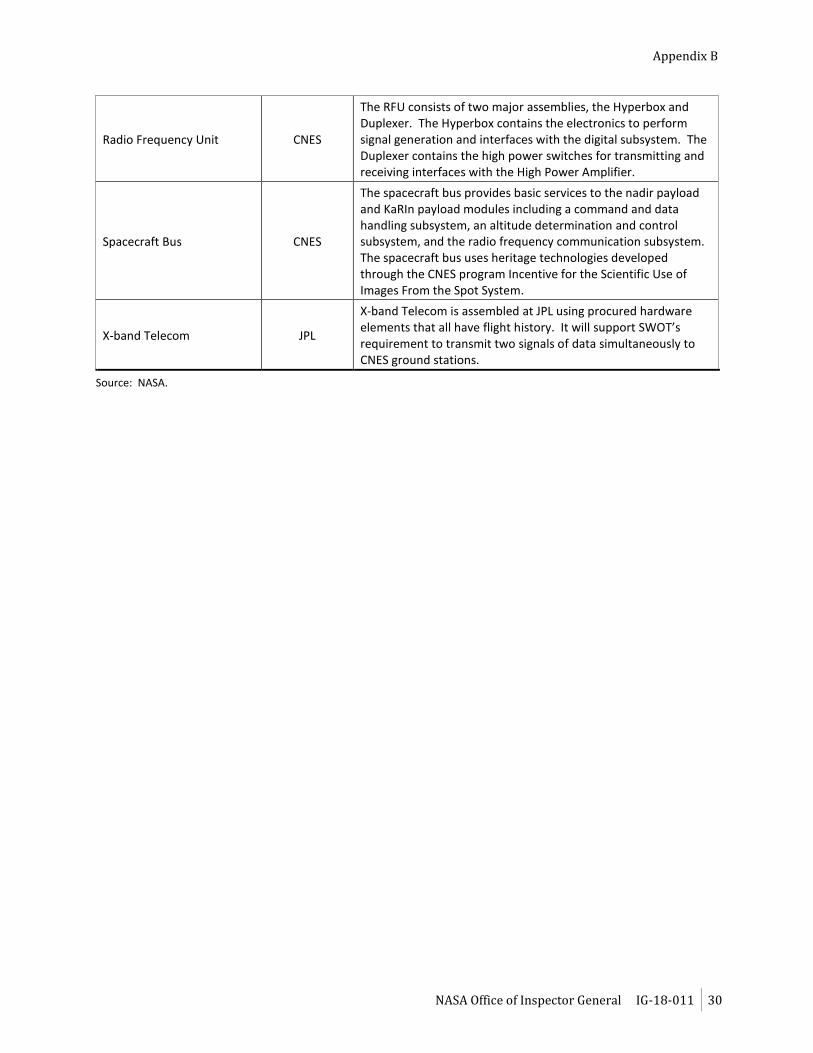
Appendix B
NASA Office of Inspector General IG-18-011 30
Radio Frequency Unit CNES
The RFU consists of two major assemblies, the Hyperbox and Duplexer. The Hyperbox contains the electronics to perform signal generation and interfaces with the digital subsystem. The Duplexer contains the high power switches for transmitting and receiving interfaces with the High Power Amplifier.
Spacecraft Bus CNES
The spacecraft bus provides basic services to the nadir payload and KaRIn payload modules including a command and data handling subsystem, an altitude determination and control subsystem, and the radio frequency communication subsystem. The spacecraft bus uses heritage technologies developed through the CNES program Incentive for the Scientific Use of Images From the Spot System.
X-band Telecom JPL
X-band Telecom is assembled at JPL using procured hardwareelements that all have flight history. It will support SWOT’srequirement to transmit two signals of data simultaneously toCNES ground stations.
Source: NASA.
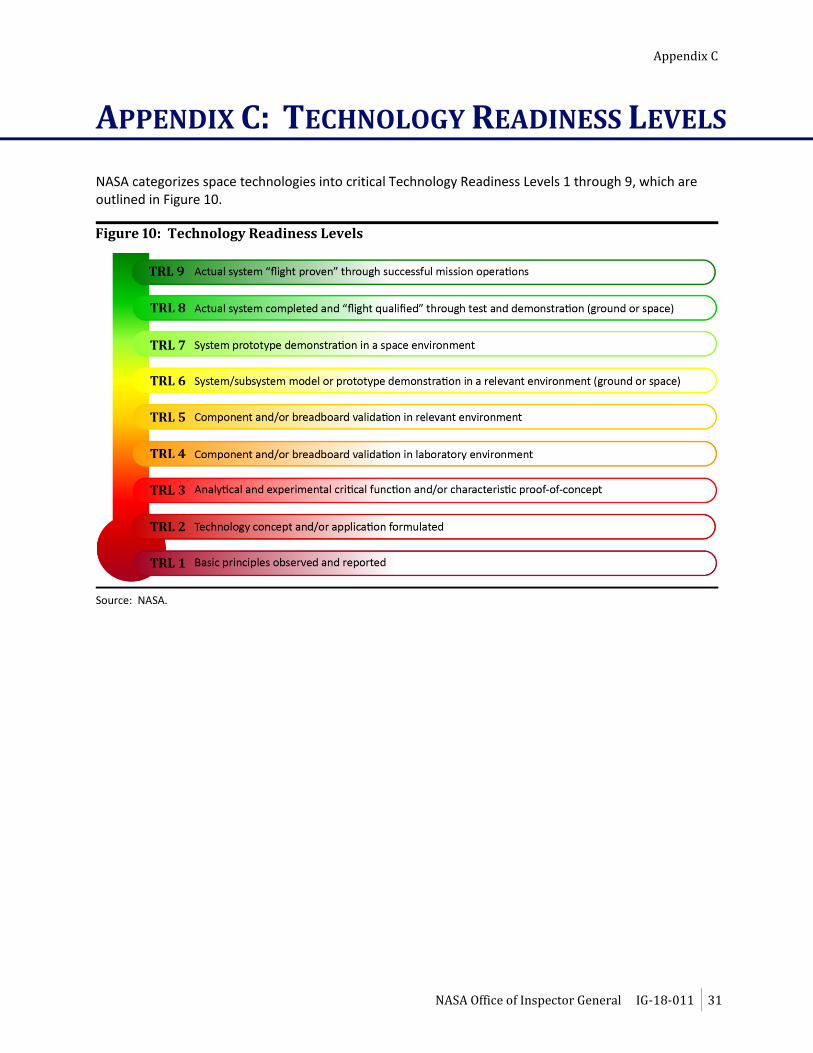
Appendix C
NASA Office of Inspector General IG-18-011 31
APPENDIX C: TECHNOLOGY READINESS LEVELS
NASA categorizes space technologies into critical Technology Readiness Levels 1 through 9, which are outlined in Figure 10.
Figure 10: Technology Readiness Levels
Source: NASA.
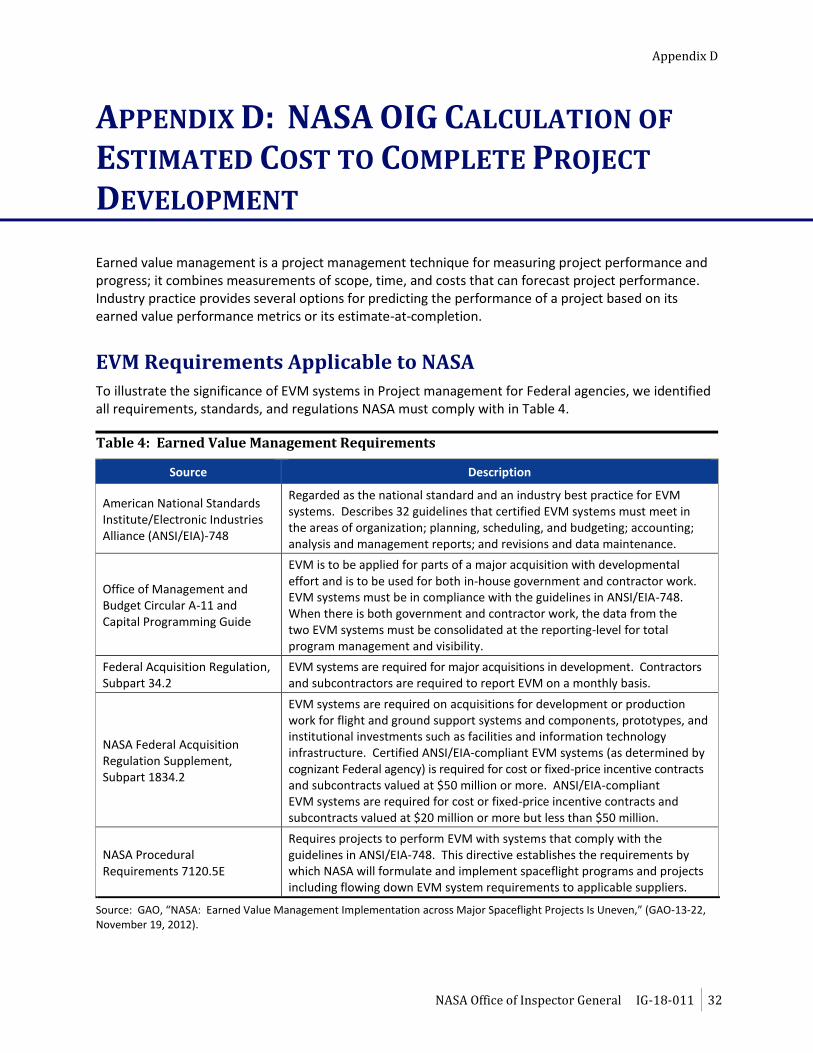
Appendix D
NASA Office of Inspector General IG-18-011 32
APPENDIX D: NASA OIG CALCULATION OF
ESTIMATED COST TO COMPLETE PROJECT
DEVELOPMENT
Earned value management is a project management technique for measuring project performance and progress; it combines measurements of scope, time, and costs that can forecast project performance. Industry practice provides several options for predicting the performance of a project based on its earned value performance metrics or its estimate-at-completion.
EVM Requirements Applicable to NASA
To illustrate the significance of EVM systems in Project management for Federal agencies, we identified all requirements, standards, and regulations NASA must comply with in Table 4.
Table 4: Earned Value Management Requirements
Source Description
American National Standards Institute/Electronic Industries Alliance (ANSI/EIA)-748
Regarded as the national standard and an industry best practice for EVM systems. Describes 32 guidelines that certified EVM systems must meet in the areas of organization; planning, scheduling, and budgeting; accounting; analysis and management reports; and revisions and data maintenance.
Office of Management and Budget Circular A-11 and Capital Programming Guide
EVM is to be applied for parts of a major acquisition with developmental effort and is to be used for both in-house government and contractor work. EVM systems must be in compliance with the guidelines in ANSI/EIA-748. When there is both government and contractor work, the data from the two EVM systems must be consolidated at the reporting-level for total program management and visibility.
Federal Acquisition Regulation, Subpart 34.2
EVM systems are required for major acquisitions in development. Contractors and subcontractors are required to report EVM on a monthly basis.
NASA Federal Acquisition Regulation Supplement, Subpart 1834.2
EVM systems are required on acquisitions for development or production work for flight and ground support systems and components, prototypes, and institutional investments such as facilities and information technology infrastructure. Certified ANSI/EIA-compliant EVM systems (as determined by cognizant Federal agency) is required for cost or fixed-price incentive contracts and subcontracts valued at $50 million or more. ANSI/EIA-compliant EVM systems are required for cost or fixed-price incentive contracts and subcontracts valued at $20 million or more but less than $50 million.
NASA Procedural Requirements 7120.5E
Requires projects to perform EVM with systems that comply with the guidelines in ANSI/EIA-748. This directive establishes the requirements by which NASA will formulate and implement spaceflight programs and projects including flowing down EVM system requirements to applicable suppliers.
Source: GAO, “NASA: Earned Value Management Implementation across Major Spaceflight Projects Is Uneven,” (GAO-13-22, November 19, 2012).
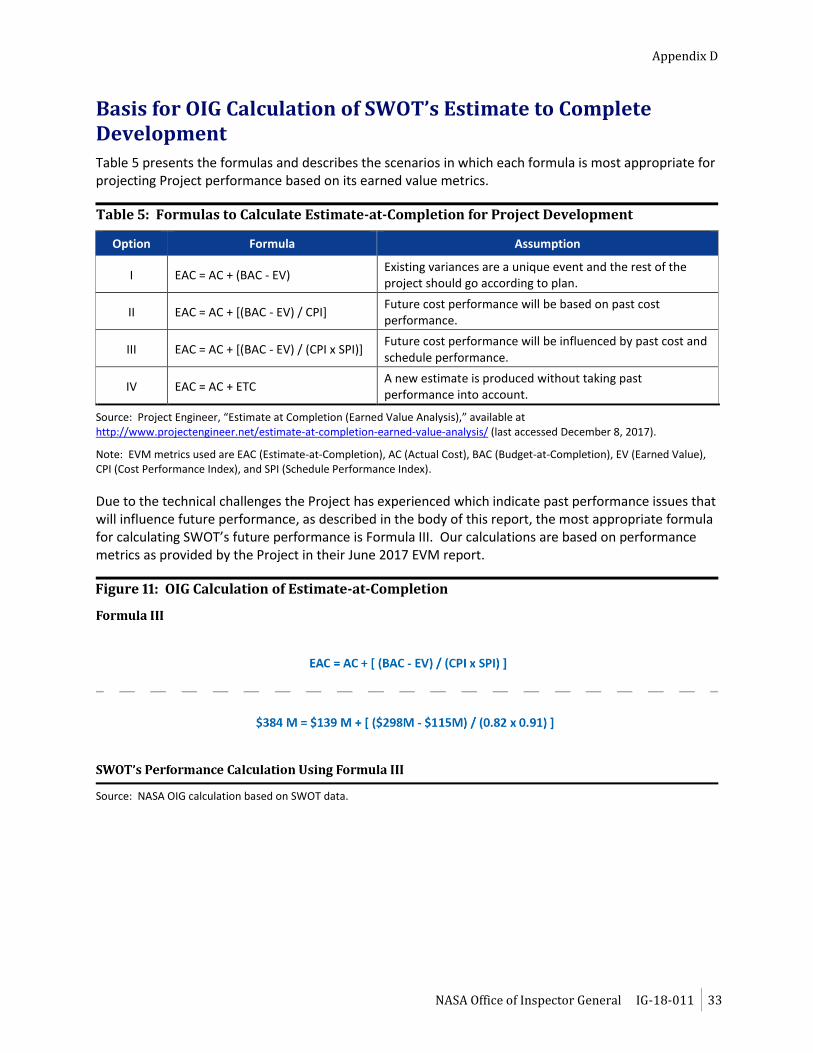
Appendix D
NASA Office of Inspector General IG-18-011 33
Basis for OIG Calculation of SWOT’s Estimate to Complete Development
Table 5 presents the formulas and describes the scenarios in which each formula is most appropriate for projecting Project performance based on its earned value metrics.
Table 5: Formulas to Calculate Estimate-at-Completion for Project Development
Option Formula Assumption
I EAC = AC + (BAC - EV) Existing variances are a unique event and the rest of the project should go according to plan.
II EAC = AC + [(BAC - EV) / CPI] Future cost performance will be based on past cost performance.
III EAC = AC + [(BAC - EV) / (CPI x SPI)] Future cost performance will be influenced by past cost and schedule performance.
IV EAC = AC + ETC A new estimate is produced without taking past performance into account.
Source: Project Engineer, “Estimate at Completion (Earned Value Analysis),” available at http://www.projectengineer.net/estimate-at-completion-earned-value-analysis/ (last accessed December 8, 2017).
Note: EVM metrics used are EAC (Estimate-at-Completion), AC (Actual Cost), BAC (Budget-at-Completion), EV (Earned Value), CPI (Cost Performance Index), and SPI (Schedule Performance Index).
Due to the technical challenges the Project has experienced which indicate past performance issues that will influence future performance, as described in the body of this report, the most appropriate formula for calculating SWOT’s future performance is Formula III. Our calculations are based on performance metrics as provided by the Project in their June 2017 EVM report.
Figure 11: OIG Calculation of Estimate-at-Completion
Source: NASA OIG calculation based on SWOT data.
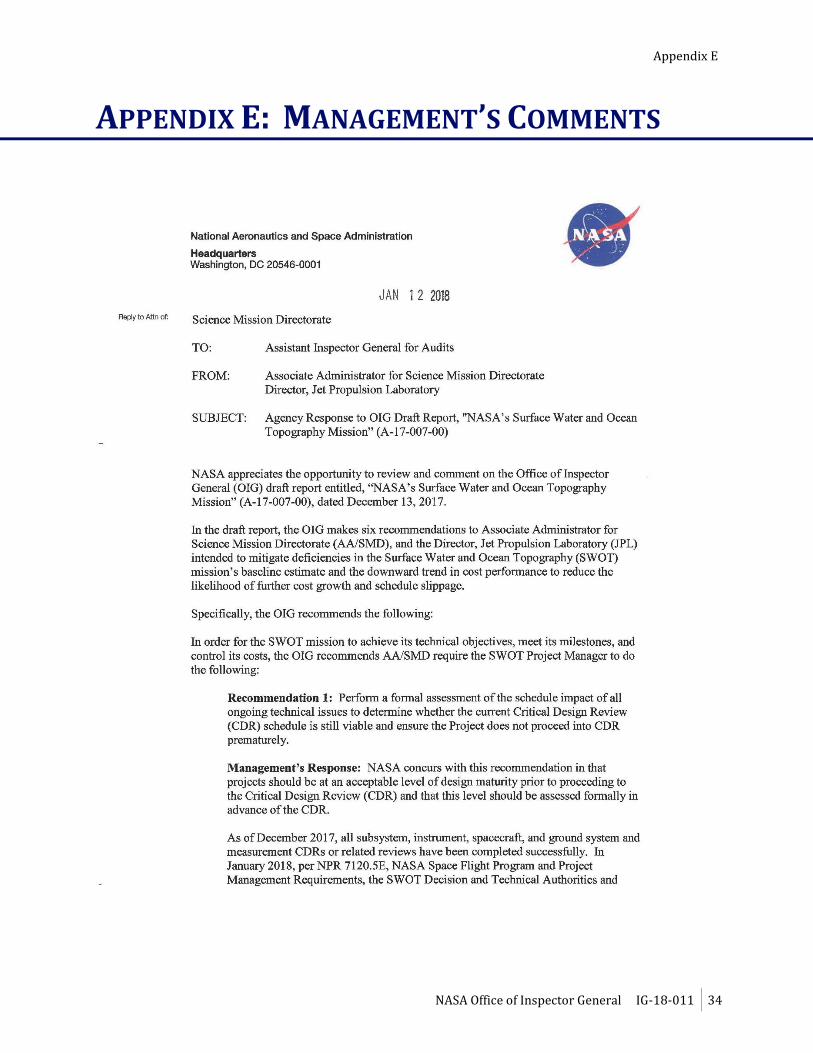
Appendix E
NASA Office of Inspector General IG-18-011 34
APPENDIX E: MANAGEMENT’S COMMENTS
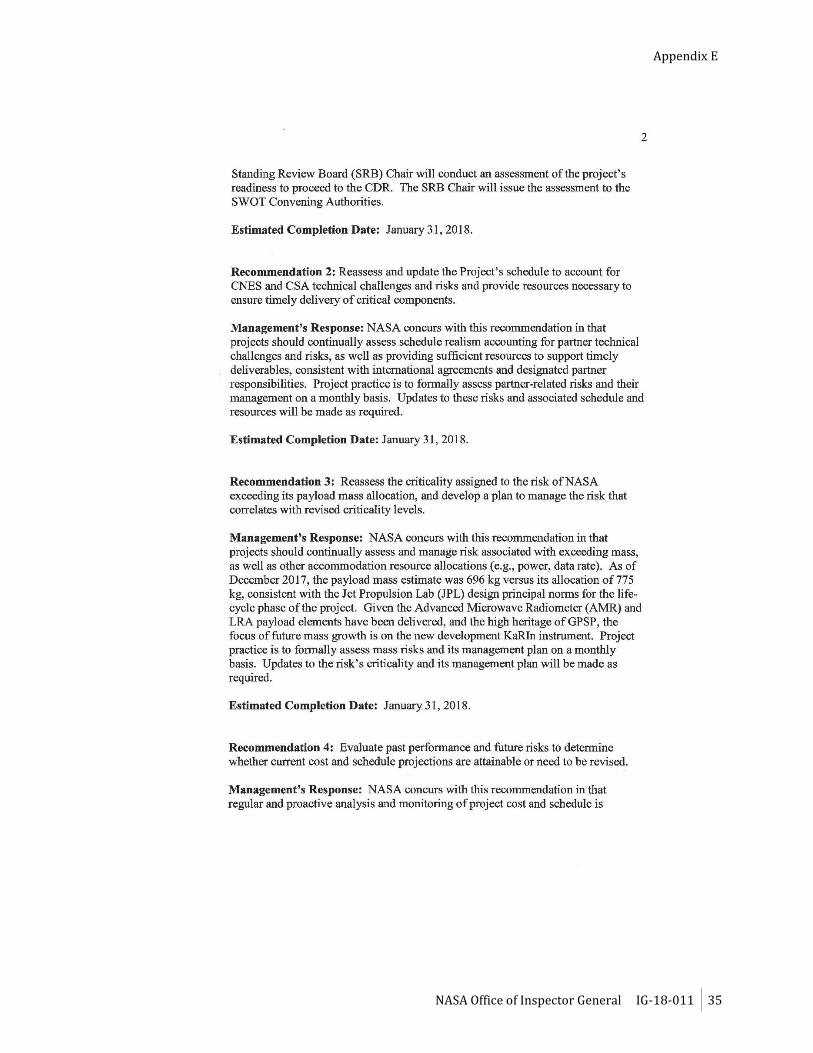
Appendix E
NASA Office of Inspector General IG-18-011 35
Appendix E
NASA Office of Inspector General IG-18-011 36
Appendix E
NASA Office of Inspector General IG-18-011 37

Appendix E
NASA Office of Inspector General IG-18-011 38
Appendix F
NASA Office of Inspector General IG-18-011 39
APPENDIX F: REPORT DISTRIBUTION
National Aeronautics and Space Administration
Acting Administrator Deputy Associate Administrator Associate Administrator for Science Center Director, Jet Propulsion Laboratory
Non-NASA Organizations and Individuals
Office of Management and Budget Deputy Associate Director, Energy and Space Programs Division
Government Accountability Office Director, Office of Acquisition and Sourcing Management
Congressional Committees and Subcommittees, Chairman and Ranking Member
Senate Committee on Appropriations Subcommittee on Commerce, Justice, Science, and Related Agencies
Senate Committee on Commerce, Science, and Transportation Subcommittee on Space, Science, and Competitiveness
Senate Committee on Homeland Security and Governmental Affairs
House Committee on Appropriations Subcommittee on Commerce, Justice, Science, and Related Agencies
House Committee on Oversight and Government Reform Subcommittee on Government Operations
House Committee on Science, Space, and Technology Subcommittee on Oversight Subcommittee on Space
(Assignment No. A-17-007-00)