final-challenge- 1396
TRANSCRIPT


33 34
54 52
80
22 15 27
18
50 55 49
81 70
130
57
82 79
162
-8 -2 -9
-32(50)
0
50
100
150
200
Mil
lio
n t
on
s
Active plan Underway plan

Iron Ore Challenge

0
1
2
3
4
5
Geological reserve Proven reserve Demand until
2025- based on
Iran steel
comprehensive
plan studies
Remaining proven
reserves
5
3.1
1.21.9
Bil
lio
n t
on
s
Average grade of Iron ore in Iran: about 46%
Iron ore deposits is adequate almost 10 years after 2025


Forecast of Steel Demand up to 1404 (2025) in the Selected scenarios of 4 Methods
1396 1397 1398 1399 1400 1401 1402 1403 1404Average Optimum scenarios of 4 methods Vector Autoregression Model
Optimum scenario of Econometric Method Optimum Consumption Trens Scenario
30.2
Assumptions for the selected scenarios:
considered time period: the last 20 Years;
Growth of per capita income : 2.5% Growth of the Economy :4%
Growth of Industry Sectors: 5.5% Growth of construction Sectors: 2%
Mil
lio
n t
on
s
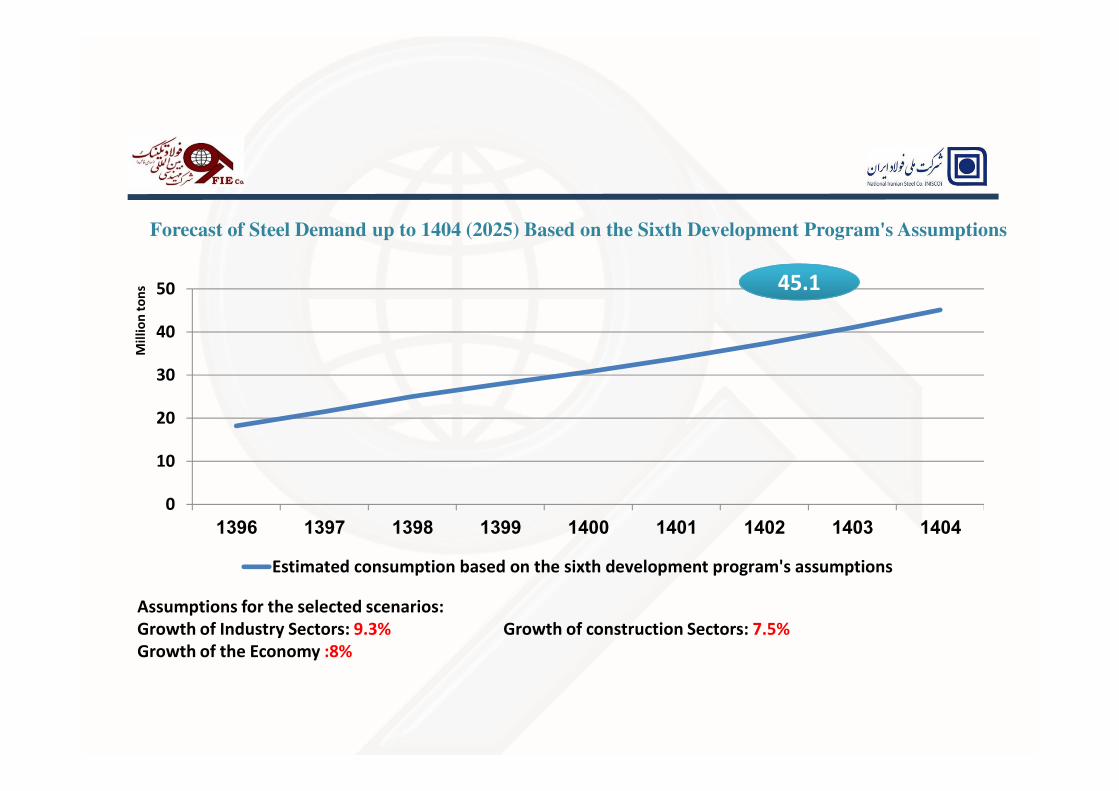
Forecast of Steel Demand up to 1404 (2025) Based on the Sixth Development Program's Assumptions
0
10
20
30
40
50
1396 1397 1398 1399 1400 1401 1402 1403 1404
Estimated consumption based on the sixth development program's assumptions
45.1
Assumptions for the selected scenarios:
Growth of Industry Sectors: 9.3% Growth of construction Sectors: 7.5%
Growth of the Economy :8%
Mil
lio
n t
on
s


1,200
1,300
1,400
1,500
1,600
1,700
2007 2008 2009 2010 2011 2012 2013 2014 2015 2016 2017
Mil
lio
n t
on
s
شركت ملي فولاد ايران
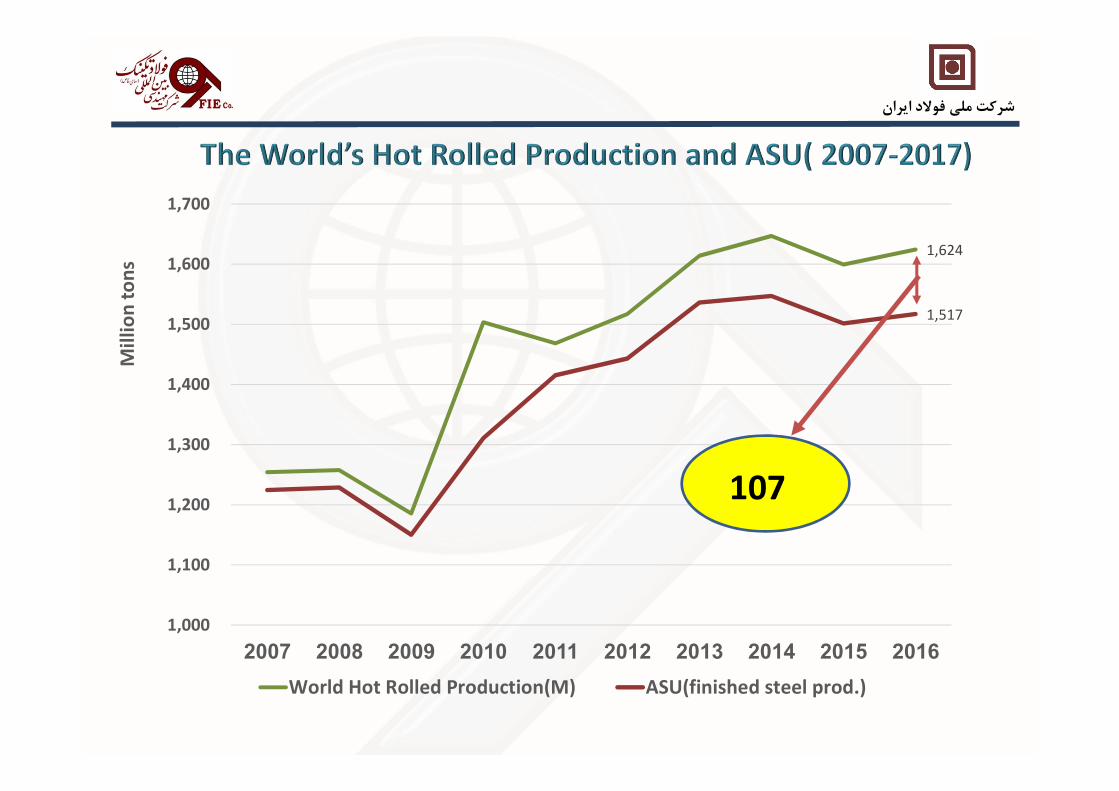
1,624
1,517
1,000
1,100
1,200
1,300
1,400
1,500
1,600
1,700
2007 2008 2009 2010 2011 2012 2013 2014 2015 2016
World Hot Rolled Production(M) ASU(finished steel prod.)
Mil
lio
n t
on
s
107

شركت ملي فولاد ايران
808
709
400
500
600
700
800
900
1,000
2007 2008 2009 2010 2011 2012 2013 2014 2015 2016
China’s Production(M) China’s consumption
-0.5%
99
Mil
lio
n t
on
s

93
2
65
12 3
126
78
11
10 10 5 5
4 3 - -
50
100
150
200
250
Total Middle
East
Asia CIS Africa Other
Europe
Nafta Europe Latin
America
Oceania
Mil
lio
n t
on
s
BOF EAF
219
Annouced Investment by Steel Plant (Underway & Planned) 2017-2019

94
.5
2,1
02
2,2
74
2,3
17
2,3
51
2,3
81
0
10
20
30
40
50
60
70
80
90
100
1800
2000
2200
2400
2600
2012 2013 2014 2015 2016 2019
Mil
lio
n T
on
s
planning capacity
2,475
Potential Gross Additions in 2017-2019

0.0
5.0
10.0
15.0
20.0
25.0
based on Export Ratio
to Iran Production
based on Export Ratio
to Global Production
Max. Exp Potantiality based on 1404 vision
of Iran (2025)
14.0
11.210.5
20.4
Mil
lio
n t
on
s

4.1
5.9
7.8
4.7
3.9
3.0
-0.6
2
4.8
-1.0
0.0
1.0
2.0
3.0
4.0
5.0
6.0
7.0
8.0
9.0
1394 1395 1396e
Mil
lio
n t
on
es
Export Import Trade Balance

Iran's trade Structure and Comparison with the World (The Ratio of Each Product's Export to Total Steel Export)
13
31
56
67
12
22
0
10
20
30
40
50
60
70
The Ratio of Crude Steel's
Export to Total Steel Export
The Ratio of Long Prod's Export
to Total Steel Export
The Ratio of Flat Prod's Export
to Total Steel Export
Pe
rce
nt
World-2016 Iran-2016 Linear (World-2016) Linear (Iran-2016)

Market Challenge
33.1
55.00 55.00
42
50
26
45
20
25
30
35
40
45
50
55
60
1396 1397 1398 1399 1400 1401 1402 1403 1404
Mil
lio
n T
on
es
Crude Steel Capacity
Sum of Consumption and Trade on based on Ratio Global Export to Prod.
Sum of Consumption and Trade on based on 1404 vision of Iran
Sum of Consumption and Trade on based on Ratio Iran Export to Prod.

World and Iran Steel Capacity
Utilization
71.5%
69.5%
78.0%
68.8%
83.03%
78.17% 77.98%
72.10%
60.0%
65.0%
70.0%
75.0%
80.0%
85.0%
2008 2009 2010 2011 2012 2013 2014 2015 2016 2017
Iran world

6.173.10
8.357.007.20
3.17.5
9.85
3
less
th
an
0.5
Mt
Be
twe
en
0.5
to
1M
t
Be
twe
en
1
to 2
Mt
Be
twe
en
2
to 5
Mt
Gre
ate
r o
r
eq
ua
l 5
Mt
0
5
10
15
20
Mil
lio
n T
on
s
Active Underway
52.0
5.06.02.01.0
14
1181
less
th
an
0.5
Mt
Be
twe
en
0.5
to
1M
t
Be
twe
en
1 t
o 2
Mt
Be
twe
en
2 t
o 5
Mt
Gre
ate
r
or
eq
ua
l
5 M
t
0
10
20
30
40
50
60
70
Un
it
Active Underway
1 16
66
3 14
9.2710
18.210.6
7.2

101.5
61.4
96.2
64.1
23.116.8
30.9
23.7
77.8
44.6
65.3
40.4
0
20
40
60
80
100
120
Crude steel DRI Pellet Iron ore concentrate
Mil
lio
n t
on
s
Total Underway plans (Realizable) other


شركت ملي فولاد ايران

Dispersion of Steel Units- 2025
The south sea
neighboring provinces
25.1% DRI:
18.9% Crude steel:
Other Provinces
DRI: 74.9%
Crude steel: 81.1%


13,000
25,000
3,145
0
5,000
10,000
15,000
20,000
25,000
30,000
Railway lines
until 2015
Plan in 1404
(2025) Horizon
Railway Lines
expantion for
steel industry
1404 (2025)
KM
Railway lines
4028
202
105
0
50
100
150
200
250
Rail freight total capacity Share of steel Industry in
rail freight
Mil
lio
n t
on
s
Rail freight capacity
Current Situation
1404 (2025) - 55 million tonnes
شركت ملي فولاد ايران

388
66
457
85
0
50
100
150
200
250
300
350
400
450
500
Road transportation total
capacity
Share of steel Industry in road
transportation
Mil
lio
n t
on
s
Current Situation 1404 (2025) - 55 million tonnes


Current Annual consumption:
96.4 billion Cubic meter
Recent ten years period Average:
89.5 billion Cubic meter
per capita renewable
sources of water:
1961 :6000 m3/yr2017: 1100 m3/yr
water consumption of steel chain
in 2025 by 55MT crude steel:257milliom cubic meter

The total needs of
steel industry
(Active+ Underway)
257 Mm3/yr
Units considered in the provinces
adjacent to the Southern Sea
(Khuzestan, Bushehr, Hormozgan, Sistan and
Baluchestan)
Consumption : 46 Mm3/yr (18%)
Units considered in the provinces
non-adjacent to the Southern Sea
Consumption : 211 Mm3/yr (82%)
�Use of wastewater
treatment plants in
cities in limited scale
�Desalination and
transferring water to
the central regions of
the country with a huge cost.
�water Desalination
of Persian gulf and Oman sea.
Water supply sources :
Possible alternative sources for water supply:
Necessity of overview of the methods of supplying water resources for existing
plants, as well as Organizing future plants considering the importance of supplying
water resources.

34

(68%)
(21%)
(11%)(32%)
Others Industry Others Steel chain
(Total consumption: 241092 Million kw/hour annually)

Type of use Comparison with energy per
capita
Agriculture 3.1 times the world average
Household 1.8 times the world average
Public & Commercial 1.5 times the world average
Transport & Industry 1.4times the world average


2858.02018.0
1376.01681.0
238.0
8171.0
0
1,000
2,000
3,000
4,000
5,000
6,000
7,000
8,000
9,000
Mil
lio
n E
uro

5053
1245630
1818
3283
1901073
13292
0
2,000
4,000
6,000
8,000
10,000
12,000
14,000
Mil
lio
n E
uro

Given facilities to the steel and downstream industries
&The required investment to complete the steel chain
2,118
3,374
5,492
8,171
0
1000
2000
3000
4000
5000
6000
7000
8000
9000
capital market2011-
2017
Banking facility2011-
2016
Total 2025
Mil
lio
n E
uro

Country
Financ
ial
marke
t
devel
opme
nt
Compe
titiven
ess
index
Openn
ess
index
Marke
t size
India 4.41 4.31 42 6.4
Turkey 3.84 4.39 49 5.2
Iran 2.92 4.12 39 5.1
0
10,000
20,000
30,000
40,000
50,000
2014 2015 2016
34
,57
7
44
,00
9
44
,45
9
12
,82
8
17
,55
0
12
,30
3
2,1
05
2,0
50
3,3
72
Mil
lio
n D
oll
ar
INDIA TURKEY IRAN
The Global Competitiveness Index

New Technologies

Goals and main approaches:
• Reducing the emission of pollutants such as NOX, SOX, CO2, dust
and ...
• Improving efficiency and increasing production speed
• Reducing energy consumption and using renewable energy sources
• Reducing the amount of required investment and maintenance costs
• Reducing production and raw material costs
• Improving the quality of steel products to meet new and future
needs
• Iron production using low-grade minerals and non-coking coal

Using new technology
New technology in the coal based direct reduction including ITMK3 method in order to use thermal coal fine
(instead of natural gas) and iron ore concentrate (instead of pellets)
1
New methods of melting and reduction process, including FINEX method for producing hot metal for BOF, which
leads to reduction of required investment, possibility of using lower quality materials (thermal coal fine and iron
ore fine), decrease of energy consumption, and improvement of environmental index (By omitting coking ,
sintering or pelletizing plants).
2
New technology of thin slab casting and hot rolling mill using Endless Strip Production (ESP) method.
Improving production of HSM with extending casting length and also implementation of Simatic TDS control
system which brings about an increase in speed of the line from an average of 3.5 to 6 m/s.
3
New technology of casting and hot rolling mill similar ESP method using Win Link method .4


DescriptionOCT+OCT
(Option 1)
AFC+OCT
(Option 2)
AFC+STG - HCS
(Option 3)
AFC+HCT
(Option 4)
Cooling mode
� Using wet cooling tower forEAF, LF and FTP.
� Using wet cooling tower forAuxiliary.
� Using wet cooling tower for
direct cycle of secondary
cooling.
� Using air cooler for EAF, LF
and FTP.
� Using wet cooling tower forAuxiliary.
� Using wet cooling tower for
direct cycle of secondary
cooling.
� Using air cooler for EAF, LF
and FTP.
� Using air cooler and wetcooling tower for Auxiliary.
� Using wet cooling tower for
direct cycle of secondary
cooling.
� Using air cooler for EAF, LF
and FTP.
� Using hybrid cooling towerfor Auxiliary.
� Using wet cooling tower for
direct cycle of secondary
cooling.
Water consumption for
EAF,LF,DDShr/3m70 /hr3m3 < /hr3m3 < hr/3m3 <
Water consumption for
auxiliaryhr/3m67 /hr3m67 hr/3m26 < hr/3m50 <
Make Up Water
Consumptionhr/3m137 hr/3m70 < /hr3m28 < hr/3m52 <
Water saving - 50% 50%+19% 50%+12%
Absorbed Power 141 KW 520 kW 1070 KW 744 KW
Additional
Cost(mechanical)0.0 € 1,409,000 € 4,054,000 € 3,043,000 €
Additional cost (electrical) - - 65,000 € 21,700 €
Initial investment for
reducing 1 cubic meter
per hour of water
consumption
- 21,030 € 37,788 € 36,055 €
Total one year operating
cost128,628 € 112,307 € 134,557 € 120,623 €

0
500
1000
1500
2000
2500
3000
3500
4000
4500
5000
0
20
40
60
80
100
120
140
160
var.1 var.2 var.3 var.4
10
00
Eu
ro E
xstr
aIn
ve
stm
en
t,
Po
we
r C
on
s. K
W
Wa
ter
con
s. M
3/h
r
Water cons. M3/hr
Power cons.(kw)
Extra Investment(1000 Euro)

329m3/h118 m3/h105 m3/h
Using air cooler for EAF, LF and FTP
Improving the quality
of makeup water using demine water
Project Type: Steel making using EAF
Project Capacity: 800,000 tons per year
Required water using common technology: 329 m3/h (Industrial water)
� In this project, due to environmental conditions, using hybrid cooling towers was
not possible.
68% water saving
1800KW increase in power consumption4 million Euro increase in investment

جمع بندي :الزامات رسيدن به اهداف سند چشم انداز
تدوين استراتژي هم آهنگ در زنجيره فولاد از معدن تا محصول با نگاه به بازار بويژه صادرات
تامين منابع مالي بويژه در زير ساختها
تامين خوراك با پي گيري اكتشافات ، مشاركت در طرح هاي معدني ديگر كشور ها
ادغام واحدها بمنظوررسيدن به مقياس هاي مطلوب
ه بر طرح جامع فتعيين تكليف مجوز هاي اضا
:رقابت پذيري با
افزايش بهره وري توليد ، انرژي ، نيروي انساني
توليد محصولات با ارزش افزوده بالا براي صادرات
و بازسازي هااستفاده از تكنولوژي روز آمد در توسعه ها
باز سازي ونوسازي واحد هاي قديمي و افزايس سطح اتوماسيون
شركت ملي فولاد ايران