final - adem.alabama.govadem.alabama.gov/programs/water/wquality/tmdls/finallocustforkand...final...
TRANSCRIPT

Final Nutrient Total Maximum Daily
Loads (TMDLs) for
Locust Fork Waterbody ID AL03160111-0305-102
Waterbody ID AL03160111-0308-102
Waterbody ID AL03160111-0404-102 Waterbody ID AL03160111-0413-112 Waterbody ID AL03160111-0413-101
&
Village Creek Waterbody ID AL03160111-0409-100
Alabama Department of Environmental Management
Water Division Water Quality Branch
December 2017

Final Locust Fork and Village Creek TMDL Nutrients
Table of Contents Page # Chapter 1. Introduction ........................................................................................................................................................................................................................ 1
1.1. Executive Summary ........................................................................................................................................................................................................................... 1 1.2 Locust Fork Background Information ................................................................................................................................................................................................ 3
1.2.1 Hydrology ............................................................................................................................................................................................................................ 6 1.2.3 Environmental Importance .................................................................................................................................................................................................. 9
Chapter 2. Problem Definition ............................................................................................................................................................................................................ 10 2.1 Sampling History ............................................................................................................................................................................................................................. 10 2.2 §303(d) List History ......................................................................................................................................................................................................................... 12
2.2.1 Locust Fork 303(d) Listing History ...................................................................................................................................................................................... 12 2.2.2 Village Creek 303(d) Listing History .................................................................................................................................................................................... 14
2.3 Basis for Addition to §303(d) List of Impaired Waters ..................................................................................................................................................................... 15 Chapter 3 Nutrient Enrichment ......................................................................................................................................................................................................... 16
3.1 Eutrophication and Associated Symptoms ...................................................................................................................................................................................... 16 3.2 Nutrient Impairment Data Availability ............................................................................................................................................................................................ 17 3.3. Monitoring Results and Data Analysis ............................................................................................................................................................................................. 19
3.3.1 Locust Fork 2012 Sampling Results - Nutrients................................................................................................................................................................... 20 3.3.2 Locust Fork Reach – Macroinvertebrate Assessments ........................................................................................................................................................ 22 3.3.3 Locust Fork Reach – Habitat Assessments .......................................................................................................................................................................... 23 3.3.4 Village Creek 2005-2011 Sampling Results – Nutrients ...................................................................................................................................................... 24
Chapter 4 Source Analysis ................................................................................................................................................................................................................. 26 4.1 Overview of Sources in Watershed ................................................................................................................................................................................................. 26 4.2 Point Source Assessment ................................................................................................................................................................................................................ 26
4.2.1 Continuous Point Sources .................................................................................................................................................................................................. 26 4.2.2 Municipal Separate Storm Sewer Systems (MS4) ............................................................................................................................................................... 29 4.2.3 NPDES Permitted Mining Facilities ..................................................................................................................................................................................... 31 4.2.4 Concentrated Animal Feeding Operations (CAFOs) ............................................................................................................................................................ 32 4.2.5 NPDES Construction Stormwater General Permits ............................................................................................................................................................. 32
4.3 Nonpoint Source Assessment.......................................................................................................................................................................................................... 33 Chapter 5 Technical Approach for TMDL Development ..................................................................................................................................................................... 35
5.1 Modeling Effort Overview .............................................................................................................................................................................................................. 35 5.2 LSPC Watershed Model .................................................................................................................................................................................................................. 38
5.2.1 Point Source Assessment and Inputs.................................................................................................................................................................................. 38 5.2.2 Locust Fork Watershed Surface Water Withdrawal Sources .............................................................................................................................................. 39 5.2.3 Meteorological Data .......................................................................................................................................................................................................... 40 5.2.4 Hydrology Calibration ........................................................................................................................................................................................................ 40 5.2.5 Water Quality Calibration .................................................................................................................................................................................................. 42
5.3 Environmental Fluid Dynamics Code (EFDC) Model ......................................................................................................................................................................... 45 5.3.1 EFDC Model Calibration ..................................................................................................................................................................................................... 47
5.4 Water Quality Analysis Simulation Program (WASP) Model ............................................................................................................................................................ 48 5.4.1 WASP Model Calibration .................................................................................................................................................................................................... 49
Chapter 6.0 TMDL Development for the Locust Fork Watershed .......................................................................................................................................................... 52 6.1 Applicable Water Quality Criterion................................................................................................................................................................................................. 52
6.1.1 Chlorophyll-a Target Development .................................................................................................................................................................................... 55 6.2 Limiting Nutrient Identification ....................................................................................................................................................................................................... 58
6.2.1 Algal Growth Potential Test ............................................................................................................................................................................................... 59 6.2.2 WASP Predicted Nutrient Limitation .................................................................................................................................................................................. 59
6.3 Locust Fork Model Scenarios........................................................................................................................................................................................................... 61 6.3.1 Overview of Locust Fork Modeling Scenarios ..................................................................................................................................................................... 61 6.3.2 Locust Fork Scenario Descriptions ...................................................................................................................................................................................... 61 6.3.3 TMDL Scenarios Results ..................................................................................................................................................................................................... 63
Chapter 7 Expression and Allocation of the TMDL ............................................................................................................................................................................. 66 7.1 Components of the TMDL ............................................................................................................................................................................................................... 66 7.2 Numeric Targets.............................................................................................................................................................................................................................. 67 7.3 Existing/Baseline Conditions ........................................................................................................................................................................................................... 67 7.3 Critical Conditions ........................................................................................................................................................................................................................... 67 7.4 Waste Load Allocations ................................................................................................................................................................................................................... 68
7.4.1 WLA – NPDES Wastewater Discharges ............................................................................................................................................................................................. 68 7.4.2 WLA – NPDES Stormwater Discharges ............................................................................................................................................................................... 70
7.5 Load Allocations .............................................................................................................................................................................................................................. 70 7.6 Margin of Safety ............................................................................................................................................................................................................................. 73 7.7 Seasonal Variation .......................................................................................................................................................................................................................... 74
Chapter 8 Locust Fork Nutrient TMDL ............................................................................................................................................................................................... 75 Chapter 9 Village Creek Nutrient TMDL ............................................................................................................................................................................................. 76 Chapter 10 TMDL Implementation ...................................................................................................................................................................................................... 78
10.1 Implementation of Point Source Reductions ................................................................................................................................................................................... 78 10.2 Implementation of Nonpoint Source Reductions ............................................................................................................................................................................ 78 10.3 Adaptive Management ................................................................................................................................................................................................................... 79
Chapter 11 Follow Up Monitoring ....................................................................................................................................................................................................... 79 Chapter 12 Public Participation ........................................................................................................................................................................................................... 79 Chapter 13 References ......................................................................................................................................................................................................................... 81 Appendix A Locust Fork and Village Creek Water Quality Data (2005-2012)…………………………………………………………………………………………………………..………………………………………... 82 Appendix B Bankhead and Locust Fork 72hr Diurnal Study August 2016…………………..……..…………………………………………………………..……………………………………..…..….. ………………….98 Appendix C Locust Fork and Village Creek 2010 Ecoregional Reference Guideline……………………………………………………………………………………………………………………………………………101 Appendix D NPDES Wastewater Discharges – DMR Summaries ………………………..……………………………………………………………………………………..……………………………………………………..104 Appendix E Locust Fork and Village Creek Station Pictures………………………..…………………………………………………………………………………………………………..……………………………………..…107

Final Locust Fork and Village Creek TMDL Nutrients
List of Tables Page # Table 1.1.1 Locust Fork and Village Creek Nutrient TMDL 2
Table 1.2.1 Locust Fork Watershed – Waterbody Designated Uses and Categories 5
Table 1.2.1.1 Realtime USGS Stream Flow Gages in Locust Fork Watershed 7
Table 1.2.3.1 Threatened & Endangered Fauna in Locust Fork Watershed 10
Table 2.1.1 Locust Fork Watershed ADEM Trend Station 12
Table 2.2.1.1 Locust Fork Nutrient Impaired Segments on Department’s 2016 303(d) List 13
Table 2.2.2.1 Village Creek Segment on Department’s 2016 303(d) List 14
Table 3.2.1 Locust Fork 2012 303(d) Monitoring Project Stations 17
Table 3.3.2.1 Locust Fork 2012 Macroinvertebrate Assessment Results 22
Table 3.3.3.1 Locust Fork 2012 Habitat Assessment Results 23
Table 4.2.1.1 NPDES Continuous Point Sources Discharges in the Locust Fork Watershed 27
Table 4.2.1.2 TP Data Upstream/Downstream of Jefferson County Village Creek WWTP - 021 28
Table 4.2.1.3 2007 Village Creek Average Monthly Streamflow 29
Table 4.2.2.1 NPDES Phase 1 Program Municipalities in the Locust Fork Watershed 30
Table 4.2.2.2 NPDES Phase 2 Program Municipalities in the Locust Fork Watershed 30
Table 4.3.1 Locust Fork Watershed 2011 NLCD 34
Table 5.2.2.1 Locust Fork Watershed Surface Water Withdrawal Sources 39
Table 5.2.3.1 LSPC Model Weather Stations 40
Table 5.2.4.1 LSPC Watershed Hydrology Calibration Stations 40
Table 5.2.5.1 LSPC Watershed Water Quality Calibration Stations 42
Table 5.3.1 Bankhead Reservoir Surface Water Withdrawal Sources 46
Table 5.4.1.1 WASP Water Quality Calibration Stations 50
Table 6.1.1.1 Bankhead Tributary Embayment Chlorophyll-a data 55
Table 6.2.1.1 Locust Fork AGPT Results 59
Table 6.3.2.1 Point Source Categories 62
Table 6.3.2.1 Locust Fork TMDL Reduction Scenarios 63
Table 6.3.2.2 Locust Fork Reduction Scenario Results 64
Table 7.4.1.1 Class 1 NPDES Facilities (Effluent Flowrate ≥ 1.0 MGD) 68
Table 7.4.1.2 Class 2 NPDES Facilities (Effluent Flowrate < 1.0 MGD and Effluent Flowrate ≥ 0.10 MGD) 69
Table 7.4.1.3 Class 3 NPDES Facilities (Effluent Flowrate < 0.10 MGD) 69
Table 7.5.1.1 Locust Fork Sub-watershed 461: 2011 NLCD 72
Table 7.5.1.2 Load Allocation Calculations for Locust Fork Sub-watershed 461 73
Table 8.1.1 Locust Fork and Village Creek Nutrient TMDL 75

Final Locust Fork and Village Creek TMDL Nutrients
List of Figures Page # Figure 1.2.1 Locust Fork Watershed Location 3
Figure 1.2.2 Locust Fork Watershed – Waterbody Designated Uses and Categories 4
Figure 1.2.1.1 Locust Fork Elevation Gradient 6
Figure 1.2.1.2 Location of Realtime USGS Stream Flow Gages in Locust Fork Watershed 7
Figure 1.2.1.3 Locust Fork USGS Gage Low Flow Statistics 8
Figure 1.2.2.1 Locust Fork Level IV Eco-regions 9
Figure 2.2.1.1 Locust Fork Nutrient 2016 303(d) Segments 14
Figure 2.2.2.1 Village Creek Nutrient 2016 303(d) Segment 15
Figure 3.2.1 Locust Fork 2012 303(d) Monitoring Project Stations 18
Figure 3.3.1.1 Locust Fork 2012 Sampling Results – Total Phosphorus(mg/L) 20
Figure 3.3.1.2 Locust Fork 2012 Sampling Results – Total Nitrogen (mg/L) 21
Figure 3.3.1.3 Locust Fork 2012 Sampling Results – Chlorophyll-a (ug/L) 21
Figure 3.3.2.1 Locust Fork 2012 Macroinvertebrate Assessment Results 22
Figure 3.3.3.1 Locust Fork 2012 Habitat Assessment Results 23
Figure 3.3.4.1 Village Creek 2005-2012 Sampling Results – Total Phosphorus (mg/L) 24
Figure 3.3.4.1 Village Creek 2005-2012 Sampling Results – Total Nitrogen (mg/L) 25
Figure 3.3.4.1 Village Creek 2005-2012 Sampling Results – Chlorophyll-a (ug/l) 25
Figure 4.2.1.1 Continuous Point Sources in the Locust Fork Watershed 28
Figure 4.2.1.2 USGS Measured Daily Stream Flow on Village Creek during 2007 29
Figure 4.2.2.1 Locust Fork Watershed - Phase 1 and 2 MS4 Boundary Areas 31
Figure 4.3.1 Locust Fork Watershed 2011 NLCD 34
Figure 4.3.2 Locust Fork Water Impervious Cover Percentage (%) 35
Figure 5.1.1 Linkage between Dynamic Models 36
Figure 5.1.2 US Drought Monitor for Alabama – October 30, 2007 37
Figure 5.1.3 Daily Discharge: USGS 02456500 Locust Fork at Sayre 38
Figure 5.2.4.1 Example of Hydrology Calibration - USGS 02455000 Observed vs. Modeled Flow 41
Figure 5.2.5.1 LSPC Locust Fork Watershed Calibration Stations 43
Figure 5.2.5.2 LSPC Calibration – Modeled vs. Observed Temperature (C) at FM-2 43
Figure 5.2.5.3 LSPC Calibration – Modeled vs. Observed Total Nitrogen (mg/l) at FM-2 44
Figure 5.2.5.4 LSPC Calibration – Modeled vs. Observed Total Phosphorus (mg/l) at FM-2 44
Figure 5.3.1 EFDC Computation Grid Extent on Bankhead Reservoir 45
Figure 5.3.2 EFDC Computation Grid Extent on Locust Fork Tributary Embayment 46
Figure 5.3.1.1 Comparison of water surface elevation between USGS 02462500 vs. modeled 47
Figure 5.3.1.2 Comparison of station BANT-2 water temperature vs modeled temperature 48
Figure 5.4.1 WASP Model Boundary Inputs 49
Figure 5.4.1.1 WASP Calibration Example 51
Figure 6.1.1 Bankhead Lake and major tributaries 53
Figure 6.1.1.1 Locust Fork Embayment Station Chlorophyll-a data 57
Figure 6.1.1.2 WASP Permit Condition Chlorophyll-a - Longitudinal Profile 58
Figure 6.2.2.1 WASP Calibrated Model – BANT-3 Nutrient Limitation 2007-2012 60
Figure 6.2.2.2 WASP Calibrated Model – BANT-3 Nutrient Limitation 2007 60
Figure 6.3.3.1 Point Source Load Contribution 65
Figure 6.3.3.2 Locust Fork TMDL Scenario Chlorophyll-a Results 66
Figure 7.5.1.1 Locust Fork (Sub-watershed 461) Daily TP Load 71
Figure 7.5.1.2 Locust Fork Sub-watershed 461: 2011 NLCD 72
Figure 7.7.1 Monthly Flow Analysis at USGS 02456500 Locust Fork at Sayre 74
Figure 9.1.1 Village Creek (VLGJ-5) TP Measured vs TMDL Run #16 76
Figure 9.1.2 BANT-8 GSA Chlorophyll-a (ug/l) - Permit Condition vs TMDL Run #16 77

Final Locust Fork and Village Creek TMDL Nutrients
Useful Acronyms & Abbreviation
Useful Acronyms & Abbreviation (cont)
E EFDC – Environmental Fluid Dynamics Code F F&W - Fish and Wildlife Use Classification FDA - Food and Drug Administration Fe - Iron FO - Field Operations FS - Forestry Service (US) FY - Fiscal Year G GIS - Geographic Information Systems GOMA - Gulf of Mexico Alliance GPS - Global Positioning System GS - Growing Season GSA - Geological Survey of Alabama H HCR - Hydrographic Controlled Release Hg - Mercury HUC - Hydrologic Unit Code I IBI - Index of Biotic Integrity IF - Incremental Flow IWC - Instream Waste Concentration L LA - Load Allocation Lat/Long- Latitude / Longitude LDC - Load Duration Curve LIDAR - Light Detection & Ranging LSPC - Load Simulation Program C LWF - Limited Warmwater Fishery Use Classification M m3/s - Cubic Meters per Second MAF - Mean Annual Flow (MAF = AAF) mg/l - Milligrams per Liter MGD - Million Gallons per Day mi - Miles MOS - Margin of Safety MS4s - Municipal Separate Storm Sewer Systems
MZ - Mixing Zone
A A&I - Agriculture and Industry Use Classification AAF - Average Annual Flow ACES - Alabama Cooperative Extension Service ADEM - Alabama Department of Environmental Management ADPH - Alabama Department of Public Health AEMC - Alabama Environmental Management Commission AFO - Animal Feeding Operation AL - Alabama; Aluminum (Metals) AS - Arsenic ASWCC - Alabama Soil & Water Conservation Committee AWIC - Alabama Water Improvement Commission B BAT - Best Available Technology BCT - Best Conventional Pollutant Control Technology BMP - Best Management Practices BOD - Biochemical Oxygen Demand BPJ - Best Professional Judgment C CAFO - Concentrated Animal Feeding Operation CBOD5 - Five-Day Carbonaceous Biochemical
Oxygen Demand CBODu - Ultimate Carbonaceous Biochemical Oxygen Demand CFR - Code of Federal Regulations CFS - Cubic Feet per Second CMP - Coastal Monitoring Program COD - Chemical Oxygen Demand CPP - Continuing Planning Process CWA - Clean Water Act CY - Calendar Year D DA - Drainage Area DEM - Digital Elevation Model DMR - Discharge Monitoring Report DNCR - Department of Conservation & Natural Resources DO - Dissolved Oxygen

Final Locust Fork and Village Creek TMDL Nutrients
Useful Acronyms & Abbreviation (cont)
N N - Nitrogen NA - Not Applicable NASS - National Agricultural Statistics Service NBODx - Nitrogenous Biochemical Oxygen Demand NED - National Elevation Database NH3-N - Ammonia Nitrogen NHD - National Hydrography Database NLCD - National Land Cover Dataset NO3+NO2-N -Nitrate + Nitrite Nitrogen NOAA - National Oceanic and Atmospheric Administration NOV - Notice of Violation NPDES - National Pollutant Discharge Elimination System NPS - Non-Point Source NRCS - National Resource Conservation Service NTUs - Nephelometric Turbidity Units NWS - National Weather Service 0 OAW – Outstanding Alabama Water Use Classification OE - Organic Enrichment ONRW - Outstanding National Resource Water P P - Phosphorus Pb - Lead PCBs - Polychlorinated Biphenyl pH - Concentration of Hydrogen Ions Scale POTW - Publicly Owned Treatment Works ppb - Parts per Billion ppm - Parts per Million ppt - Parts per Trillion PS - Point Source PWS - Public Water Supply Use Classification PWSS - Public Water Supply System Q Q - Flow (MGD, m3/s, cfs) QA/QC - Quality Assurance / Quality Control QAPP - Quality Assurance Project Plan R RRMP - River and Reservoirs Monitoring Program RSMP - River and Streams Monitoring Program S S - Swimming and Other Whole Body Waters Contact Sports Use Classification SH - Shellfish Harvesting Use Classification
S (cont) SID - State Indirect Discharge SMZ - Streamside Management Zone SOD - Sediment Oxygen Demand SOP - Standard Operating Procedure SRF - State Revolving Fund SSO - Sanitary Sewer Overflow STP - Sewage Treatment Facility SW - Surface Water SWMP - Stormwater Management Plan SWQM - Spreadsheet Water Quality Model (AL) SWQMP - Surface Water Quality Monitoring Program T TBC - Technology-Based Controls TBD - To be Determined TDS - Total Dissolved Solids TKN - Total Kjeldahl Nitrogen TMDL - Total Maximum Daily Load TON - Total Organic Nitrogen TOT - Time of Travel Total P - Total Phosphorus TSS - Total Suspended Solids TVA - Tennessee Valley Authority U UAA - Use Attainability Analysis UIC - Underground Injection Control USDA - United Stated Department of Agriculture USGS - United States Geological Survey USEPA - United States Environmental Protection Agency USFWS - United States Fish & Wildlife Services UT - Unnamed Tributary UV - Ultraviolet Radiation W WASP - Water Quality Analysis Simulation Program WCS - Watershed Characterization System WET - Whole Effluent Toxicity WLA - Wasteload Allocation WMA - Wildlife Management Area WPCP - Wastewater Pollution Control Plant WQB - Water Quality Branch WRDB - Water Resources Database WTP - Water Treatment Plant WWTF - Wastewater Treatment Facility WWTP - Wastewater Treatment Plant WY - Water Year

Final Locust Fork and Village Creek TMDL Nutrients
1
Chapter 1. Introduction 1.1. Executive Summary The purpose of this report is to address the nutrient impairment on the Locust Fork, a major tributary to the Black Warrior River located in central Alabama. The report will also address the nutrient impairment on Village Creek, a tributary to the Locust Fork located west of Birmingham. The report presents a Total Maximum Daily Load (TMDL), which establishes pollutant loads that are necessary to attain the applicable water quality standards and are protective of the designated uses of the Locust Fork and Village Creek. The Locust Fork was originally added by the U.S. Environmental Protection Agency (USEPA) to Alabama’s §303(d) List of Impaired Waterbodies in 1998 with nutrients listed as the pollutant of concern. The EPA’s addition of this impaired segment of the Locust Fork was based upon a review of federally threatened and endangered species data published by the U.S. Fish and Wildlife Service (USFWS) in 1996. At the time of the EPA’s inclusion of the Locust Fork on the 1998 §303(d) List, the impaired reach was considered to be one single 47.3 mile segment, from County Rd 77 upstream to the mouth of Little Warrior River. In 2004, the impaired reach of the Locust Fork was re-segmented from one segment, formerly representing the entire impaired reach, to three individual segments in order to accurately depict the designated use classification of each individual segment. In 2012, the Department identified two additional segments of the Locust Fork that are impaired for nutrients and therefore added those segments to the 2012 §303(d) list. The listings were based on an analysis of water quality data collected at the Department’s reservoir stations located on those impaired reaches from 2005-2011. In 2012, the Department also identified one segment of Village Creek as being impaired for nutrients and therefore added the segment to the 2012 §303(d) list. The listing was based upon an analysis of water quality data collected during the time frame of 2005 to 2011 at station VLGJ-5 located on the impaired reach. In the non-wadeable tributary embayment segment of the Locust Fork, those conditions that facilitate the uptake of available nutrients in the water column, such as longer retention times and greater available sunlight reaching the water surface leading to increased water temperatures, are greatly improved compared to the wadeable segments. Consequently, the negative effects associated with the elevated concentrations of nutrients observed in the wadeable riverine segments of the Locust Fork, and several major tributaries to the Locust Fork, are being expressed further downstream in the tributary embayment lake segments. Therefore, the Department will establish the TMDL endpoint, in this case a chlorophyll-a target concentration, in the tributary embayment lake segment at existing station BANT-3. The chlorophyll-a growing season average target of 18 µg/L will be considered protective of the designated uses of both the tributary embayment and also the mainstem wadeable segments located upstream in the watershed.

Final Locust Fork and Village Creek TMDL Nutrients
2
The implementation of the point source nutrient reductions necessary to meet the instream chlorophyll-a target will be applicable to all continuous point sources located throughout the watershed that contribute to the nutrient impairment, and not just those sources that discharge directly to the mainstem Locust Fork. Moreover, the nutrient reductions in the Village Creek watershed as a result of this TMDL indicate the established chlorophyll-a target in the Locust Fork tributary embayment will also be considered protective of the designated uses of the lower Village Creek segment. Therefore, this TMDL also addresses the lower segment of Village Creek that was added to Alabama’s §303(d) List of Impaired Waterbodies in 2012 with nutrients listed as the pollutant of concern. The TMDL development process utilized a series of dynamically linked water quality models (LSPC, EFDC, and WASP) to accurately predict the necessary nutrient reductions in the watershed to meet the established chlorophyll-a target. The three individual modeling programs were executed to dynamically simulate the time period from January 1, 2007 to December 31, 2012. The model network was calibrated based upon available metrological, hydrological, and ambient water quality data during the model simulation period. The final TMDL is based upon the necessary waste load allocation (WLA), load allocation (LA), and margin of safety (MOS) required to meet a numeric chlorophyll-a growing season average target of 18 µg/l, established at the compliance point located in the Locust Fork tributary embayment at station BANT-3. The waste load allocation component for the continuous point sources in the Locust Fork watershed should be applied as an effluent monthly average total phosphorus concentration limit applicable during the months of March through October.
Table 1.1 Locust Fork and Village Creek Nutrient TMDL
WLA (Continuous Sources) WLA (MS4 Stormwater
Sources)
LA (Stormwater
Sources)
Margin of Safety
TP Effluent Limit for Class 1
TP Effluent Limit for Class 2
TP Effluent Limit for Class 3
Percent Reduction to
existing TP Load
Percent Reduction to existing TP
Load (Qw ≥ 1
MGD) (Qw < 1 MGD & Qw ≥ 0.1 MGD)
(Qw < 0.1 MGD)
0.25 mg/L 2 mg/L 6 mg/L 36% a 36% Implicit
a. MS4 permits that are located in the Locust Fork Watershed must comply with this TMDL. MS4 permits are BMP-based and currently do not specify numeric total phosphorus limits. Therefore, TMDL compliance will be demonstrated through implementation and maintenance of BMPs on a case-by-case basis. For the purposes of this TMDL, the 36% reduction to existing MS4 Stormwater Source total phosphorus loads should not be interpreted as a numeric permit limitation.

Final Locust Fork and Village Creek TMDL Nutrients
3
1.2 Locust Fork Background Information The Locust Fork is a major tributary to the Black Warrior River. The Locust Fork watershed is primarily located in Jefferson and Blount counties, although the north-eastern headwater extent also resides in Marshall and Etowah counties. The Locust Fork flows southwest for a total stream length of 160 miles before its confluence with the Mulberry Fork in Bankhead Lake Reservoir. The total watershed drainage area is approximately 1209 square miles. The Locust Fork is the second longest free-flowing river in Alabama and as such the river has garnished the reputation for being a premiere whitewater destination in the Southeast.
Figure 1.2.1 Locust Fork Watershed Location

Final Locust Fork and Village Creek TMDL Nutrients
4
The Department has assigned designated uses for all the assessed waterbodies found in the Locust Fork Watershed. Designated uses describe the best uses that can be reasonably expected for those particular waters. The mainstem of the Locust Fork includes the following designated uses: Public Water Supply (PWS), Swimming (S), and Fish and Wildlife (F&W). The highlighted segments in red shown below have been placed in Category 5 and listed on the Department’s §303(d) List, meaning those particular segments are considered impaired and are consequently not meeting their designated use classifications.
Figure 1.2.2 Locust Fork Watershed – Waterbody Designated Uses and 2016 §303(d) Segments
Table 1.2.1 on the following page provides additional information for all of the assessed waterbodies in the Locust Fork watershed, including the 2016 assessment unit, use classification, and waterbody category.

Final Locust Fork and Village Creek TMDL Nutrients
5
Table 1.2.1 Locust Fork Watershed – Waterbody Designated Uses and Categories
2016 ASSESSMENT ID WATERBODY USE
CLASS DOWNSTREAM EXTENT UPSTREAM EXTENT
CATE-GORY
AL03160111-0307-400 Black Creek F&W Cunningham Creek its source 5
AL03160111-0204-111 Blackburn Fork PWS Inland Lake Dam extent of reservoir 1
AL03160111-0204-102 Blackburn Fork PWS Inland Lake Highland Lake Dam 1
AL03160111-0204-103 Blackburn Fork PWS Highland Lake Dam extent of reservoir 1
AL03160111-0204-104 Blackburn Fork PWS Highland Lake Its source 1
AL03160111-0207-300 Blackburn Fork F&W Little Warrior River Inland Lake Dam 1
AL03160111-0101-100 Bristow Creek F&W Locust Fork Its source 2B
AL03160111-0206-101 Calvert Prong F&W Little Warrior River Whited Creek 1
AL03160111-0206-102 Calvert Prong PWS Whited Creek Its source 1
AL03160111-0408-300 Camp Branch F&W Bayview Lake Its source 4A
AL03160111-0206-500 Chitwood Creek F&W Calvert Prong Its source 3
AL03160111-0103-100 Clear Creek F&W Locust Fork Its source 2B
AL03160111-0413-600 Coal Creek F&W Locust Fork its source 2A
AL03160111-0401-100 Crooked Creek F&W Locust Fork Its source 2B
AL03160111-0307-200 Cunningham Creek F&W Turkey Creek Its source 3
AL03160111-0203-100 Dry Creek F&W Locust Fork Its source 5
AL03160111-0407-100 Fivemile Creek F&W Locust Fork Its source 4B
AL03160111-0202-200 Graves Creek F&W Locust Fork Its source 4A
AL03160111-0304-100 Gurley Creek F&W Locust Fork Its source 1
AL03160111-0207-900 Hendrick Mill Branch F&W Blackburn Fork Its source 1
AL03160111-0106-110 Little Reedbrake Creek F&W Slab Creek Its source 2B
AL03160111-0207-100 Little Warrior River F&W Locust Fork Its source 1
AL03160111-0202-102 Locust Fork F&W Blount County Road 30 Its source 1
AL03160111-0413-101 Locust Fork PWS/S/ F&W
Junction of Locust and Mulberry Forks
Jefferson County Highway 61
5
AL03160111-0410-100 Locust Fork F&W Village Creek Jefferson County Road 77 2B
AL03160111-0208-101 Locust Fork F&W Little Warrior River Blount County Road 30 5
AL03160111-0305-102 Locust Fork F&W County road between
Hayden and County Line Little Warrior River 5
AL03160111-0308-102 Locust Fork PWS/ F&W
US Highway 31 county road between
Hayden and County Line 5
AL03160111-0404-102 Locust Fork F&W Jefferson County Road 77 US Highway 31 5
AL03160111-0413-112 Locust Fork F&W Jefferson County Highway
61 Village Creek 5
AL03160111-0302-100 Longs Branch F&W Locust Fork Its source 2A
AL03160111-0206-800 Mill Creek F&W Chitwood Creek Its source 3
AL03160111-0405-101 Newfound Creek F&W Fivemile Creek Impoundment 5
AL03160111-0303-200 Sand Valley Creek F&W Gurley Creek Its source 2B
AL03160111-0304-201 Self Creek F&W Gurley Creek Alabama Highway 79 2B
AL03160111-0304-202 Self Creek PWS Alabama Highway 79 Its source 2B
AL03160111-0411-100 Short Creek F&W Locust Fork Its source 1
AL03160111-0106-100 Slab Creek F&W Locust Fork Its source 2B
AL03160111-0307-100 Turkey Creek F&W Locust Fork Its source 2A
AL03160111-0409-100 Village Creek F&W Locust Fork Bayview Lake Dam 5
AL03160111-0408-101 Village Creek LWF Bayview Lake Dam Second Creek 4A
AL03160111-0408-102 Village Creek LWF Second Creek Woodlawn Bridge 5
AL03160111-0408-103 Village Creek LWF Woodlawn Bridge Its source 5
AL03160111-0404-500 Ward Creek F&W Locust Fork Its source 2B
AL03160111-0201-600 Whippoorwill Creek F&W Wynnville Creek Its source 3
AL03160111-0206-700 Whited Creek F&W Calvert Prong Its source 3
AL03160111-0201-100 Wynnville Creek F&W Locust Fork Its source 2B
Final Locust Fork and Village Creek TMDL Nutrients
6
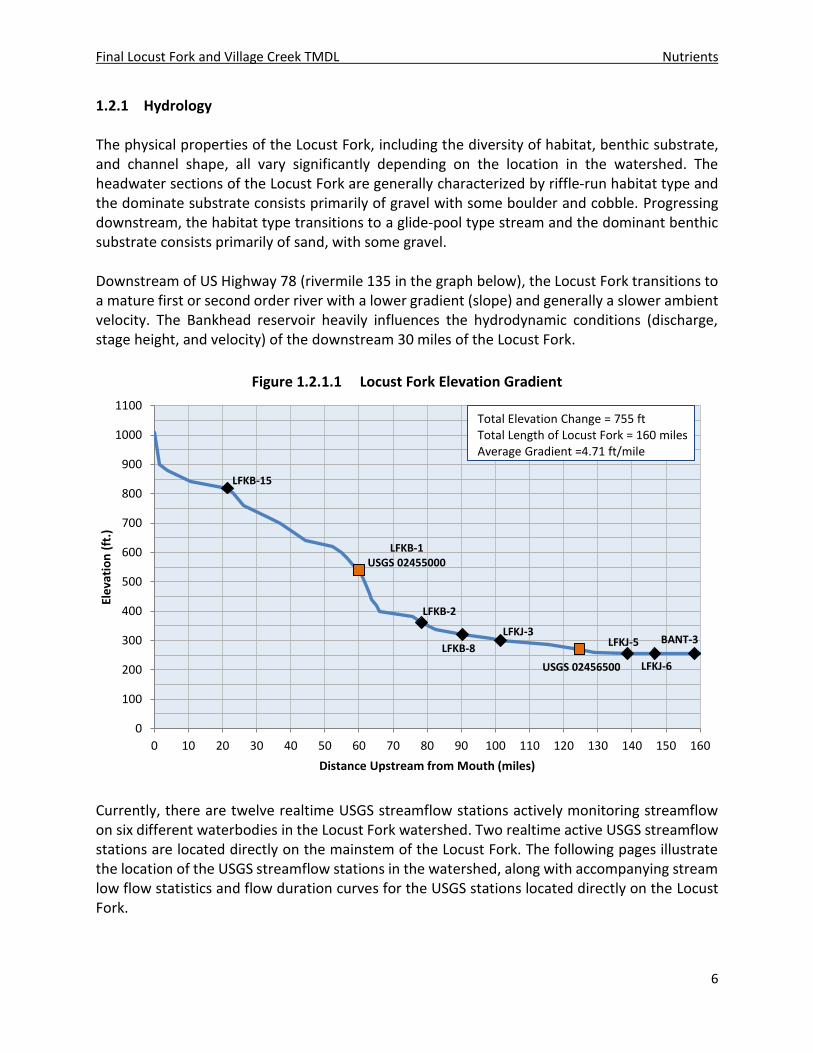
1.2.1 Hydrology The physical properties of the Locust Fork, including the diversity of habitat, benthic substrate, and channel shape, all vary significantly depending on the location in the watershed. The headwater sections of the Locust Fork are generally characterized by riffle-run habitat type and the dominate substrate consists primarily of gravel with some boulder and cobble. Progressing downstream, the habitat type transitions to a glide-pool type stream and the dominant benthic substrate consists primarily of sand, with some gravel. Downstream of US Highway 78 (rivermile 135 in the graph below), the Locust Fork transitions to a mature first or second order river with a lower gradient (slope) and generally a slower ambient velocity. The Bankhead reservoir heavily influences the hydrodynamic conditions (discharge, stage height, and velocity) of the downstream 30 miles of the Locust Fork.
Figure 1.2.1.1 Locust Fork Elevation Gradient
Currently, there are twelve realtime USGS streamflow stations actively monitoring streamflow on six different waterbodies in the Locust Fork watershed. Two realtime active USGS streamflow stations are located directly on the mainstem of the Locust Fork. The following pages illustrate the location of the USGS streamflow stations in the watershed, along with accompanying stream low flow statistics and flow duration curves for the USGS stations located directly on the Locust Fork.
LFKB-15
LFKB-1USGS 02455000
LFKB-2
LFKB-8
LFKJ-3
USGS 02456500
LFKJ-5
LFKJ-6
BANT-3
0
100
200
300
400
500
600
700
800
900
1000
1100
0 10 20 30 40 50 60 70 80 90 100 110 120 130 140 150 160
Ele
vati
on
(ft
.)
Distance Upstream from Mouth (miles)
Total Elevation Change = 755 ftTotal Length of Locust Fork = 160 milesAverage Gradient =4.71 ft/mile

Final Locust Fork and Village Creek TMDL Nutrients
7
Table 1.2.1.1 Realtime USGS Stream Gages in Locust Fork Watershed Agency Site Number Site Name
USGS 02455000 LOCUST FORK NEAR CLEVELAND, AL.
USGS 02455185 BLACKBURN FORK LITTLE WARRIOR R NR HOLLY SPRINGS
USGS 02455980 TURKEY CREEK AT SEWAGE PLANT NEAR PINSON AL
USGS 02456500 LOCUST FORK AT SAYRE, AL.
USGS 02457000 FIVEMILE CREEK AT KETONA AL
USGS 02457595 FIVEMILE CREEK NEAR REPUBLIC, AL
USGS 02458148 VILLAGE CREEK AT 86TH ST NORTH AT ROEBUCK, AL.
USGS 02458190 TRIB TO VILLAGE CREEK AT 50th ST IN BIRMINGHAM
USGS 02458300 VILLAGE CREEK AT 24TH ST. AT BIRMINGHAM, AL
USGS 02458450 VILLAGE CREEK AT AVENUE W AT ENSLEY, AL
USGS 02458502 VILLAGE CREEK NEAR PRATT CITY, ALABAMA
USGS 02458600 VILLAGE CREEK NEAR DOCENA, ALABAMA
Figure 1.2.1.2 Location of Realtime USGS Stream Flow Gages in Locust Fork Watershed

Final Locust Fork and Village Creek TMDL Nutrients
8
Figure 1.2.1.3 Locust Fork USGS Gage Low Flow Statistics
1.2.2 Eco-Regions
The Locust Fork watershed is comprised of two Level III Ecoregions: 67-Ridge and Valley and 68-Southwestern Appalachians. The watershed can be further subdivided into the following Level IV Ecoregions: 67f Southern Limestone/Dolomite Valleys and Low Rolling Hills (17%), 68b Sequatchie Valley (2%), 68d Southern Table Plateaus (39%), 68e Dissected Plateau (7%), 68f Shale Hills (34%). The figure below illustrates the aforementioned Level IV ecoregions found in the Locust Fork Watershed and provides a brief description of each ecoregion.
Name Locust Fork Near
Cleveland, AL.
USGS Gage # 02455000
Period of Record 12/01/1936 to
5/31/2016
Coordinates 34.0244, -86.5742
Drainage Area (mi2): 303
7Q10 (cfs): 5.68
7Q2 (cfs): 12.28
1Q10 (cfs): 5.12
Name Locust Fork at
Sayre, AL
USGS Gage # 02456500
Period of Record 10/01/1928 to
9/30/2016
Coordinates 33.7097,-86.9833
Drainage Area (mi2): 885
7Q10 (cfs): 31.12
7Q2 (cfs): 58.19
1Q10 (cfs): 27.82
1
10
100
1000
10000
100000
0 10 20 30 40 50 60 70 80 90 100
Dis
char
ge, c
ub
ic f
ee
t p
er
seco
nd
Flow Duration Interval (%)
USGS 02455000 Flow Duration Curve
10
100
1000
10000
100000
0 10 20 30 40 50 60 70 80 90 100
Dis
char
ge, c
ub
ic f
ee
t p
er
seco
nd
Flow Duration Interval (%)
USGS 02456500 Flow Duration Curve

Final Locust Fork and Village Creek TMDL Nutrients
9
Figure 1.2.2.1 Locust Fork Watershed Level IV Eco-regions
1.2.3 Environmental Importance
As previously discussed, the Locust Fork is a valuable natural resource within the state of Alabama. The waterbody provides numerous benefits to the residents of Alabama including, but not limited to, the following:
Swimming and other water sports
Outdoor recreational activities including fishing, canoeing, and whitewater rafting
Available pollutant assimilation from point sources located throughout the watershed Furthermore, the Locust Fork watershed also supports a tremendously diverse population of aquatic flora and fauna. A partnership effort involving the U.S. Fish and Wildlife Service (USFWS), Alabama Department of Conservation and Natural Resources (ADCNR) and the Geological Survey of Alabama (GSA) have identified the Locust Fork watershed as critical habitat for several threatened and endangered species of fish, snails, and mussels. The table below lists the aquatic

Final Locust Fork and Village Creek TMDL Nutrients
10
fauna currently identified by the U.S. Fish and Wildlife Service (USFWS) as being threatened or endangered that are found in the Locust Fork watershed.
Table 1.2.3.1 Threatened & Endangered Fauna in Locust Fork Watershed
Scientific name Common name Species USFWS
Conservation Status
Alabama Conservation
Concern
Elliptio arca Alabama Spike Mussel
P1
Elliptio arctata Delicate Spike Mussel
P2
Hamiota perovalis Orangenacre Mucket Mussel Threatened P2
Medionidus acutissimus Alabama Moccasinshell Mussel Threatened P1
Medionidus parvulus Coosa Moccasinshell Mussel Endangered P1
Pleurobema furvum Dark Pigtoe Mussel Endangered P1
Ptychobranchus greenii Triangular Kidneyshell Mussel Endangered P1
Elimia melanoides Black Mudalia Snail Candidate P2
Fontigens nickliniana Watercress Snail Snail
P1
Leptoxis plicata Plicate Rocksnail Snail Endangered P1
Etheostoma bellator Warrior Darter Fish
P2
Etheostoma chermocki Vermillion Darter Fish Endangered P1
Etheostoma nuchale Watercress Darter Fish Endangered P1
Etheostoma phytophilum Rush Darter Fish Endangered P1
Etheostoma sp cf bellator" A" Locust Fork Darter Fish
P2
Notropis cahabae Cahaba Shiner Fish Endangered P1
Percina brevicauda Coal Darter Fish
P2
Necturus alabamensis Black Warrior waterdog Salamander Candidate P1
Sternotherus depressus Flattened musk turtle Turtle Threatened P1
P1 – Highest Conservation Concern P2 – High Conservation Concern
Chapter 2. Problem Definition
2.1 Sampling History The Locust Fork and several of the major tributaries in the watershed that drain out of urbanized areas of western Birmingham have historically been exposed to excessive industrial and municipal pollution. In 1949, the Alabama Water Improvement Commission conducted an intensive survey of the water quality conditions of the Black Warrior River Basin. The survey included 34 sampling locations on waterbodies in the Locust Fork watershed. The results from this sampling effort indicated several of the major tributaries to the Locust Fork that drain out of the metropolitan western Birmingham area were “grossly polluted.” Furthermore, the survey

Final Locust Fork and Village Creek TMDL Nutrients
11
concluded the “results of the laboratory analyses definitely show the deleterious effect of pollutional materials from the metropolitan Birmingham on the Locust Fork of the Warrior River” (AWIC 1949). Since 1972, the passage of the Clean Water Act and the implementation of the NPDES permitting program have helped to address some of the chronic pollution problems observed in the Locust Fork watershed. However, in the past twenty years, the continuous increase in population of Jefferson and Blount counties has translated to larger capacity municipal waste water treatment plants in the watershed in order to accommodate the growing census. There have been numerous studies conducted in the Locust Fork watershed in order to gain a better understanding of how the anthropogenic sources of pollution are affecting the instream water quality and consequently the aquatic life. Specifically, Fivemile Creek and Village Creek have been routinely sampled under ADEM’s Ambient Monitoring Program since the 1970’s in order to monitor the effects of the industrial and municipal point source discharges in the watersheds. In 1997, the Environmental Indicator Section of the Field Operations Division of ADEM conducted a basin wide screening assessment of the Black Warrior River watershed. The goal of the screening project was to provide data that will allow ADEM to estimate the current status of the ecological conditions throughout the sub-basin using indicators of biological, habitat, and chemical/physical conditions. The project included an assessment of the fish and macro-invertebrate communities at a total of 43 stations located throughout the watershed. The results indicated that, of the 43 bioassessments conducted at 43 stations, only one station was assessed as “unimpaired” (3%). Seven stations (16%) were evaluated as “slightly impaired” and thirty-one stations (72%) were evaluated as “moderately impaired.” Four stations (9%) were evaluated as “severely impaired” (EIS 1999). During 2012, the Department conducted an intensive sampling effort on the Locust Fork in order to collect water quality data that would be utilized for future TMDL development. In-situ field parameter measurements and water quality samples were collected at seven stations on a monthly basis from April – November. Also, benthic macroinvertebrate communities were sampled at five locations along the wadeable segments of the Locust Fork. The results of this monitoring effort are discussed in greater detail later in this report. As part of the Department’s Surface Water Monitoring Strategy, a comprehensive network of fixed long term trends stations are routinely monitored on several waterbodies located within the Locust Fork watershed. The overall goal of the Department’s trend station network is to gather sufficient water quality data at specific locations so that long-term trends in water quality can be identified. Currently, there are six trend monitoring stations located on three different waterbodies in the Locust Fork Watershed. The table below gives further information in regards to the specific locations of the trend stations in addition to the scheduled sampling frequency.

Final Locust Fork and Village Creek TMDL Nutrients
12
Table 2.1.1 ADEM Trend Stations in Locust Fork Watershed
Station Latitude Longitude Waterbody Station Description Sampling
Frequency
FM-2 33.61111 -86.88556 Five Mile
Creek Five Mile Creek @ Republic Rd. (Cnty Rd.
67) May/July/ September
FMCJ-1B 33.60191 -86.75527 Five Mile
Creek Five Mile Creek @ State Highway 79 (near
Ketona) May/July/ September
LFKB-1 34.02369 -86.57333 Locust Fork Locust Fork @ ALA HWY 231 May/July/ September
LFKJ-6 33.58726 -87.10933 Locust Fork Locust Fork of Black Warrior River @ State
Highway 269 Monthly
VI-3 33.54797 -86.92567 Village Creek Village Creek @ Jefferson County Rd. 65 May/July/ September
VLGJ-5 33.62729 -87.05334 Village Creek Village Creek @ Jefferson County Rd. 45
(Porter Rd.) Monthly
2.2 §303(d) List History Section 303(d) of the Clean Water Act (CWA), as amended by the Water Quality Act of 1987, and EPA’s Water Quality Planning and Management Regulations [Title 40 of the Code of Federal Regulations (CFR), Part 130] require states to identify waterbodies which are not meeting water quality standards applicable to their designated uses and to determine the total maximum daily load (TMDL) for pollutants causing use impairment. The TMDL process establishes the allowable loading of pollutants for a waterbody based on the relationship between pollution sources and in-stream water quality conditions, so that states can establish water-quality based controls to reduce pollution from both point and nonpoint sources and restore and maintain the quality of their water resources (USEPA, 1991). The goal of the Locust Fork and Village Creek Nutrient TMDL is to establish pollutant loads that are necessary to attain the applicable water quality standards and are protective of the designated uses of both the Locust Fork and Village Creek. 2.2.1 Locust Fork §303(d) Listing History The Alabama Department of Environmental Management (ADEM) has identified five segments of the Locust Fork of the Black Warrior River Basin as being impaired for nutrients. The table below is an excerpt from the Department’s 2016 §303(d) list providing additional information about the listed segments impaired for nutrients on the Locust Fork. Refer to “Figure 3.2.1 Locust Fork 2012 §303(d) Monitoring Project Stations” for a map depicting the relative location of the impaired reaches in the watershed.

Final Locust Fork and Village Creek TMDL Nutrients
13
Table 2.2.1.1 Locust Fork Nutrient Impaired Segments on Department’s 2016 §303(d) List
Assessment Unit ID County Uses Size
(miles/ acres)
Date of
Data
Downstream/Upstream Locations
Year Listed
AL03160111-0305-102a Blount/
Jefferson F&W 18.15 mi 1998
County Rd between Hayden and County Line / Little Warrior River
1998
AL03160111-0308-102a Blount/
Jefferson PWS/ F&W
14.86 mi 1998 US Highway 31 / County Rd
between Hayden and County Line 1998
AL03160111-0404-102a Blount/
Jefferson F&W 14.25 mi 1998
Jefferson County Rd 77 / US Highway 31
1998
AL03160111-0413-112 Jefferson F&W 426.66 acres
2005 -2012
Jefferson County Hwy 61 / Village Creek
2012
AL03160111-0413-101 Jefferson PWS/S/
F&W 625.96 acres
2005 -2012
Junction of Locust and Mulberry Fork / Jefferson County Hwy 61
2012
a. EPA addition to Department’s 1998 303(d) List – 1998 ADEM Assessment Unit ID: AL/03160111-120_01
The Locust Fork was originally added by the U.S. Environmental Protection Agency (USEPA) to Alabama’s §303(d) list in 1998 with nutrients listed as the pollutant of concern. The EPA’s addition of this impaired segment of the Locust Fork was based upon a review of federally threatened and endangered species data published by the U.S. Fish and Wildlife Service (FWS) in 1996. The EPA coupled this information with subwatershed species occurrence data provided by both the Nature Conservancy and Alabama Natural Heritage Program (ANHP). The EPA reached the conclusion that this segment of the Locust Fork “no longer supported” its use classification due to a nutrient impairment which had consequently led to the extirpation of the federally endangered Plicate Rocksnail (Leptoxis plicata) formerly found in the watershed. At the time of the Department’s inclusion of the Locust Fork on the 1998 §303(d) List, the impaired reach was considered to be one single 47.3 mile segment, from County Rd 77 upstream to the mouth of Little Warrior River. In 2004, the impaired reach of the Locust Fork was re-segmented from one segment, formerly representing the entire impaired reach, to three individual segments in order to accurately depict the designated use classification of each individual segment. In 2012, the Department identified two additional segments of the Locust Fork that are impaired for nutrients and therefore added those segments to the 2012 §303(d) list. The listings were based upon an analysis of water quality data collected at the Department’s tributary embayment stations located on those impaired reaches from 2005-2011. For further information regarding the Department’s basis for the addition of those segments to the 2012 §303(d) the list, see Alabama’s 2012 §303(d) List Fact Sheet. The figure below illustrates the nutrient impaired segments on the Locust Fork that are addressed in this TMDL:

Final Locust Fork and Village Creek TMDL Nutrients
14
Figure 2.2.1.1 Locust Fork Nutrient 2016 §303(d) Segments
2.2.2 Village Creek §303(d) Listing History In 2012, the Department also identified one segment of Village Creek as being impaired for nutrients. The table below is an excerpt from the Department’s 2016 §303(d) list providing additional information about the listed segment impaired for nutrients. The listing was based upon an analysis of water quality data collected at station VLGJ-5 from 2005-2011. For further information regarding the Department’s basis for the addition of those segments to the 2012 §303(d) the list, see Alabama’s 2012 §303(d) List Fact Sheet.
Table 2.2.2.1 Village Creek Segment on Department’s 2016 §303(d) List
Assessment Unit ID County Use Size (miles) Date of
Data Downstream/Upstream
Locations Year
Listed
AL03160111-0409-100 Jefferson F&W 17.90 mi 2005-2011
Locust Fork / Bayview Lake Dam
2012
The map below illustrates the Village Creek segment (AL03160111-0409-100) that is addressed in this TMDL:

Final Locust Fork and Village Creek TMDL Nutrients
15
Figure 2.2.2.1 Village Creek Nutrient 2016 §303(d) Segment
2.3 Basis for Addition to §303(d) List of Impaired Waters
Based upon the available data, the Locust Fork was included on the Department’s §303(d) List with nutrients and siltation considered the pollutants causing the impairment. Furthermore, Village Creek was included on the Department’s §303(d) List with nutrients considered the pollutant causing the impairment. Nutrients are considered to be essential elements in the water column in regards to supporting aquatic life. However, when nutrients are present in concentrations that are considered elevated in comparison to natural conditions, there can be adverse effects such as excessive aquatic plant growth which in turn can lead to eutrophic conditions in the waterbody. ADEM’s decision to list the Locust Fork and Village Creek as being impaired for nutrients was authorized under ADEM’s Water Quality Standards Program, which employs both numeric and narrative criteria to ensure adequate protection of designated uses for surface waters of the State. Numeric criteria typically have quantifiable endpoints for given parameters such as pH, dissolved oxygen, or a toxic pollutant, whereas narrative criteria are qualitative statements that establish a set of desired conditions for all State waters. These narrative criteria are more

Final Locust Fork and Village Creek TMDL Nutrients
16
commonly referred to as “free from” criteria that enable States a regulatory avenue to address pollutants or problems that may be causing or contributing to a use impairment that otherwise cannot be evaluated against any numeric criteria. Typical pollutants that fall under this category are nutrients and siltation. Historically, in the absence of established numeric nutrient criteria, ADEM and/or EPA would use available data and information coupled with best professional judgment to determine overall use support for a given waterbody. Narrative criteria continue to serve as a basis for determining use attainability and subsequently listing/delisting of waters from Alabama’s §303(d) List. ADEM’s Narrative Criteria are shown in ADEM’s Administrative Code 335-6-10-.06 as follows: 335-6-10-.06 Minimum Conditions Applicable to All State Waters. The following minimum conditions are applicable to all State waters, at all places and at all times, regardless of their uses:
(a) State waters shall be free from substances attributable to sewage, industrial wastes or other wastes that will settle to form bottom deposits which are unsightly, putrescent or interfere directly or indirectly with any classified water use. (b) State waters shall be free from floating debris, oil, scum, and other floating materials attributable to sewage, industrial wastes or other wastes in amounts sufficient to be unsightly or interfere directly or indirectly with any classified water use. (c) State waters shall be free from substances attributable to sewage, industrial wastes or other wastes in concentrations or combinations, which are toxic or harmful to human, animal or aquatic life to the extent commensurate with the designated usage of such waters.
Chapter 3 Nutrient Enrichment
3.1 Eutrophication and Associated Symptoms Eutrophication is the process of the enrichment of an aquatic ecosystem due to the excessive buildup of nutrients over time. Although eutrophication generally occurs naturally in a waterbody over a long period of time, human activities in the watershed can certainly accelerate the rate at which nutrients are being externally introduced into the aquatic ecosystem. A symptom of eutrophication in a waterbody includes the overabundant growth of algae in the water column. Through the process of the algae naturally dying and the organic material undergoing decomposition, the available dissolved oxygen in the water column is consumed and depleted. Conversely, algae also naturally replenish the water column with oxygen through the process of photosynthesis. If algae levels in a waterbody become unbalanced, this in turn can lead to extreme fluctuations in dissolved oxygen and pH levels as a result of algal photosynthesis/respiration. The severe amplitude of the maximum pH and minimum dissolved oxygen concentrations can negatively impact aquatic life. The effects of nutrient enrichment are not just limited to the aquatic life. The excessive growth of algae can also adversely impact recreational opportunities on the waterbody. Perhaps the most obvious visual example of nutrient over-enrichment is the presence of large, unattractive

Final Locust Fork and Village Creek TMDL Nutrients
17
mats of floating periphyton on the water surface; these noxious floating mats can adversely impact recreational activities like swimming, boating, and fishing. Furthermore, the presence of excessive algae can also lead to an increase in the incidence of harmful algal blooms. Cyanobacteria (blue-green algae) blooms can produce toxins that are considered harmful to human health through the contamination of recreational sources and most importantly drinking water sources.
3.2 Nutrient Impairment Data Availability The source of data that was utilized in the calibration of the water quality models and also TMDL development for the Locust Fork is from the Department’s Ambient Trent Monitoring program and also the 2008 and 2012 §303(d) sampling program. During the sampling period, macro-invertebrate community assessments, habitat assessments, field parameters, and conventional lab parameters were collected at several stations along the Locust Fork. The stations were selected on the reaches of the Locust Fork that are meeting their use classification and also along the reaches impaired for nutrients that are currently listed on the Department’s §303(d) List. The table below gives additional information in regards to the ADEM station locations and descriptions. See Figure 3.2.1 below on the following page for an illustration of the station locations in the watershed.
Table 3.2.1 Locust Fork 2012 §303(d) Monitoring Project Stations Station
ID Trend
Station Latitude Longitude Location Description
Frequency
LFKB-15 34.08444 -86.28917 Locust Fork at unnamed CR approx. 1 mi
NNE of Walnut Grove Monthly (Apr – Nov)
LFKB-1 Yes 34.02370 -86.57334 Locust Fork at ALA HWY 231 Monthly (Apr – Nov)
LFKB-2 33.88849 -86.69532 Locust Fork at Armston Loop/Center Springs
Rd (Vaughns Bridge) Monthly (Apr – Nov)
LFKB-8 33.80931 -86.80075 Locust Fork at Warrior-Kimberly Road Monthly (Apr – Nov)
LFKJ-3 33.74402 -86.91853 Locust Fork at Co Rd 77 "Hewitt Bridge" Monthly (Apr – Nov)
LFKJ-5 33.63653 -87.06124 Locust Fork at Co Rd 45"Porter Road" Monthly (Apr – Nov)
LFKJ-6 Yes 33.58726 -87.10933 Locust Fork at Co Rd 269 "Attwood Ferry
Bridge" Monthly (Apr – Nov)
BANT-3 33.54480 -87.17498 Locust Fork. Deepest point of the main
river channel Locust Fork. Approx. 1.5 mi. upstream of Mulberry Locust confluence.
Monthly (Apr – Nov)

Final Locust Fork and Village Creek TMDL Nutrients
18
Figure 3.2.1 Locust Fork 2012 §303(d) Monitoring Project Stations
For the purposes of evaluating the ambient nutrient data (total phosphorus and total nitrogen), the eco-reference value has also been included with the data set. In 2010, ADEM published ecoregional reference guidelines for a number of parameters and pollutants. Reference streams, also referred to as “reference reaches” or “ecoregional reference sites,” are defined as relatively homogeneous areas of similar climate, land form, soil, natural vegetation, hydrology, and other ecologically relevant variables (USEPA, 2000b) which have remained comparatively undisturbed or minimally impacted by human activity over an extended period of time in relation to other waters of the State. While not necessarily pristine or completely undisturbed by humans, reference streams do represent desirable chemical, physical and biological conditions for a given ecoregion that can be used for evaluation purposes. The reference streams selected for a particular analysis depends primarily on the number of available reference stations and associated data within a particular ecoregion. Therefore, the total number of reference sites selected and the aerial scale (i.e. Ecoregion Level III, Level IV) used to represent a reference condition will often vary on a case-by-case basis. The eco-reference nutrient concentrations are based upon the weighted average nutrient concentration calculated from the reference sites found in the watershed for station LFKJ-3, and are intended to be
Final Locust Fork and Village Creek TMDL Nutrients
19
representative of the wadeable segments of the Locust Fork. ADEM elected to use the 90th percentile of the data distributions from the selected eco-region reference sites for comparison to the recently collected ambient water quality data from Locust Fork. The 90th percentile of the total phosphorus (TP) and total nitrogen (TN) data distributions used in this analysis are 0.049 mg/l and 1.732 mg/l, respectively. Figures 3.3.1.1, 3.3.1.2, and 3.3.1.3 depict the nutrient results from the Department’s 2012 §303(d) sampling effort at eights stations along the Locust Fork. At each station, physical in-situ parameters in addition to water quality grab samples were collected once a month from April to November for a total of eight independent samples collected at each station.
3.3. Monitoring Results and Data Analysis According to the Nutrient Criteria Technical Guidance Manual for Rivers and Streams (USEPA, 2000b), chlorophyll-a, a photosynthetic pigment and sensitive indicator of algal biomass, is considered the most important biological response variable for nutrient-related impairment problems. Elevated chlorophyll-a concentrations are indicative of a high presence of algal growth, which in turn affects the dissolved oxygen balance through photosynthesis, respiration, and the regeneration of organic materials. Therefore, in addition to comparing the ambient water quality TP and TN concentrations to the eco-reference values mentioned above, the Department will also focus on ambient algal biomass as chlorophyll-a to determine if the instream chlorophyll concentrations are indicative of nutrient over-enrichment. In the upper reaches of the Locust Fork watershed, the stream morphology is generally characterized by a riffle run habitat type with a moderate gradient to promote free-flowing conditions year round. Furthermore, the waterbody is generally not very wide (<100 feet) and there exists a sufficient riparian buffer that helps to moderate extreme fluctuations in water temperature by controlling the availability of sunlight reaching the water surface. Considering that sunlight is a limiting factor in regards to algal production in a nutrient rich environment, both of these conditions play a very significant role in understanding the inverse relationship present between the instream nutrient concentrations vs. algal biomass levels measured as chlorophyll-a along the entire reach of the Locust Fork. For the stations in the upper reaches of the Locust Fork watershed, the limited availability of sunlight and moderate stream velocities are inhibiting the growth of phytoplankton. Although water quality data does suggest that nutrient-enrichment conditions exist in the upper segments of the Locust Fork, the nutrient uptake in the upper reaches of the Locust Fork is restricted because sunlight is the limiting factor in regards to algae production. However, progressing further downstream the mainstem of the Locust Fork, the cross-sectional width of the water body, available sunlight reaching the water surface, and retention time are all increasing. With nutrient over-enrichment conditions already present, these factors promote an increase in algal production along the lower reaches of the Locust Fork, consequently resulting in an increase in

Final Locust Fork and Village Creek TMDL Nutrients
20
the nutrient uptake rate through assimilation. The water quality data collected along the lower reaches of the Locust Fork illustrate this trend. Reduced concentrations of total phosphorus and total nitrogen are a result of increased algal production and nutrient uptake, illustrated by elevated chlorophyll-a concentrations. 3.3.1 Locust Fork 2012 Sampling Results - Nutrients The box and whisker plots below summarize the water quality data collected on the Locust Fork during 2012 for conventional nutrient parameters. The “whiskers” represent the minimum and maximum observations, while the “box” represents the interquartile range (where the top line of the box is the 3rd quartile, the bottom line is the 1st quartile, and the middle line is the median of the dataset). The black diamond is representative of the average calculated concentration for that given station. The eco-reference nutrient concentrations also provided in the graphs are based upon the weighted average nutrient concentration calculated from the reference sites found in the watershed for station LFKJ-3.
Figure 3.3.1.1 Locust Fork 2012 Sampling Results – Total Phosphorus (mg/L)
0.00
0.10
0.20
0.30
0.40
0.50
0.60
0.70
0.80
0.90
1.00
LFKB-15 LFKB-1 LFKB-2 LFKB-8 LFKJ-3 LFKJ-5 LFKJ-6 BANT-3 Eco-Ref
Tota
l Ph
osp
ho
rus
(mg/
L)

Final Locust Fork and Village Creek TMDL Nutrients
21
Figure 3.3.1.2 Locust Fork 2012 Sampling Results – Total Nitrogen (mg/L)
Figure 3.3.1.3 Locust Fork 2012 Sampling Results – Chlorophyll-a (µg/L)
0.0
1.0
2.0
3.0
4.0
5.0
6.0
7.0
LFKB-15 LFKB-1 LFKB-2 LFKB-8 LFKJ-3 LFKJ-5 LFKJ-6 BANT-3 Eco-Ref
Tota
l Nit
roge
n (
mg/
L)
0
5
10
15
20
25
30
35
40
45
50
LFKB-15 LFKB-1 LFKB-2 LFKB-8 LFKJ-3 LFKJ-5 LFKJ-6 BANT-3
Ch
loro
ph
yll-
a (u
g/L)

Final Locust Fork and Village Creek TMDL Nutrients
22
3.3.2 Locust Fork Reach – Macroinvertebrate Assessments During 2012, the Department conducted an intensive assessment of the macroinvertebrate community on the Locust Fork at five stations, involving the collection of macroinvertebrates for identification and enumeration in a laboratory. Depending upon the reach characteristics at the assessment station (average depth, cross sectional width, etc.), benthic macroinvertebrate communities were sampled using either the Department’s Nonwadeable Multi-habitat Bioassessment methodology (NWM-I) or the Intensive Multi-habitat Bioassessment methodology (WMB-1). Both bio-assessment methods measure the taxonomic richness, community composition, and community tolerance to assess the overall health of the macroinvertebrate community. Each score is based upon a comparison to least-impaired reference reaches characterized by similar drainage areas, gradient, and habitat.
Table 3.3.2.1 Locust Fork 2012 Macroinvertebrate Assessment Results
Station: LFKB-15 LFKB-1 LFKB-2 LFKB-8 LFKJ-3
Date: 5/2/2012 6/20/2012 6/20/2012 6/20/2012 6/20/2012
Method: WMB-1 NWM-I NWM-I NWM-I NWM-I
Score: 53 22 14 12 12
Rating:
Figure 3.3.2.1 Locust Fork 2012 Macroinvertebrate Assessment Results
53
0
10
20
30
40
50
60
70
80
90
100
LFKB-15
Locust Fork 2012 WMB-I Assessment Score
Rating
Good (70-85)
Fair (47-69)
Poor (23-46)
Very Poor (< 23)
Very Good
(86-100) 22
1412 12
0
5
10
15
20
25
30
LFKB-1 LFKB-2 LFKB-8 LFKJ-3
Locust Fork 2012 NWM-1 Assessment Score
RatingExcellent (> 27)
Fair (12-23)
Poor (<12)
Good (24-27)

Final Locust Fork and Village Creek TMDL Nutrients
23
The results of the macroinvertebrate assessments illustrated in the figures above indicated the overall state of the macroinvertebrate community at all five stations to be in a “fair” condition. However, the general trend based upon the assessment scores indicates the health of the macroinvertebrate communities is diminishing as you progress from the headwater station at LFKB-15 to further downstream. Based upon the assessments, the health of the macroinvertebrate communities in the downstream reaches of the Locust Fork near stations LFKB-8 and LFKJ-3 are considered to be in a borderline “fair” to “poor” condition. 3.3.3 Locust Fork Reach – Habitat Assessments Habitat assessments are typically conducted during the same station visit when macroinvertebrate assessments are performed. Reach characteristics and habitat conditions are evaluated based on several categories including instream habitat quality, sediment deposition, stream sinuosity, bank stability, and riparian buffer. The results are then compared to scores from reference reaches in the same or similar eco-regions in order to provide an overall indication of the quality and availability of habitat for aquatic life. Below are the results for the habitat assessments conducted for stations LFKB-15, LFKB-1, LFKB-2, LBFK-8, and LFKJ-3.
Table 3.3.3.1 Locust Fork 2012 Habitat Assessment Results
Station: LFKB-15 LFKB-1 LFKB-2 LFKB-8 LFKJ-3
Date: 5/2/2012 6/20/2012 6/20/2012 6/20/2012 6/20/2012
Habitat Assessment Score:
166 177 163 146 135
% Maximum Score : 69 74 68 61 56
Rating Sub-Optimal Optimal Sub-
Optimal Sub-
Optimal Marginal
Figure 3.3.3.1 Locust Fork 2012 Habitat Assessment Results
6974
6861
56
0
10
20
30
40
50
60
70
80
90
100
LFKB-15 LFKB-1 LFKB-2 LFKB-8 LFKJ-3
Pe
rce
nt
of
Max
imu
m S
core
Rating
Optimal (>70)
Sub Optimal (59-70)
Marginal (41-58)
Poor (<41)

Final Locust Fork and Village Creek TMDL Nutrients
24
Habitat assessment scores provide an indication of the overall quality and the availability of habitat for biological communities. Therefore, macroinvertebrate assessment scores need to be evaluated in conjunction with the habitat assessment scores for each particular station. The results of the habitat assessment scores indicate the quality of habitat along the Locust Fork is sufficient to support biological communities. Progressing downstream, the overall quality of habitat gradually decreases.
3.3.4 Village Creek 2005-2011 Sampling Results – Nutrients
The box and whisker plots below summarize the water quality data collected on the impaired segment of Village Creek at station VLGJ-5 during 2005-2012 for conventional nutrient parameters. The “whiskers” represent the minimum and maximum observations, while the “box” represents the interquartile range (where the top line of the box is the 3rd quartile, the bottom line is the 1st quartile, and the middle line is the median of the dataset). The black diamond is representative of the average calculated concentration for that given year. The eco-reference concentrations also provided in the graphs are based upon the weighted average concentration calculated from the reference sites found in the watershed for station VLGJ-5.
Figure 3.3.4.1 Village Creek: VLGJ-5 2005-2012 Sampling Results – Total Phosphorus (mg/L)
0.00
0.10
0.20
0.30
0.40
0.50
0.60
2005 2006 2007 2008 2012 Eco-Ref
Tota
l Ph
osp
ho
rus
(mg/
l)
n = 3 n = 3 n = 8 n = 3 n = 8

Final Locust Fork and Village Creek TMDL Nutrients
25
Figure 3.3.4.2 Village Creek: VLGJ-5 2005-2012 Sampling Results – Total Nitrogen (mg/L)
Figure 3.3.4.2 Village Creek: VLGJ-5 2005-2012 Sampling Results – Chlorophyll-a (µg/L)
0.0
1.0
2.0
3.0
4.0
5.0
6.0
7.0
8.0
2005 2006 2007 2008 2012 Eco-Ref
Tota
l Nit
roge
n (
mg/
l)
n = 3 n = 3 n = 8 n = 3 n = 8
0
10
20
30
40
50
60
70
80
2005 2006 2007 2008 2009 2010 2011 2012 Eco-ref
Ch
loro
ph
yll-
a (u
g/l)
n = 3 n = 3 n = 8 n = 3 n = 3 n = 3 n = 3 n = 8

Final Locust Fork and Village Creek TMDL Nutrients
26
The results from the Department’s monitoring efforts on Village Creek at station VLGJ-5 indicate the instream nutrient concentrations are elevated, especially compared to eco-reference conditions. Furthermore, elevated instream chlorophyll-a concentrations indicate the overabundant growth of algae in the water column, a symptom of eutrophication.
Chapter 4 Source Analysis
4.1 Overview of Sources in Watershed Pollution in a waterbody is generally understood to originate from two broad classes of sources: point sources and nonpoint sources. A critical step in the TMDL development process is identifying the two types of pollution sources in a watershed and determining how each source is contributing a pollutant load to adversely impact the waterbody. A point source can be defined as a discernible, confined, and discrete conveyance from which pollutants are or may be discharged to waters of the state. Examples of conveyance structures associated with point sources include pipes, ditches, channel, tunnels, etc. Publicly owned treatment works (POTWs) and industrial wastewater treatment facilities are common examples of point sources located in the Locust Fork watershed. The Department regulates point sources under the National Pollutant Discharge Elimination System (NPDES) Program. For the purposes of this TMDL, point source discharges will be differentiated between two types: continuous point source discharges (e.g. POTWs) and stormwater driven point source discharges. Stormwater driven point sources include the following types of point sources which typically exhibit intermittent discharges driven by rain events but are nevertheless subject to regulation under the NPDES program: Municipal Separate Storm Sewer Systems (MS4s), Mining Outfalls, Concentrated Animal Feeding Operations (CAFOs), and Construction Stormwater Outfalls. The Environmental Protection Agency (EPA) defines nonpoint source pollution as any source of water pollution that does not fall under the legal definition of “point source” and therefore is not regulated under the NPDES program. The primary distinction of nonpoint source pollution is that the pollution source cannot be defined as originating from any specific source or location. Rather, nonpoint source pollution originates from multiple sources over a larger area and is typically driven by rainwater runoff washing over land surfaces before depositing pollutants into the nearby receiving waterbody.
4.2 Point Source Assessment 4.2.1 Continuous Point Sources The Alabama Department of Environmental Management has issued NPDES permits to thirty three regulated continuous point source municipal and industrial facilities that discharge within the Locust Fork watershed. A complete list of the continuous NPDES point source discharges

Final Locust Fork and Village Creek TMDL Nutrients
27
found in the Locust Fork watershed are included in Table 4.2.1.1 and a map is provided in Figure 4.2.1.1 Table 4.2.1.1 NPDES Continuous Point Source Discharges in the Locust Fork Watershed
NPDES # Latitude Longitude Facility Type Receiving
Waterbody County
Design Flow (MGD)
AL0023647 33.5267 -86.8933 Jefferson County Village Creek WWTP – 11
Municipal Village Creek Jefferson 60
AL0023647 33.5339 -86.9061 Jefferson County Village Creek WWTP – 21
Municipal Village Creek Jefferson 60
AL0026913 33.5942 -86.8676 Jefferson County Fivemile Creek WWTP
Municipal Fivemile Creek Jefferson 30
AL0049603 34.206 -86.1908 Boaz Slab Creek WWTP Municipal Slab Creek UT Marshall 4.88
AL0003247 33.5853 -86.7908 ERP Compliant Coke LLC Industrial Fivemile Creek Jefferson 4.73
AL0022926 33.7133 -86.6997 Jefferson County Turkey Creek WWTP Municipal Turkey Creek Jefferson 5
AL0049549 33.9261 -86.5292 Oneonta WWTP Municipal Mill Creek Blount 2.2
AL0001449 34.0499 -86.577 Tyson Farms Blountsville Industrial Graves Creek Blount 1.339
AL0056120 33.6416 -86.9522 Jefferson County Prudes Creek WWTP Municipal Fivemile Creek Jefferson 0.9
AL0053121 33.7419 -86.8131 Morris Manor Apartments WWTP Municipal Turkey Creek Jefferson 0.5
AL0001554 33.5482 -86.7608 CMC Steel Alabama Industrial Village Creek UT Jefferson 0.380
AL0003417 33.5886 -86.7814 ABC Coke, Drummond Company Inc. Industrial Fivemile Creek Jefferson 0.404
AL0058572 34.1328 -86.413 Snead WWTP Municipal Locust Fork Blount 0.15
AL0073261 33.9741 -86.5752 Cleveland WWTP Municipal Dry Creek UT Blount 0.15
AL0050881 33.8081 -86.8319 Jefferson County Warrior WWTP Municipal Cane Creek Jefferson 0.10
AL0071170 33.8269 -86.6961 County Line Industrial Park WWTP Municipal Longs Branch Blount 0.099
AL0051055 33.6861 -86.8139 Peachtree Crossing Mobile Home Park Municipal Black Creek UT Jefferson 0.09
AL0076261 33.8349 -86.7838 West Blount Lagoon Municipal Hogeland Creek Jefferson 0.09
AL0021237 34.0379 -86.3318 Altoona Lagoon Municipal Locust Fork Etowah 0.07
AL0027642 33.6125 -86.8956 Forestdale MHP Municipal Fivemile Creek Jefferson 0.03
AL0050563 34.0887 -86.435 Susan Moore High School Municipal Locust Fork UT Blount 0.03
AL0056553 33.7518 -86.8174 The Cove Mobile Home Park Municipal Turkey Creek Jefferson 0.024
AL0054348 33.9208 -86.6328 Locust Fork High School Lagoon Municipal Blackburn Fork Blount 0.022
AL0062251 33.64 -86.9136 Brookside Village WWTP Municipal Newfound Creek Jefferson 0.022
AL0032301 33.7312 -86.6936 Dixie-Manor Housing Project Municipal Self Creek UT Jefferson 0.020
AL0071170 33.8269 -86.6961 County Line Industrial Park WWTP Municipal Longs Branch Blount 0.020
AL0051161 33.5958 -86.9333 Bottenfield Junior High School Municipal Prudes Creek UT Jefferson 0.017
AL0047546 33.8253 -86.8736 Bradford Parkside Health Services WWTP
Municipal Thomas Creek Jefferson 0.015
AL0054011 33.7448 -86.8175 River Bend Townhouses WWTP Municipal Turkey Creek Jefferson 0.015
AL0075256 33.7764 -86.805 North Jefferson Middle School WWTP Municipal Lick Creek Jefferson 0.012
AL0051195 33.7461 -86.6955 Johnson Elementary School Lagoon Municipal Self Creek UT Jefferson 0.01
AL0068675 33.8339 -86.5811 Southeastern Elementary School Municipal Campbell Creek Blount 0.005
AL0057827 33.6256 -86.91 Sharon Heights MHP Municipal Fivemile Creek Jefferson 0.003

Final Locust Fork and Village Creek TMDL Nutrients
28
Figure 4.2.1.1 NPDES Continuous Point Sources in the Locust Fork Watershed
A review of Department-collected water quality data reveals elevated levels of nutrients, specifically phosphorus, have been observed immediately downstream of point sources throughout the watershed. Along several reaches in the watershed, instream nutrient samples were collected on the same day both immediately upstream and downstream of significant point sources. The results from the samples collected downstream of those point sources reveal instream total phosphorus concentrations significantly elevated when compared to those samples collected upstream of the sources. The table below provides an example of measured instream total phosphorus concentrations collected on two days during 2012 at station VLGJ-4, located approximately 1.4 miles upstream of the Jefferson County Village Creek WWTP outfall 021, and also at station VI-3, located 1.7 miles downstream of the Jefferson County Village Creek WWTP outfall 021. Table 4.2.1.2 TP Data Upstream/Downstream of Jefferson County Village Creek WWTP - 021
Station Relative Location Sample Collection
Date/Time Total Phosphorus
(mg/l) Measured Streamflow
(cfs)
VLGJ-4 1.4 miles Upstream 5/23/12 11:05 AM 0.015 29.1
VI-3 1.7 miles Downstream 5/23/12 12:15 PM 0.59 62
VLGJ-4 1.4 miles Upstream 9/27/12 11:25 AM 0.018 25.1
VI-3 1.7 miles Downstream 9/27/12 12:00 PM 0.951 98

Final Locust Fork and Village Creek TMDL Nutrients
29
In summary, continuous point source discharges in the watershed are considered to be the greatest source of pollution contributing to the nutrient impairment on the Locust Fork and Village Creek. During low flow conditions, the major NPDES permitted dischargers to Village Creek, Fivemile Creek, and Slab Creek dominate the receiving waterbody by accounting for a significant percentage of the overall stream flow. For example, see the figure below depicting the measured daily mean stream flow at two USGS gages on Village Creek during the drought year of 2007. The USGS gages are separated by only 3.8 stream miles and a drainage area of 18.7 square miles. During 2007, the average measured streamflow difference between the USGS stream gages was approximately 36 cfs. The wide discrepancy between measured stream flows is attributable to the Jefferson County Village Creek WWTP (NPDES # AL0023647), which has two major outfalls located on Village Creek in between the USGS gages. Table 4.2.1.2 below illustrates that, during the drought year of 2007, the measured streamflow at USGS gage 02458600 downstream of the Jefferson County Village Creek WWTP was very heavily dominated by effluent, with the average percentage of effluent in the total stream flow ranging from 55% to 93% during the growing season months.
Figure 4.2.1.2 USGS Measured Daily Stream Flow on Village Creek during 2007
Table 4.2.1.3 2007 Village Creek Average Monthly Streamflow
2007 Average Monthly Flow (cfs)
April May June July August September October November
USGS 02458600 (downstream of AL0023647)
69.40 44.23 52.50 65.68 59.19 80.73 42.87 44.17
AL0023647 Outfalls 011a + 021a 43.63 40.54 37.76 41.00 38.31 44.72 39.32 38.06
Effluent % in streamflow 63% 92% 72% 62% 65% 55% 93% 86%
a. Monthly Average Effluent flowrate obtained from DMRs
1
10
100
1000
USG
S D
aily
Me
an F
low
(cf
s)
FLOW at 02458600 FLOW at 02458450

Final Locust Fork and Village Creek TMDL Nutrients
30
4.2.2 Municipal Separate Storm Sewer Systems (MS4) Urban areas designated as part of the Municipal Separate Storm Sewer System (MS4) program are regulated by NPDES, and as such, are considered to be point sources by EPA and receive Waste Load Allocations (WLAs) under these TMDLs. The EPA defines an MS4 as “ a conveyance or system of conveyances (including roads with drainage systems, municipal streets, catch basins, curbs, gutters, ditches, man-made channels, or storm drains): (i) Owned or operated by a State, city, town, borough, county, parish, district, association, or other public body (created by or pursuant to State law); (ii) Designed or used for collecting or conveying stormwater; (iii) Which is not a combined sewer; and (iv) Which is not part of a Publicly Owned Treatment Works (POTW) as defined at 40 CFR 122.2.” During rain events in an urbanized watershed, stormwater runoff has the potential to collect harmful pollutants which are transported through MS4 systems before discharging into state waters. Therefore, in 1990 the EPA developed the NPDES stormwater program which promulgated rules, in two different phases, in order to address the potential negative water quality effects associated with stormwater runoff. In 1990, the EPA issued Phase I regulations under the NPDES stormwater program which required both medium and large cities and also counties with populations of 100,000 or more to obtain NPDES permit coverage specifically for their stormwater discharges. In 1999, the second phase of the NPDES stormwater program amended existing regulations in addition to requiring NPDES permits for stormwater discharges from certain small MS4 systems. The MS4 NPDES regulated permittees that are addressed in the TMDL process include those Phase I and Phase II permittee municipalities covered under the MS4 NPDES program whose boundaries of urban areas as designated by ADEM are located within the Locust Fork watershed. The tables and figure below identify those specific permittees.
Table 4.2.2.1 NPDES Phase 1 Program Municipalities in the Locust Fork Watershed
Permittee Name NPDES Permit
Adamsville ALS000021
Birmingham ALS000032
Brookside ALS000024
Gardendale ALS000026
Irondale ALS000019
Jefferson County MS4 ALS000001
Pleasant Grove ALS000031
Tarrant ALS000020
Trussville ALS000015

Final Locust Fork and Village Creek TMDL Nutrients
31
Table 4.2.2.2 NPDES Phase 2 Program Municipalities in the Locust Fork Watershed
Permittee Name NPDES Permit
Graysville ALR040038
Fultondale ALR040037
Figure 4.2.2.1 Locust Fork Watershed - Phase 1 and 2 MS4 Boundary Areas
4.2.3 NPDES Permitted Mining Facilities
Mineral production, specifically coal mining, has historically been a significant industry in the Black Warrior watershed. The Department conducted a comprehensive water quality study (Assessment of Water Quality in Wadeable Streams near Surface Coal Mining Facilities in the Black Warrior River Basin in Alabama) from January 2011 to February 2013 in order to evaluate the effects of discharges from coal mining facilities on water quality and also aquatic macroinvertebrate communities in the wadeable streams of the Black Warrior basin. In regards to measured nutrient concentrations, the results of the study indicated the mean concentration

Final Locust Fork and Village Creek TMDL Nutrients
32
of total phosphorus in streams downstream of coal mining facilities was not significantly different (p>0.05) from the mean concentrations of total phosphorus measured at eco-regional reference stations (ADEM 2013). Furthermore, the Department has also required NPDES permitted coal mining facilities that discharge to the nutrient impaired segments of the Locust Fork to routinely monitor for nutrient related parameters in order to gain a better understanding of their potential pollutant load contribution to the waterbody. An analysis of the submitted monthly Discharge Monitoring Reports (DMRs) from those facilities reveals effluent total phosphorus loading to the receiving waterbody is usually quite minimal; typically measured concentrations of total phosphorus are below the method detection limit. The Department has concluded that both active and inactive coal mining facilities in the Locust Fork watershed are not contributing to the existing nutrient impairment based upon an assessment of the results from the coal mining study and also a review of the monitoring results from coal mining facilities in the Locust Fork watershed. Therefore, a WLA will not be established at this time for NPDES permitted mining facilities in the Locust Fork watershed. 4.2.4 Concentrated Animal Feeding Operations (CAFOs) Currently, there are several NPDES permitted CAFO facilities in the upper extent of the Locust Fork watershed. However, Departmental regulations for AFOs/CAFOs prohibit the discharge of pollutants from both the facility itself and also associated land application activities to nearby waters of the state. Under Departmental rules, all CAFOs are mandated to register with ADEM, and all AFO/CAFOs are required to implement and maintain effective best management practices (BMPs) for animal waste production, storage, treatment, transport, and proper disposal or land application that meet or exceed USDA - Natural Resources Conservation Service (NRCS) technical standards and guidelines. 4.2.5 NPDES Construction Stormwater General Permits Discharges from construction activities that result in a total land disturbance of one acre or greater (including sites less than one acre but that are part of a common plan of development or sale) are regulated through ADEM’s Stormwater Management Branch. Permitted discharges are required to adhere to erosion and sediment controls which reduce stormwater velocity and volume, minimize amount of soil exposed, minimize stream crossings, provide and maintain buffers around surface waters, etc. Furthermore, operators & owners of all regulated construction sites must implement and maintain effective erosion and sediment controls in accordance a Construction Best Management Practices Plan (CBMPP) prepared and certified by a Qualified Credentialed Professional (QCP). The Department believes that total phosphorus loads originating from construction stormwater sources are not a contributing factor to the existing nutrient impairment on the Locust Fork and

Final Locust Fork and Village Creek TMDL Nutrients
33
Village Creek. Therefore, a WLA will not be established at this time for NPDES permitted construction stormwater facilities located in the Locust Fork watershed.
4.3 Nonpoint Source Assessment Due to the size of the contributing drainage area of the Locust Fork, there are a wide variety of land use types found in the watershed. Figure 4.3.1 and Table 4.3.1 depict the 2011 National Land Cover Database (NLDC 2011) land cover results for the Locust Fork Watershed. The NLCD 2011 is based primarily on a decision-tree classification of circa 2011 Landsat satellite data. The predominant land use types in the Locust Fork watershed are primarily dependent upon the relative location in the watershed. In the mid to upper regions of the Locust Fork watershed, the predominant land use types are forested and agriculture. Compared to other land uses, potential sources of nutrient enrichment from forested land cover are generally considered to be minimal. Furthermore, forested land tends to serve as a natural filter of pollution originating from other sources within its drainage area. Agricultural practices in a watershed can account for a significant source of nonpoint source pollution to nearby rivers and streams. Nonpoint source pollution typically associated with agriculture land cover includes the following:
stormwater runoff from pastures and exposed soil
mismanaged animal feeding operations
improper land application of fertilizer including animal wastes
farm animals with direct access to waterbodies
In the south-eastern extent of the Locust Fork watershed found within Jefferson County, the predominant land use type is developed (i.e., urbanized areas). Urban development in a watershed can lead to a number of changes to the hydrological regime including dramatic increases to the peak discharge and also an increase in the frequency of floods. Furthermore, stormwater runoff over impervious surfaces found in urban areas, like for example sidewalks and asphalt parking lots, can collect a variety of pollutants which eventually end up deposited into nearby waterbodies. Additional sources of nonpoint source pollution from developed land use cover include, but are not limited to:
excessive nutrients and pesticides from lawns and greenspaces
runoff from improper disposal of waste materials
on-site septic systems failures
thermal pollution associated with impervious surfaces in the watershed.

Final Locust Fork and Village Creek TMDL Nutrients
34
Figure 4.3.1 Locust Fork Watershed 2011 NLCD
Table 4.3.1 Locust Fork Watershed 2011 NLCD
Land Use Description Acres Square Miles
Percent (%)
Cumulative Land Use
Acres Square Miles
Percent (%)
Open Water 7832 12.2 1.0% Developed 116562 182 15.1%
Developed, Open Space 64494 100.8 8.3% Forested 391172 611 50.5%
Developed, Low Intensity 33759 52.7 4.4% Agriculture 170458 266 22.0%
Developed, Medium Intensity 12987 20.3 1.7%
Grassland/Shrubs 81466 127 10.5%
Developed, High Intensity 5322 8.3 0.7% Barren Land 6815 11 0.9%
Barren Land 6815 10.6 0.9% Open Water 7832 12 1.0%
Deciduous Forest 239187 373.7 30.9%
Evergreen Forest 98390 153.7 12.7% Sum 774305 1210 100%
Mixed Forest 47985 75.0 6.2% Shrub/Scrub 45961 71.8 5.9% Herbaceuous 35505 55.5 4.6% Hay/Pasture 146097 228.3 18.9%
Cultivated Crops 24361 38.1 3.1% Woody Wetlands 5322 8.3 0.7%
Herbaceous Wetlands 288 0.4 0.0% Sum 774305 1210 100%

Final Locust Fork and Village Creek TMDL Nutrients
35
The figure below illustrates the percent impervious surfaces in the Locust Fork Watershed. The gradient ranges from a fully pervious surface, represented in the figure below by the black color, to a completely impervious surface, represented in the figure below by the dark purple. As expected, the impervious surfaces are found in the urbanized and developed areas of the watershed.
Figure 4.3.2 Locust Fork Water Impervious Cover Percentage (%)
In an effort to determine the degree to which nonpoint source pollution is contributing to the nutrient impairment on the Locust Fork, the Department has monitored water quality conditions upstream of continuous point source discharges on the Locust Fork in the upper reaches of the watershed that are characterized by rural and agriculture land use types. The resulting average instream total phosphorus concentrations are typically at or near eco-reference conditions (e.g., station LFKB-15 on Figure 3.3.1.1), indicating that, in general, the nutrient loading to the waterbody from these nonpoint sources in the watershed is minimal.
Chapter 5 Technical Approach for TMDL Development
5.1 Modeling Effort Overview The technical TMDL development process for the Locust Fork utilized a series of dynamic water quality models in order to accurately predict the necessary nutrient reductions in the watershed in order to meet the established numeric chlorophyll-a target in the Locust Fork embayment. The application of each model to develop the Locust Fork TMDL was used as follows:

Final Locust Fork and Village Creek TMDL Nutrients
36
The Loading Simulation Program in C++ model (LSPC version 4.1.0) was utilized to simulate both the hydrological and water quality conditions in the Locust Fork watershed. LSPC is a dynamic model driven by time-variable weather and point source discharge data. The flow and temperature output from the LSPC model was used as input for the EFDC model in the reservoir embayment segment of the Locust Fork. The water quality output from the LSPC model was used as input for the WASP model in the reservoir embayment segment of the Locust Fork.
The Environmental Fluid Dynamics Code (EFDC) program was used to simulate the hydrodynamic conditions (stage height, flow, temperature) of the Bankhead Reservoir and the non-wadeable segments of the Locust Fork.
The Water Quality Analysis Simulation Program (WASP7.52) was used to simulate the water quality conditions of the Bankhead reservoir and the non-wadeable segments of the Locust Fork.
Figure 5.1.1 Linkage between Dynamic Models
The three individual modeling programs (LSPC, EFDC, and WASP) were executed to dynamically simulate the period from January 1, 2007 to December 31, 2012. The year of 2006 was included in addition to the simulation period in order to allow for a sufficient “spin-up” time to assure that the model output was not being influenced by the initial conditions in the model. The simulation period of January 1, 2007 to December 31, 2012 was chosen for the following reasons:

Final Locust Fork and Village Creek TMDL Nutrients
37
The Department’s Rivers and Streams Monitoring Program (RSMP) basin rotation approach involved intensively sampling each major river basin every five years. The RSMP sampled the wadeable streams in the Black Warrior River basin watershed during 2007 and 2012. Therefore, the data utilized to calibrate the LSPC watershed model included yearly data sets from at least two independent years.
In 2007 and 2012, the Department monitored the Bankhead Reservoir as part of the Rivers and Reservoirs Monitoring Program (RRMP). Therefore, the data utilized to calibrate the WASP reservoir water quality model included yearly data sets from at least two independent years.
During the summer months of 2007, the US Drought Monitor declared the majority of the Black Warrior watershed to be under exceptional drought conditions. Drought conditions are characterized by extremely low natural stream flows which negatively impact water quality by reducing ambient stream flow velocity, increasing ambient water temperature, and reducing the amount of water available to dilute and assimilate pollutants from point source discharges in the watershed.
Figure 5.1.2 US Drought Monitor for Alabama – October 30, 2007
The graph below illustrates the daily streamflow recorded at USGS 02456500 Locust Fork at Sayre and also the measured daily precipitation from the Birmingham Airport. The graph demonstrates the effect of the 2007 drought on the measured stream flows in the

Final Locust Fork and Village Creek TMDL Nutrients
38
Locust Fork. During the modeled period of record, the minimum recorded Locust Fork flows occurred on August 25, 2007 (24 cfs).
Figure 5.1.3 Daily Discharge: USGS 02456500 Locust Fork at Sayre
5.2 LSPC Watershed Model The LSPC watershed model was used to simulate both the hydrodynamic conditions and the water quality loadings for all the waterbodies in the Locust Fork watershed. The LSPC watershed model was set up to simulate a series of hydraulically linked sub-watersheds. In each sub-watershed, the model simulates the assimilation of conservative and non-conservative constituents in the water column in addition to the overland surface water runoff loadings from the watershed. A total of ninety-nine individual sub-watersheds were simulated in the Locust Fork watershed. The LSPC output (including both hydrodynamic and water quality) from the sub-watershed adjacent to the Locust Fork mainstem in the Bankhead reservoir became the input boundary conditions for the EFDC hydrodynamic model and the WASP water quality model. 5.2.1 Point Source Assessment and Inputs A total of 33 individual NPDES permitted point source dischargers located in the Locust Fork watershed were included in the LSPC watershed model. Discharge monitoring reports (DMRs) submitted to the Department for the modeled simulation period of January 1, 2006 to December 31, 2012 were assessed in order to obtain the monthly effluent pollutant concentrations and discharge flowrates for the LSPC model input. The Department requires all municipal and
0
1
2
3
4
5
6
7
8
9
101
10
100
1000
10000
1/1/2007 1/1/2008 1/1/2009 1/1/2010 1/1/2011 1/1/2012 1/1/2013
Bir
min
gham
Air
po
rt D
aily
Pre
cip
itat
ion
(in
ches
)
USG
S 0
24
565
00 L
ocu
st F
ork
@ S
yare
Dis
char
ge
(cfs
)
Daily Discharge (cfs) Daily Precipitation (inches)

Final Locust Fork and Village Creek TMDL Nutrients
39
industrial point source discharges in the watershed to monitor and report effluent flowrate and concentrations of 5-day Carbonaceous Biochemical Oxygen Demand (CBOD5) and Ammonia Nitrogen (NH3-N). The Department also requires most of the permittees to monitor and report effluent concentrations of Dissolved Oxygen (DO), Total Phosphorus, Nitrate – Nitrite, and Total Kjeldahl Nitrogen during the growing season as well. Point source discharges that are classified as major facilities are required to monitor and report effluent concentrations on a year-round basis. Furthermore if monthly effluent concentrations were not available for a given parameter, an average of the available data set (i.e. quarterly monitoring results, permit application data, etc.) was used to represent most probable discharge concentrations for months during the study period.
5.2.2 Locust Fork Watershed Surface Water Withdrawal Sources Surface water withdrawal sources in the Locust Fork watershed were also included in the LSPC model. The input data for the LSPC model was characterized by the average daily water withdrawal flowrates reported to the Department during the simulation period of January 1, 2006 to December 31, 2012. The table below provides information regarding the two surface water withdrawal sources in the Locust Fork watershed:
Table 5.2.2.1 Locust Fork Watershed Surface Water Withdrawal Sources
Permit System Name Source Water
Average Daily
Withdrawal (MGD)
Plant Capacity
Withdrawal (MGD)
AL0000738 Birmingham Water Works and Sewer Board Inland Lake 41.75a 90
AL0000103 Oneonta Utilities Board Calvert Prong 1.58a 3
a. Average Daily Withdrawal rates from 1/1/2006 to 12/31/2012 Note: Table above includes only the surface water withdrawal sources in the LSPC model. The withdrawal sources on the Bankhead Reservoir are included in the EFDC model.
5.2.3 Meteorological Data Both watershed hydrology and water quality are significantly influenced by weather conditions. Therefore, accurate and comprehensive weather data is a critical component of the LSPC watershed model. The following Summary of Day (SOD) and Surface Airways (SA) meteorological data collected by the National Climate Data Center (NCDC) were included in the LSPC watershed model:
Precipitation • Air Temperature
Dew Point Temperature • Wind Speed
Cloud Cover • Evaporation
Solar Radiation

Final Locust Fork and Village Creek TMDL Nutrients
40
Hourly meteorological data was generated for each sub-watershed using a Theissan polygon approach. Thiessan polygons were developed using the weather stations located either within, or near, the Locust Fork watershed. Each Locust Fork sub-watershed was assigned to the weather station that had the greatest area covered by that particular station’s Thiessan polygon. The table below depicts the NCDC SOD and SA weather station pairings utilized in the Locust Fork LSPC watershed model. Refer to Figure 5.2.5.1 for an illustration of the weather stations.
Table 5.2.3.1 LSPC Model Weather Stations SOD ID Station Name County Elevation (feet) SA WBAN ID Name 010764 Bessemer (Alabama) 3 WSW Jefferson 445 13876 Birmingham Intl Airport
010831 Birmingham Intl Airport Jefferson 615 13876 Birmingham Intl Airport
010957 Boaz, Alabama Marshall 1070 13876 Birmingham Intl Airport
013655 Hanceville, Alabama Cullman 530 13876 Birmingham Intl Airport
016121 Oneonta, Alabama Blount 892 13876 Birmingham Intl Airport
016246 Palmerdale, Alabama Jefferson 720 13876 Birmingham Intl Airport
016478 Pinson, Alabama Jefferson 608 13876 Birmingham Intl Airport
018648 Walnut Grove, Alabama Etowah 850 13876 Birmingham Intl Airport
5.2.4 Hydrology Calibration The LSPC watershed model was used to predict in-stream tributary flows in the Locust Fork watershed. The output from the LSPC model consisted of sub-watershed flows and concentrations. Calibration of the model was accomplished by comparing the LSPC simulated daily flow output to measured daily flow data at four USGS realtime stream flow stations in the Locust Fork watershed during the calibration period of January 1, 2007 through December 31, 2012. The table below lists the USGS stations in the Locust Fork watershed used to calibrate hydrology. An example of the results from the hydrology model calibration have been provided on the following page.
Table 5.2.4.1 LSPC Watershed Hydrology Calibration Stations Agency Site Number Site Name
USGS 2455000 LOCUST FORK NEAR CLEVELAND, AL.
USGS 2456500 LOCUST FORK AT SAYRE, AL.
USGS 2457000 FIVEMILE CREEK AT KETONA AL
USGS 2458600 VILLAGE CREEK NEAR DOCENA, ALABAMA

Final Locust Fork and Village Creek TMDL Nutrients
41
Figure 5.2.4.1 Example of Hydrology Calibration - USGS 02455000 Observed vs. Modeled Flow
0
1
2
3
4
5
6
7
8
9
101
10
100
1000
10000
100000
Dai
ly R
ain
fall
(in
.)
Flo
w (
cfs)
Avg Daily Rainfall (in.) Avg Observed Flow (1/1/2006 to 12/31/2012 ) Avg Modeled Flow (Same Period)
y = 0.8141x + 80.981R² = 0.8203
0
500
1000
1500
2000
0 500 1000 1500 2000
Avera
ge M
onth
ly M
odele
d F
low
(cfs
) 2006-2
012
Average Monthly Observed Flow (cfs) 2006-2012
Avg Flow (1/1/2006 to 12/31/2012 )Line of Equal ValueBest-Fit Line
0%
10%
20%
30%
40%
50%
60%
70%
80%
90%
100%
J-06 J-07 J-08 J-09 J-10 J-11 J-12
Wate
r B
ala
nce (
Obs +
Mod)
Month
Avg Observed Flow (1/1/2006 to 12/31/2012 )
Avg Modeled Flow (1/1/2006 to 12/31/2012 )
Line of Equal Value
0
2
4
6
8
10
12
14
0
500
1000
1500
2000
Jan-06 Jan-07 Jan-08 Jan-09 Jan-10 Jan-11 Jan-12
Month
ly R
ain
fall
(in
.)
Flo
w (
cfs
)
Avg Monthly Rainfall (in.) Avg Observed Flow (1/1/2006 to 12/31/2012 ) Avg Modeled Flow (Same Period)
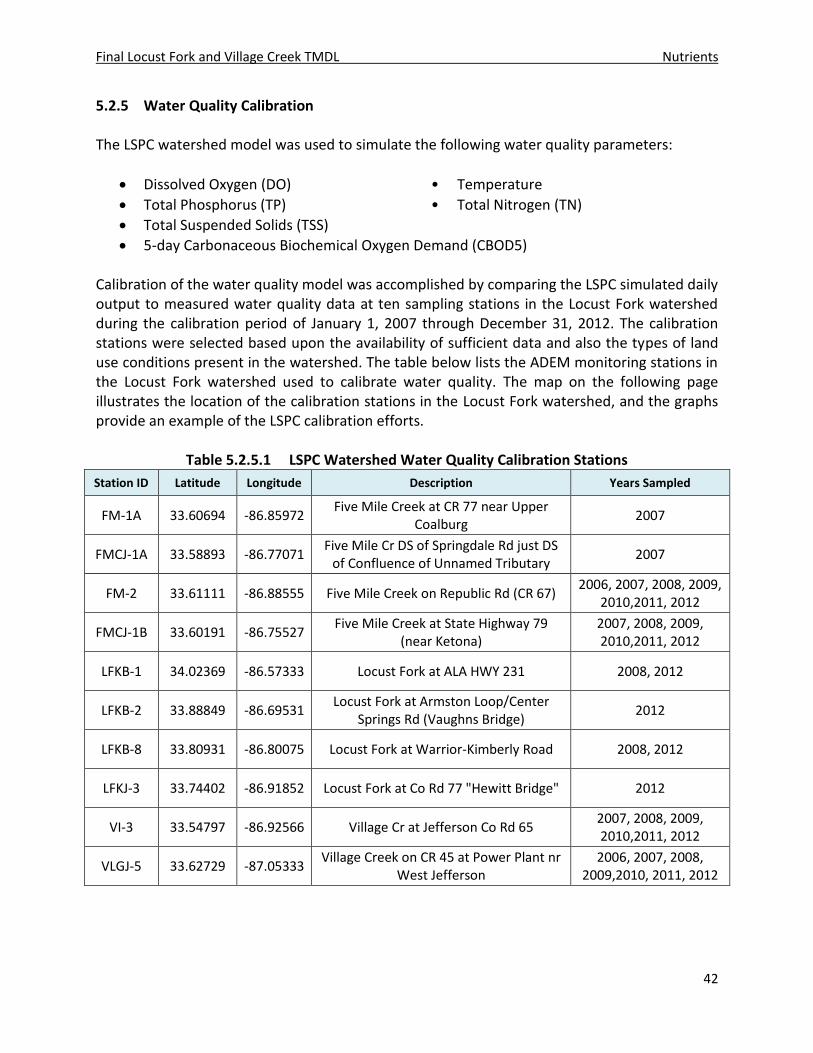
Final Locust Fork and Village Creek TMDL Nutrients
42
5.2.5 Water Quality Calibration The LSPC watershed model was used to simulate the following water quality parameters:
Dissolved Oxygen (DO) • Temperature
Total Phosphorus (TP) • Total Nitrogen (TN)
Total Suspended Solids (TSS)
5-day Carbonaceous Biochemical Oxygen Demand (CBOD5) Calibration of the water quality model was accomplished by comparing the LSPC simulated daily output to measured water quality data at ten sampling stations in the Locust Fork watershed during the calibration period of January 1, 2007 through December 31, 2012. The calibration stations were selected based upon the availability of sufficient data and also the types of land use conditions present in the watershed. The table below lists the ADEM monitoring stations in the Locust Fork watershed used to calibrate water quality. The map on the following page illustrates the location of the calibration stations in the Locust Fork watershed, and the graphs provide an example of the LSPC calibration efforts.
Table 5.2.5.1 LSPC Watershed Water Quality Calibration Stations
Station ID Latitude Longitude Description Years Sampled
FM-1A 33.60694 -86.85972 Five Mile Creek at CR 77 near Upper
Coalburg 2007
FMCJ-1A 33.58893 -86.77071 Five Mile Cr DS of Springdale Rd just DS
of Confluence of Unnamed Tributary 2007
FM-2 33.61111 -86.88555 Five Mile Creek on Republic Rd (CR 67) 2006, 2007, 2008, 2009,
2010,2011, 2012
FMCJ-1B 33.60191 -86.75527 Five Mile Creek at State Highway 79
(near Ketona) 2007, 2008, 2009, 2010,2011, 2012
LFKB-1 34.02369 -86.57333 Locust Fork at ALA HWY 231 2008, 2012
LFKB-2 33.88849 -86.69531 Locust Fork at Armston Loop/Center
Springs Rd (Vaughns Bridge) 2012
LFKB-8 33.80931 -86.80075 Locust Fork at Warrior-Kimberly Road 2008, 2012
LFKJ-3 33.74402 -86.91852 Locust Fork at Co Rd 77 "Hewitt Bridge" 2012
VI-3 33.54797 -86.92566 Village Cr at Jefferson Co Rd 65 2007, 2008, 2009, 2010,2011, 2012
VLGJ-5 33.62729 -87.05333 Village Creek on CR 45 at Power Plant nr
West Jefferson 2006, 2007, 2008,
2009,2010, 2011, 2012

Final Locust Fork and Village Creek TMDL Nutrients
43
Figure 5.2.5.1 LSPC Locust Fork Watershed Calibration Stations
Figure 5.2.5.2 LSPC Calibration – Modeled vs. Observed Temperature (C) at FM-2
0
1
2
3
4
5
6
7
8
90
5
10
15
20
25
30
35
Jan2007
Jul2007
Jan2008
Jul2008
Jan2009
Jul2009
Jan2010
Jul2010
Jan2011
Jul2011
Jan2012
Jul2012
Pre
cip
itat
ion
(in
/day
)
Wat
er
Tem
per
atu
re (
°C)
Modeled (Reach 504) Observed (FM-2) Precipitation

Final Locust Fork and Village Creek TMDL Nutrients
44
Figure 5.2.5.3 LSPC Calibration – Modeled vs Observed Total Nitrogen (mg/l) at FM-2
Figure 5.2.5.4 LSPC Calibration – Modeled vs. Observed Total Phosphorus (mg/l) at FM-2
0
1
2
3
4
5
6
7
8
90
2
4
6
8
10
12
Jan2007
Jul2007
Jan2008
Jul2008
Jan2009
Jul2009
Jan2010
Jul2010
Jan2011
Jul2011
Jan2012
Jul2012
Pre
cip
itat
ion
(in
/day
)
Tota
l Nit
roge
n (
mg/
L)
Modeled (Reach 504) Observed (FM-2) Precipitation
0
1
2
3
4
5
6
7
8
90
0.1
0.2
0.3
0.4
0.5
0.6
0.7
0.8
0.9
1
Jan2007
Jul2007
Jan2008
Jul2008
Jan2009
Jul2009
Jan2010
Jul2010
Jan2011
Jul2011
Jan2012
Jul2012
Pre
cip
itat
ion
(in
/day
)
Tota
l Ph
osp
ho
rus
(mg/
L)
Modeled (Reach 504) Observed (FM-2) Precipitation

Final Locust Fork and Village Creek TMDL Nutrients
45
5.3 Environmental Fluid Dynamics Code (EFDC) Model The EFDC model was used to simulate the hydrodynamic conditions in the Bankhead reservoir and also the non-wadeable tributary embayment segments of the Locust Fork and the Mulberry Fork. The LSPC model output was linked and utilized as input boundary conditions for the EFDC model by providing daily flows and temperatures for both the tributaries boundaries and the adjacent sub-watersheds to Bankhead reservoir and the non-wadeable segments of the Locust Fork and Mulberry Fork. The EFDC model output was linked and used as input for the WASP model. The EFDC modeled area is characterized by a series of connected computational grid cells that define the geometry of the simulated extent. The intention of the computational grid cell is to accurately depict the ambient geometry of the waterbody at that specific location, including the width, length, and depth. Bathymetry data provided by the U.S. Army Corps of Engineers (USACE) was utilized when generating the grid cells. The Bankhead reservoir EFDC computational grid area consists of a total of 3636 grid cells: 606 horizontal grid cells and 6 vertical layers. See the figures below for an illustration of the EFDC computational cells used to simulate the Bankhead Reservoir and the non-wadeable segments of the Locust Fork.
Figure 5.3.1 EFDC Computation Grid Extent on Bankhead Reservoir

Final Locust Fork and Village Creek TMDL Nutrients
46
Figure 5.3.2 EFDC Computation Grid Extent on Locust Fork Tributary Embayment
Surface water withdrawal sources in the Bankhead Reservoir were also included in the EFDC model. The table below provides information regarding the six surface water withdrawal sources in the Bankhead Reservoir:
Table 5.3.1 Bankhead Reservoir Surface Water Withdrawal Sources
Permit System Name Source Water Average Withdrawal
(MGD)
Plant Capacity Withdrawal
(MGD)
AL0000738 Birmingham Water Works
and Sewer Board Mulberry Fork 26.41a 60
AL0001782 Bessemer (G.U.S.C.) Black Warrior
River 10.17a 18
AL0000763 Warrior River Water
Authority Mulberry Fork
3.04a 6
AL0001336 Jasper Utilities Board Mulberry Fork 10.49a 18
AL0002909 Alabama Power Company
– Gorgas Steam Plant Mulberry Fork 837.71b,c 946.44
AL0027146 Alabama Power Company
– Miller Steam Plant Mulberry Fork 30.02b,d 43.2
a - daily b - monthly

Final Locust Fork and Village Creek TMDL Nutrients
47
c. Withdrawal water utilized for once-through cooling and returned back to the river. In EFDC model, all withdrawal water is discharged back to the Black Warrior River in the immediate downstream cell. d. Withdrawal water pumped from the Mulberry Fork is stored in a holding pond. From the holding pond, makeup and service water is gravity fed to the plant located on the Locust Fork as needed.
5.3.1 EFDC Model Calibration The output for the EFDC model consists of water surface elevations, temperatures, volumes and velocities. Hydrodynamic calibration of the EFDC model was accomplished by comparing the model predicted stage height and temperature profiles to actual measured data during the calibration period of January 1, 2007 through December 31, 2012. The figures below provide an example of the calibrations results. Figure 5.3.1.1. Comparison of water surface elevation between USGS 02462500 vs. modeled

Final Locust Fork and Village Creek TMDL Nutrients
48
Figure 5.3.1.2 Comparison of station BANT-2 water temperature vs modeled temperature
5.4 Water Quality Analysis Simulation Program (WASP) Model WASP 7.52 is a dynamic water quality model that was used to simulate water quality in the Bankhead Reservoir and the non-wadeable segments of the Locust Fork. The WASP eutrophication model was used to simulate the following state variables in the Bankhead Reservoir and the non-wadeable segment of the Locust Fork:
Ammonia (mg/l) • Nitrate-Nitrite (mg/l)
Organic Nitrogen (mg/l) • Orthophosphate (mg/l)
Organic Phosphorus (mg/l) • Chlorophyll-a (µg/l)
Dissolved Oxygen (mg/l) • Biochemical Oxygen Demand (mg/l)
Total Suspended Solids (mg/l) • Temperature (˚C) The WASP model is directly coupled to the hydrodynamic loading output from both the LSPC and EFDC models. The pollutant concentrations from the LSPC model output are directly linked to the WASP model as boundary conditions, providing the pollutant concentrations from the tributaries

Final Locust Fork and Village Creek TMDL Nutrients
49
and the sub-watersheds that connect directly to the EFDC computational grid extent. The output from the EFDC model was also linked to WASP in order to provide the hydrodynamic data (temperature, volume, and velocities). The figure below illustrates the linkage between the output from the LSPC sub-watersheds and the EFDC computational grid cells utilized by the WASP model. The LSPC “RO” sub-watersheds shown in blue represent the modeled instream flow from the major tributaries in the watershed flowing directly to the Bankhead Reservoir, simulated by the EFDC computational grid. The LSPC “PERO” sub-watersheds shown in green represent the modeled overland flow from the local watersheds immediately adjacent to the computational grid. A total of fourteen major tributaries in the Bankhead Lake watershed were simulated using the LSPC model on a daily time step and linked directly to the EFDC (flows and temperature) and WASP (pollutant concentrations) models.
Figure 5.4.1 WASP Model Boundary Inputs
5.4.1 WASP Model Calibration The WASP model was calibrated by comparing the model predicted state variables described on the previous page to actual measured instream water quality data collected by the Department

Final Locust Fork and Village Creek TMDL Nutrients
50
during the calibration period of January 1, 2007 through December 31, 2012. Calibration of the WASP model was accomplished by adjusting the state variable rates (growth, decay, mineralization, nitrification, etc.) until the predicted concentrations closely matched those of measured values. Successful calibration of the WASP model was considered to be achieved when the model was accurately simulating the fate and transport of nutrients within the reservoir in addition to the uptake by phytoplankton. The output variable chlorophyll-a is utilized by WASP as a surrogate parameter to represent the aggregate measure of phytoplankton biomass within the model. The table below lists the Department’s Rivers & Reservoir Monitoring Program (RRMP) stations in the Bankhead reservoir that were utilized in calibration of the WASP model. Specifically, model calibration at stations BANT-1, BANT-2, BANT-3, and BANT-4 was heavily weighted due to their locations within the reservoir and also the availability of data. Refer to Figure 5.3.1 for an illustration of the stations in the Bankhead Reservoir.
Table 5.4.1.1 WASP Water Quality Calibration Stations Station ID Latitude Longitude Station Description
BANT-1 33.46637 -87.34811 Bankhead Lake – Lower reservoir. Deepest point, main river
channel, dam forebay.
BANT-2 33.50949 -87.26372 Bankhead Lake – Mid-reservoir. Deepest point, main river
channel, mid-reservoir. Approximately 0.5 miles upstream of Little Shoal Creek confluence.
BANT-3 33.54480 -87.17498 Bankhead Lake – Locust Fork. Deepest point, main river channel,
Locust Fork. Approximately 1.5 miles upstream of Mulberry, Locust confluence.
BANT-4 33.57322 -87.20552 Bankhead Lake – Mulberry Fork. Deepest point, main river
channel, Mulberry Fork. Approximately 1.5 miles upstream of Mulberry, Locust confluence.
BANT-5 33.63799 -87.24702 Lost Creek embayment deepest point, main creek channel.
Approximately 0.5 miles downstream of Walker Co. Rd. 53 bridge.
BANT-6 33.52312 -87.22987 Valley Creek embayment deepest point, main creek channel.
Approximately 1.0 miles upstream of confluence with Warrior River.
BANT-7 33.48760 -87.34430 Big Yellow Creek embayment, approximately 1 mile upstream of
confluence with Warrior River.
BANT-8 33.62280 -87.07060 Village Creek embayment approximately 0.5 miles upstream of
confluence with Warrior River.
LFKJ-5 33.63653 -87.06124 Locust Fork at Co. Rd 45 Porter Road.
LFKJ-6 33.58726 -87.10933 Locust Fork at Co. Rd 269 Attwood Ferry Bridge.
MBFW-2 33.81711 -87.12932 Mulberry Fork deepest point of the main river channel
approximately 1 mile north of Hwy 78 bridge
MBFW-3 33.82755 -87.05238 Mulberry Fork, approximately 1 mile or so upstream of the
confluence with the Sipsey Fork. Most importantly, just upstream enough to avoid any influence from the Sipsey Fork.
SF-5 33.82698 -87.06931 Sipsey Fork, approximately 1 mile upstream of the confluence
with the Mulberry Fork.

Final Locust Fork and Village Creek TMDL Nutrients
51
Figure 5.4.1.1 WASP Calibration Example

Final Locust Fork and Village Creek TMDL Nutrients
52
Chapter 6.0 TMDL Development for the Locust Fork Watershed
6.1 Applicable Water Quality Criterion The results of the Department’s monitoring efforts in the Locust Fork watershed indicate elevated concentrations of nutrients along the wadeable mainstem reaches of the Locust Fork. Furthermore, elevated concentrations of nutrients have also been observed on several of the major tributaries to the Locust Fork, specifically Village Creek and Fivemile Creek. Nutrients such as phosphorus and nitrogen are essential elements to aquatic life, but can be undesirable when present at sufficient concentrations to stimulate excessive plant growth. Even though these pollutants are generally considered to be nontoxic (the exception being un-ionized ammonia toxicity to aquatic life), they can impact aquatic life due to their indirect effects on water quality, either when in overabundance or when availability is limited. ADEM’s water quality criteria applying to nutrients are narrative; therefore a numerical translator is needed to define the TMDL target. Lakes are complex systems influenced by morphometry, climate, and watershed characteristics. The assignment of specific numeric nutrient criteria to address both causal and response variables associated with nutrient over-enrichment that will be considered protective of the designated uses of the waterbody is a challenging task. According to ADEM’s Nutrient Criteria Implementation Plan (ADEM, 2011), chlorophyll-a (response indicator) has been chosen as the primary variable for addressing cultural eutrophication and will be used as the primary tool for protecting designated uses of lakes and reservoirs from nutrient over-enrichment. Chlorophyll-a was chosen as the candidate variable because of its wide acceptance among federal/state agencies, limnologists and scientists as being a good surrogate for estimating phytoplankton biomass and because it provides the most direct indication of how nutrients are impacting a lake’s designated uses. Chlorophyll-a is also considered a good early indicator of nutrient enrichment and is relatively easy and inexpensive to collect and analyze. Currently, the Department has already established a chlorophyll-a criterion in the Bankhead Lake forebay. ADEM’s Administrative Code 335-6-10-.11 reads as follows: 335-6-10-.11 Water Quality Criteria Applicable to Specific Lakes. Bankhead Lake: those waters impounded by John Hollis Bankhead Lock and Dam on the Black Warrior River. The lake has a surface area of 9,200 acres at full pool. (i) Chlorophyll-a (corrected, as described in Standard Methods for the Examination of Water and Wastewater, 20th Edition, 1998): the mean of the photic-zone composite chlorophyll-a samples collected monthly April through October shall not exceed 16 μg/l, as measured at the deepest point, main river channel, dam forebay.
The aforementioned chlorophyll-a criterion is applicable at station BANT-1 and is expected to be protective of the Bankhead Lake forebay area and also a significant portion of the mainstem reservoir upstream of the dam. However, Bankhead Lake is a very non-uniform, complex system.

Final Locust Fork and Village Creek TMDL Nutrients
53
Bankhead Lake is not considered a “run-of-the-river” reservoir. The primary source of water “feeding” the lake system originates from numerous tributaries in the watershed. The impounded waters of Bankhead Lake encompass the following three significant tributaries, or “forks”: Sipsey Fork, Mulberry Fork, and Locust Fork. Each tributary “fork” drains a very large watershed area and the cumulative flow from the three forks to the Bankhead reservoir system constitutes the majority of the water flowing into the reservoir. In order to address such a complex system, the Department has continued tributary embayment sampling as a part of the Rivers & Reservoir Monitoring Program (RRMP). The figure below illustrates the three major “forks” of Bankhead Lake and also depicts the Locust Fork reservoir embayment stations.
Figure 6.1.1 Bankhead Lake and major tributaries

Final Locust Fork and Village Creek TMDL Nutrients
54
As previously mentioned in the Data Analysis section, the negative effects associated with the elevated concentrations of nutrients observed in the wadeable segments of the Locust Fork, and several major tributaries to the Locust Fork, are being expressed further downstream in the tributary embayment segment. In the non-wadeable tributary embayment segment of the Locust Fork, favorable conditions for the uptake of available nutrients in the water column, such as longer retention times and more available sunlight reaching the water surface leading to increased water temperatures, are greatly improved compared to conditions in the wadeable segments. Based on sampling conducted as a part of the Department’s RRMP, water quality data obtained at the Locust Fork embayment stations LFKJ-6 and BANT-3 indicate nutrient over-enrichment conditions are present in the tributary embayment of the Locust Fork. Evidence of the nutrient over-enrichment conditions observed in the Locust Fork embayment are described below as an excerpt from the Department’s 2012 §303(d) fact sheet, which served as the basis for this segment’s inclusion on the §303(d) list: “Records at ADEM Station LFKJ-6 from 2005- 2011 show dissolved oxygen concentrations ranging from 4.6 mg/L to 18.8 mg/L. The median pH value during this period of record was 7.9 s.u. and the maximum value was 9.3 s.u. These enriched conditions are most likely caused by high Nitrogen and/or Phosphorus concentrations. During this time period the median Total Nitrogen concentration was 3.06 mg/L with a maximum concentration of 17.38 mg/L. The median Total Phosphorus concentration was 0.07 mg/L with a maximum value of 0.17 mg/L. In addition, a maximum chlorophyll-a value of 98.70 µg/L was recorded. Chlorophyll-a values as high as 48.59 µg/L were measured at a downstream station, BANT-3 as well.” Since the negative effects associated with nutrient over-enrichment are being observed in the tributary embayment and not in the wadeable segments of the Locust Fork, the Department has decided to establish a target for water quality improvement in the tributary embayment. Therefore, for the basis of this TMDL, the Department will identify a target growing season mean chlorophyll-a concentration in the Locust Fork tributary embayment. The chlorophyll-a target is interpreted to be the mean chlorophyll-a concentration of the photic zone composite samples collected monthly from April through October. As previously mentioned, anthropogenic sources in the Locust Fork watershed are considered the origin of the excessive nutrients that are externally introduced into the Locust Fork aquatic eco-system. In order to address those sources in the watershed, hydrodynamic water quality models were utilized to better understand the link between nutrients, the sources, their effects on algal productivity, and which nutrient (nitrogen and/or phosphorus) will be the most effective to control in order to achieve the selected chlorophyll-a target and protection of downstream uses. The models will be used to evaluate the extent of necessary nutrient reductions from the sources in the watershed to achieve the targeted chlorophyll-a concentration.

Final Locust Fork and Village Creek TMDL Nutrients
55
6.1.1 Chlorophyll-a Target Development Selection of an appropriate numeric chlorophyll-a target in the Locust Fork tributary embayment was based upon careful consideration of the following factors: available Department- collected water quality data, existing designated uses, and downstream use protection.
Available Data
o As a part of the RRMP, the Department has routinely collected water quality data on the Bankhead reservoir mainstem and also on the major tributary embayments to Bankhead Lake. The Department has accumulated an extensive catalog of historical water quality data from healthy tributary embayments on Bankhead Lake. Table 6.1.1.1 below depicts the evaluation of the available chlorophyll-a dataset from Bankhead Lake tributary embayment stations BANT-5 in Lost Creek and BANT-7 in Big Yellow Creek in order to provide additional insight into the expected range of chlorophyll-a concentrations from waterbodies that are meeting their existing designated uses in regards to nutrient enrichment. Refer to Figure 6.1.1 for a map depicting the relative locations of the stations within the reservoir.
Table 6.1.1.1 Bankhead Tributary Embayment Chlorophyll-a data
BANT-5 Lost Creek Embayment BANT-7 Big Yellow Creek Embayment
Year Samples per year
Growing Season Average Chlorophyll-a (µg/l)
Year Samples per year
Growing Season Average Chlorophyll-a (µg/l)
1998 7 9.5 1998 N/A
2002 7 13.7 2002 7 12.8
2007 7 14.7 2007 7 16.6
2012 7 7.9 2012 7 11.7
Average 11.4 Average 13.7
75th %ile 14.0 75th %ile 14.7
90th %ile 14.4 90th %ile 15.9
Designated Uses
o The existing designated uses for the impaired reach of the Locust Fork tributary embayment segment include Public Water Supply (PWS), Swimming (S), and Fish & Wildlife (F&W). Therefore, when considering an appropriate chlorophyll-a target in conjunction with the existing Public Water Supply use classification, it is important to consider the adverse effects associated with excessive algae growth that can potentially contaminate source water.

Final Locust Fork and Village Creek TMDL Nutrients
56
o Similarly, when considering an appropriate chlorophyll-a target in conjunction with the existing Swimming use classification, those water conditions associated with swimming and other whole body contact water sports, like water clarity for instance, must also be considered.
o To determine what constitutes healthy conditions in various types of reservoirs and how trophic gradients relate to the Fish and Wildlife use attainment, the Department utilized research conducted by Dr. David Bayne at Auburn University. This research examines how the quality of fisheries correlates to varying trophic conditions in Alabama reservoirs. The results of Dr. Bayne’s research indicated a growing season average chlorophyll-a criteria of 20 μg/l should be considered as the upper end of a range that is protective of a balanced sport fishery (Maceina, M.J. et al).
Protection of Existing Standards & Downstream Uses
o In determination of an appropriate chlorophyll-a target, consideration must also be given to the existing water quality standards of the downstream waterbodies to ensure that those standards are both attained and also maintained. The Department concluded the applicable chlorophyll-a target in the Locust Fork tributary embayment should not be more stringent than the existing growing season average chlorophyll-a criteria of 16 µg/l as measured at station BANT-1 in the Bankhead lake forebay.
A review of WASP modeling output and Department-collected water quality data was completed in order to select an appropriate location, or compliance point, for the chlorophyll-a target. The graph below illustrates the measured growing season average chlorophyll-a concentrations from three of the Department’s existing Locust Fork tributary embayment stations collected during sample years 2002, 2007, and 2012. Based upon an assessment of the historical datasets, the highest measured growing season average chlorophyll-a concentrations are usually observed in the Locust Fork embayment at station BANT-3.

Final Locust Fork and Village Creek TMDL Nutrients
57
Figure 6.1.1.1 Locust Fork Embayment Chlorophyll-a data
The figure below depicts a longitudinal profile of the predicted growing season chlorophyll-a concentrations from the WASP permit condition modeling scenario for each year in the model simulation period. The vertical bars denote where the Department’s existing stations are located in relation to river miles upstream of the Locust Fork mouth. Based upon an assessment of the WASP output data, the greatest chlorophyll-a concentrations are predicted to occur in the downstream segments of the Locust Fork, approximately 3-4 miles upstream of the confluence with the Mulberry Fork. Predicted growing season chlorophyll-a concentrations steadily decrease progressing further upstream on the Locust Fork. Therefore, if the chlorophyll-a target is set at station BANT-3, the upstream chlorophyll-a concentrations are not expected to exceed the target concentration.
BANT-3 LFKJ-6 LFKJ-5
2002 Average 30.83 11.14 15.53
2007 Average 27.24 21.63 28.38
2012 Average 15.12 10.80 4.5
0
5
10
15
20
25
30
35
Ch
la (
ug/
l) -
Gro
win
g Se
aso
n A
vera
ge

Final Locust Fork and Village Creek TMDL Nutrients
58
Figure 6.1.1.2 WASP Permit Condition Chlorophyll-a – Longitudinal Profile
The Department has concluded a growing season average (April – October) chlorophyll-a target of 18 µg/L will be established in the Locust Fork tributary embayment at station BANT-3. The Department believes the chlorophyll-a target of 18 µg/L applicable at the existing tributary embayment station BANT-3 will support the designated uses of the Locust Fork.
6.2 Limiting Nutrient Identification
In order to meet the instream chlorophyll-a target of 18 µg/L, the Department utilized the trio of linked water quality models to simulate how the chlorophyll-a concentrations in the Locust Fork embayment at station BANT-3 respond to nutrient reductions to both point sources and nonpoint sources in the watershed. The first step in this process was to identify the limiting nutrient in the system which would ultimately serve as the specific nutrient that is targeted for reduction. The limiting nutrient in an aquatic eco-system is considered to be the nutrient that is essential for plant growth but is available only in low enough concentrations to be “limiting” or preventing further growth of the species. Available EPA guidance indicates that in a freshwater system phosphorus is usually the key nutrient in regards to limiting productivity and controlling excessive algae growth (USEPA 2000). Furthermore, two additional lines of evidence, discussed below, were utilized in order to for the Department to identify phosphorus as the limiting nutrient in the Locust Fork tributary embayment to the Bankhead Reservoir. Therefore, the Department anticipates that a reduction to total phosphorus from sources in the watershed, without concurrent reductions to total nitrogen, will result in the attainment of the chlorophyll-a target of 18 µg/l.
0
10
20
30
40
50
60
70
0 5 10 15 20 25 30 35
Ch
la (
ug/
l) -
Gro
win
g Se
aso
n A
vera
ge
Distance Upstream (miles)
2007 2008 20092010 2011 2012
LFKJ-6 LFKJ-5BANT-3

Final Locust Fork and Village Creek TMDL Nutrients
59
6.2.1 Algal Growth Potential Test The Algal Growth Potential Test (AGPT) measures the potential of an aquatic ecosystem to support the growth of algal biomass. The test is also instrumental in identifying the absence of which nutrient is preventing the further growth of more algae (i.e., the “limiting nutrient”). Since 1998, the Department has collected water quality samples for the AGPT from two stations directly on the Locust Fork – BANT-3 and LFKJ-5. The results of the AGPT (expressed as mean Maximum Standing Crop (MSC) dry weights of Selenastrum capricornutum in mg/L) and limiting nutrient status are illustrated in the table below. MSC values below 5 mg/L are considered to be protective in reservoirs and lakes; values below 20 mg/L MSC are considered protective of flowing streams and rivers. (Raschke and Schultz 1987).
Table 6.2.1.1 Locust Fork AGPT Results Station ID Visit Date Limiting Nutrient AGPT MSC (mg/l)
BANT-3 8/25/1998 Phosphorus 24.74
BANT-3 8/21/2002 Phosphorus 15.91
BANT-3 6/19/2007 Phosphorus 2.34
BANT-3 7/25/2007 Phosphorus 3.44
BANT-3 8/21/2007 Nitrogen 9.53
BANT-3 8/22/2012 Phosphorus 39.24
LFKJ-5 6/19/2007 Phosphorus 12.19
LFKJ-5 7/26/2007 None 41.12
LFKJ-5 8/21/2007 Co-limiting 2.66
The results of the AGPT indicate that in the Locust Fork, total phosphorus can be considered the nutrient limiting the further growth of algal biomass in the water column. Furthermore, based upon the maximum standing crop values above the suggested value of 5 mg/l, the results indicate the potential for the incidence of nuisance algal blooms to occur in the Locust Fork embayment. 6.2.2 WASP Predicted Nutrient Limitation The results of the WASP model also indicate the algal biomass in the Locust Fork tributary embayment is phosphorus limited during the growing season. The figure below illustrates the calibrated WASP model-predicted time series limitations for nitrogen, phosphorus, and sunlight during the modeled period of January 1, 2007 to December 31, 2012 for the particular cell corresponding to station BANT-3. The values representing the limitation along the y-axis range from 0.0 to 1.0, with the limiting nutrient indicated by the lower values.

Final Locust Fork and Village Creek TMDL Nutrients
60
Figure 6.2.2.1 WASP Calibrated Model – BANT-3 Nutrient Limitation 2007-2012
The figure below highlights the calibrated WASP model-predicted time series limitations for nitrogen, phosphorus, and sunlight during the drought year of 2007.
Figure 6.2.2.2 WASP Calibrated Model – BANT-3 Nutrient Limitation 2007

Final Locust Fork and Village Creek TMDL Nutrients
61
6.3 Locust Fork Model Scenarios 6.3.1 Overview of Locust Fork Modeling Scenarios The strategy behind utilizing the aforementioned calibrated dynamic water quality models (LSPC, EFDC, and WASP) in the Locust Fork TMDL development process is to have the capability to compare the results from several projected scenarios during the model simulation period of January 1, 2007 to December 31, 2012. The scenario simulations represent a combination of hypothetical NPDES permit requirements, specifically monthly average total phosphorus concentration based effluent limitations to point sources in the watershed, and proposed reductions to nonpoint source pollutant loading in the watershed that would ultimately achieve a growing season average chlorophyll-a target of 18 µg/L at the compliance point located at Locust Fork station BANT-3. This iterative process allows the Department to use the water quality models as a management tool to assess alternative combinations of waste load and load allocations that would most fairly, efficiently, and effectively establish the TMDL for the Locust Fork. 6.3.2 Locust Fork Scenario Descriptions A series of model runs were examined using the Locust Fork water quality models (LSPC, EFDC, and WASP) in order to compare the predicted response of chlorophyll-a concentrations at station BANT-3 in the tributary embayment to various scenarios of reducing point source total phosphorus effluent limits and also nonpoint source reductions in the watershed. Table 6.3.2.2 provides a description of each reduction scenario considered. The first three rows provide the results of the calibrated model run, the natural condition model run, and the permit condition model run. The calibrated scenario model run is representative of the model response to existing conditions during the model simulation period of January 1, 2007 to December 31, 2012. The natural condition scenario run is representative of a hypothetical, completely natural watershed that has not been impacted by any anthropogenic sources. In order to simulate a natural condition in the watershed, all NPDES point sources were removed from the model and all existing land uses were converted to 100% forested. The results of the natural condition run serve as a “best case scenario” benchmark for the waterbody and also serve as a point of reference when assessing the cumulative impact of anthropogenic pollution in the waterbody. The permit condition scenario is intended to be representative of “worst case” conditions in regards to how NPDES permitted discharges and also withdrawal sources in the watershed are simulated in the model network. In order to represent a worst case approach in the watershed, all the NPDES point sources in the Locust Fork watershed are simulated at their respective maximum allowable NPDES permit effluent limits and also at their maximum design effluent flowrate. For the industrial type NPDES point sources, the effluent flowrate in the permit condition scenario was based upon the long term average discharge flowrate, which is standard

Final Locust Fork and Village Creek TMDL Nutrients
62
practice for developing effluent limitations for industrial facilities. For the municipal type NPDES point sources (i.e., POTWs), the effluent flowrate utilized in the permit condition scenario was based upon each facility’s permitted design flow, per Departmental Regulations (335-6-6-.15(2)(a) Calculating NPDES Permit Limitations). Furthermore, all water withdrawal sources in the watershed (both public water supply withdrawal sources and industrial withdrawal sources) are simulated at their maximum withdrawal flow rate. In the permit condition scenario, the effluent limitations for each point source are set at their maximum allowable permit limitations for the following pollutants, if applicable: CBOD5, NH3-N, TKN, DO, and Temperature. For those effluent parameters for which the Department does not require a specific numeric limit and requires only monitoring (in this case, nutrient parameters like total phosphorus), the effluent concentration utilized in the model is based upon a 90th percentile of the monitored values from DMRs submitted to the Department during 2006-2012. The existing land use cover, derived from the 2011 National Land Cover Database, was simulated in the model network for the permit condition run (i.e., no changes we made to the landuse cover during the permit condition scenario run and subsequent reduction scenarios). In order to compare the predicted instream chlorophyll-a response to various approaches of reducing point source effluent limits for total phosphorus, a series of reduction scenarios were examined. Each reduction scenario included identifying a numeric total phosphorus effluent limitation for point sources in the Locust Fork watershed. All continuous point sources in the watershed were evaluated based upon their permitted effluent flowrate and resulting total phosphorus loading to the watershed and thus placed into one of the three following categories:
Table 6.3.2.1 Point Source Categories Point Source Category Effluent Flowrate (Qw)
Class 1 Qw ≥ 1.0 MGD
Class 2 Qw < 1.0 MGD & Qw ≥ 0.1 MGD
Class 3 Qw < 0.1 MGD
For each reduction scenario, a total phosphorus (TP) effluent limitation was specified for each point source type category as illustrated in the table above. Furthermore, the Department also adopted a 36% reduction to total phosphorus loading from MS4 sources and nonpoint sources in the TMDL reduction scenarios (see Table 6.3.2.2 Locust Fork TMDL Reduction Scenarios) based on an analysis of the relationship between stormwater driven total phosphorus load reductions in the watershed and the resulting instream chlorophyll-a concentrations. For further details, reference sections 7.4.2 and 7.5. See table 6.3.2.2 below for a list of each considered TMDL reduction scenario.

Final Locust Fork and Village Creek TMDL Nutrients
63
Table 6.3.2.2 Locust Fork and Village Creek TMDL Reduction Scenarios
Scenario Description
March - October Total Phosphorus Effluent Limit Urban
Nonpoint Source (MS4)
Nonpoint Source
Class 1 Class 2 Class 3
Effluent Flowrate ≥ 1 MGD
1 MGD > Effluent Flowrate ≥ 0.1
MGD
Effluent Flowrate < 0.1 MGD
TP Load Percent
Reduction
TP Load Percent
Reduction
Calibrated Run Existing (2006-
2012) Existing (2006-
2012) Existing (2006-
2012) N/A N/A
Natural Condition
No Point Source Discharges
No Point Source Discharges
No Point Source Discharges
100% Forested Landuse
100% Forested Landuse
Permit Condition
DMR - TP @ 90th
Percentile DMR - TP @ 90th
Percentile DMR - TP @ 90th
Percentile N/A N/A
Reduction Scenario #1
DMR - TP @ 90th
Percentile DMR - TP @ 90th
Percentile DMR - TP @ 90th
Percentile 36% 36%
Scenario #2 2 mg/L 3 mg/L 3 mg/L 36% 36%
Scenario #3 2 mg/l 2 mg/l 2 mg/l 36% 36%
Scenario #4 1 mg/l 3 mg/L 3 mg/L 36% 36%
Scenario #5 1 mg/l 2 mg/l 2 mg/l 36% 36%
Scenario #6 1 mg/L 8.34 lbs/day 8.34 lbs/day 36% 36%
Scenario #7 0.5 mg/L 8.34 lbs/day 8.34 lbs/day 36% 36%
Scenario #8 0.3 mg/L 8.34 lbs/day 8.34 lbs/day 36% 36%
Scenario #9 0.2 mg/L 8.34 lbs/day 8.34 lbs/day 36% 36%
Scenario #10 0.15 mg/L 8.34 lbs/day 8.34 lbs/day 36% 36%
Scenario #11 0.10 mg/L 8.34 lbs/day 8.34 lbs/day 36% 36%
Scenario #12 0.3 mg/L 1 mg/l 5 mg/l 36% 36%
Scenario #13 0.2 mg/L 1 mg/l 8.34 ppd 36% 36%
Scenario #14 0.25 mg/L 2 mg/l 5 mg/l 36% 36%
Scenario #15 0.25 mg/L 2 mg/l 6 mg/l 0% 0%
Scenario #16 0.25 mg/L 2 mg/l 6 mg/l 36% 36%
6.3.3 TMDL Scenarios Results The table below summarizes the results of the TMDL reduction scenarios. The chlorophyll-a values in the table below are representative of the calculated average chlorophyll-a concentration based upon the predicted WASP model output at station BANT-3 during the period of April 1st – October 31st for each year in the simulation. The Bankhead WASP model was set up to output the predicted chlorophyll-a concentrations for four times each day (12:00 AM, 6:00 AM, 12:00 PM, and 6:00 PM). This interval was selected in order to capture the natural variability of the chlorophyll-a concentrations observed within each given day, based upon fluctuations of ambient temperature and available sunlight.

Final Locust Fork and Village Creek TMDL Nutrients
64
Table 6.3.3.1 Locust Fork TMDL Reduction Scenario Results
ID Description Station
Chlorophyll-a µg/l - Growing Season Average (April 1st – October 31st)
Overall GS Average
2007 2008 2009 2010 2011 2012 2007-2012
M Measured BANT-3 27.2
n=7a 24.6
n=1a 11.7
n=7a
15.1
n=7a 19.7
CAL Calibrated BANT-3 19.2 12.6 12.7 12.8 13.6 20.6 15.3
NC Natural Conditions BANT-3 1.1 1.8 2 1.5 1.5 2.4 1.7
PC Permit Conditions BANT-3 73.2 36.8 25.6 55.8 40.2 33.5 44.2
Run #1 LA Reduction Only BANT-3 73.2 36.7 25.5 55.7 40.1 33.5 44.1
TMDL Run Class 1 Qw ≥ 1
mgd
Class 2 1 mgd > Qw ≥ 0.1
mgd
Class 3 Qw < 0.1
mgd Station
Chlorophyll-a µg/l - Growing Season Average (April 1st – October 31st)
Overall GS Average
2007 2008 2009 2010 2011 2012 2007-2012
Run #2 2 mg/L 3 mg/L 3 mg/L BANT-3 77 40.1 26.2 62 42.8 34.9 47.2
Run #3 2 mg/l 2 mg/l 2 mg/l BANT-3 76.8 39.9 26.2 61.6 42.6 34.8 47.0
Run #4 1 mg/l 3 mg/L 3 mg/L BANT-3 59.1 28.3 20.8 40.6 30.4 28.4 34.6
Run #5 1 mg/l 2 mg/l 2 mg/l BANT-3 58.6 28 20.6 40 30 28.2 34.2
Run #6 1 mg/L 8.34
lbs/day 8.34
lbs/day BANT-3 61.1 29.5 21.6 42.7 31.9 29.2 36.0
Run #7 0.5 mg/L 8.34
lbs/day 8.34
lbs/day BANT-3 46.1 21.2 16.5 28 22.8 24.4 26.5
Run #8 0.3 mg/L 8.34
lbs/day 8.34
lbs/day BANT-3 38.4 17.3 13.7 21.5 18.4 21.4 21.8
Run #9 0.2 mg/L 8.34
lbs/day 8.34
lbs/day BANT-3 34.1 15 11.9 18.1 15.9 19.6 19.1
Run #10 0.15 mg/L 8.34
lbs/day 8.34
lbs/day BANT-3 31.8 13.8 11.0 16.3 14.5 18.6 17.7
Run #11 0.10 mg/L 8.34
lbs/day 8.34
lbs/day BANT-3 29.4 12.5 10.0 14.6 13.2 17.4 16.2
Run #12 0.3 mg/L 1 mg/l 5 mg/l BANT-3 33.8 14.6 11.4 17.5 15.0 18.9 18.5
Run #13 0.2 mg/L 1 mg/l 8.34
lbs/day BANT-3 31.7 13.6 10.7 16.1 14.1 18.3 17.4
Run #14 0.25 mg/L 2 mg/l 5 mg/l BANT-3 32.3 13.8 10.8 16.4 14.2 18.3 17.6
Run #15b 0.25 mg/L 2 mg/l 6 mg/l BANT-3 32.6 14.1 11.1 16.8 14.6 18.6 18.0
Run #16 0.25 mg/L 2 mg/l 6 mg/l BANT-3 32.5 13.9 10.8 16.5 14.3 18.4 17.7
a: n=Number of samples b: Scenario run with 0% LA reduction
Multiple TMDL reduction scenarios were assessed in order to achieve an overall growing season average concentration less than the established chlorophyll-a target concentration of 18 µg/L. The Department considered adopting a load based effluent limitation of 8.34 lbs/day for Class 2 and 3 discharges (see Figure 6.3.3.1 Runs #6-11, 13). However, an evaluation of the historical DMRs for the Class 2 and 3 facilities indicated that for the majority of those facilities, a load based effluent limitation of 8.34 lbs/day would in fact result in an allowable total phosphorus load that

Final Locust Fork and Village Creek TMDL Nutrients
65
was greater than the historical average total phosphorus load from those facilities. Consequently, since a greater percentage of the allowable total phosphorus contribution from point sources would be allocated to the Class 2 and 3 facilities, more stringent effluent limitations would be necessary for the Class 1 facilities in order to meet the proposed chlorophyll-a target of 18 µg/L. The Department thus decided that issuing a concentration based effluent limitation for all three categories of discharges would be a more reasonable and equitable approach. The figure below illustrates the results of the TMDL reduction scenarios. The overall growing season average chlorophyll-a value represents the average chlorophyll-a concentration calculated from each yearly growing season average during the modeled simulation period, 2007 – 2012. The final applicable point source total phosphorus effluent limitations in the TMDL will be based upon those March - October effluent limits considered in TMDL scenario Run #16 (i.e., Class 1 TP: 0.25 mg/l, Class 2 TP: 2 mg/l, & Class 3 TP: 6 mg/l).
Figure 6.3.3.1 Point Source Load Contribution
44.247.2 47
34.6 34.236
26.5
21.819.1
17.716.2
18.5 17.4 17.6 18 17.7
0.0
10.0
20.0
30.0
40.0
50.0
60.0
70.0
0
500
1000
1500
2000
2500
3000
3500
Gro
win
g Se
aso
n A
vg C
hla
(u
g/l)
Po
int
Sou
rce
-To
tal P
(p
pd
)
Class 1 Class 2 Class 3 GSA Chl-a (ug/l)

Final Locust Fork and Village Creek TMDL Nutrients
66
Figure 6.3.3.2 Locust Fork TMDL Scenario Chlorophyll-a Results
Chapter 7 Expression and Allocation of the TMDL
7.1 Components of the TMDL A TMDL represents the total amount of a pollutant load that can be assimilated by the receiving water while still achieving water quality standards. TMDLs can be expressed in terms of mass per time or by other appropriate measures. TMDLs are comprised of the sum of individual waste load allocations (WLAs) for point sources, load allocations (LAs) for nonpoint sources, and natural background levels. In addition, the TMDL must include a margin of safety (MOS), either implicitly or explicitly, that accounts for the uncertainty in the relationship between pollutant loads and the quality of the receiving waterbody. Conceptually, this definition is denoted by the equation:
TMDL = ∑WLAs + ∑LAs + MOS
In order to develop the TMDL, the following components were considered: • Numeric Targets • Load Allocations • Existing/Baseline Conditions • Margin of Safety (MOS) • Critical Conditions • Seasonal Variation • Waste Load Allocations
1.7
44.2
47.2 47
34.6 34.236
26.5
21.8
19.117.7
16.218.5
17.4 17.6 18 17.7
0.0
5.0
10.0
15.0
20.0
25.0
30.0
35.0
40.0
45.0
50.0
NC
PC
Ru
n #
2
Ru
n #
3
Ru
n #
4
Ru
n #
5
Ru
n #
6
Ru
n #
7
Ru
n #
8
Ru
n #
9
Ru
n #
10
Ru
n #
11
Ru
n #
12
Ru
n #
13
Ru
n #
14
Ru
n #
15
Ru
n #
16C
hlo
rop
hyl
l-a
(ug/
l) -
Ove
rall
Gro
win
g Se
aso
n A
vera
geOverall GSA Chl-a Target

Final Locust Fork and Village Creek TMDL Nutrients
67
Based on the best available science pertinent to the protection of designated uses, extensive assessment of all available data for the Locust Fork, and a detailed modeling analysis, significant reductions in the total phosphorus loading to the Locust Fork will be necessary to meet the numeric target established in the nutrient impaired segment of the tributary embayment.
7.2 Numeric Targets The TMDL endpoint ultimately represents the instream water quality target that is used to quantify the necessary total phosphorus load reductions in order to maintain water quality standards. In this application, the TMDL endpoint used to address the nutrient impairments in the Locust Fork is a growing season (April – October) average chlorophyll-a concentration of 18 μg/L at ADEM reservoir station BANT-3.
7.3 Existing/Baseline Conditions The existing conditions in the model network are based on the following conditions in the Locust Fork watershed during the simulation period from January 1, 2007 to December 31, 2012: NPDES point source discharge effluent flowrate and pollutant concentrations are derived from each facility’s submitted monthly Discharge Monitoring Reports (DMRs) during the simulation period and the existing nonpoint source loading in the watershed is based upon the 2011 National Land Cover Database (NCLD 2011). The existing conditions for the Locust Fork are considered to be the results of the calibrated model network (LSPC, EFDC, and WASP) during the simulation period.
7.3 Critical Conditions The network of dynamic water quality models utilized in the Locust Fork nutrient TMDL were calibrated by comparing each model’s predicted output to actual measured instream water quality data collected by the Department during the model simulation period of January 1, 2007 through December 31, 2012. However, in order to ensure the TMDL is protective of water quality during a “worst case scenario,” an assessment of the chlorophyll-a response in the Locust Fork tributary embayment must be made during a defined subset of the simulation period when conditions are the most critical in regards to promoting the excessive growth of algal biomass. Critical conditions in a reservoir are typically exhibited during periods of high temperatures and low precipitation amounts in the watershed which can lead to elevated instream temperatures, increased residence time, decreased re-aeration, and also slower ambient river velocities. All of these factors directly translate to increased algal production in a reservoir. EPA’s Nutrient Criteria Technical Guidance Manual: Rivers and Streams (EPA, 2000) states that “Nutrient and algal problems are frequently seasonal in streams and rivers, so sampling periods can be targeted to the seasonal periods associated with nuisance problems.” A review of ambient water quality data collected in the Locust Fork tributary embayment suggests the critical time period associated with nutrient over-enrichment that results in excessive algal growth in the Locust Fork embayment is during the growing season months of April through October.

Final Locust Fork and Village Creek TMDL Nutrients
68
Therefore, in order to assess the Locust Fork tributary embayment during critical conditions, the resulting overall chlorophyll-a average concentration defined for each year in the model simulation period will be based upon an assessment of chlorophyll-a output during the growing season from April 1st through October 31st.
7.4 Waste Load Allocations 7.4.1 WLA – NPDES Wastewater Discharges The required total phosphorus effluent limitations for Class 1, Class 2, and Class 3 NPDES regulated point sources are given in the table below, based upon the results from TMDL run #16. The applicable total phosphorus effluent limitations for NPDES-permitted point sources should be incorporated into NPDES permits as a monthly average total phosphorus (TP) limit during the months of March - October.
Table 7.4.1.1 Class 1 NPDES Facilities (Effluent Flowrate ≥ 1.0 MGD)
NPDES # Facility Type Receiving
Waterbody County
Effluent
Flowratea
(MGD)
TP Monthly Average (mg/l)
AL0023647 Jefferson County Village Creek WWTP - 11 Municipal Village Creek Jefferson 60.0 0.25
AL0023647 Jefferson County Village Creek WWTP - 21 Municipal Village Creek Jefferson 60.0 0.25
AL0026913 Jefferson County Fivemile Creek WWTP Municipal Fivemile Creek Jefferson 30.0 0.25
AL0049603 Boaz Slab Creek WWTP Municipal Slab Creek UT Marshall 4.88 0.25
AL0003247 ERP Compliant Coke LLC Inc. Industrial Fivemile Creek Jefferson 4.73 0.25
AL0022926 Jefferson County Turkey Creek WWTP Municipal Turkey Creek Jefferson 5.00 0.25
AL0049549 Oneonta WWTP Municipal Mill Creek Blount 2.20 0.25
AL0001449 Tyson Farms Blountsville Industrial Graves Creek Blount 1.339 0.25
a. Design Flowrate was used for Municipal Type Discharges. Long Term Average Flowrate was used for Industrial Type Discharges

Final Locust Fork and Village Creek TMDL Nutrients
69
Table 7.4.1.2 Class 2 NPDES Facilities (Effluent Flowrate < 1.0 MGD and Effluent Flowrate ≥ 0.10 MGD)
NPDES # Facility Type Receiving
Waterbody County
Effluent
Flowratea
(MGD)
TP Monthly Average (mg/l)
AL0056120 Jefferson County Prudes Creek WWTP Municipal Fivemile Creek Jefferson 0.90 2
AL0053121 Morris Manor Apartments WWTP Municipal Turkey Creek Jefferson 0.50 2
AL0003417 ABC Coke, Drummond Company Inc. Industrial Fivemile Creek Jefferson 0.404 2
AL0001554 CMC Steel Alabama Industrial Village Creek UT Jefferson 0.380 2
AL0058572 Snead WWTP Municipal Locust Fork Blount 0.15 2
AL0073261 Cleveland WWTP Municipal Dry Creek UT Blount 0.15 2
AL0050881 Warrior WWTP Municipal Cane Creek Jefferson 0.10 2
a. Design Flowrate was used for Municipal Type Discharges. Long Term Average Flowrate was used for Industrial Type Discharges
Table 7.4.1.3 Class 3 NPDES Facilities (Effluent Flowrate < 0.10 MGD)
NPDES # Facility Type Receiving
Waterbody County
Effluent
Flowratea
(MGD)
TP Monthly Average (mg/L)
AL0071170 County Line Industrial Park WWTP Municipal Longs Branch Blount 0.099 6
AL0051055 Peachtree Crossing Mobile Home Park Municipal Black Creek UT Jefferson 0.09 6
AL0076261 West Blount Lagoon Municipal Hogeland Creek Jefferson 0.09 6
AL0021237 Altoona Lagoon Municipal Locust Fork Etowah 0.07 6
AL0027642 Forestdale MHP Municipal Fivemile Creek Jefferson 0.03 6
AL0050563 Susan Moore High School Municipal Locust Fork UT Blount 0.03 6
AL0056553 The Cove Mobile Home Park Municipal Turkey Creek Jefferson 0.024 6
AL0054348 Locust Fork High School Lagoon Municipal Blackburn Fork Blount 0.022 6
AL0062251 Brookside Village WWTP Municipal Newfound Creek Jefferson 0.022 6
AL0032301 Dixie-Manor Housing Project Municipal Self Creek UT Jefferson 0.02 6
AL0071170 County Line Industrial Park WWTP Municipal Longs Branch Blount 0.02 6
AL0051161 Bottenfield Junior High School Municipal Prudes Creek UT Jefferson 0.017 6
AL0047546 Bradford Parkside Health Services WWTP Municipal Thomas Creek Jefferson 0.015 6
AL0054011 River Bend Townhouses WWTP Municipal Turkey Creek Jefferson 0.015 6
AL0075256 North Jefferson Middle School WWTP Municipal Lick Creek Jefferson 0.012 6
AL0051195 Johnson Elementary School Lagoon Municipal Self Creek UT Jefferson 0.01 6
AL0068675 Southeastern Elementary School Municipal Campbell Creek Blount 0.005 6
AL0057827 Sharon Heights MHP Municipal Fivemile Creek Jefferson 0.003 6
a. Design Flowrate was used for Municipal Type Discharges. Long Term Average Flowrate was used for Industrial Type Discharges

Final Locust Fork and Village Creek TMDL Nutrients
70
7.4.2 WLA – NPDES Stormwater Discharges Urban areas with the designation of Municipal Separate Storm Sewer System (MS4) fall under the regulation of the NPDES program and therefore are considered to be point sources by the EPA. However, stormwater discharges are similar to nonpoint sources in a watershed in that pollutant loads originate from diffuse sources and the magnitude of pollutant loading to the waterbody depends heavily upon the frequency, duration, and intensity of rainfall events in the watershed. Furthermore, the intention of stormwater NPDES permits are to implement controls, or BMPs, in the watershed to effectively reduce the exposure of stormwater to pollutants rather than attempting to address and treat the stormwater discharge from each individual outfall. Currently, stormwater NPDES permits do not include numeric total phosphorus limitations. Therefore, compliance with this TMDL will be demonstrated through the implementation of stormwater management plans (SWMPs). The SWMPs will address nutrient reductions in the watershed by implementing appropriate BMPs, eliminating illicit discharges, conducting instream water quality monitoring, and education and outreach. For the purposes of this TMDL, the 36% reduction to existing MS4 total phosphorus loads should not be interpreted as a numeric permit limitation.
7.5 Load Allocations As previously mentioned in Section 4.3, Department-collected water quality data on the Locust Fork and its tributaries suggests the nutrient loading to those waterbodies from nonpoint sources in the watershed is minimal. Nevertheless, a percent reduction to the existing total phosphorus load, reflected in the load allocation component described below, was analyzed in the TMDL reduction scenarios in an effort to make fair and equitable allocations to all stakeholders in the watershed and to reduce nutrient loading for the Locust Fork watershed as a whole. In addition to achieving the goals of the Locust Fork and Village Creek Nutrient TMDL, nutrient reductions to nonpoint sources will also serve to reduce the impact of nutrient enrichment through the implementation of BMPs at a more localized level to further improve water quality within those specific tributaries. The Department recognizes that any total phosphorus load reductions to nonpoint sources in the watershed will be implemented by means of voluntary, incentive-based mechanisms, outside of the permitting programs. In the Locust Fork watershed, the primary landuse types that may be addressed through the implementation of BMPs in an effort to reduce the nonpoint source nutrient loading to the waterbody include developed (open space, low intensity, medium intensity, and high intensity), barren, herbaceous, hay/pasture, and cultivated crops. Forested, shrub, and wetland landuse types are considered representative of natural conditions, and therefore do not typically contribute excessive nonpoint source driven nutrient loadings to the Locust Fork. Refer to Figure 4.3.1 and Table 4.3.1 for a detailed description of the landuse types found in the Locust Fork watershed.

Final Locust Fork and Village Creek TMDL Nutrients
71
The load allocation component for the Locust Fork and Village Creek Nutrient TMDL was derived from an evaluation of the LSPC watershed model output for the Locust Fork segment located in the headwaters of the watershed, illustrated by LSPC sub-watershed 461 shown in Figure 7.5.1.2. An evaluation of the total phosphorus load from sub-watershed 461 was chosen as representative of the existing nonpoint source total phosphorus loading to the Locust Fork waterbody based upon consideration of the following factors:
The drainage watershed for the Locust Fork at this reach location does not contain any continuous point source discharges. Therefore, the origin of the nutrient loading to the waterbody is presumably attributable to nonpoint sources in the watershed.
The landuse for the drainage area of sub-watershed 461 is comprised heavily of agriculture and includes an urban component as well. Both agricultural practices in a watershed and stormwater runoff associated with urban development can account for a significant source of nonpoint source pollution to nearby rivers and streams.
The allowable load allocation for the Locust Fork was calculated based on an analysis of the LSPC watershed model under “natural conditions” [i.e., converted all anthropogenic landuses in the watershed to a natural condition (forest land cover)]. This analysis provides an estimation of the magnitude of the human induced loads to the Locust Fork waterbody based upon changes to the landuse type from a forested cover that delivers minimal nutrient loading to the waterbody compared to the existing landuse cover types that are more susceptible to nonpoint source pollution, like cultivated crops and pasture. The figure below illustrates the results of the predicted LSPC daily total phosphorus load for the existing landuse cover and the natural conditions landuse cover type for the Locust Fork waterbody represented at sub-watershed 461.
Figure 7.5.1.1 Locust Fork Sub-watershed 461: Daily TP Load

Final Locust Fork and Village Creek TMDL Nutrients
72
Figure 7.5.1.2 Locust Fork Sub-watershed 461: 2011 NLCD
Table 7.5.1.1 Locust Fork Sub-watershed 461: 2011 NLCD
Land Use Description Acres Square Miles %
Land Use Description Acres
Square Miles
Percent (%)
Open Water 422.55 0.66 0.45 Developed 6839.98 10.69 7.26
Developed, Open Space 4700.32 7.34 4.99 Forested/Wetlands 42055.53 65.71 44.64
Developed, Low Intensity 1404.20 2.19 1.49 Agriculture 37820.24 59.09 40.14
Developed, Medium Intensity 533.75 0.83 0.57 Grassland/Shrubs 6943.61 10.85 7.37
Developed, High Intensity 201.71 0.32 0.21 Barren Land 134.77 0.21 0.14
Barren Land 134.77 0.21 0.14 Open Water 422.55 0.66 0.45
Deciduous Forest 25395.93 39.68 26.95
Evergreen Forest 6892.24 10.77 7.32 Sum 94216.69 147.21 100.00
Mixed Forest 8773.92 13.71 9.31 Shrub/Scrub 4504.83 7.04 4.78 Grassland/Herbaceous 2438.78 3.81 2.59 Pasture/Hay 31729.29 49.58 33.68 Cultivated Crops 6090.95 9.52 6.46 Woody Wetlands 908.04 1.42 0.96 Emergent Herbaceous Wetlands 85.40 0.13 0.09
Sum 94216.69 147.21 100.00

Final Locust Fork and Village Creek TMDL Nutrients
73
The load allocation percent reduction implemented in the TMDL was based upon an evaluation of the median daily TP load under the existing conditions compared to the median daily TP load under natural conditions, illustrated in the table below:
Table 7.5.1.2 Load Allocation Calculations for Locust Fork Sub-watershed 461
Existing Conditions Natural Conditions
Statistic TP Daily Load (ppd) TP Daily Load (ppd)
Minimum 0.05 0.03
10th percentile 0.36 0.15
Median 3.85 2.46
90th Percentile 58.00 20.18
Maximum 3499.31 637.54
Average 33.03 10.22
Percent Reductiona 36% a. Based on Median Load
In order to explore the sensitivity of the model network to the load allocation component of the TMDL, a globalized 36% reduction was implemented to the total phosphorus loads originating from those landuse types in the watershed associated with nonpoint source pollution identified earlier. The resulting predicted chlorophyll-a concentrations based upon Reduction Scenario #1 (i.e., Permit Conditions for Point Sources, with 36% LA reduction in the watershed) indicate that when solely addressing the nonpoint source nutrient loading in the watershed, the resulting impact on instream chlorophyll-a concentrations is minimal (see Table 6.3.3.1 Locust Fork Reduction Scenario Results). However, a percent reduction to the existing total phosphorus load from nonpoint sources is included in the TMDL to make fair and equitable allocations to all stakeholders in the watershed and to reduce nutrient loading for the Locust Fork watershed as a whole.
7.6 Margin of Safety There are two methods for incorporating a margin of safety (MOS) in the analysis: a) by implicitly incorporating the MOS using conservative model assumptions to develop allocations; or b) by explicitly specifying a portion of the TMDL as the MOS and using the remainder for allocations. An implicit MOS was incorporated in the Locust Fork TMDL due to the fact that the TMDL was developed based upon a modeling approach that utilized several conservative (i.e., worst case) conditions. The conservative model conditions used in the model network include the following:
For the permit condition model run, all continuous NPDES point sources in the Locust Fork watershed were set at their respective permit effluent limitations and also at their design effluent flowrate (for municipal sources).
For the permit condition model run, surface water withdrawal sources (both drinking water and also industrial sources) were set at design/plant capacity water withdrawal rates.

Final Locust Fork and Village Creek TMDL Nutrients
74
All the sub-watershed land area modeled in the LSPC model is directly connected to streams.
7.7 Seasonal Variation When assessing chlorophyll-a concentrations in a reservoir, the variability occurring within the algal growing season must be taken into account. The cooler months are generally less productive resulting in lower chlorophyll-a values while the warmer months are generally more productive with higher values typically recorded. Therefore, a TMDL should be protective of water quality over a range of possible conditions that are expected to occur within an impaired segment. Seasonal variation is considered in the development of the TMDL by evaluating the model simulation period from January 1, 2007 to December 31, 2012, which included a range of hydrologic, meteorological and loading conditions observed in the Locust Fork watershed. The simulation period included 2007, a low flow year brought on during drought conditions, and also 2009 and 2010, considered relatively wet years. The figure below for USGS gage 02456500 Locust Fork at Sayre illustrates the monthly average flow for each simulation year, 2007 to 2012, compared to the long term average monthly flow, calculated from the entire period of record (1928-2016). The graph clearly illustrates the 2007 drought year that was characterized by extended periods of below average stream flow; similarly, the graph also illustrates the “wetter” years that were characterized with above average streamflow, like 2009 for instance.
Figure 7.7.1 Monthly Flow Analysis at USGS 02456500 Locust Fork at Sayre
0
1000
2000
3000
4000
5000
6000
Mo
nth
ly a
vera
ge F
low
(cf
s)
2007 2008 2009 2010 2011 2012 Long Term Average (1928-2016)

Final Locust Fork and Village Creek TMDL Nutrients
75
Chapter 8 Locust Fork Nutrient TMDL The final TMDL is based upon the necessary waste load allocation (WLA), load allocation (LA), and margin of safety (MOS) required to meet the numeric chlorophyll-a growing season average target of 18 µg/l, established at the compliance point located at the Locust Fork tributary embayment station BANT-3. For the purpose of this TMDL, the “Growing Season” is defined as the time period consisting of the months of April – October. However, an evaluation of the WASP model output suggests it is necessary to implement the NPDES point source total phosphorus effluent limitations during the period of March – October. Enforcing the necessary effluent limitations for point sources beginning a month prior to the growing season period will help to assure the instream chlorophyll-a target will be met during the growing season regardless of the following factors: relative location of the point source discharge within the watershed (i.e., direct discharge to Locust Fork or indirect discharge), time of travel for the Locust Fork wadeable segments in the headwaters of the watershed, and finally the hydraulic residence time in the tributary embayment segments further downstream. The waste load allocation component for all of the continuous point sources in the Locust Fork watershed shall be applied as an effluent monthly average total phosphorus concentration limit applicable during the months of March – October.
Table 8.1.1 Locust Fork and Village Creek Nutrient TMDL
WLA (Continuous Sources) WLA (MS4 Stormwater
Sources)
LA (Stormwater
Sources)
Margin of Safety
TP Effluent Limit for Class 1
TP Effluent Limit for Class 2
TP Effluent Limit for Class 3
Percent Reduction to
existing TP Load
Percent Reduction to existing TP
Load (Qw ≥ 1
MGD) (Qw < 1 MGD & Qw ≥ 0.1 MGD)
(Qw < 0.1 MGD)
0.25 mg/L 2 mg/L 6 mg/L 36% a 36% Implicit
a. MS4 permits that are located in the Locust Fork Watershed must comply with this TMDL. MS4 permits are BMP-based and currently do not specify numeric total phosphorus limits. Therefore, TMDL compliance will be demonstrated through implementation and maintenance of BMPs on a case-by-case basis. For the purposes of this TMDL, the 36% reduction to MS4 Stormwater source total phosphorus loads should not be interpreted as a numeric permit limitation.

Final Locust Fork and Village Creek TMDL Nutrients
76
Chapter 9 Village Creek Nutrient TMDL
In addition to addressing the nutrient impairment on the mainstem of the Locust Fork, total phosphorus effluent limitations specified in the table above are also expected to reduce instream total phosphorus concentrations in several of the effluent dominated tributaries to the Locust Fork. Specifically, total phosphorus concentrations in the lower segment of Village Creek, which is also listed on the current 2016 §303(d) list as impaired by nutrients, are expected to decrease significantly as a result of reduced nutrient loading from point sources further upstream in the watershed. The existing nutrient impairment for Village Creek was based upon Department-collected water quality data from the existing wadeable station VLGJ-5. The figure below depicts a comparison of the measured total phosphorus concentrations at Village Creek station VLGJ-5 versus the model predictions at that site based on the final TMDL scenario (Run #16) during the 2007 and 2012 growing season time period (April-October). The graph illustrates a 68 percent reduction to instream total phosphorus concentrations as a result of the final TMDL effluent limitations during 2007, and a 36 percent reduction to total phosphorus concentrations in 2012.
Figure 9.1.1 Village Creek (VLGJ-5) TP Measured vs. TMDL Run #16
In addition to sampling the wadeable segments of Village Creek, the Department has also routinely collected water quality data from a tributary embayment station (BANT-8) in Village Creek as part of the RRMP (Rivers and Reservoirs Monitoring Program). An analysis of the
0.00
0.10
0.20
0.30
0.40
0.50
0.60
GS Measured 2007 TMDL Run #16 GS Measured 2012 TMDL Run #16
Gro
win
g Se
aso
n T
ota
l Ph
osp
ho
rus
(mg/
l)
68% reduction
36% reduction
2007 2012
n = 7 n = 7Measured TMDL Run #16 GS Average

Final Locust Fork and Village Creek TMDL Nutrients
77
predicted chlorophyll-a concentrations based upon the final TMDL scenario (Run #16) at the tributary embayment station BANT-8 indicate the TMDL effluent limitations are considered protective of water quality conditions in the Village Creek tributary embayment. The figure below depicts the predicted growing season average chlorophyll-a concentrations at station BANT-8 based on the final TMDL model run #16.
Figure 9.1.2 BANT-8 GSA Chlorophyll-a (µg/l) - Permit Condition vs TMDL Run #16
In summary, an analysis of predicted instream total phosphorus concentrations at station VLGJ-5 and predicted chlorophyll-a concentrations at non-wadeable tributary embayment station BANT-8 in Village Creek indicate the reductions required to attain the aforementioned chlorophyll-a target of 18 µg/l in the Locust Fork tributary embayment at station BANT-3 will be protective of water quality in both the nutrient impaired mainstem Locust Fork segments and also the nutrient impaired downstream segment of Village Creek.
2007 2008 2009 2010 2011 2012
Permit Condition 22.14 4.80 1.60 11.68 5.63 4.98
TMDL Run #16 6.08 2.05 1.26 3.11 2.16 2.39
0.0
5.0
10.0
15.0
20.0
25.0
Gro
win
g Se
aso
n A
vera
ge
Ch
loro
ph
yll-
a (u
g/l)

Final Locust Fork and Village Creek TMDL Nutrients
78
Chapter 10 TMDL Implementation
10.1 Implementation of Point Source Reductions
10.1.1 TMDL Implementation for Continuous Point Source Permits
Implementation of phosphorus reductions necessary to meet the growing season instream chlorophyll-a target concentration of 18 µg/l at compliance station BANT-3 will be achieved through the issuance of NPDES permits that will require effluent total phosphorus limits applicable during the months of March - October. The Department’s NPDES Municipal and Industrial permitting program will be responsible for issuing the NPDES permits requiring the aforementioned total phosphorus concentration based effluent limitations. Furthermore, the implementation schedule for all municipal and industrial permittees will be determined on a case by case basis by ADEM’s NPDES permitting program. The Department recognizes that the necessary effluent treatment process alterations and improvements will vary based on existing processes and already planned upgrades. Future requests for new or expanded NPDES permits which will discharge within the Locust Fork watershed will be evaluated on a case-by-case basis consistent the Department's permitting strategy for impaired waters. As currently expressed by the TMDL in section 7.4.1, specific numeric effluent concentration limits for total phosphorus are identified for all continuous point source dischargers in the watershed based upon their respective flow class (1,2, or 3). However, the Department recognizes that a permittee may necessitate a change to their effluent flowrate for a variety of reasons, including but not limited to, changes to production, water conservation/reuse, or changes to wastewater treatment design capacity infrastructure. If a permittee submits a permit application to the Department that includes a revised flowrate that results in a change to their flow class, the Department will then conduct a review of the TMDL model to determine what total phosphorus effluent limits are necessary in order to remain protective of the chlorophyll-a target of 18 µg/l. 10.1.2 TMDL Implementation for MS4 Permits
Urban areas with the designation of Municipal Separate Storm Sewer System (MS4) fall under the regulation of the Department’s Stormwater Management NPDES permitting program. Each permittee in the Locust Fork watershed covered under an MS4 permit will demonstrate compliance with this TMDL through the implementation of stormwater management plans (SWMPs). The SWMPs will address nutrient reductions in the watershed by implementing appropriate BMPs, eliminating illicit discharges, conducting instream water quality monitoring, and education and outreach.

Final Locust Fork and Village Creek TMDL Nutrients
79
10.2 Implementation of Nonpoint Source Reductions
Voluntary, incentive-based mechanisms will be used to implement nonpoint source management measures in order to assure that measurable reductions in pollutant loadings can be achieved for the Locust Fork. Cooperation and active participation by the general public and various industry, business, and environmental groups is critical to successful implementation of TMDLs. Local citizen-led and implemented management measures offer the most efficient and comprehensive avenue for reduction of loading rates from nonpoint sources. Therefore, TMDL implementation activities for nonpoint sources will be coordinated through interaction with local entities in conjunction with the Department’s 319 Nonpoint Source Program.
10.3 Adaptive Management
The objective of the TMDL is to address the nutrient impaired reaches of the mainstem Locust Fork and Village Creek by implementing nutrient reductions to sources in the watershed that are contributing to the impairment. Reducing nutrient loading from point sources located on other major tributaries to the Locust Fork is expected to coincidentally improve the water quality conditions found in those tributaries. Nevertheless, the intent of the TMDL is to be protective of water quality on those impaired reaches of the Locust Fork and Village Creek explicitly identified in this document. It is possible during the implementation of this TMDL that further evaluation of instream conditions within the Locust Fork and Village Creek, including biological and chemical monitoring, will reveal trends of improvement in both water quality and biological conditions. If so, any required implementation in the future may be revised according to the best available science at that time. Adaptive management, in conjunction with the implementation schedules as determined by ADEM’s NPDES Municipal and Industrial permitting program, will allow the TMDL target to be validated or adjusted as necessary based on additional data that becomes available in the future.
Chapter 11 Follow Up Monitoring ADEM has adopted a statewide approach to water quality management. Each year, ADEM’s water quality resources are divided among multiple priorities statewide including §303(d) listed waterbodies, waterbodies with active TMDLs, and other waterbodies as determined by the Department. Monitoring will help further characterize water quality conditions resulting from the implementation of best management practices and load reductions in the watershed.
Chapter 12 Public Participation As part of the public participation process, this TMDL document was placed on public notice and made available for review and comment. A public notice was prepared and published in the major daily newspapers in Montgomery, Huntsville, Birmingham, and Mobile, as well as

Final Locust Fork and Village Creek TMDL Nutrients
80
submitted to persons who have requested to be on ADEM’s postal and electronic mailing distributions. In addition, the public notice and subject TMDL were made available on ADEM’s Website: www.adem.state.al.us. The public could also request hard or electronic copies of the TMDL by contacting Ms. Kimberly Minton at 334-271-7826 or [email protected]. The public was given an opportunity to review the TMDL and submit comments to the Department in writing. At the end of the comment period, all written comments received during the public notice period became part of the administrative record. ADEM considered all comments received by the public prior to final completion of this TMDL and subsequent submission to EPA Region 4 for final approval.

Final Locust Fork and Village Creek TMDL Nutrients
81
Chapter 13 References
Alabama, State of. 1949. Studies of Pollution in Streams of Alabama. Water Improvement Advisory Commission. 298 pp
ADEM Administrative Code, 2010. Water Division - Water Quality Program, Chapter 335-6-10,
Water Quality Criteria. ADEM Administrative Code, 2010. Water Division - Water Quality Program, Chapter 335-6-11,
Use Classifications for Interstate and Intrastate Waters. ADEM 1999. Surface Water Quality Screening Assessment of the Black Warrior River Basin. Field
Operations Division, Alabama Department of Environmental Management. Montgomery, Alabama, January 1999.
ADEM, 2011. Nutrient Criteria Implementation Plan. Alabama Department of Environmental
Management, Montgomery, Alabama, September 2011. ADEM 2013. Assessment of Water Quality in Wadeable Streams near Surface Coal Mining
Facilities in the Black Warrior River Basin in Alabama. Alabama Department of Environmental Management, Montgomery, Alabama, December 2013.
Maceina, M.J., D.R. Bayne, A.S. Hendricks, W.C. Reeves, W.P. Black, and V.J. DiCenzo. 1996.
Compatibility between water clarity and quality black bass and crappie fisheries in Alabama. American Fisheries Society Symposium 16: 296-305.
Raschke, R.L. and D.A. Schultz. 1987. The use of the algal growth potential test for data
assessment. Journal of Water Pollution Control Federation 59(4):222-227. USEPA 2000b. Nutrient Criteria Technical Guidance Manual: River and Streams. United States
Environmental Protection Agency, Office of Water. EPA 822-B-00-002.

Final Locust Fork and Village Creek TMDL Nutrients
82
Appendix A
Locust Fork and Village Creek Water
Quality Data (2005-2012)

Final Locust Fork and Village Creek TMDL Nutrients
83
STATION VISIT_DATEFlow
cfs
Temp,
Water c
Dissolved
Oxygen mg/l
pH
su
Turbidity
ntu
Hardness
mg/l
Conductivity
µmhos/cm
Solids,Total
Dissolved mg/l
DET_COND -
Solids, Total
Dissolved mg/l
Solids, Total
Suspended
mg/l
DET_COND -
Solids, Total
Suspended mg/l
LFKB-15 4/12/2012 11:41 32.1 13.3 8.5 7.2 9.7 151.4 104 5
LFKB-15 5/2/2012 14:34 8.5 21.1 6.3 7.6 9.1 186.3
LFKB-15 5/3/2012 11:50 16.1 19.7 5.9 7 6 189.2 88 JQ6 1 < MDL 1
LFKB-15 6/7/2012 11:21 13.5 19.8 6.7 6.9 13.5 164.6 92 1 < MDL 1
LFKB-15 7/19/2012 11:31 15.2 23.2 5.6 6.8 10 176 122 11
LFKB-15 8/14/2012 17:15 14 23.1 6.4 6.8 141 162.7 196 20 JQ6
LFKB-15 9/12/2012 16:47 6.8 20.3 6.3 7.5 14.5 202.2 118 1 < MDL 1
LFKB-15 10/10/2012 16:54 14.2 15.4 8 7.4 12 153.9 80 9
LFKB-15 11/14/2012 14:44 28.3 10.1 8 6.9 6.6 143.6 128 1 < MDL 1
LFKB-1 4/22/2008 11:40 222 18.1 9.7 7.7 3.3 135 84 6
LFKB-1 5/14/2008 10:45 413 17.6 9.1 7.8 14.1 111 71 16
LFKB-1 6/4/2008 11:30 205 24.5 8.5 8.3 6.1 156
LFKB-1 6/9/2008 10:50 80 27.5 7.8 8.2 5.1 206
LFKB-1 6/11/2008 9:51 69.6 26.9 7.4 7.7 4.2 209
LFKB-1 6/12/2008 11:00 82 27.3 7.3 8.4 6 241 132 3
LFKB-1 6/16/2008 10:55 56 26.5 7.4 8.4 4.3 253
LFKB-1 6/23/2008 10:00 26 25.9 7 8.3 3 297
LFKB-1 7/10/2008 10:30 13 28 6.5 7.8 3.2 375 209 2
LFKB-1 8/4/2008 10:30 13 28.3 8 8.2 1.7 452
LFKB-1 8/7/2008 10:30 14 28.6 8 8.4 1.8 541 310 4
LFKB-1 8/11/2008 10:35 9.6 26.3 8.5 8.8 1.6 544
LFKB-1 8/18/2008 10:45 12 24.7 10 8.2 1.5 515
LFKB-1 8/20/2008 10:30 10 25.8 9.6 8.7 1.8 507
LFKB-1 9/3/2008 10:30 83 25.4 7.9 7 2.5 213 114 3
LFKB-1 10/14/2008 10:50 18 21.2 8.6 8.1 2 476 289 5
LFKB-1 11/5/2008 10:15 10 12.9 10.4 8.3 1.3 472 324 2
LFKB-1 4/12/2012 10:25 106.9 15 10.2 7.7 2.7 166.2 114 1
LFKB-1 5/3/2012 10:44 51.3 23.8 7.2 7.3 2.4 213.3 122 1 < MDL 1
LFKB-1 6/21/2012 8:16 25.3 6.8 7.7 2 107
LFKB-1 7/19/2012 10:14 180.3 27.2 7.4 7.2 7.4 202 140 12
LFKB-1 8/14/2012 15:25 101.1 25.9 8.2 7.2 9.5 242.2 198 2
LFKB-1 8/16/2012 11:35 63
LFKB-1 9/12/2012 15:41 78.8 23.4 8.6 8 4.6 183 98 1
LFKB-1 10/10/2012 15:37 130.6 16.8 10.3 7.9 3.9 165 86 7
LFKB-1 11/14/2012 13:36 122.4 9.8 11.8 7.9 8.1 219.9 168 1 < MDL 1
LFKB-2 4/12/2012 9:17 254.6 16.3 8.7 7.3 3.1 165.9 114 1
LFKB-2 5/3/2012 9:42 104.4 25.4 6.9 7.7 3.1 199.9 106 1 < MDL 1
LFKB-2 6/7/2012 9:13 100 25.4 7 7.4 3.9 231.1 128 1
LFKB-2 6/20/2012 14:48 29.8 9.7 8.5 2.8 53.8
LFKB-2 7/19/2012 9:10 79.4 27.6 6.4 7 4.1 201.6 144 6
LFKB-2 8/14/2012 13:37 157.9 26.6 7.6 6.9 24.7 139.9 124 2
LFKB-2 9/12/2012 14:07 97.2 26.4 9.2 8.4 5.8 143 74 4 JQ6

Final Locust Fork and Village Creek TMDL Nutrients
84
STATION VISIT_DATEFlow
cfs
Temp,
Water c
Dissolved
Oxygen mg/l
pH
su
Turbidity
ntu
Hardness
mg/l
Conductivity
µmhos/cm
Solids,Total
Dissolved mg/l
DET_COND -
Solids, Total
Dissolved mg/l
Solids, Total
Suspended
mg/l
DET_COND -
Solids, Total
Suspended mg/l
LFKB-2 10/10/2012 13:10 150.3 18.5 11.5 8.6 3.8 155.1 90 6
LFKB-2 11/14/2012 11:48 219.6 10.2 11.8 7.8 3.2 230.6 162 1 < MDL 1
LFKB-8 4/16/2008 13:40 16.1 11.8 7.9 4.6 142 108 5
LFKB-8 5/20/2008 13:16 849 21.6 8.8 7.5 15.8 143 94 15
LFKB-8 6/11/2008 15:58 162.4 30.3 8.8 8.1 5 193.7
LFKB-8 6/25/2008 10:15 91 27.6 9.2 7.8 6.2 227 125 3
LFKB-8 7/7/2008 11:12 76 29.1 8.1 7.6 6.7 216
LFKB-8 7/16/2008 9:00 67 28 6.6 7.6 5.4 241
LFKB-8 7/21/2008 9:00 37 28.8 6.9 7.7 6 260
LFKB-8 7/23/2008 9:35 34 28.4 6.7 7.5 4.7 258 153 2
LFKB-8 8/28/2008 9:15 2070 23.1 7.1 7.3 65 108 85 66
LFKB-8 9/8/2008 9:10 63 25.6 7.3 7.6 5.4 211
LFKB-8 9/17/2008 9:20 45 23.3 8.1 7.9 4.8 222 135 2
LFKB-8 9/23/2008 9:35 36 22.7 7.9 7.8 4.1 242
LFKB-8 9/25/2008 9:09 32 21.6 8 7.8 3.2 245
LFKB-8 10/23/2008 9:45 27 16.4 9.7 7.8 3.7 130 303 170 5
LFKB-8 11/6/2008 9:45 25 11.9 10.8 7.8 2.3 365 234 2
LFKB-8 4/11/2012 14:55 374 20 10.6 7.8 2.8 168.8 98 1 < MDL 1
LFKB-8 5/2/2012 14:16 113.5 26.3 10 7.9 3 88 219.5 118 1 < MDL 1
LFKB-8 6/6/2012 14:16 230.4 27 11.7 8.4 8.9 219.4 178 12
LFKB-8 6/20/2012 11:43 27.3 8.1 7.8 4 102.4
LFKB-8 7/18/2012 13:23 88.8 27.9 6.7 6.9 8.4 68.1 190.1 100 4
LFKB-8 8/14/2012 11:55 136.1 25.5 6.7 6.7 34.1 140.6 140 17
LFKB-8 9/12/2012 12:24 144.5 23.7 8.2 7.6 11.4 71.5 183.8 104 9
LFKB-8 10/10/2012 11:26 199.6 16.9 10.2 7.9 6.6 171.7 90 11
LFKB-8 11/14/2012 10:42 310.3 9.9 10.8 7.3 5.8 86.2 221.8 174 4
LFKJ-2 4/16/2008 11:40 14.9 10.6 7.6 6 142 86 5
LFKJ-2 5/20/2008 12:15 21.4 8.6 7.5 18.8 145 96 41
LFKJ-2 6/25/2008 11:45 28.1 9.5 8.1 5.6 233 137 5
LFKJ-2 7/7/2008 12:10 96.1 29.4 8.6 7.6 5.8 217
LFKJ-2 7/16/2008 9:45 90.6 28.5 7.1 7.6 12.6 82
LFKJ-2 7/21/2008 9:45 71.8 29.1 7.3 7.6 5.5 253
LFKJ-2 7/23/2008 10:30 78.5 28.8 7 7.6 4.7 267 170 7
LFKJ-2 8/28/2008 10:00 23.3 7 7.4 78.5 99 78 76
LFKJ-2 9/8/2008 9:55 138.1 26.6 8.6 7.8 5.3 195
LFKJ-2 9/17/2008 10:15 118.8 24.3 8.6 8 4.1 201 132 2
LFKJ-2 9/23/2008 10:14 61.2 23.6 9 8.1 4.5 238
LFKJ-2 9/25/2008 9:50 70.7 22.6 9.1 8.1 5.5 243
LFKJ-2 10/23/2008 10:50 50.7 16.6 10.2 8 3.3 127 292 177 7
LFKJ-2 11/6/2008 10:45 39.6 12.6 8 4 349 220 3
LFKJ-3 4/11/2012 13:31 290.8 19.7 9.4 7.4 4 87.2 227.8 150 1 < MDL 1

Final Locust Fork and Village Creek TMDL Nutrients
85
STATION VISIT_DATEFlow
cfs
Temp,
Water c
Dissolved
Oxygen mg/l
pH
su
Turbidity
ntu
Hardness
mg/l
Conductivity
µmhos/cm
Solids,Total
Dissolved mg/l
DET_COND -
Solids, Total
Dissolved mg/l
Solids, Total
Suspended
mg/l
DET_COND -
Solids, Total
Suspended mg/l
LFKJ-3 5/2/2012 13:11 175.7 25.3 10 7.8 5.1 292.1 156 2
LFKJ-3 6/6/2012 13:00 515.6 26.2 8.2 7.4 9.1 104 263.7 210 10
LFKJ-3 6/20/2012 7:43 27.7 8.6 7.8 6.8 154.8
LFKJ-3 7/18/2012 12:34 28.8 6.6 6.9 8.6 227 128 6
LFKJ-3 8/14/2012 10:33 228.2 25.5 6.5 6.7 27.2 72.1 197.4 194 9
LFKJ-3 9/12/2012 11:24 209.6 23.6 7.3 7.3 11.8 272.8 174 4
LFKJ-3 10/10/2012 10:10 230.1 17 9.1 7.3 10.7 98.6 241.1 136 14
LFKJ-3 11/14/2012 9:44 331.7 10.4 10.1 7.1 8.6 273.7 198 1
LFKJ-5 4/24/2007 15:15 20.8 9.5 7.8 8.4 116 290.5 167 7
LFKJ-5 5/15/2007 16:43 26 12.4 8.3 7.1 346.3 219 6
LFKJ-5 6/19/2007 15:57 28 9.7 8.2 8.9 98.9 565.5 358 10
LFKJ-5 7/26/2007 9:28 27.7 7.9 5.5 238 11
LFKJ-5 8/21/2007 16:19 31.1 11.8 8.5 5.4 82.3 548.2 357 10
LFKJ-5 9/18/2007 15:17 23.8 5.5 7.5 25.1 377.3 228 21
LFKJ-5 10/23/2007 16:51 20.7 7.3 7.6 11.3 220 665.9 350 9
LFKJ-5 4/18/2012 12:25 19.8 7.9 7.3 11 114 312 210 3
LFKJ-5 5/16/2012 12:46 22.7 7.7 7.5 15.6 287.6 234 8
LFKJ-5 6/19/2012 10:42 27.7 7.6 7.5 9.5 138 362.1 192 6
LFKJ-5 7/25/2012 13:17 29.6 5.4 7.2 12.3 241.2 244 6
LFKJ-5 8/21/2012 11:36 24.8 6 7.2 39.9 90 251.2 184 18
LFKJ-5 9/19/2012 12:08 22.9 6.9 7.4 50.3 294.2 202 22
LFKJ-5 10/16/2012 12:45 20.2 8.3 7.6 10 145 395.9 300 1 < MDL 1
LFKJ-6 6/29/2005 10:18 5 179 352 JH 6 JH
LFKJ-6 8/15/2005 10:00 4.4 137 262 5
LFKJ-6 10/18/2005 11:18 21.3 9.1 7.8 9.2 221 548 354 5
LFKJ-6 6/28/2006 10:40 28.6 8.6 8.1 6.4 208 531 335 8
LFKJ-6 8/8/2006 11:20 29.8 8.6 8.5 7.6 187 500 256 8
LFKJ-6 10/12/2006 11:15 21.7 7.4 7.9 7.5 136 349 208 11
LFKJ-6 6/13/2007 11:40 29.6 18.8 9.3 6.1 190 566 388 11
LFKJ-6 8/9/2007 11:40 30.8 12.3 9.1 6 153 390 285 13
LFKJ-6 10/10/2007 11:12 24.4 9.2 8.7 6 181 456 353 7
LFKJ-6 6/11/2008 11:00 30.3 14.5 9.1 6 130 355 220 8
LFKJ-6 8/14/2008 10:10 28.1 4.6 7.8 8.4 191 529 357 JQ1 18
LFKJ-6 10/14/2008 10:40 22.1 7.5 7.8 7.6 268 569 357 8
LFKJ-6 6/17/2009 12:15 25.2 7.6 7.5 43.8 109 272 199 43
LFKJ-6 8/19/2009 11:35 29.2 6.5 7.6 6.3 205 516 325 8
LFKJ-6 10/21/2009 11:30 14.1 9.9 6.9 17.8 116 276 189 18
LFKJ-6 5/5/2010 11:20 19.9 7.4 6.4 66.7 59.7 149 99 54
LFKJ-6 7/7/2010 11:00 29.7 12.5 8.6 6.8 434 272 9
LFKJ-6 9/8/2010 10:45 27 7.1 7.8 7.7 503 316 8
LFKJ-6 5/19/2011 13:45 20.4 13 8.4 7 140 346 224 4

Final Locust Fork and Village Creek TMDL Nutrients
86
STATION VISIT_DATEFlow
cfs
Temp,
Water c
Dissolved
Oxygen mg/l
pH
su
Turbidity
ntu
Hardness
mg/l
Conductivity
µmhos/cm
Solids,Total
Dissolved mg/l
DET_COND -
Solids, Total
Dissolved mg/l
Solids, Total
Suspended
mg/l
DET_COND -
Solids, Total
Suspended mg/l
LFKJ-6 7/21/2011 10:45 29.5 12 8.8 6.2 385 260 9
LFKJ-6 9/22/2011 11:30 20.9 7.4 6.6 91.8 141 122 46
LFKJ-6 4/18/2012 11:10 20.3 10.2 7.6 8 451.9 1 < MDL 1 4
LFKJ-6 5/16/2012 11:26 22.4 7.7 7.7 10.1 140 363.3 288 1 < MDL 1
LFKJ-6 6/19/2012 9:24 28.2 15.6 8.9 8.1 376 212 5
LFKJ-6 7/25/2012 12:08 29.9 9.6 8.4 6.5 367.2 392 2
LFKJ-6 8/21/2012 10:31 24.8 5.6 7.2 92.4 286.8 242 27
LFKJ-6 9/19/2012 10:55 24 6.7 7 12.9 387.7 234 15
LFKJ-6 10/16/2012 11:34 20.5 10.8 8.2 5.9 441.6 290 1 < MDL 1
LFKJ-6 11/29/2012 11:30 10.4 10.8 7.8 6 515 338 5
LFKJ-6 12/13/2012 11:20 11.4 10.2 7.6 18.7 186 125 9
BANT-3 8/16/2005 16:30 29.3 8.2 7.7 6.7 203 467.9 267 7
BANT-3 4/19/2006 11:25 22.8 11.4 8.5 7.8 285.7 184 13
BANT-3 5/17/2006 11:41 19.6 7.8 7.4 14.9 183.3 102 13
BANT-3 6/21/2006 11:33 29 6.4 7.4 11.2 452.3 267 10
BANT-3 7/19/2006 11:13 30.9 5.7 7.4 6.4 544.7 410 6
BANT-3 8/24/2006 12:16 30.7 8.3 8.3 10 501.8 256 10
BANT-3 9/20/2006 11:46 26.2 9.5 8.7 10.1 483.6 278 12
BANT-3 10/19/2006 12:35 20.4 7.1 7.7 10.6 415.6 224 11
BANT-3 4/17/2007 16:01 19.5 9.8 7.6 5.9 129 323.2 200 7
BANT-3 5/15/2007 13:51 25.6 8.7 7.7 5.9 304.5 200 8
BANT-3 6/19/2007 15:49 28.3 7 8.2 7.7 103 492.4 300 9
BANT-3 7/25/2007 14:35 29.2 6.2 8 7.2 559.2 308 8
BANT-3 8/21/2007 13:29 31.3 6.3 8 8.6 89.8 485.7 364 12
BANT-3 9/18/2007 13:43 27.6 10.2 8.7 8.3 607.8 335 9
BANT-3 10/23/2007 14:10 22.6 6.6 8 10.3 189 500.3 256 13.4
BANT-3 8/12/2009 11:15 29.5 9.4 8.1 6.4 147 421.6 250 6
BANT-3 4/20/2011 11:22 17.1 8.5 7.2 14 61.1 169.6 98 4
BANT-3 5/18/2011 14:06 22.3 7.9 7.6 16.6 392.3 260 19
BANT-3 6/23/2011 10:48 29.7 5 7.5 5.5 239 605.5 370 2
BANT-3 7/20/2011 11:00 30.8 9.3 8.2 7.5 416.1 376 5
BANT-3 8/24/2011 13:17 31.2 7.1 7.8 6.5 206 490.4 342 3
BANT-3 9/22/2011 10:53 21.5 6.5 7.1 102 159.3 154 41
BANT-3 10/13/2011 11:45 21 7.8 7.4 10.1 167 413.6 246 3
BANT-3 4/18/2012 16:02 21.7 8.8 7.8 5.9 159 395.5 274 7
BANT-3 5/16/2012 15:11 24.6 9.2 7.8 5.8 404.7 296 1 < MDL 1
BANT-3 6/19/2012 14:19 28.1 9.3 8.2 7.4 199 495.7 300 4
BANT-3 7/25/2012 14:37 33 14.4 8.6 7.2 583.6 370 4
BANT-3 8/22/2012 15:18 27.9 10.4 8.4 11.1 150 397.1 262 11
BANT-3 9/19/2012 15:20 25.6 7.6 7.8 7.8 402.4 276 1 < MDL 1
BANT-3 10/16/2012 14:22 21.5 9.2 7.9 5.9 137 341.4 208 2

Final Locust Fork and Village Creek TMDL Nutrients
87
STATION VISIT_DATEFlow
cfs
Temp,
Water c
Dissolved
Oxygen mg/l
pH
su
Turbidity
ntu
Hardness
mg/l
Conductivity
µmhos/cm
Solids,Total
Dissolved mg/l
DET_COND -
Solids, Total
Dissolved mg/l
Solids, Total
Suspended
mg/l
DET_COND -
Solids, Total
Suspended mg/l
VLGJ-5 6/29/2005 11:50 27 9.2 8.4 13.5 210 503 390 JH 19 JH
VLGJ-5 8/15/2005 11:15 109.2 27.7 10.1 8 6.1 312 724 588 5
VLGJ-5 10/18/2005 12:00 59.1 17.5 11.4 8.2 1.6 307 682 461 1 < MDL 1
VLGJ-5 6/28/2006 9:38 66.3 25.3 7.8 8 3.5 296 688 328 4
VLGJ-5 8/8/2006 10:30 62.9 28.4 8 8.8 9.6 258 614 398 13
VLGJ-5 10/12/2006 10:00 55.8 18.8 9.8 8.9 7.5 250 549 352 15
VLGJ-5 3/15/2007 11:25 89.8 17.6 10.5 8.2 1.8 621 456 7
VLGJ-5 4/3/2007 11:30 78.2 21.3 8 7.8 3.6 278 666 472 3
VLGJ-5 5/10/2007 11:25 62 22.9 8.8 8.1 2.2 629 408 4
VLGJ-5 6/13/2007 10:45 50.9 26.3 9.3 8.7 3.2 266 687 439 7
VLGJ-5 7/10/2007 12:55 76.2 27.7 9.3 8.4 5.6 543 394 6
VLGJ-5 8/9/2007 10:57 47.7 29.5 9 8.7 8.4 203 462 354 12
VLGJ-5 9/4/2007 12:25 45.8 27.2 10.9 8.9 9.7 485 412 14
VLGJ-5 10/10/2007 10:20 84.8 22.2 8.8 8.6 8.8 205 497 407 12
VLGJ-5 6/11/2008 10:25 28.2 7.8 8.2 8.6 194 493 295 13
VLGJ-5 8/14/2008 9:30 24.4 8.8 8.8 12.1 186 495 339 JQ1 17
VLGJ-5 10/14/2008 9:55 20.8 9.4 8.1 3.9 350 654 439 3
VLGJ-5 6/17/2009 11:20 24.9 8.9 7.8 12.3 185 420 298 16
VLGJ-5 8/19/2009 10:50 26.5 8.3 8.1 3.4 328 706 476 4
VLGJ-5 10/21/2009 10:45 15.5 10.2 7.9 3.6 358 689 519 4
VLGJ-5 5/5/2010 13:00 21.9 9.1 7.3 8.9 170 382 240 6
VLGJ-5 7/7/2010 12:20 69.4 28.6 9.1 8.2 3.8 655 426 3
VLGJ-5 9/8/2010 12:45 67.2 26.2 13.2 9.2 14.8 616 414 22
VLGJ-5 5/19/2011 11:15 75.5 18.8 10.8 8 2.1 327 700 482 1
VLGJ-5 7/21/2011 12:15 27.9 7.4 8.4 30.2 362 237 49
VLGJ-5 9/22/2011 13:00 22.9 9.7 7.8 7.4 481 312 7
VLGJ-5 4/25/2012 10:00 80.6 16.7 10 8.1 2.1 651 447 JH 3 JH
VLGJ-5 5/23/2012 13:15 94.9 25 10.1 8.3 3.8 216 493 332 4
VLGJ-5 6/25/2012 10:20 63.1 28 7.9 8.1 2.8 700 452 4
VLGJ-5 7/18/2012 10:20 27.6 8.3 8.6 8.6 553 362 12
VLGJ-5 8/30/2012 13:50 82.3 26.4 9.4 8.6 8.8 526 330 9
VLGJ-5 9/27/2012 12:50 84.6 22.8 10.6 8.4 2.7 537 361 5
VLGJ-5 10/24/2012 10:15 93.1 16.9 9.8 8.4 1.6 555 374 1 < MDL 1
VLGJ-5 11/28/2012 10:45 116.5 11.2 12.6 8.3 1.8 471 301 2
VLGJ-5 12/6/2012 10:00 80 14.4 10.9 8 1.2 550 343 1

Final Locust Fork and Village Creek TMDL Nutrients
88
STATION VISIT_DATEAlk,Total
mg/l
DET_COND -
Alk,Total mg/l
Clorides,
Total mg/l
DET_COND -
Clorides,
Total mg/l
Nitrogen,
Ammonia
mg/l
DET_COND -
Nitrogen, Ammonia
mg/l
Nitrogen,
NO2+NO3
mg/l
DET_COND -
Nitrogen,
NO2+NO3 mg/l
Nitrogen,
Total Kjeldahl
mg/l
DET_COND -
Nitrogen, Total
Kjeldahl mg/l
LFKB-15 4/12/2012 11:41 58.2 2.4 0.007 < MDL .007 0.355 0.334
LFKB-15 5/2/2012 14:34
LFKB-15 5/3/2012 11:50 87.6 2.3 0.007 < MDL .007 0.363 0.238
LFKB-15 6/7/2012 11:21 55.3 2.2 0.008 < MDL .008 0.343 0.284
LFKB-15 7/19/2012 11:31 81.3 2.2 0.069 0.341 0.245
LFKB-15 8/14/2012 17:15 73.7 2.2 0.008 < MDL .008 0.244 0.401
LFKB-15 9/12/2012 16:47 99.7 2.8 0.008 < MDL .008 0.308 0.216
LFKB-15 10/10/2012 16:54 71.3 3.4 0.053 0.348 0.051 JI
LFKB-15 11/14/2012 14:44 66.2 3.9 0.008 < MDL .008 0.138 0.178
LFKB-1 4/22/2008 11:40 41.5 5.7 0.015 < MDL .015 0.956 1.6
LFKB-1 5/14/2008 10:45 28 4.2 0.015 < MDL .015 1.3 0.887
LFKB-1 6/4/2008 11:30
LFKB-1 6/9/2008 10:50
LFKB-1 6/11/2008 9:51
LFKB-1 6/12/2008 11:00 58.9 12.6 0.015 < MDL .015 1.56 0.999
LFKB-1 6/16/2008 10:55
LFKB-1 6/23/2008 10:00
LFKB-1 7/10/2008 10:30 93.9 27.3 0.015 < MDL .015 2.56 1.82
LFKB-1 8/4/2008 10:30
LFKB-1 8/7/2008 10:30 118.2 42 0.092 5.36 0.06 < MDL .06
LFKB-1 8/11/2008 10:35
LFKB-1 8/18/2008 10:45
LFKB-1 8/20/2008 10:30
LFKB-1 9/3/2008 10:30 45.2 8.3 0.015 < MDL .015 1.52 0.303
LFKB-1 10/14/2008 10:50 83.5 48 0.01 < MDL .01 2.45 2.1
LFKB-1 11/5/2008 10:15 102.6 33 0.051 9.18 0.1 < MDL .1
LFKB-1 4/12/2012 10:25 41.2 6.2 0.007 < MDL .007 1.841 0.348
LFKB-1 5/3/2012 10:44 58.4 10.5 0.007 < MDL .007 2.223 0.425
LFKB-1 6/21/2012 8:16
LFKB-1 7/19/2012 10:14 51.2 8.8 0.049 1.817 0.415
LFKB-1 8/14/2012 15:25 49.8 14.9 0.008 < MDL .008 5.311 0.653
LFKB-1 8/16/2012 11:35
LFKB-1 9/12/2012 15:41 42.7 9.9 0.008 < MDL .008 3.859 0.404
LFKB-1 10/10/2012 15:37 43.3 8.4 0.008 < MDL .008 2.858 0.081 JI
LFKB-1 11/14/2012 13:36 56.3 11.8 0.008 < MDL .008 3.072 0.557
LFKB-2 4/12/2012 9:17 48.4 4.6 0.007 < MDL .007 0.895 0.344
LFKB-2 5/3/2012 9:42 65.1 6.9 0.007 < MDL .007 0.778 0.558
LFKB-2 6/7/2012 9:13 76.9 8.4 0.008 < MDL .008 0.859 0.368
LFKB-2 6/20/2012 14:48
LFKB-2 7/19/2012 9:10 45.7 9.3 0.035 1.438 0.542
LFKB-2 8/14/2012 13:37 40.3 3.5 0.05 0.815 0.534
LFKB-2 9/12/2012 14:07 45.1 5 0.008 < MDL .008 1.127 0.58

Final Locust Fork and Village Creek TMDL Nutrients
89
STATION VISIT_DATEAlk,Total
mg/l
DET_COND -
Alk,Total mg/l
Clorides,
Total mg/l
DET_COND -
Clorides,
Total mg/l
Nitrogen,
Ammonia
mg/l
DET_COND -
Nitrogen, Ammonia
mg/l
Nitrogen,
NO2+NO3
mg/l
DET_COND -
Nitrogen,
NO2+NO3 mg/l
Nitrogen,Total
Kjeldahl mg/l
DET_COND -
Nitrogen, Total
Kjeldahl mg/l
LFKB-2 10/10/2012 13:10 50 6.6 0.008 < MDL .008 1.174 0.133 JI
LFKB-2 11/14/2012 11:48 74.1 JQ 10.5 0.008 < MDL .008 2.422 0.358
LFKB-8 4/16/2008 13:40 53.5 4.6 0.015 < MDL .015 0.656 1.23
LFKB-8 5/20/2008 13:16 45.1 3.3 0.015 < MDL .015 0.679 0.762
LFKB-8 6/11/2008 15:58
LFKB-8 6/25/2008 10:15 75.8 6.8 0.015 < MDL .015 0.003 < MDL .003 1.21
LFKB-8 7/7/2008 11:12
LFKB-8 7/16/2008 9:00
LFKB-8 7/21/2008 9:00
LFKB-8 7/23/2008 9:35 90.9 8.9 0.079 0.023 0.536
LFKB-8 8/28/2008 9:15 29.7 2.8 0.015 < MDL .015 0.514 1
LFKB-8 9/8/2008 9:10
LFKB-8 9/17/2008 9:20 72.2 8.2 0.01 < MDL .01 0.187 0.227
LFKB-8 9/23/2008 9:35
LFKB-8 9/25/2008 9:09
LFKB-8 10/23/2008 9:45 113.9 12.1 0.01 < MDL .01 0.267 0.545
LFKB-8 11/6/2008 9:45 116.2 18 0.091 1.18 0.476
LFKB-8 4/11/2012 14:55 48.5 3.9 0.007 < MDL .007 0.694 0.234
LFKB-8 5/2/2012 14:16 70 5.9 0.007 < MDL .007 0.52 0.285
LFKB-8 6/6/2012 14:16 79.9 7.8 0.008 < MDL .008 0.002 < MDL .002 0.294
LFKB-8 6/20/2012 11:43
LFKB-8 7/18/2012 13:23 50.4 5.1 0.028 0.617 0.451
LFKB-8 8/14/2012 11:55 42.2 3.2 0.055 0.476 0.865
LFKB-8 9/12/2012 12:24 60 3.6 0.008 < MDL .008 0.846 0.36
LFKB-8 10/10/2012 11:26 55.9 5.4 0.008 < MDL .008 0.754 0.085 JI
LFKB-8 11/14/2012 10:42 74.9 9 0.008 < MDL .008 1.5 0.324
LFKJ-2 4/16/2008 11:40 50.2 4.2 0.015 < MDL .015 0.726 1.3
LFKJ-2 5/20/2008 12:15 44.4 3.5 0.015 < MDL .015 0.692 0.807
LFKJ-2 6/25/2008 11:45 83.7 6.3 0.015 < MDL .015 0.003 < MDL .003 1.38
LFKJ-2 7/7/2008 12:10
LFKJ-2 7/16/2008 9:45
LFKJ-2 7/21/2008 9:45
LFKJ-2 7/23/2008 10:30 113.9 11.3 0.015 < MDL .015 0.467 0.474
LFKJ-2 8/28/2008 10:00 27.8 2.9 0.015 < MDL .015 0.465 1.29
LFKJ-2 9/8/2008 9:55
LFKJ-2 9/17/2008 10:15 67.3 9.4 0.01 < MDL .01 0.182 0.259
LFKJ-2 9/23/2008 10:14
LFKJ-2 9/25/2008 9:50
LFKJ-2 10/23/2008 10:50 111.8 10.6 0.01 < MDL .01 0.171 0.389
LFKJ-2 11/6/2008 10:45 117.6 14.8 0.162 0.788 0.286
LFKJ-3 4/11/2012 13:31 61.1 3.6 0.007 < MDL .007 0.631 0.31

Final Locust Fork and Village Creek TMDL Nutrients
90
STATION VISIT_DATEAlk,Total
mg/l
DET_COND -
Alk,Total mg/l
Clorides,
Total mg/l
DET_COND -
Clorides,
Total mg/l
Nitrogen,
Ammonia
mg/l
DET_COND -
Nitrogen, Ammonia
mg/l
Nitrogen,
NO2+NO3
mg/l
DET_COND -
Nitrogen,
NO2+NO3 mg/l
Nitrogen,Total
Kjeldahl mg/l
DET_COND -
Nitrogen, Total
Kjeldahl mg/l
LFKJ-3 5/2/2012 13:11 85.3 5.4 0.007 < MDL .007 0.484 0.214
LFKJ-3 6/6/2012 13:00 87 5.3 0.008 < MDL .008 0.191 0.334
LFKJ-3 6/20/2012 7:43
LFKJ-3 7/18/2012 12:34 59.6 5.2 0.032 0.566 0.326
LFKJ-3 8/14/2012 10:33 50.8 4.1 0.008 < MDL .008 0.597 0.712
LFKJ-3 9/12/2012 11:24 68.8 3.5 0.008 < MDL .008 0.691 0.215
LFKJ-3 10/10/2012 10:10 70.4 5.3 0.009 JI 0.787 0.041 < MDL .041
LFKJ-3 11/14/2012 9:44 87.2 6.9 0.008 < MDL .008 0.936 0.424
LFKJ-5 4/24/2007 15:15 68.4 6.7 JH 0.015 < MDL .015 0.914 0.456
LFKJ-5 5/15/2007 16:43 79.9 9.5 0.015 < MDL .015 0.803 1.012
LFKJ-5 6/19/2007 15:57 112.1 15.8 0.063 0.273 0.624
LFKJ-5 7/26/2007 9:28 87 16.2 JH 0.015 < MDL .015 0.444 0.815
LFKJ-5 8/21/2007 16:19 101.7 21.4 0.015 < MDL .015 0.007 JI 1.565
LFKJ-5 9/18/2007 15:17 93.3 9.3 0.04 0.645 0.59
LFKJ-5 10/23/2007 16:51 122.1 23.9 0.015 < MDL .015 1.56 0.458
LFKJ-5 4/18/2012 12:25 74 6.3 0.01 JI 0.835 0.688
LFKJ-5 5/16/2012 12:46 83.1 5.2 0.008 < MDL .008 0.59 0.093 JI
LFKJ-5 6/19/2012 10:42 89 7.6 0.008 < MDL .008 0.408 0.234
LFKJ-5 7/25/2012 13:17 59 3.9 0.008 < MDL .008 0.577 0.497
LFKJ-5 8/21/2012 11:36 55.7 JQ 3.5 0.05 0.512 0.335
LFKJ-5 9/19/2012 12:08 77.4 3.6 0.008 < MDL .008 0.519 0.168
LFKJ-5 10/16/2012 12:45 92.3 7.5 0.008 < MDL .008 0.907 0.206
LFKJ-6 6/29/2005 10:18 93.7 0.015 < MDL .015 0.481 0.464
LFKJ-6 8/15/2005 10:00 78.6 0.015 < MDL .015 0.649 0.533
LFKJ-6 10/18/2005 11:18 117.5 0.015 < MDL .015 1.3 0.659
LFKJ-6 6/28/2006 10:40 109.1 13.2 0.084 0.514 1.24
LFKJ-6 8/8/2006 11:20 98.9 12.8 0.015 < MDL .015 0.242 1.54
LFKJ-6 10/12/2006 11:15 80.6 9.7 0.043 0.664 1.01
LFKJ-6 6/13/2007 11:40 83 16.8 0.015 < MDL .015 0.012 1.307
LFKJ-6 8/9/2007 11:40 86.6 18.1 0.015 < MDL .015 0.005 JI 0.758
LFKJ-6 10/10/2007 11:12 94.2 34.7 0.015 < MDL .015 0.023 0.433
LFKJ-6 6/11/2008 11:00 52.9 33 0.015 < MDL .015 0.003 < MDL .003 1.51
LFKJ-6 8/14/2008 10:10 118.6 18.4 0.204 0.281 1.14
LFKJ-6 10/14/2008 10:40 125.8 23.7 0.01 < MDL .01 0.571 2.14
LFKJ-6 6/17/2009 12:15 61.4 5.8 Not Reported .1, RQ 3.466 JQ Not Reported .1,RQ
LFKJ-6 8/19/2009 11:35 112 17.1 Not Reported .1, RQ 16.41 JQ Not Reported .1,RQ
LFKJ-6 10/21/2009 11:30 69.8 3.1 Not Reported .1, RQ 6.62 JB Not Reported .1,RQ
LFKJ-6 5/5/2010 11:20 33.3 3.1 Not Reported .015, RQ 0.552 Not Reported .1,RQ
LFKJ-6 7/7/2010 11:00 69.4 33.3 Not Reported .02, RQ 0.714 Not Reported .1,RQ
LFKJ-6 9/8/2010 10:45 84.2 30.2 Not Reported .015, RQ 0.727 Not Reported .1,RQ
LFKJ-6 5/19/2011 13:45 60 16.8 0.5 JQL 0.874 JH Not Reported .15,RQ

Final Locust Fork and Village Creek TMDL Nutrients
91
STATION VISIT_DATEAlk,Total
mg/l
DET_COND -
Alk,Total mg/l
Clorides,
Total mg/l
DET_COND -
Clorides,
Total mg/l
Nitrogen,
Ammonia
mg/l
DET_COND -
Nitrogen, Ammonia
mg/l
Nitrogen,
NO2+NO3
mg/l
DET_COND -
Nitrogen,
NO2+NO3 mg/l
Nitrogen,Total
Kjeldahl mg/l
DET_COND -
Nitrogen, Total
Kjeldahl mg/l
LFKJ-6 7/21/2011 10:45 66.2 21.1 0.5 JQL 0.602 JQ Not Reported .15,RQ
LFKJ-6 9/22/2011 11:30 24.3 10.7 0.5 JQL 0.394 Not Reported .15,RQ
LFKJ-6 4/18/2012 11:10 84.2 7 0.007 < MDL .007 0.902 0.836
LFKJ-6 5/16/2012 11:26 90.4 9.8 0.016 JI 1.196 0.313
LFKJ-6 6/19/2012 9:24 88.3 7.9 0.008 < MDL .008 0.081 0.683
LFKJ-6 7/25/2012 12:08 79.1 9.5 0.008 < MDL .008 0.875 0.55
LFKJ-6 8/21/2012 10:31 54.8 4.4 0.015 0.559 0.39
LFKJ-6 9/19/2012 10:55 98.6 8.3 0.035 1.186 0.504
LFKJ-6 10/16/2012 11:34 99.3 8.2 0.008 < MDL .008 1.327 0.496
LFKJ-6 11/29/2012 11:30 81.1 13.1 0.028 < MDL .028 1.86 0.412 JQ4
LFKJ-6 12/13/2012 11:20 21.8 3.8 0.028 < MDL .028 0.703 0.505
BANT-3 8/16/2005 16:30 84.8 9.9 0.015 < MDL .015 0.792 0.753
BANT-3 4/19/2006 11:25 59 1.5 0.029 0.943 0.829
BANT-3 5/17/2006 11:41 43.8 1.4 0.037 0.789 0.365
BANT-3 6/21/2006 11:33 96.2 9.1 0.065 0.502 0.745
BANT-3 7/19/2006 11:13 112.6 13.9 0.061 0.304 1.02
BANT-3 8/24/2006 12:16 106.8 10.9 0.015 < MDL .015 0.003 < MDL .003 1.44
BANT-3 9/20/2006 11:46 119.3 2.6 0.015 < MDL .015 0.003 0.747
BANT-3 10/19/2006 12:35 58 13.4 0.06 0.621 0.584
BANT-3 4/17/2007 16:01 72.6 55.9 JH 0.015 < MDL .015 0.919 0.561
BANT-3 5/15/2007 13:51 70.3 7.6 0.041 0.601 0.567
BANT-3 6/19/2007 15:49 103.9 12.8 0.034 0.089 0.723
BANT-3 7/25/2007 14:35 115.2 18.7 JH 0.02 0.327 0.702
BANT-3 8/21/2007 13:29 101.3 17.1 0.015 < MDL .015 0.053 0.513
BANT-3 9/18/2007 13:43 113.9 23.1 0.015 < MDL .015 0.529 0.657
BANT-3 10/23/2007 14:10 105.4 15.5 0.061 0.515 0.906
BANT-3 8/12/2009 11:15 92.7 7.3 0.039 0.622 0.626
BANT-3 4/20/2011 11:22 35 3 0.005 < MDL .005 0.827 0.7
BANT-3 5/18/2011 14:06 75 5.5 0.005 < MDL .005 0.693 0.719
BANT-3 6/23/2011 10:48 97.1 8.4 0.005 < MDL .005 0.605 0.282
BANT-3 7/20/2011 11:00 84.1 8 0.005 < MDL .005 0.567 0.68
BANT-3 8/24/2011 13:17 92.9 7.9 0.031 0.208 0.546
BANT-3 9/22/2011 10:53 44 2.5 0.005 < MDL .005 0.569 0.835
BANT-3 10/13/2011 11:45 70.6 5.6 0.007 < MDL .007 1.017 0.591
BANT-3 4/18/2012 16:02 78.4 5.7 0.121 0.595 0.703
BANT-3 5/16/2012 15:11 84.1 6.6 0.008 < MDL .008 0.746 0.636
BANT-3 6/19/2012 14:19 105 9.2 0.008 < MDL .008 0.271 0.553
BANT-3 7/25/2012 14:37 116 12.9 0.008 < MDL .008 0.153 0.844
BANT-3 8/22/2012 15:18 93.3 7.2 0.008 < MDL .008 0.363 0.512
BANT-3 9/19/2012 15:20 82.2 6.3 0.065 0.936 0.313
BANT-3 10/16/2012 14:22 73.9 6 0.008 < MDL .008 0.929 0.172

Final Locust Fork and Village Creek TMDL Nutrients
92
STATION VISIT_DATEAlk,Total
mg/l
DET_COND -
Alk,Total mg/l
Clorides,
Total mg/l
DET_COND -
Clorides,
Total mg/l
Nitrogen,
Ammonia
mg/l
DET_COND -
Nitrogen, Ammonia
mg/l
Nitrogen,
NO2+NO3
mg/l
DET_COND -
Nitrogen,
NO2+NO3 mg/l
Nitrogen,Total
Kjeldahl mg/l
DET_COND -
Nitrogen, Total
Kjeldahl mg/l
VLGJ-5 6/29/2005 11:50 150.5 0.015 < MDL .015 3.17 0.962
VLGJ-5 8/15/2005 11:15 144.6 0.015 < MDL .015 2.789 0.324
VLGJ-5 10/18/2005 12:00 134.4 0.015 < MDL .015 3.77 0.478
VLGJ-5 6/28/2006 9:38 136.8 20.2 0.022 2.857 0.848
VLGJ-5 8/8/2006 10:30 119.5 16.2 0.015 < MDL .015 1.11 1.18
VLGJ-5 10/12/2006 10:00 127.9 14.8 0.015 < MDL .015 1.132 1.45
VLGJ-5 3/15/2007 11:25 136.8 14.6 0.031 4.045 0.829
VLGJ-5 4/3/2007 11:30 131.8 16.4 0.108 4.162 0.543
VLGJ-5 5/10/2007 11:25 126.7 17.4 0.022 2.82 0.566
VLGJ-5 6/13/2007 10:45 131 22.6 0.015 < MDL .015 2.69 JB 0.855
VLGJ-5 7/10/2007 12:55 113 23.5 0.015 < MDL .015 2.83 0.764
VLGJ-5 8/9/2007 10:57 111 20.6 0.015 < MDL .015 1.45 0.721
VLGJ-5 9/4/2007 12:25 70.4 91.9 0.015 < MDL .015 2 2.66 JH
VLGJ-5 10/10/2007 10:20 104.2 43.5 0.015 < MDL .015 1.3 0.712
VLGJ-5 6/11/2008 10:25 133.1 14.9 0.015 < MDL .015 0.763 1.24
VLGJ-5 8/14/2008 9:30 75.5 48.2 0.088 0.979 1.76
VLGJ-5 10/14/2008 9:55 136.2 30.1 0.01 < MDL .01 1.16 2.03
VLGJ-5 6/17/2009 11:20 86 6.1 Not Reported .1, RQ 7.56 JQ Not Reported .1,RQ
VLGJ-5 8/19/2009 10:50 147 23.2 Not Reported .1, RQ 5.58 JQ Not Reported .1,RQ
VLGJ-5 10/21/2009 10:45 157 11.4 Not Reported .1, RQ 14.247 JB Not Reported .1,RQ
VLGJ-5 5/5/2010 13:00 77.4 5 Not Reported .015, RQ 1.653 Not Reported .1,RQ
VLGJ-5 7/7/2010 12:20 95.8 36.1 Not Reported .015, RQ 1.139 Not Reported .1,RQ
VLGJ-5 9/8/2010 12:45 79.7 54.1 Not Reported .015, RQ 1.415 Not Reported .1,RQ
VLGJ-5 5/19/2011 11:15 129.9 18.3 Not Reported .02, RQ 2.96 JH Not Reported .15,RQ
VLGJ-5 7/21/2011 12:15 70.9 24.5 0.5 JQL 0.953 JQ Not Reported .15,RQ
VLGJ-5 9/22/2011 13:00 78.9 22 0.5 JQL 2.27 Not Reported .15,RQ
VLGJ-5 4/25/2012 10:00 115 11.5 0.011 JH 6.11 JH 0.559
VLGJ-5 5/23/2012 13:15 78.2 9.7 0.01 < MDL .01 1.48 0.649
VLGJ-5 6/25/2012 10:20 109 11.6 0.01 < MDL .01 1.92 0.73
VLGJ-5 7/18/2012 10:20 94.4 18 0.028 < MDL .028, JH 2.21 JH 1.26
VLGJ-5 8/30/2012 13:50 85.9 11.9 0.028 < MDL .028 1.75 1.18
VLGJ-5 9/27/2012 12:50 Not Reported 10,X 7.5 0.028 < MDL .028 1.72 0.533
VLGJ-5 10/24/2012 10:15 94 10.2 0.028 < MDL .028, JQ4 2.73 0.426
VLGJ-5 11/28/2012 10:45 92.5 15.2 0.028 < MDL .028 3.37 0.59
VLGJ-5 12/6/2012 10:00 98 15.1 0.028 < MDL .028 3.99 0.57

Final Locust Fork and Village Creek TMDL Nutrients
93
STATION VISIT_DATE
Phosphorus,
Dissolved
Reactive mg/l
DET_COND -
Phosphorus, Dissolved
Reactive mg/l
Phosphorus,
Total mg/l
DET_COND -
Phosphorus, Total
mg/l
Chlorophyll
a mg/m^3
DET_COND -
Chlorophyll a
mg/m^3
CBOD-5
mg/l
DET_COND -
CBOD-5 mg/l
LFKB-15 4/12/2012 11:41 0.006 JI 0.02 0.27 2.4 JQ
LFKB-15 5/2/2012 14:34
LFKB-15 5/3/2012 11:50 0.008 JI 0.023 1.07 2.8 JQ
LFKB-15 6/7/2012 11:21 0.007 JI 0.028 0.71 2 < MDL 2
LFKB-15 7/19/2012 11:31 0.008 JI 0.029 0.53 2 < MDL 2
LFKB-15 8/14/2012 17:15 0.016 0.079 1.78 2 < MDL 2
LFKB-15 9/12/2012 16:47 0.007 JI 0.023 2.14 2 < MDL 2
LFKB-15 10/10/2012 16:54 0.006 JI 0.02 0.1 < MDL .1 2 < MDL 2
LFKB-15 11/14/2012 14:44 0.005 JI 0.028 0.27 2 < MDL 2
LFKB-1 4/22/2008 11:40 0.226 0.233 1 < MDL 1 1 < MDL 1
LFKB-1 5/14/2008 10:45 0.104 0.147 1 < MDL 1 1 < MDL 1
LFKB-1 6/4/2008 11:30
LFKB-1 6/9/2008 10:50
LFKB-1 6/11/2008 9:51
LFKB-1 6/12/2008 11:00 0.508 0.48 1 < MDL 1 1 < MDL 1
LFKB-1 6/16/2008 10:55
LFKB-1 6/23/2008 10:00
LFKB-1 7/10/2008 10:30 0.914 0.865 1 < MDL 1 1 < MDL 1
LFKB-1 8/4/2008 10:30
LFKB-1 8/7/2008 10:30 1.1 1.09 1 < MDL 1 1 < MDL 1
LFKB-1 8/11/2008 10:35
LFKB-1 8/18/2008 10:45
LFKB-1 8/20/2008 10:30
LFKB-1 9/3/2008 10:30 0.284 0.234 1 < MDL 1 1 < MDL 1
LFKB-1 10/14/2008 10:50 2.24 1.88 1 < MDL 1 1 < MDL 1
LFKB-1 11/5/2008 10:15 6.27 5.93 1 < MDL 1 1 < MDL 1
LFKB-1 4/12/2012 10:25 0.238 0.267 1.07 2.5 JQ
LFKB-1 5/3/2012 10:44 0.456 0.509 0.8 2.4 JQ
LFKB-1 6/21/2012 8:16
LFKB-1 7/19/2012 10:14 0.501 0.548 0.53 2 < MDL 2
LFKB-1 8/14/2012 15:25 0.911 0.967 1.07 2 < MDL 2
LFKB-1 8/16/2012 11:35
LFKB-1 9/12/2012 15:41 0.563 0.612 0.27 2 < MDL 2
LFKB-1 10/10/2012 15:37 0.372 0.398 0.1 < MDL .1 2 < MDL 2
LFKB-1 11/14/2012 13:36 0.653 0.669 0.27 2 < MDL 2
LFKB-2 4/12/2012 9:17 0.072 0.098 0.53 2 < MDL 2, JQ
LFKB-2 5/3/2012 9:42 0.116 0.15 1.6 2 < MDL 2, JQ
LFKB-2 6/7/2012 9:13 0.206 0.226 4.27 2 < MDL 2
LFKB-2 6/20/2012 14:48
LFKB-2 7/19/2012 9:10 0.29 0.323 1.34 2 < MDL 2
LFKB-2 8/14/2012 13:37 0.109 0.136 1.07 2 < MDL 2
LFKB-2 9/12/2012 14:07 0.243 0.283 0.1 < MDL .1 2 < MDL 2

Final Locust Fork and Village Creek TMDL Nutrients
94
STATION VISIT_DATE
Phosphorus,
Dissolved
Reactive mg/l
DET_COND -
Phosphorus, Dissolved
Reactive mg/l
Phosphorus,
Total mg/l
DET_COND -
Phosphorus, Total
mg/l
Chlorophyll
a mg/m^3
DET_COND -
Chlorophyll a
mg/m^3
CBOD-5
mg/l
DET_COND -
CBOD-5 mg/l
LFKB-2 10/10/2012 13:10 0.18 0.202 0.27 2 < MDL 2
LFKB-2 11/14/2012 11:48 0.438 0.455 0.53 2 < MDL 2
LFKB-8 4/16/2008 13:40 0.064 0.006 < MDL .006 1 < MDL 1 1 < MDL 1
LFKB-8 5/20/2008 13:16 0.058 0.086 1 < MDL 1 1 < MDL 1
LFKB-8 6/11/2008 15:58
LFKB-8 6/25/2008 10:15 0.038 0.05 4.54 1 < MDL 1
LFKB-8 7/7/2008 11:12
LFKB-8 7/16/2008 9:00
LFKB-8 7/21/2008 9:00
LFKB-8 7/23/2008 9:35 0.04 0.048 1.87 1 < MDL 1
LFKB-8 8/28/2008 9:15 0.073 0.173 1.07 1.2 JQ
LFKB-8 9/8/2008 9:10
LFKB-8 9/17/2008 9:20 0.064 0.027 2.14 1 < MDL 1
LFKB-8 9/23/2008 9:35
LFKB-8 9/25/2008 9:09
LFKB-8 10/23/2008 9:45 0.069 0.058 1 < MDL 1 1 < MDL 1
LFKB-8 11/6/2008 9:45 0.082 0.041 1.07 1 < MDL 1
LFKB-8 4/11/2012 14:55 0.041 0.063 0.36 2 < MDL 2, JQ
LFKB-8 5/2/2012 14:16 0.058 0.087 2.85 2 < MDL 2, JQ
LFKB-8 6/6/2012 14:16 0.061 0.113 29.9 2 < MDL 2
LFKB-8 6/20/2012 11:43
LFKB-8 7/18/2012 13:23 0.135 0.174 4.54 2 < MDL 2
LFKB-8 8/14/2012 11:55 0.103 0.186 1.6 2 < MDL 2
LFKB-8 9/12/2012 12:24 0.142 0.181 1.6 2 < MDL 2
LFKB-8 10/10/2012 11:26 0.117 0.143 1.6 2 < MDL 2
LFKB-8 11/14/2012 10:42 0.234 0.251 0.53 2 < MDL 2
LFKJ-2 4/16/2008 11:40 0.079 0.097 1 < MDL 1 1 < MDL 1
LFKJ-2 5/20/2008 12:15 0.061 0.109 1.6 1 < MDL 1
LFKJ-2 6/25/2008 11:45 0.033 0.044 9.34 1 < MDL 1
LFKJ-2 7/7/2008 12:10
LFKJ-2 7/16/2008 9:45
LFKJ-2 7/21/2008 9:45
LFKJ-2 7/23/2008 10:30 0.052 0.06 7.74 1
LFKJ-2 8/28/2008 10:00 0.075 0.187 2.14 1.1 JQ
LFKJ-2 9/8/2008 9:55
LFKJ-2 9/17/2008 10:15 0.057 0.019 2.4 1 < MDL 1
LFKJ-2 9/23/2008 10:14
LFKJ-2 9/25/2008 9:50
LFKJ-2 10/23/2008 10:50 0.061 0.051 2.14 1 < MDL 1
LFKJ-2 11/6/2008 10:45 0.046 0.002 < MDL .002 1.87 1 < MDL 1
LFKJ-3 4/11/2012 13:31 0.023 0.042 2.14 2 < MDL 2, JQ

Final Locust Fork and Village Creek TMDL Nutrients
95
STATION VISIT_DATE
Phosphorus,
Dissolved
Reactive mg/l
DET_COND -
Phosphorus, Dissolved
Reactive mg/l
Phosphorus,
Total mg/l
DET_COND -
Phosphorus, Total
mg/l
Chlorophyll
a mg/m^3
DET_COND -
Chlorophyll a
mg/m^3
CBOD-5
mg/l
DET_COND -
CBOD-5 mg/l
LFKJ-3 5/2/2012 13:11 0.015 0.041 11.21 4.4 JQ
LFKJ-3 6/6/2012 13:00 0.024 0.054 12.1 2 < MDL 2
LFKJ-3 6/20/2012 7:43
LFKJ-3 7/18/2012 12:34 0.093 0.128 10.15 2 < MDL 2
LFKJ-3 8/14/2012 10:33 0.077 0.117 JM 16.02 2 < MDL 2
LFKJ-3 9/12/2012 11:24 0.063 0.099 4.98 2 < MDL 2
LFKJ-3 10/10/2012 10:10 0.096 0.13 0.8 2 < MDL 2
LFKJ-3 11/14/2012 9:44 0.087 0.115 1.07 2 < MDL 2
LFKJ-5 4/24/2007 15:15 0.02 0.064 11.75 JH 2.6
LFKJ-5 5/15/2007 16:43 0.018 0.075 30.44 2.1
LFKJ-5 6/19/2007 15:57 0.004 0.063 43.25 1.5
LFKJ-5 7/26/2007 9:28 0.019 0.067 38.45 1 < MDL 1
LFKJ-5 8/21/2007 16:19 0.007 JI 0.061 49.13 JH 1 < MDL 1
LFKJ-5 9/18/2007 15:17 0.035 0.058 1.07 1 < MDL 1
LFKJ-5 10/23/2007 16:51 0.03 0.056 24.56 1.9
LFKJ-5 4/18/2012 12:25 0.017 0.049 4.27 2 < MDL 2
LFKJ-5 5/16/2012 12:46 0.027 0.064 3.74 2 < MDL 2
LFKJ-5 6/19/2012 10:42 0.005 JI 0.036 6.41 2 < MDL 2, JQ
LFKJ-5 7/25/2012 13:17 0.021 0.059 8.54 2 < MDL 2
LFKJ-5 8/21/2012 11:36 0.021 0.062 4.45 2 < MDL 2
LFKJ-5 9/19/2012 12:08 0.031 0.097 3.56 2 < MDL 2
LFKJ-5 10/16/2012 12:45 0.023 0.062 0.53 2 < MDL 2
LFKJ-6 6/29/2005 10:18 0.004 0.1 < MDL .1 23 1.7
LFKJ-6 8/15/2005 10:00 0.005 0.1 < MDL .1 21.9 JH Not Reported , F
LFKJ-6 10/18/2005 11:18 0.033 0.1 < MDL .1 78 0.5
LFKJ-6 6/28/2006 10:40 0.006 0.102 98.7 2.8
LFKJ-6 8/8/2006 11:20 0.004 < MDL .004 0.172 37.8 3.1
LFKJ-6 10/12/2006 11:15 0.048 0.165 16.6 1.5
LFKJ-6 6/13/2007 11:40 0.009 0.049 21.1 7.8
LFKJ-6 8/9/2007 11:40 0.013 0.063 17.6 2.6
LFKJ-6 10/10/2007 11:12 0.005 < MDL .005 0.013 26.2 1.7
LFKJ-6 6/11/2008 11:00 0.006 0.041 38.4 5.1
LFKJ-6 8/14/2008 10:10 0.03 0.066 13.4 1 < MDL 1
LFKJ-6 10/14/2008 10:40 0.038 0.086 9.08 1 < MDL 1
LFKJ-6 6/17/2009 12:15 0.048 JQ Not Reported .01, RQ 5.34 1 < MDL 1
LFKJ-6 8/19/2009 11:35 0.008 < MDL .008, JQ Not Reported .01, RQ 21.9 2.5
LFKJ-6 10/21/2009 11:30 0.008 < MDL .008, JQ Not Reported .01, RQ 1 < MDL 1 1 < MDL 1
LFKJ-6 5/5/2010 11:20 0.026 JQ Not Reported .01, RQ 3.2 1 < MDL 1
LFKJ-6 7/7/2010 11:00 0.003 < MDL .003, JQ Not Reported .01, RQ 25.6 1.5 JI
LFKJ-6 9/8/2010 10:45 0.003 < MDL .003, JQ Not Reported .01, RQ 21.4 1.3 JI
LFKJ-6 5/19/2011 13:45 0.004 JI Not Reported .01, RQ 27.77 2.3

Final Locust Fork and Village Creek TMDL Nutrients
96
STATION VISIT_DATE
Phosphorus,
Dissolved
Reactive mg/l
DET_COND -
Phosphorus, Dissolved
Reactive mg/l
Phosphorus,
Total mg/l
DET_COND -
Phosphorus, Total
mg/l
Chlorophyll
a mg/m^3
DET_COND -
Chlorophyll a
mg/m^3
CBOD-5
mg/l
DET_COND -
CBOD-5 mg/l
LFKJ-6 7/21/2011 10:45 0.017 JQ Not Reported .01, RQ 36.3 JH 2.2
LFKJ-6 9/22/2011 11:30 0.02 Not Reported .01, RQ 1 < MDL 1 1 < MDL 1
LFKJ-6 4/18/2012 11:10 0.007 JI 0.05 25.63 2 < MDL 2
LFKJ-6 5/16/2012 11:26 0.075 0.116 0.1 < MDL .1 2.2
LFKJ-6 6/19/2012 9:24 0.005 JI 0.055 15.49 2.3 JQ
LFKJ-6 7/25/2012 12:08 0.037 0.103 32.04 2 < MDL 2
LFKJ-6 8/21/2012 10:31 0.017 0.054 5.34 2 < MDL 2
LFKJ-6 9/19/2012 10:55 0.039 0.089 12.28 2 < MDL 2
LFKJ-6 10/16/2012 11:34 0.039 0.085 1.07 2 < MDL 2
LFKJ-6 11/29/2012 11:30 0.048 0.096 JQ4 3.2 2 < MDL 2
LFKJ-6 12/13/2012 11:20 0.074 0.096 2.14 2 < MDL 2
BANT-3 8/16/2005 16:30 0.004 < MDL .004 0.092 18.69 JH 2.2
BANT-3 4/19/2006 11:25 0.017 0.048 21.63 3.8
BANT-3 5/17/2006 11:41 0.006 0.041 4.27 1 < MDL 1
BANT-3 6/21/2006 11:33 0.004 < MDL .004 0.1 < MDL .1 12.3 1.4
BANT-3 7/19/2006 11:13 0.004 < MDL .004 0.1 < MDL .1 41.1 1.7
BANT-3 8/24/2006 12:16 0.004 < MDL .004 0.1 < MDL .1 40.9 2.1
BANT-3 9/20/2006 11:46 0.01 0.056 48.59 1.4
BANT-3 10/19/2006 12:35 0.04 0.087 10.68 2.1
BANT-3 4/17/2007 16:01 0.013 JH 0.054 15.49 2.7
BANT-3 5/15/2007 13:51 0.004 < MDL .004 0.039 13.88 2.6
BANT-3 6/19/2007 15:49 0.005 0.036 30.44 JH 1.1
BANT-3 7/25/2007 14:35 0.009 0.03 42.19 1 < MDL 1
BANT-3 8/21/2007 13:29 0.009 JI 0.055 18.16 JH 2
BANT-3 9/18/2007 13:43 0.015 0.057 48.06 1 < MDL 1
BANT-3 10/23/2007 14:10 0.016 0.052 22.43 2.4
BANT-3 8/12/2009 11:15 0.009 JI 0.053 24.56 2 < MDL 2
BANT-3 4/20/2011 11:22 0.025 0.045 2.67 2 < MDL 2
BANT-3 5/18/2011 14:06 0.006 JI 0.032 2.67 2 < MDL 2
BANT-3 6/23/2011 10:48 0.003 JI 0.026 15.13 2 < MDL 2
BANT-3 7/20/2011 11:00 0.004 JI 0.041 29.9 3.5
BANT-3 8/24/2011 13:17 0.007 JI 0.036 25.63 2.8
BANT-3 9/22/2011 10:53 0.02 0.112 3.56 2 < MDL 2
BANT-3 10/13/2011 11:45 0.008 JI 0.025 2.67 2 < MDL 2
BANT-3 4/18/2012 16:02 0.006 JI 0.031 11.75 2 < MDL 2
BANT-3 5/16/2012 15:11 0.013 0.047 6.94 3.4
BANT-3 6/19/2012 14:19 0.005 < MDL .005 0.038 10.15 2 < MDL 2, JQ
BANT-3 7/25/2012 14:37 0.006 JI 0.046 38.72 2.7
BANT-3 8/22/2012 15:18 0.01 0.041 21.36 2 < MDL 2
BANT-3 9/19/2012 15:20 0.028 0.06 9.08 2 < MDL 2
BANT-3 10/16/2012 14:22 0.02 0.047 7.83 2 < MDL 2

Final Locust Fork and Village Creek TMDL Nutrients
97
STATION VISIT_DATE
Phosphorus,
Dissolved Reactive
mg/l
DET_COND - Phosphorus,
Dissolved Reactive mg/l
Phosphorus,
Total mg/l
DET_COND -
Phosphorus, Total
mg/l
Chlorophyll a
mg/m^3
DET_COND -
Chlorophyll a
mg/m^3
CBOD-5
mg/l
DET_COND -
CBOD-5 mg/l
VLGJ-5 6/29/2005 11:50 0.158 0.268 73.2 3.2
VLGJ-5 8/15/2005 11:15 0.145 0.151 2.14 JH Not Reported , F
VLGJ-5 10/18/2005 12:00 0.248 0.343 1 < MDL 1 0.3
VLGJ-5 6/28/2006 9:38 0.326 0.348 47 0.8
VLGJ-5 8/8/2006 10:30 0.193 0.275 11.7 1.6
VLGJ-5 10/12/2006 10:00 0.175 0.235 19.2 2.3
VLGJ-5 3/15/2007 11:25 0.222 0.248 8.81 3.8
VLGJ-5 4/3/2007 11:30 0.351 0.395 2.94 1.2
VLGJ-5 5/10/2007 11:25 0.278 0.453 1 < MDL 1 1.3
VLGJ-5 6/13/2007 10:45 0.242 0.272 5.61 1.1
VLGJ-5 7/10/2007 12:55 0.478 0.517 5.07 1
VLGJ-5 8/9/2007 10:57 0.3 0.396 13.2 1.5
VLGJ-5 9/4/2007 12:25 0.397 0.294 JH 12.3 2.4
VLGJ-5 10/10/2007 10:20 0.275 0.205 15 1.6
VLGJ-5 6/11/2008 10:25 0.164 0.199 6.41 1.2
VLGJ-5 8/14/2008 9:30 0.176 0.237 24.6 1 < MDL 1
VLGJ-5 10/14/2008 9:55 0.253 0.243 4.27 1 < MDL 1
VLGJ-5 6/17/2009 11:20 0.083 JQ Not Reported .01, RQ 9.61 1 < MDL 1
VLGJ-5 8/19/2009 10:50 0.194 JQ Not Reported .01, RQ 4 1 < MDL 1
VLGJ-5 10/21/2009 10:45 0.016 JQ Not Reported .01, RQ 1 < MDL 1 1 < MDL 1
VLGJ-5 5/5/2010 13:00 0.157 JQ Not Reported .01, RQ 3.2 1 < MDL 1
VLGJ-5 7/7/2010 12:20 0.074 JQ Not Reported .01, RQ 4.27 1 < MDL 1
VLGJ-5 9/8/2010 12:45 0.041 JQ Not Reported .01, RQ 44.9 3.1
VLGJ-5 5/19/2011 11:15 0.036 Not Reported .01, RQ 2.4 1 < MDL 1
VLGJ-5 7/21/2011 12:15 0.067 JQ Not Reported .01, RQ 12.5 JH 2.8
VLGJ-5 9/22/2011 13:00 0.075 Not Reported .01, RQ 6.41 1 < MDL 1
VLGJ-5 4/25/2012 10:00 0.127 0.152 1 < MDL 1 1 < MDL 1
VLGJ-5 5/23/2012 13:15 0.091 0.126 JQ 3.2 2 < MDL 2
VLGJ-5 6/25/2012 10:20 0.198 0.236 1.6 2 < MDL 2
VLGJ-5 7/18/2012 10:20 0.297 0.405 19.8 2 < MDL 2
VLGJ-5 8/30/2012 13:50 0.096 0.175 25.6 2 < MDL 2
VLGJ-5 9/27/2012 12:50 0.102 0.107 4.54 2 < MDL 2
VLGJ-5 10/24/2012 10:15 0.186 JQ4 0.207 1.6 2 < MDL 2
VLGJ-5 11/28/2012 10:45 0.231 0.249 1.6 2 < MDL 2
VLGJ-5 12/6/2012 10:00 0.231 0.252 2.49 2 < MDL 2
Code Description
F An unforeseeable equipment failure occurred during the laboratory analysis for this parameter.
JB The identification of the analyte is acceptable; the reported value is an estimate. Sample was not diluted; reported result is beyond (higher) the highest standard on the calibration curve
JH The identification ofthe analyte is acceptable; the reported value is an estimate. The analytical holding times for analysis are exceeded. Micro: Reported microbiological result is an estimate. The analytical holding time for analysis was
exceeded.
JI The identification of the analyte is acceptable; the reported value is an estimate. The reported value is between the method detection limit and the practical Quantitation limit.
JM The identification of the analyte is acceptable; the reported value is an estimate. The sample matrix interference precludes accurate determination.
JQ The identification of the analyte is acceptable; the reported value is an estimate. The reported value failed to meet established QC criteria.
JQ1 The identification of the analyte is acceptable; the reported value is an estimate. Laboratory Control Sample (LCS) / Laboratory Fortified Blank (LFB) recovery is outside control limits.
JQ4 The identification of the analyte is acceptable; the reported value is an estimate. Matrix spike recovery is outside control limits
JQ6 The identification ofthe analyte is acceptable; the reported value is an estimate. Spurious contamination or reagent contamination is evident at a level that affects accuracy
RQ The presence or absence ofthe analyte can not be determined from the data due to quality control problems. The reported value failed to meet established QC criteria.

Final Locust Fork and Village Creek TMDL Nutrients
98
Appendix B
Alabama Ecoregional Reference Guideline Concentration Calculation
Locust Fork (LFKJ-3)
Village Creek (VLGJ-5)

Final Locust Fork and Village Creek TMDL Nutrients
99
Figure B.1 2010 Alabama Ecoregional Reference Guideline Concentrations

Final Locust Fork and Village Creek TMDL Nutrients
100
Figure B.2 Ecoregional Reference Guideline Concentrations Calculation
Level IV Ecoregion Station LFKJ-3 Watershed 2010 Ecoregional Reference Guideline
Watershed Area (mi2)
Watershed %
Total Phosphorus (mg/l)
Total Nitrogen (mg/l)
68c - Plateau Escarpment 1.5 0.2% 0.050 1.417
68b - Sequatchie Valley 30.2 3.5% 0.050 1.417
68d - Southern Table Plateaus 475.7 55.0% 0.049 2.269
67f - Southern Limestone/Dolomite Valleys and Low Rolling Hills
139.2 16.1% 0.051 0.684
68e - Dissected Plateau 60.2 7.0% 0.050 0.919
68f - Shale Hills 158.0 18.3% 0.050 1.417
Total Phosphorus
(mg/l) Total Nitrogen
(mg/l)
Weighted Average Ecoregional Reference Guideline Concentration for LFKJ-3 0.050 1.733
Level IV Ecoregion Station VLGJ-5 Watershed 2010 Ecoregional Reference Guideline
Watershed Area (mi2)
Watershed %
Total Phosphorus (mg/l)
Total Nitrogen (mg/l)
Chlorophyll a (ug/l)
67f - Southern Limestone/Dolomite Valleys and Low Rolling Hills
37.7 39.1% 0.051 0.684 2.562
68f - Shale Hills 58.6 60.9% 0.050 1.417 2.670
Total Phosphorus
(mg/l) Total Nitrogen
(mg/l) Chlorophyll a
(ug/l)
Weighted Average Ecoregional Reference Guideline Concentration for VLGJ-5 0.051 1.130 2.628

Final Locust Fork and Village Creek TMDL Nutrients
101
Appendix C
Bankhead and Locust Fork 72hr Diurnal Study August 2016
During the month of August in 2016, the Department conducted a 72 hour diurnal study to
continuously monitor instream water quality conditions at several stations in the Bankhead
Reservoir and also the Locust Fork tributary embayment. Datasondes were deployed at each
station at a depth of five feet and programmed to collect water quality data on a 15 minute time
interval. The results of the study illustrate eutrophic conditions at both Locust Fork tributary
embayment stations (BANT-3 and LFKJ-6), as indicated by the supersaturated dissolved oxygen
concentrations and also pH levels elevated above criteria values. The healthy instream water
quality conditions at station BANT-4, located in the main river channel of the Mulberry Fork just
upstream of the confluence with the Locust Fork, serve as a guideline for comparison. Reference
Figure 6.1.1 Bankhead Lake and major tributaries for a map depicting the locations of the stations
included in the study.

Final Locust Fork and Village Creek TMDL Nutrients
102
Figure C.1 Bankhead and Locust Fork Diurnal Study August 2016 - Dissolved Oxygen Results
Figure C.2 Bankhead and Locust Fork Diurnal Study August 2016 – ODO % Saturation Results
0
2
4
6
8
10
12
14
16
18
DO
(M
G/L
)LFKJ-6 BANT-4 BANT-3 BANT-2 BANT-1
0
50
100
150
200
250
OD
O S
ATU
RA
TIO
N (
%)
LFKJ-6 BANT-4 BANT-3 BANT-2 BANT-1

Final Locust Fork and Village Creek TMDL Nutrients
103
Figure C.3 Bankhead and Locust Fork Diurnal Study August 2016 – Temperature Results
Figure C.4 Bankhead and Locust Fork Diurnal Study August 2016 – pH Results
30
30.5
31
31.5
32
32.5
33
TEM
PER
ATU
RE
(C)
LFKJ-6 BANT-4 BANT-3 BANT-2 BANT-1
8
8.2
8.4
8.6
8.8
9
9.2
9.4
PH
LFKJ-6 BANT-3 BANT-2 BANT-1

Final Locust Fork and Village Creek TMDL Nutrients
104
Appendix D
NPDES Wastewater Discharges – DMR Summaries

Final Locust Fork and Village Creek TMDL Nutrients
105
Table D.1 NPDES Wastewater Discharger DMR Summary - Model Network Simulation Period (2007 – 2012)
a. Calculated TP Load (ppd) = LTA Flow (MGD) x LTA TP(mg/l) x 8.34 b. For any months without TP data, an average of the available data set (i.e., quarterly monitoring results, permit application data, etc.) was used to
represent most probable discharge concentrations.
Facility Name Permit # Type Receiving
Waterbody Design Flow
(MGD) TMDL Class
LTA Flow (mgd)
2012-2016
LTA / Design
Calculated TP Load (ppd) a 2007-2012
LTA TP b
(mg/l) 2007-2012
Jefferson County Village Creek WWTP-11 AL0023647 Municipal Village Creek 60.0 1 21.27 35% 262.66 1.48
Jefferson County Village Creek WWTP-21 AL0023647 Municipal Village Creek 60.0 1 16.84 28% 123.53 0.88
Jefferson County Fivemile Creek WWTP AL0026913 Municipal Fivemile Creek 30.0 1 11.34 38% 94.46 1.00
Boaz Slab Creek WWTP AL0049603 Municipal Slab Creek UT 6.10 1 3.16 52% 313.93 11.91
Walter Coke Inc. AL0003247 Industrial Fivemile Creek 5.63 1 4.89 87% 46.28 1.13
Jefferson County Turkey Creek WWTP AL0022926 Municipal Turkey Creek 5.00 1 3.92 78% 30.59 0.94
Oneonta WWTP AL0049549 Municipal Mill Creek 2.20 1 0.95 43% 18.88 2.38
Tyson Foods Blountsville AL0001449 Industrial Graves Creek 1.5 1 1.25 83% 210.45 20.25
Jefferson County Prudes Creek WWTP AL0056120 Municipal Fivemile Creek 0.90 2 0.32 35% 3.12 1.18
Morris Manor Apartments WWTP AL0053121 Municipal Turkey Creek 0.50 2 0.005 1% 0.05 1.30
ABC Coke AL0003417 Industrial Fivemile Creek 0.3 2 0.32 108% 0.60 0.22
CMC Steel Alabama AL0001554 Industrial Village Creek UT 0.41 2 0.37 89% N/A N/A
Snead WWTP AL0058572 Municipal Locust Fork 0.15 2 0.12 77% 0.12 0.12
Cleveland WWTP AL0073261 Municipal Dry Creek UT 0.15 2 0.11 71% 1.27 1.44
Warrior WWTP AL0050881 Municipal Cane Creek 0.10 2 0.09 91% 2.06 2.71
County Line Industrial Park WWTP AL0071170 Municipal Longs Branch 0.02 / 0.099 3 0.001 1% 0.04 3.38
Peachtree Crossing Mobile Home Park AL0051055 Municipal Black Creek UT 0.090 3 0.057 64% 0.09 0.19
West Blount Lagoon AL0076261 Municipal Hogeland Creek 0.090 3 0.018 20% 0.03 0.19
Altoona Lagoon AL0021237 Municipal Locust Fork 0.16 / 0.07 3 0.155 97% 3.16 2.45
Forestdale MHP AL0027642 Municipal Fivemile Creek 0.030 3 N/A N/A N/A N/A
Susan Moore High School AL0050563 Municipal Locust Fork UT 0.030 3 0.006 20% 0.05 1.06
The Cove Mobile Home Park AL0056553 Municipal Turkey Creek 0.024 3 0.002 8% 0.04 2.60
Locust Fork High School Lagoon AL0054348 Municipal Blackburn Fork 0.022 3 0.003 14% 0.05 2.03
Brookside Village WWTP AL0062251 Municipal Newfound Creek 0.022 3 0.008 36% 0.06 0.90
Dixie-Manor Housing Project AL0032301 Municipal Self Creek UT 0.020 3 0.010 50% 0.12 1.50
Bottenfield Junior High School AL0051161 Municipal Prudes Creek UT 0.017 3 0.006 32% 0.09 2.05
Bradford Parkside Health Services WWTP AL0047546 Municipal Thomas Creek 0.015 3 0.009 59% 0.28 3.84
River Bend Townhouses WWTP AL0054011 Municipal Turkey Creek 0.015 3 0.004 30% 0.04 1.18
North Jefferson Middle School WWTP AL0075256 Municipal Lick Creek 0.012 3 0.003 21% 0.04 2.02
Johnson Elementary School Lagoon AL0051195 Municipal Self Creek UT 0.010 3 N/A N/A N/A N/A
Southeastern Elementary School AL0068675 Municipal Campbell Creek 0.005 3 0.004 83% 0.10 2.85
Sharon Heights MHP AL0057827 Municipal Fivemile Creek 0.003 3 N/A N/A N/A N/A

Final Locust Fork and Village Creek TMDL Nutrients
106
Table D.2 NPDES Wastewater Discharger DMR Summary 2012 – 2016
Facility Name Permit # Type Receiving
Waterbody Design Flow
(MGD) TMDL Class
LTA Flow (mgd) 2012-2016
LTA / Design
Actual LTA TP Load a
(ppd) 2012-2016
LTA TP b (mg/l) 2012-2016
Jefferson County Village Creek WWTP-11 AL0023647 - 11 Municipal Village Creek 60.00 1 22.31 37% 253.31 1.36
Jefferson County Village Creek WWTP-21 AL0023647 - 21 Municipal Village Creek 60.00 1 12.87 21% 113.90 1.06
Jefferson County Fivemile Creek WWTP AL0026913 Municipal Fivemile Creek 30.00 1 13.01 43% 113.63 1.05
Boaz Slab Creek WWTP AL0049603 Municipal Slab Creek UT 4.88 1 3.15 64% 209.17 7.97
Walter Coke Inc. AL0003247 Industrial Fivemile Creek 4.73 1 4.37 92% N/A N/A
Jefferson County Turkey Creek WWTP AL0022926 Municipal Turkey Creek 5.00 1 5.05 101% 23.39 0.56
Oneonta WWTP AL0049549 Municipal Mill Creek 2.20 1 1.04 47% 39.14 4.52
Tyson Foods Blountsville AL0001449 Industrial Graves Creek 1.34 1 1.35 101% 244.26 21.76
Jefferson County Prudes Creek WWTP AL0056120 Municipal Fivemile Creek 0.90 2 0.40 44% 2.77 0.83
Morris Manor Apartments WWTP AL0053121 Municipal Turkey Creek 0.10 2 0.01 11% 0.15 1.74
ABC Coke AL0003417 Industrial Fivemile Creek 0.40 2 0.37 92% 0.58 0.19
CMC Steel Alabama AL0001554 Industrial Village Creek UT 0.38 2 0.50 132% N/A N/A
Snead WWTP AL0058572 Municipal Locust Fork 0.15 2 0.11 71% 0.06 0.07
Cleveland WWTP AL0073261 Municipal Dry Creek UT 0.15 2 0.12 77% 5.37 5.55
Warrior WWTP AL0050881 Municipal Cane Creek 0.10 2 0.09 93% 1.94 2.49
County Line Industrial Park WWTP AL0071170 Municipal Longs Branch 0.02 / 0.099 3 0.001 7% 0.046 3.97
Peachtree Crossing Mobile Home Park AL0051055 Municipal Black Creek UT 0.090 3 0.058 65% 1.201 4.42
West Blount Lagoon AL0076261 Municipal Hogeland Creek 0.090 3 0.017 19% 0.073 0.27
Altoona Lagoon AL0021237 Municipal Locust Fork 0.16 / 0.07 3 0.107 67% 0.889 1.56
Forestdale MHP AL0027642 Municipal Fivemile Creek 0.030 3 N/A N/A N/A N/A
Susan Moore High School AL0050563 Municipal Locust Fork UT 0.030 3 0.003 8% 0.056 2.00
The Cove Mobile Home Park AL0056553 Municipal Turkey Creek 0.024 3 0.002 9% 0.037 3.10
Locust Fork High School Lagoon AL0054348 Municipal Blackburn Fork 0.022 3 0.003 12% 0.101 6.12
Brookside Village WWTP AL0062251 Municipal Newfound Creek 0.022 3 0.006 29% 0.059 1.10
Dixie-Manor Housing Project AL0032301 Municipal Self Creek UT 0.020 3 0.003 17% 0.045 1.26
Bottenfield Junior High School AL0051161 Municipal Prudes Creek UT 0.017 3 0.004 25% 0.060 1.89
Bradford Parkside Health Services WWTP AL0047546 Municipal Thomas Creek 0.015 3 0.009 61% 0.406 6.21
River Bend Townhouses WWTP AL0054011 Municipal Turkey Creek 0.015 3 0.015 102% 0.532 3.66
North Jefferson Middle School WWTP AL0075256 Municipal Lick Creek 0.012 3 0.002 20% 0.020 1.30
Johnson Elementary School Lagoon AL0051195 Municipal Self Creek UT 0.010 3 0.003 29% N/A N/A
Southeastern Elementary School AL0068675 Municipal Campbell Creek 0.005 3 0.002 43% 0.172 7.70
Sharon Heights MHP AL0057827 Municipal Fivemile Creek 0.003 3 0.014 480% 0.270 2.24
a. Based on total phosphorus loading as reported on submitted DMRs. b. Based on total phosphorus results submitted to the Department.

Final Locust Fork and Village Creek TMDL Nutrients
107
Appendix E
Locust Fork and Village Creek Station Pictures

Final Locust Fork and Village Creek TMDL Nutrients
108
Figure E.1 Locust Fork Station LFKB-15 (8/16/2012)
Figure E.2 Locust Fork Station LFKB-1 (8/16/2012)

Final Locust Fork and Village Creek TMDL Nutrients
109
Figure E.3 Locust Fork Station LFKB-2 (6/20/2012)
Figure E.4 Locust Fork Station LFKB-8 (6/20/2012)

Final Locust Fork and Village Creek TMDL Nutrients
110
Figure E.5 Locust Fork Station LFKJ-3 (6/20/2012)
Figure E.6 Locust Fork Station LFKJ-6 (4/10/2013)

Final Locust Fork and Village Creek TMDL Nutrients
111
Figure E.7 Locust Fork Station BANT-3 (8/4/2016)
Figure E.8 Village Creek Station VLGJ-5 (7/18/2012)