final 2008 naaqs for ozone - connecticut · final 2008 national ambient air quality standards for...
TRANSCRIPT

Final 2008National Ambient Air Quality Standards for
Ozone
Presentation for CT SIPRACApril 10, 2008

Outline of Presentation
• New Standards• National Maps• Implementation• Air Quality Index• Implications for Connecticut

• On March 12, 2008, EPA significantly strengthened the National Ambient Air Quality Standards (NAAQS) for ground-level ozone
• These revisions reflect new scientific evidence about ozone and its effects on public health and the environment
• The final revisions affect two types of ozone standards: – Primary standard to protect public health, including the health of
"sensitive" populations such as people with asthma, children, and older adults
– Secondary standard to protect public welfare and the environment, including sensitive vegetation and ecosystems
• Specifically, EPA has:– Revised the level of the primary and secondary 8-hour ozone
standards to 0.075 parts per million (ppm)• For more information go to:
www.epa.gov/groundlevelozone/actions.html#mar07s
Overview

• EPA has concluded the 1997 primary standard is not adequate to protect public health with an adequate margin of safety
• EPA has strengthened the level of the 8-hour primary ozone standard to 0.075 parts per million (ppm)
– More than 1700 new scientific studies available in this review indicate strong evidence of adverse health impacts of ozone at the level of the 1997 standard and below
• Clinical studies show evidence of adverse respiratory responses in healthy adults at a level of 0.080 ppm and possibly lower
• Large numbers of new epidemiological studies, including new multi-city studies, strengthen EPA’s confidence in the links between ozone exposure and health effects observed in the last review, including emergency department visits and hospitalizations for respiratory causes
• In addition, studies now link ozone exposure to other important health effects, including mortality, increased asthma medication use, school absenteeism, and cardiac-related effects
• Studies of people with asthma indicate they experience larger and more serious responses to ozone that last longer than responses in healthy individuals
• EPA also specified the level of the standards to the nearest thousandth of a ppm (also referred to as the “third decimal place”), eliminating the need for rounding when comparing measured ambient levels to the new standard
Revisions to the Primary Ozone Standard

• Example of an ambient monitoring site attaining the ozone standards
Calculating Design Values
This monitoring site meets the ozone standards because the 3-year average of the annual fourth-highest daily maximum 8-hour average O3 concentrations (i.e., 0.075666… ppm, truncated to 0.075 ppm) is less than or equal to 0.075 ppm. The data completeness requirement is also met because the average percent of days within the required monitoring season with valid ambient monitoring data is greater than 90%, and no single year has less than 75% data completeness. In this example, the individual 8-hour averages used to determine the annual fourth maximum have also been truncated to the third decimal place.

• Ambient monitoring site failing to meet the ozone standards
Calculating Design Values
The ozone standards are not met for this monitoring site because the 3-year average of the fourth-highest daily maximum 8-hour average O3 concentrations (i.e., 0.096333… ppm, truncated to 0.096 ppm) is greater than 0.075 ppm, even though the data capture is less than 75% and the average data capture for the 3 years is less than 90% within the required monitoring season.

• EPA has concluded the 1997 secondary standard is not adequate toprotect public welfare
• EPA has strengthened the level of the 8-hour secondary ozone standard to 0.075 parts per million the same as the primary standard
• Important new scientific information has been developed since 1997, however many significant uncertainties remain
• While EPA agrees with CASAC that cumulative, seasonal exposures are the most biologically relevant, the remaining uncertainties over how to best protect vegetation led the Administrator to conclude thesecondary standard should be set equal to the primary
Revisions to the Secondary Ozone Standard

Regulatory Impact Analysis
• EPA conducted a Regulatory Impact Analysis (RIA) to analyze the benefits and costs of reducing pollution to meet alternative ozone standards
• The RIA is required by Executive Order 12866 and guidance from the White House Office of Management and Budget
• The RIA is an illustrative analysis and provides information regarding example control strategies, air quality impacts and public health improvements
• The benefit and cost analysis is not used when selecting the final ozone standards– The Clean Air Act bars EPA from considering costs in
setting or revising any NAAQS

Benefit and Cost Results
• The EPA analysis shows that benefits are likely greater than costs for the new standard
• EPA estimates the new standard will prevent the following additional adverse health effects annually in 2020: – 380 cases of chronic bronchitis– 890 nonfatal heart attacks– 1,900 hospital and emergency room visits– 1,000 cases of acute bronchitis– 11,600 cases of upper and lower respiratory symptoms– 6,100 cases of aggravated asthma– 243,000 days when people miss work or school– 750,000 days when people must restrict their activities
• EPA estimates the value of these and other health benefits will range from $2 billion to $19 billion per year in 2020
• EPA estimates the costs of implementing the new standard will range from $7.6 billion to $8.5 billion in 2020

Counties with Monitors Violating the 1997 8-Hour Ozone Standardof 0.08 parts per million (ppm)
(based on 2004-2006 Air Quality Data)
1 85 monitored counties violate.2 Monitored air quality data can be obtained from the AQS system at http://www.epa.gov/ttn/airsaqs/
3 The 1997 national ambient air quality standard (NAAQS) for ozone of 0.08 ppm is effectively expressed as 0.084 ppm when data handling conventions are applied.
Notes:

Counties with Monitors Violating the 2008 8-Hour Ozone Standard of 0.075 parts per million (ppm)
(based on 2004-2006 Air Quality Data)
1 345 monitored counties violate the 2008 8-hour ozone standard of 0.075 parts per million (ppm).
Estimates are based on the most recent data (2004 – 2006). EPA will not designate areas as nonattainment on these data, but likely on data from 2006 – 2008 or later, which we expect to show improved air quality. Notes:
2 Monitored air quality data can be obtained from the AQS system at http://www.epa.gov/ttn/airsaqs/

Counties with Monitors Projected to Violate the 2008 8-Hour Ozone Standard of 0.075 parts per million (ppm) in 2020
1 28 counties are projected to violate the 2008 8-hour ozone standard of 0.075 parts per million (ppm).
2 Future ozone levels were projected only for counties with monitoring data and within the contiguous 48 states.
Notes:3 Modeled emissions reflect the expected reductions from federal programs including the Clean Air Interstate Rule, the Clean Air Mercury Rule, the Clean Air Visibility Rule, the Clean Air Nonroad Diesel Rule, the Light-Duty Vehicle Tier 2 Rule, the Heavy Duty Diesel Rule, proposed rules for Locomotive and Marine vessels and for Small Spark-Ignition Engines; as well as illustrative state and local level mobile and stationary source controls identified for the purpose of attaining the 1997 ozone and 2006 PM2.5 standards. States may choose to apply different control strategies for implementation.

2013-2030 (depends on severity of problem)
2013*
No later than March 12, 2010*
No later than March 12, 2009
March 12, 2008
Date
Attainment Dates
Attainment Demonstration SIPs Due
Final Designations
State DesignationRecommendations to EPA
Signature—Final Rule
Milestone
Expected Implementation Timeline for Revised Ozone NAAQS
* In the event the Administrator has insufficient information to promulgate the designations by March 12, 2010, the date of final designations may be extended up to one year, but no later than March 12, 2011. SIPs will be due three years from final designations.

Implementation Considerations For Revised Ozone Standards
• Designations– No later than one year after EPA issues a revised standard, the
Clean Air Act requires States and gives Tribes the option to recommend to EPA which areas are and which areas are notmeeting the new standards
– EPA is required to issue final designations within 2 years afterestablishing revised standards, but may take up to another year if insufficient data is available for designation
• 1997 Ozone Standards– For now, the 1997 8-hour ozone NAAQS and all the associated
regulatory requirements remain in place– States should continue their plans for implementing the 1997 NAAQS– EPA will address any transition issues in a separate rulemaking

• EPA did not propose any specific changes to existing monitoring requirements, but invited comment on a number of issues. EPA will consider the following issues in a proposed monitoring rule thissummer and a final rule in approximately March 2009– Requirements in urban areas, including whether to require ozone
monitors in smaller Metropolitan Statistical Areas (cities) of between 50,000 and 350,000 population that do not currently have monitors
– Requirements in rural areas to address the large spatial gaps that exist in the current network, including whether to require a minimum number of rural monitors per state
– The length of the required ozone monitoring season, including whether the season should be lengthened
Monitoring Considerations Related to Revised Ozone Standards

Revised Ozone AQI
• EPA is changing the Air Quality Index (AQI) to reflect the new primary standard
• EPA is adjusting the 100-level to equal the new 0.075 ppm standard, and making proportional changes to other AQI values
• EPA encourages the States to use the new AQI breakpoints for air quality forecasting by May 1.

Air Quality Index for Ozone
No ChangeNo Change401-500No ChangeNo Change301-400
Hazardous
0.116-0.3740.125-0.374201-300Very Unhealthy
0.096-0.1150.105-0.124151-200Unhealthy
0.076-0.0950.085-0.104101-150
Unhealthy for
Sensitive Groups
0.060-0.0750.065-0.08451-100Moderate0.000-0.0590.000-0.0640-50Good
20088-hour(ppm)
19978-hour(ppm)
AQI ValueCategory

Implications for CT
With the revised standard, we expect….
• The number of ozone exceedance days in CT to increase:– In 2007, there were 18 days in CT when ozone
concentrations exceeded 0.084 ppm– Under a 0.075 ppm standard, there would have been
42 USG and above days in CT in 2007• Greater geographic coverage of unhealthy air• The potential for exceedances outside of the
current ozone monitoring season (i.e., in March and October)
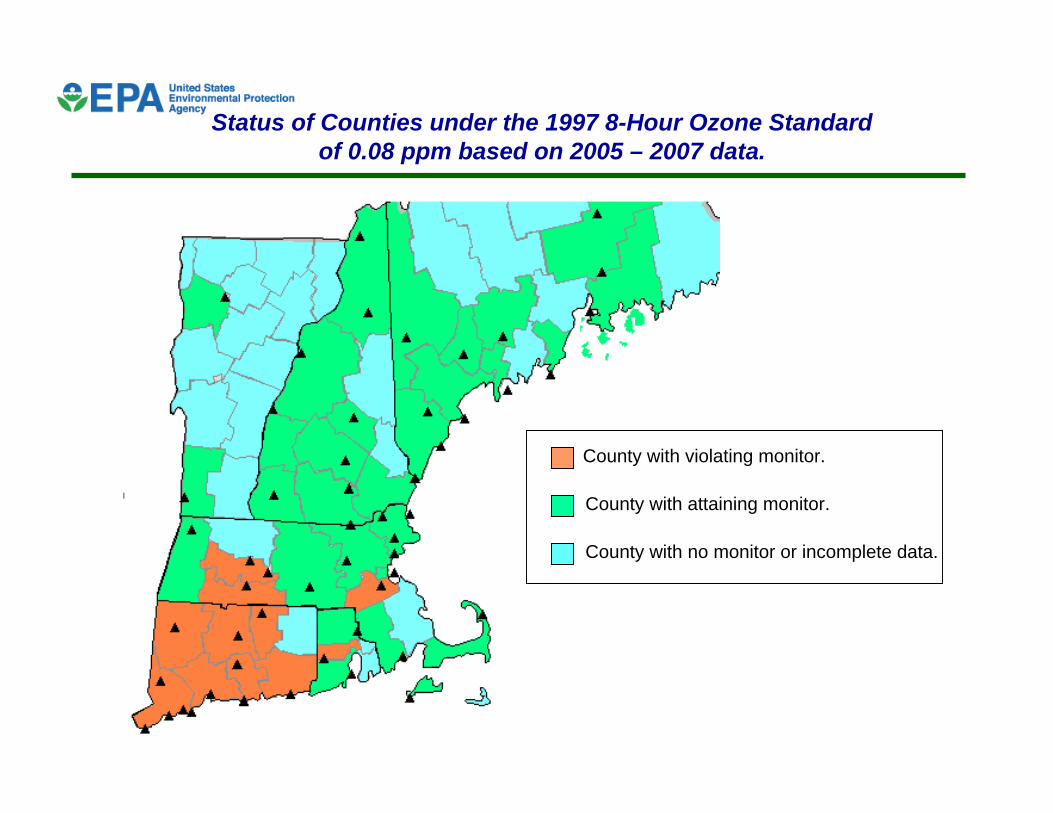
Status of Counties under the 1997 8-Hour Ozone Standard of 0.08 ppm based on 2005 – 2007 data.
County with violating monitor.
County with attaining monitor.
County with no monitor or incomplete data.

Status of Counties under the new 2008 8-Hour Ozone Standard of 0.075 ppm based on 2004 – 2006 data.
County with violating monitor.
County with attaining monitor.
County with no monitor or incomplete data.

Status of Counties under the new 2008 8-Hour Ozone Standard of 0.075 ppm based on 2005 – 2007 data.
County with violating monitor.
County with attaining monitor.
County with no monitor or incomplete data.


The revised AQI will depict more extensive areas of unhealthy air quality.
AQI based on 1997 ozone standard AQI based on 2008 ozone standard

Data from Airnow Tech

Additional Information/NEXT STEPS
• Published in Federal Register: March 27, 2008. • Rule Effective May 27, 2008.• States Forecast using the new AQI: May 1, 2008• Propose Monitoring Rule: ~ June 2008• Propose Implementation Rule: ~ Late Fall 2008• States make designation attainment/nonattainment
recommendations to EPA: March 2009