fertilization through irrigation - ipi_potash research topics_~o. 23 fertigation fertilization...
TRANSCRIPT
Fertigation
Fertilization through Irrigation
IPI Research Topics_~o. 23
Fertigation
Fertilization through Irrigation
Prof. J. Hagin Technion- Israel Institute of Technology, Haifa, Israel The Stephen and Nancy Grand Water Research Institute
Mr. M. Sneh, Mrs. A. Lowengart-Aycicegi Ministry of Agriculture- Extension Service, D.N. Oshrat, Israel
Edited by Dr. A.E. Johnston Dept. of Soil Science, IACR Rothamsted, Harpenden, Herts. AL5 2JQ, UK
International Potash Institute P.O. Box 1609 CH -4001 Base I Switzerl.a:nd

© All rights held by: International Potash Institute Schneidergasse 27 P.O. Box 1609 CH-4001 Basel I Switzerland Phone: (41) 61 261 29 22 Telefax: (41) 61 261 29 25 e-mail: [email protected] web: www.ipipotash.org
Layout: Mrs Sandrine Randon, IPI, Basel, Switzerland
Printing: lmprimerie de Saint-Louis, France
2
Contents page
1. Introduction 0000 00 00000 00 00 000 00000 00000000000000000000000000000 0000 000 0000 00 000000 0 0 00000 00000000000 5
2. History of fertigation 0 0000 00000000 000000 00 0000000 0 00000000 00000 00 0000000 00000 00000 0000 0 00000 0000 8
3. Fertigation, a literature review 000 0000000000000 0000000 00 000 00000000 000 0 0 00000000000000 0 11 301. Vegetable and small fruit crops ... oo .... o.o ...... O.OOOOOO ... OOOOOOOOOOOOoOOOO .. , .... oo .... 12
3020 Field crops ............ oo ...... o .... o ...... o .......... o ........ oo ............ o .. ooo .. oo .. oooooooooo .. o 13
3.30 Fruits .. o ...... oo .. oooooooooooooooo .. ooo .. o ........ ooooo ........ oooooooo .... oo ........ ooooooooooooooooooo 14
4. Fertilizers ooooooooooo .... oo .. oooooooooooooooooooooooooooooooooooooooooooooooo .... oooooooooooooooooooo 16 401. Fertilizer compounds suitable for fertigation oooooooooooooooooooooooooooooooooooooo 16
4020 Reactions offertilizer compounds in irrigation waters oooooooooooooooooooooooo 20
4.30 Reactions of nutrients, applied through fertigation, in soils and growth media 00 00 00 00 00 00 00 00 00 00 00 .......... 00 00 00 .. 00 00 00 00 00 .. 00 00 00 .... 00 00 00 23
4.40 Fertigation applied nutrient distribution in soils and growth media 000 0 00 000 00 00 00 00000 00000 00 00 0000 00000 00000 0 00000 0 000 0 00 00000 00 0000 Ooo oo 000 000 o o 28
5. Technology 000 00 00000000000000 00 000000000 000 .... 000000 00 000 000000000000 00000000 0000 00 0 00 00000 0000000 29 5010 Irrigation technology ooooooooooooooooooooooooooooooooooooooooooooooooo .. ooooo .. ooooo ...... o .. ooo 29
5020 Fertilizer injection technology oooooooooooooooooooooo .. ooooooooooooooooooooooooooooooooooooo 39
6. Nutrient requirements and fertilizer dosage and timing .... oooooo .... o 46 6olo Tomato ooooooooooooo .. oooo .. o ........ ooooooooooooooooooooooooooooooooo .. ooooo .. oooooooooooooo:ooooooooo 46
6020 Bell pepper 0 000000 .. 0 00000 0000 000000000000 0000 00 0000000 0000 00000 0000 000 000000000 0000 000 000 0000 000 000 0 49
6.30 Banana OOOooOOOOOOOO ...... oooooooooooooooooooooooooooooooooooooooo .. oo .... oooooooooooooooooooooooooooooo 50
6.40 Maize and sweet corn oooooooooooooooo .. oooooooooooooooooooooooooo .... oo .. oo .... oo .... oo .... oo .. 51
6.50 Citrus oooooooooooooooooooooo .............. ooooooooooooooooooooooooooooooooo ........ ooooo ooooooooooooooo .. 53
7. Monitoring and control ........ oooooooooooooooooooooo ................ ooooooooooooooooooooooo 55 7 ol. Water requirement monitoring ................ 00 00 00 00 00 00 00 00 00 00 .. 00 00 .. 00 .. 00 00 00 00 00 .. 55
7020 Nutrient requirement monitoring by plant testing .... ooooooooooooooooOOOOooOOooO 57
7o3o Soil testing ...... ooooo .. o ........ oooooooooooooooooooooooooooooooooooooooooooooooooooooooooOOOOOOOOOOOO 59
7.40 Water quality monitoring oooooooooooooooooooooooo ............ oo .. ooOOOOOOOOooOOooooOOooOOOOOO 60
8. References ooOOOOOOooO 000000 ........ 00 00000 00000 0 00000 0000000000 0 000 00 .. oo 000000 0 000 .. oo .. 00 ooooo 0000 62
Appendix 1: Calculation of water and nutrient requirement- examples .. 0000000 00 00 .... 00000 .. o 0000000 0000 oo ...... oooo .. o 0000 000 0000 000000 69
Appendix 2: Coloured plates oooooooo ...... oo .... oooooooooooooooo ........ oooo .... oo .... oo .. oooooo 73
3

4
1. Introduction
Agricultural systems seek to maximize the yield and quality of crops and minimize the costs of production, while maintaining sustainability. A prerequisite for achieving this objective is an optimal and balanced water and nutrient supply. Protection of the environment, land and water resources is another crucial factor that demands the tuning of plant nutrient supply with uptake by crops (Hagin and Lowengart, 1996).
Fertigation - a modem agrotechnique, combining water and fertilizer application through irrigation - provides an excellent opportunity to both maximize yield and minimize environmental pollution (Magen, 1995; Shani et al., 1988; Sneh, 1987).
In semiarid and arid climatic conditions and occasionally even in humid climates, an optimum water supply depends on irrigation. Mostly, water is supplied by surface irrigation via open channels, flooding and furrows, but the efficiency of water use is rather low. Typically, one third to one half of the applied water, carrying with it considerable amounts of nutrients, may not be used by a crop. Water use efficiency is much higher in pressurized irrigation systems, ranging from 70% to 95%. Such systems allow for~ a good control of water and nutrient supply and minimize losses. Major coristraints to the use of pressurized irrigation are the initial capital investment, maintenance costs and availability of expertise in the use of the system. Drip irrigation is probably the most effective method of water application. It localizes the water supply and this triggers the development of a restricted root system that requires frequent replenishment of the nutrients. Applying nutrients in the irrigation water may satisfy this requirement.
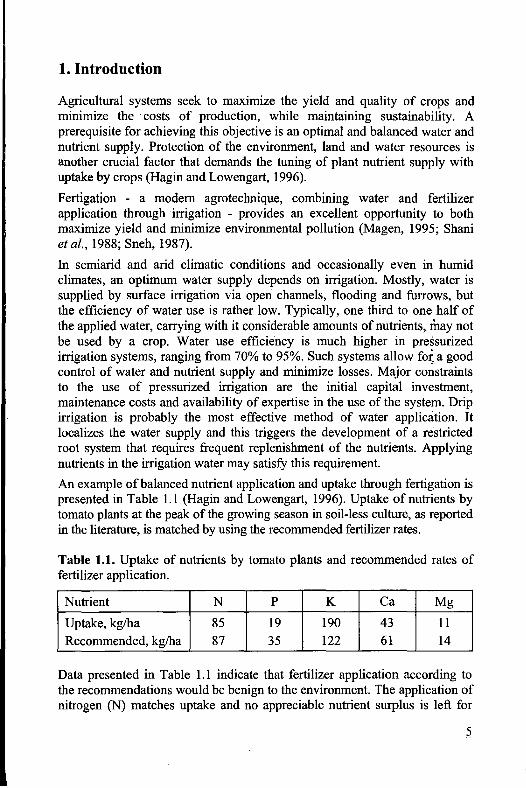
An example of balanced nutrient application and uptake through fertigation is presented in Table 1.1 (Hagin and Lowengart, 1996). Uptake of nutrients by tomato plants at the peak of the growing season in soil-less culture, as reported in the literature, is matched by using the recommended fertilizer rates.
Table 1.1. Uptake of nutrients by tomato plants and recommended rates of fertilizer application.
Nutrient N p K Ca Mg
Uptake, kg/ha 85 19 190 43 11
Recommended, kg/ha 87 35 122 61 14
Data presented in Table 1.1 indicate that fertilizer application according to the recommendations would be benign to the environment. The application of nitrogen (N) matches uptake and no appreciable nutrient surplus is left for

leaching by percolating water. Although, the amount of phosphorus (P) to be applied is nearly double the amount taken up, this is not at risk to leaching, because of the adsorption of P compounds in the rooting medium.
The tendency for the transition from open irrigation, driven by gravity, to pressurized- and micro-irrigation systems is observed in several localities. For example, a report on California agriculture states that over the period 1986/96 irrigation with gravity systems decreased by 11%, while the use of micro-irrigation increased by 12%. Micro-irrigation technology employs emitters with tiny apertures delivering water at low flow rates. In addition, farms that changed their irrigation system adopted new nutrient management techniques such as fertigation (Dillon et al., 1999).
A developing farming system may profit considerably by introducing fertigation while shifting to micro-irrigation systems. For example, vegetable production in the Jift1ik Valley on the West Bank of the River Jordan has increased more than tenfold. At the same time, farmer's net income has increased even more due to the improved quality of the produce. A key factor· in the project's success has been the transfer of the drip irrigation and fertigation technology directly to the farming community. The rapid provision of a fully established technology to a farming community, as opposed to a step-by-step approach, has proved to be a viable option, even without the prior development of a complete infrastructure. This approach may, therefore, offer an economically and socially acceptable way to develop the cultivation of high-value food crops in developing countries (Raymon and Or, 1990).
In a fertigation system, the timing, amounts, concentrations and ratios of the nutrients are easily controlled. Due to this improved control, crop yields are larger than those produced by a simple fertilizer application and irrigation system. Such yield increases should not be attributed to fertigation only because the changes in the agro-technique are accompanied by other improvements in crop management.
Fertigation may be practiced under any irrigation system. However, fertilizers applied with open irrigation can give a more uneven nutrient distribution in the field. Playan and Faci (1997) showed that the uniformity of nutrient distribution in the lower half of a field with open irrigation, ranged from 3 to 52%, while the uniformity of water distribution ranged from 63 to 97%.
Under pressurized irrigation systems, fertigation is considered an integral part of plant nutrient management and specifically so under micro-irrigation. Because such systems generate a concentrated and space-limited root system within the wetted soil volume fertigation is essential to ensure optimum plant nutrition.
6
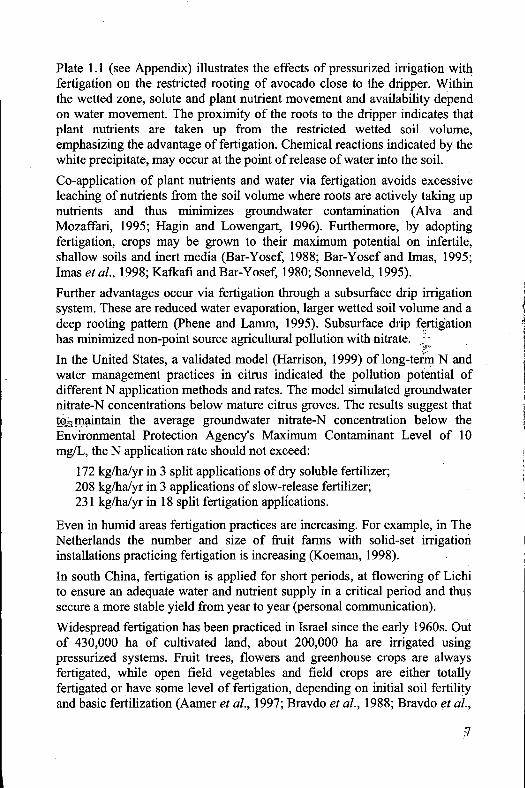
Plate 1.1 (see Appendix) illustrates the effects of pressurized irrigation with fertigation on the restricted rooting of avocado close to the dripper. Within the wetted zone, solute and plant nutrient movement and availability depend on water movement. The proximity of the roots to the dripper indicates that plant nutrients are taken up from the restricted wetted soil volume, emphasizing the advantage of fertigation. Chemical reactions indicated by the white precipitate, may occur at the point of release of water into the soil.
eo-application of plant nutrients and water via fertigation avoids excessive leaching of nutrients from the soil volume where roots are actively taking up nutrients and thus minimizes groundwater contamination (Alva and Mozaffari, 1995; Hagin and Lowengart, 1996). Furthermore, by adopting fertigation, crops may be grown to their maximum potential on infertile, shallow soils and inert media (Bar-Yosef, 1988; Bar-Yosef and Imas, 1995; Imas et al., 1998; Katkafi and Bar-Yosef, 1980; Sonneveld, 1995).
Further advantages occur via fertigation through a subsurface drip irrigation system. These are reduced water evaporation, larger wetted soil volume and a deep rooting pattern (Phene and Lamm, 1995). Subsurface drip f~rtigation has minimized non-point source agricultural pollution with nitrate. ~',
In the United States, a validated model (Harrison, 1999) of long-term N and water management practices in citrus indicated the pollution potential of different N application methods and rates. The model simulated groundwater nitrate-N concentrations below mature citrus groves. The results suggest that !~maintain the average groundwater nitrate-N concentration below the Environmental Protection Agency's Maximum Contaminant Level of 10 mg/L, the N application rate should not exceed:
172 kg/ha/yr in 3 split applications of dry soluble fertilizer; 208 kg/ha/yr in 3 applications of slow-release fertilizer; 231 kg/halyr in 18 split fertigation applications.
Even in humid areas fertigation practices are increasing. For example, in The Netherlands the number and size of fruit farms with solid-set irrigation installations practicing fertigation is increasing (Koeman, 1998).
In south China, fertigation is applied for short periods, at flowering of Lichi to ensure an adequate water and nutrient supply in a critical period and thus secure a more stable yield from year to year (personal communication).
Widespread fertigation has been practiced in Israel since the early 1960s. Out of 430,000 ha of cultivated land, about 200,000 ha are irrigated using pressurized systems. Fruit trees, flowers and greenhouse crops are always fertigated, while open field vegetables and field crops are either totally fertigated or have some level of fertigation, depending on initial soil fertility and basic fertilization (Aamer et al., 1997; Bravdo et al., 1988; Bravdo et al.,
1992; Heffuer et al., 1982; Lahav et al., 1995; Lahav and Kalmar, 1995; Lowengart and Manor, 1998; Shemesh et al., 1995; Zaidan and Avidan, 1997).
In summary, fertigation is an essential component of an irrigated, and specifically of a micro-irrigated agricultural system, where the active plant roots are restricted by the water supply. Under humid conditions, where plant roots tend to be distributed through a large soil volume, there still may be some advantage to fertigation, because it is the most promising method for minimizing the risks of environment pollution by some plant nutrients.
2. History of fertigation
Fertigation is a key-factor in modem intensive irrigated agriculture and its origin can be attributed to the development of soil-less culture, frequently termed hydroponics. This technology is ancient, being used in the famous hanging gardens of Babylon and the floating gardens of the Aztecs of Central America. The Hanging Gardens of Babylon were, in fact, an elaborate pumped hydroponic system using fresh water rich in oxygen and nutrients. The Aztecs grew vegetables, flowers, and even trees on floating rafts through which the roots penetrated and grew into the water. The ancient Chinese also grew rice by hydroponic culture. An example of modem hanging gardens are the Bahai gardens in Haifa, Israel (Plate 2.1).
In the end of the 181h century, John Woodward of England, grew plants in a
water extract from soil, the first man-made hydroponic nutrient solution. In the middle of the 191
h century, nine elements, essential to plant growth, were identified by Jean Baptiste Boussingault who used an inert growth medium and supplied the plant nutrients in water solutions with known combinations of chemical compounds. He identified not only the mineral elements but also the proportions required for optimum growth. Later, von Sachs developed the first standard formula for a nutrient solution in which plants could be grown successfully. Until 1925, the use of nutrient solutions was limited to plant nutrition research and various formulas were developed (Hoagland, 1919; Amon, 1938; Robbins, 1946).
In 1925, the glasshouse industry showed interest in using hydroponics to replace conventional soil culture methods. The term "hydroponics" was primarily limited to water culture without the use of any rooting medium. Later, hydroponics was defined as the science of growing plants without soil, using inert media, such as gravel, sand, peat, vermiculite or sawdust and nutrient solutions containing the essential elements needed by the plant. Those methods that employ a rooting medium are now termed soil-less culture, while water culture alone should be described as hydroponics.
8
World War 11 boosted the expansion of hydroponics as an essential source of fresh vegetables for the American Army. The first large hydroponics farm was built on the barren Ascension Island in the South Atlantic. The techniques developed in Ascension were used later on other Pacific islands such as Iwojima and Okinawa, using crushed volcanic rock as the growth medium. After World War 11, the United States Army established a special hydroponics unit that built a 22 ha hydroponics farm at Chofu, Japan.
The commercial use of hydroponics, expanded in the 1950s to The Netherlands, Italy, Spain, France, England, Germany, Sweden, the USSR and Israel. Later, hydroponics expanded in the Middle East, in the sandy wastes of the Arabian Peninsula, Kuwait and the Sahara Desert, as well as in Central and South America, Mexico and on the Venezuelan Coast at Aruba and Curacao. In the United States, commercial hydroponics has been developed mainly in Illinois, Ohio, California, Arizona, Indiana, Missouri and Florida. There are over 1,000,000 household soil-less culture units operating in the United States alone. Such household units are also found in Russia, France, Canada, South Africa, The Netherlands, Japan, Australia and q~rmany.
The development of plastics for containers and piping, and balanced nutrient solutions triggered a further proliferation of soil-less culture'; by reducing costs and simplifying the management of the system. ~"
In the mid 1950s, mixing fertilizers with irrigation water was used on a limited scale, in surface, flood and furrow irrigation in the United States. The fertilizers used most were gaseous ammonia, aqua ammonia and ammonium nitrate, but N use efficiency was low, due to the low efficiency of the water ~pplication. Following the expansion of surge irrigation to give more precise water application in surface irrigation, fertilizer injection through the surge valves was introduced. This development greatly increased the efficiency of fertilizer applied in surface irrigation. In The Netherlands, since the early 1950s, there was a considerable increase in the number of glasshouses and fertilizers were applied with the irrigation water. Electrical pumps and mixing tanks were developed for the precise application of nutrients.
In Israel, the development of fertigation technology was parallel to the development and introduction of micro-irrigation in the early 1960s. Due to the small volume of wetted soil in drip irrigation, an adequate supply of nutrients to the root system required the synchronization of water and nutrient supply. Crops also benefit from fertigation in other micro-irrigation methods, namely sprayers and micro-sprinkler systems. Following the conversion from mobile to solid-set sprinkler irrigation systems, fertigation was applied also in sprinkler irrigation systems. Since the early 1980s, fertigation was integrated with self-propelled mechanized irrigation systems. Nowadays, over 75% of the irrigated area (excluding supplementary irrigation) in Israel's agriculture
9
uses fertigation technology. Initially, nutrient distribution by fertigation was relatively uneven when fertilizer tanks were used. Later a more uniform distribution was achieved when Venturi suction pumps and water pressure driven fertilizer injectors were used. Further considerable improvements were achieved by introducing modem arrays of fully computerized fertigation units.
The idea of drip irrigation was born in Israel in the early 1930s when Eng. Simha Blass was invited to a late afternoon tea party at a small farm in the Coastal Strip. Among the owner's many grapefruit trees, one was impressively larger than the others, although no irrigation water had apparently been applied. Closer inspection revealed a tiny puncture in a small-diameter iron pipe delivering drinking water to the house. The diameter of the wetted area was only 25 cm, while the diameter of the tree canopy was ten meters. The sight of such a large tree deriving its water supply from such a small soil volume invoked in Mr. Blass's mind the idea of drip irrigation. Unfortunately, practical difficulties at that time led to the rejection of the idea but 17 years later, in 1959, the availability of plastic tubes facilitated the implementation of the idea. After three years of trial and error, success was achieved. Yields of tomatoes were doubled and those of cucumbers trebled, compared with sprinkler and furrow irrigation.
One of the crucial problems of the new irrigation technology was nutrient supply. The wetted soil volume, particularly in sandy soils, was only a small fraction of the cultivated soil layer. Broadcasting fertilizer over the soil surface was unsatisfactory because a considerable fraction of the fertilizer remained on the soil surface and the nutrients were not utilized by the plants. At the start, two methods were used to apply nutrients through the irrigation water. In one, the fertilizer solution was injected into the irrigation network by sprayer pumps. In the other, water from the irrigation network was diverted into a tank containing water and solid fertilizer and then returned to the irrigation network. These two methods, although simple and inaccurate, brought impressive yield increases in 1963. These benefits could be compared with winter broadcast fertilizer in drip irrigated orchards which were ineffective, particularly in coarse texture soils, while in sandy soil in the Coastal Strip, drip irrigated citrus orchards yielded even less and showed nutrient deficiency symptoms compared to sprinkler irrigated orchards. In experimental work during the late 1960s and the early 1970s, it was proved that perennial crops also benefit from a continuous supply of nutrients by fertigation.
In the late 1960s, the area of glasshouses expanded, mainly for export flowers (Plate 2.2). The combination of drip irrigation and fertigation greatly benefited these intensive and expensive growing systems. Growers of vegetables and field crops also adopted the fertigation techniques.
10
In the mid 1960s, following the expansion of drip ·irrigation, the fertilizer tank was adopted as the main method of adding nutrients. In several glasshouses, dual-purpose sprayer pumps were used for both plant protection spraying and fertigation. In orchards, mobile sprayers were used to inject fertilizer solution directly into the irrigation system. In the early 1970s, the availability of liquid fertilizers allowed the introduction of a new waterdriven pump. The first model, based on a diaphragm operated by water pressure, withdrew fertilizer solution from an open tank before it was injected into the irrigation system. The pressure exerted by the pump was twice the pressure in the irrigation system. In a second type of water-driven pump, both the suction and injection of the fertilizer solution were by a piston. The introduction of these pumps facilitated a better synchronization of fertilizer and water supply. Also in the early 1970s, low discharge Venturi devices were introduced, mainly for use in nurseries and pot plant glasshouses. They overcame one of the main disadvantages of the earlier pumps, namely a lack of precision at low flow rates. Where electricity was available, mainly in glasshouses, electrically operated pumps were introduced f<fi. the accurate application of fertilizer solutions. In the early 1990s, new tYJ>es of waterdriven pumps were developed, for precise low- and medium-rate fertilizer solution addition, without water emission. · ... ,_
In dual-purpose water supply networks for both drinking and irrigation water, preventing reverse flow of fertilizer solution back into the water supply system was a prerequisite for the implementation of fertigation. To prevent such reverse-flow, vacuum valves, check valves and air separation were used.
The control of the amount of fertilizer applied has been improved with time. Initially, control required manual adjustment of the choking valve regulating inflow to and outflow from the fertilizer tank. Later, mechanical devices were developed for the automatic synchronization of water and fertilizer supply. Even more sophisticated control was achieved by using computers linked to pH and EC sensors, combined with fertilizer mixing tanks and irrigation controllers.
3. Fertigation, a literature review
A literature review shows that, in most cases, by introducing fertigation, crop yields are increased, the efficiency of fertilizer and water use by plants is improved and loss of nutrients to the environment is reduced as illustrated by the following examples. .
11
3.1. Vegetables and small fruit crops
Tomatoes are an important crop grown and fertigated in open fields and in protected cultures. Fertigated tomatoes yielded more, had higher dry matter and improved quality parameters (size, firmness and soluble sugars) compared to conventionally irrigated and fertilized crops (Alcantar et al., 1999). In another comparison of conventional drip irrigation and fertilization with drip fertigation, the fertigated tomatoes produced a red fruit yield of 72 tlha while those under convential irrigation and fertilization yielded only 44 tlha. Fertigation doubled the number of fruits. Improved nutrient availability provided by fertigation was considered to be one of the important factors causing the increase in yield (Pan et al., 1999). In another experiment, compared to traditionally fertilized and sprinkler irrigated crops, fertigation increased tomato yield from 39 to 50 tlha and improved fruit quality considerably (Siviero and Sandei, 1999).
Six processing tomato cultivars grown with subsurface drip fertigation produced marketable yields ranging from 80 to 98 tlha, with a soluble solids content above 4.9%. Over 90% of the root systems were concentrated in the upper 25cm of soil. These large yields were accompanied by good processing characteristics, only a small occurrence of diseases and very small amounts of rotten fruits (Silva et al., 1999). There is evidence that fertigation, in addition to giving large yields also gives additional benefits. Tomatoes grown in soil-less culture in glasshouse with good fertigation practices are least likely to suffer from plant diseases and in the long-term maintain large yields (Reist et al., 1999).
Similar results are reported for other crops. In a field experiment with cucumbers, on a silty loam soil, in Lower Bavaria, Germany, the largest yield, 74 tlha, was obtained with drip laterals under mulch and fertigation with NPK and the lowest, 65 t/ha, with overhead sprinkler irrigation and urea as a foliar fertilizer (Mosler, 1998). A basal application of ammonium sulphate was compared to potassium nitrate applied via fertigation at three N rates for cucumbers grown on an alluvial soil (pH 7 .9). The largest amount of N given by fertigation gave the largest yield. Nitrate leaching losses were least from the nitrate fertigated treatment because N use efficiency was greater (75-97%) than with ammonium sulphate (10% efficiency) (Brito et al., 1999).
Large yields of iceberg lettuce, up to 33 tlha in commercial production, were obtained under fertigation with N rates up to 100 kg/ha (Rincon et al., 1998). In other field trials on lettuce with N inputs of 450 kg/ha, N use efficiency was 25% greater with trickle fertigated treatments than with sprinkler irrigation and conventional fertilizer application. The increased N use efficiency was attributed to a more constant nitrate concentration in the soil,
12

better N placement, an increased ratio ofNOrN to NH4-N and a soil N~-N concentration below the toxic level. All these factors contributed to less nitrate leaching (McPharlin et al., 1995).
The effect of surface irrigation and solid fertilizers on chickpea yields was compared to that of drip fertigation. The recommended rate of solid fertilizer gave a grain yield of 1.9 t/ha, while 75- 150% of the recommended NPK when fet'tigated produced yields of 2.2 - 2.3 tlha. Drip irrigation reduced the water requirement by 60% compared with surface irrigation (Deolankar and Pandit, 1998). Drip irrigation applied at 75% of pan evaporation together with N fertigation at 25 kg N/ha was the optimum combination for maximum yields of peas (Pisum sativum) and water use efficiency, on a sandy loam soil (Malik and Kumar, 1996).
Broccoli grown on clay loam and clay soils produced larger yields (24.5 t/ha) at 400 kg N/ha with drip fertigated NKP, than with broadcast fertilizers (Castellanos et al., 1999). Strawberry yield was increased by about 25% by applying NPK fertilizers in drip fertigation compared to applying,_them in a granular form (Bemardoni et al.,1990). In an experiment with blueberries (Vaccinium corymbosum), 65 kg N/ha were applied in the first two years and 77 kg N/ha in the third year, either by fertigation or as solid fertil_izer. After three years, yields were larger with fertigation than with granular fertilizer. The improved performance with fertigation was attributed to N being more readily available because of its more effective placement in the root zone (Finn et al., 1997).
3.2. Field crops
Experiments with wheat indicated substantial savings in P fertilizer by switching to fertigation. On a calcareous sandy loam soil, applying only 50% of the P fertilizer as diammonium phosphate by fertigation, produced a grain yield and total P uptake equivalent to that obtained by the full P rate applied by broadcasting superphosphate (Alam et al., 1999). Similar conclusions were drawn from experiments with sugarcane. Using drip fertigation allowed fertilizer N rates to be reduced by 30%. With 80 kg N/ha!yr applied by drip fertigation, yields were not less than those obtained by applying 120 kg N/ha/yr along the cane rows (Kwong et al., 1999). In field trials with maize, larger grain yields and greater translocation of N to the grain were obtained with fertigation compared with solid broadcast fertilizer (Bassoi and Reichardt, 1995).
Increases in cotton yield and nutrient uptake were observed in some cases when fertigation was applied with subsurface drip irrigation. The main effect yvas found with P fertigation (Eizenkot et al., 1998). The yield of cotton,
13

grown on a clay soil (Vertisol), fertigated with 75 kg N/ha was comparable to the yield obtained with 100 kg N/ha applied as solid fertilizer. The lint quality was improved, water and N use efficiencies and the uptake of other nutrients were all increased when the N was applied by fertigation (Bharambe et al., 1997).
3.3. Fruits
Long-term experiments on the banana crop in the W estem Galilee, Israel showed an improvement in fertilizer use efficiency with fertigation over the years. During the 1960s, bananas were mainly sprinkle-irrigated and solid fertilizers were broadcasted 3-4 times during a season. In the 1990s, drip fertigation was used throughout the growing season. This facilitated doubling of the N rate from 250 kg N/ha/yr to 500 kg N/ha/yr. Parallel with this, average plant height increased from 150 cm to 270 cm, average bunch weight from 18 to 28 kg, number of bunches from 1700 to 2100/ha and average yield from 30 to 60 tlha. Comparing N, P and K concentrations in the ih petiole showed an increase in N from 0.6% in 1972 to 1.1% in 1995, in P from 0.08% to 0.12% and inK from 3.7% to 6.5%, in dry matter. The enhanced nutrient uptake and increase in yield seem to be the result of the introduction of fertigation into the banana plantations, enabling an increase in fertilizer application rates and better plant nutrient distribution in space and time (Lahav and Lowengart, 1998).
In a trial on pecan trees, nut yield and quality were as good with 56 kg N/ha drip-fertigated as with 112 kg N/ha applied either all broadcast or half broadcast - half fertigated. The all fertigated N treatment resulted in a smaller decrease in soil pH and less loss ofK, Ca and Mg from soil in the non-wetted zone underneath the tree canopy compared with the broadcast treatments. Soil pH, K and Mg were only slightly reduced in the 15 to 30 cm soil layer when all of the N was fertigated. Leaf Ca and Mg concentrations were greater in the all fertigated N treatment than in the other treatments (W orley and Mullinix, 1996).
Fertigation for apples was effective when combined with other changes in agrotechniques. When high-density apple orchards, containing 800 - 1400 trees/ha replaced traditional low-density orchards in British Columbia, Canada, drip fertigation contributed to improved nutrient management especially on coarse-textured soils (Neilsen and Roberts, 1996). Frequent daily irrigation of a high-density orchard with apples on dwarfing rootstock on a coarse-textured soil induced a shallow root zone which was further restricted laterally under drip irrigation relative to microjet irrigation (Neilsen et al., 2000). Drip fertigation in apple orchards was compared to irrigation and broadcast fertilizer application. The best balance between increased shoot
14
growth, fruit bud production, fruit set and cumulative. yield was achieved with fertigation at 26 kg N/ha. Improved growth and yield of apples, whilst maintaining low fertilizer inputs, can make fertigation a useful component of integrated fruit production in which agrochemical inputs are minimized (Hipps, 1992).
Fertigation, however, has not been found advantageous in some experiments with apples and peaches. Although apple yields over four years were larger with fertigation than with any other treatment (top-dressing, slow-release granules and liquid spray), when the greater costs of fertigation were set against the value of the extra yield, fertigation was not economically profitable (Paoli, 1997). Other studies with two apple varieties, over 6 years, showed that fertigation did not give any advantages over conventional fertilizer application by spraying or broadcasting. (Widmer and Krebs, 1999). Dolega et al. (1998) found no differences in firmness, acidity or sugar content between fertigated and non-fertigated apple trees. Fertigation did not improve fruit mineral content or storage potential. Fertigation had no positive effect on flowering and productivity. Drip irrigation plus broadcast fertilizer application gave the best yields.
Experiments testing N and K applied by fertigation in a high-density peach orchard (606 trees/ha) did not show a detectable yield advantage to justify the added cost, compared with banded fertilizer application (Layne et al., 1996). However, observations in peach orchards in Israel indicated that fertigation induced early maturity. The trees bore fruit a year and a half earlier than conventionally managed orchards. Some of the errant responses to fertigation in apple and peach orchards may be due to the fact that these experiments were mainly in humid climates. In such conditions one of the important components of fertigation, namely soil moisture control, is not expressed.
Fertigation experiments on orange trees showed that small volume fertigation by drippers with a large concentration of plant nutrients, equivalent to halfstrength Hoagland solution, gave the largest yields. This treatment produced a restricted and dense root system with a large number of tiny roots (Bravdo et al., 1992). The yield of oranges grown on a fme sandy soil was larger by 3 to 8 tlha with fertigation than with broadcast dry fertilizer. Further measurements showed that fertigation with 18 applications per year, decreased NOrN loading into groundwater as compared to 3 broadcast applications of the same amount of N using granular fertilizers (Alva et al., 1998). The effect of fertigation on lessening nitrate pollution of groundwater was also reported by Alva and Mozaffari (1995).
Experiments on grapefruits showed that the profit from a fertigation programme can equal or exceed those from traditional broadcast applications (Boman, · 1995). The effect on mature grapefruit trees of conventional
Ui

fertilization by broadcasting granular material was compared to a combined broadcast/fertigation programme. Conventional fertilization consisted of broadcast applications three times per year. The combined treatment had a broadcast application of 33% of the annual amount of N and K in spring, followed by the remainder applied as fertigation at 2-week intervals. Compared to the conventional treatment, the combined broadcast/fertigation treatment increased yield by 8 to 9% and improved fertilizer use efficiency (Boman, 1996).
4. Fertilizers
4.1. Fertilizer compounds suitable for fertigation
A large range of fertilizers, both solid and liquid, is offered to the grower. The suitability of a fertilizer for fertigation depends on several of its properties, especially its solubility in water. Solid fertilizers completely soluble at field temperature are suitable for fertigation, liquid fertilizers are already in solution. For mixing, fertilizers must be compatible. They must not form precipitates when mixed in water and their solubility must not be changed on mixing. For example, when mixing ammonium sulphate with potassium chloride, the decisive solubility will be that of potassium sulphate, having the lowest solubility in the mixture. Corrosivity of the solution is also important. Chemical reactions between fertilizers and metal components in the irrigation system may occur. Acidic and/or chloride containing fertilizers are usually more corrosive than others. Fertilizer stock solutions that contain micronutrients in a chelated form should not be mixed with other fertilizer solutions. Separate stock solutions should be prepared for chelates and for acid solutions, because chelates tend to breakdown in acid solutions.
Compatibility of fertilizers with the irrigation water has to be considered. Some water may contain relatively large concentrations of divalent cations, like calcium (Ca) and magnesium (Mg). Some phosphate compounds may easily precipitate in such water, while others, like polyphosphates may maintain their solubility. The solubility in water of fertilizers changes with temperature as shown in Table 4.1. These data are based on those in the Handbook of Chemistry and Physics, some are taken from A vidan et al. (1996) and some from Wolf et al. (1985).
The variation in solubility with temperature has to be taken into account, especially when preparing fertilizer stock solutions (Table 4.1). A fertilizer may be fully soluble at summer temperatures but precipitate out of the solution (salt out) in winter.
16
- ---__________________ __.

Table 4.1. Solubility offertilizer compounds (g/L), at some temperatures.
Compound Equation ooc 10°C 20°C 30°C
Urea CO(NHz)2 680 850 1060 1330 Ammonium nitrate NJ4N03 1183 1580 1950 2420 Ammonium sulphate (NH4)2S04 706 730 750 780 Calcium nitrate Ca(N03)2 1020 1240 1294 1620 Potassium nitrate KN03 130 210 320 460 Potassium sulphate K2S04 70 90 110 130 Potassium chloride KCl 280 310 340 370 Di-potassium phosphate K2HP04 1328 1488 1600 1790 Mono-potassium phosphate KH2P04 142 178 225 274 Di-ammonium phosphate (NH4)2HP04 429 628 692 748 Mono-ammonium phosphate N~HzP04 227 295 374 464 Magnesium chloride MgC12 528 540 546 568 Magnesium sulphate MgS04 260 308 356 405
.-·_r,_..,:
Most water used for irrigation has an intrinsic salt content and thus an initial osmotic pressure, which is increased by adding more salts in th-e form of fertilizers. A relatively high osmotic pressure in the rooting liiedium is counter-productive to achieving large yields. At a raised osmotic pressure, the plant has to utilize more energy for water and nutrient uptake and this extra energy is expended at the cost of crop yield. Therefore, for.'fertigation solutions, the fertilizers that are used should generate the lowe.~t possible increase in osmotic pressure. The osmotic pressure of fertilizer o(fertigation solutions is generally not stated nor measured. Instead, the electrical conductivity of the solution is measured and the osmotic pressure of various fertilizer solutions is compared according to the electrical conductivity. If desired, the relation between electrical conductivity (EC) and osmotic pressure (OP) may be calculated from the following equation:
OP = 0.036 x EC (Richards, 1954).
The degree of acidity of the fertigation solution, expressed and measured as pH, indicates a corrosion hazard if it is acid, while if it is alkaline it may indicate a risk of forming precipitates. For example, in slightly alkaline water, precipitates of calcium phosphates may form.
The electrical conductivity, dS/m (EC) and the pH of fertilizer solutions can be computed and compared. EC is calculated from data on the ionic strength (IS) of the solution, according to the following equation: IS = 0.013 x EC (Griffm and Jurinak, 1973). IS and pH are computed by the Geochem program (Sposito and Mattigod, 1980). For urea solutions, in order to be able
17
to compare their properties with those of other solutions, a different calculation is required. Urea in solution does not generate EC, but it develops osmotic pressure, atm. (OP) that can be calculated from the following equation: OP x V = N x R x T, where N = number of moles of solute in volume V, R = 0.082, T = absolute temperature. An "equivalent EC" value for a urea solution can then be calculated from the OP value by the equation given above.
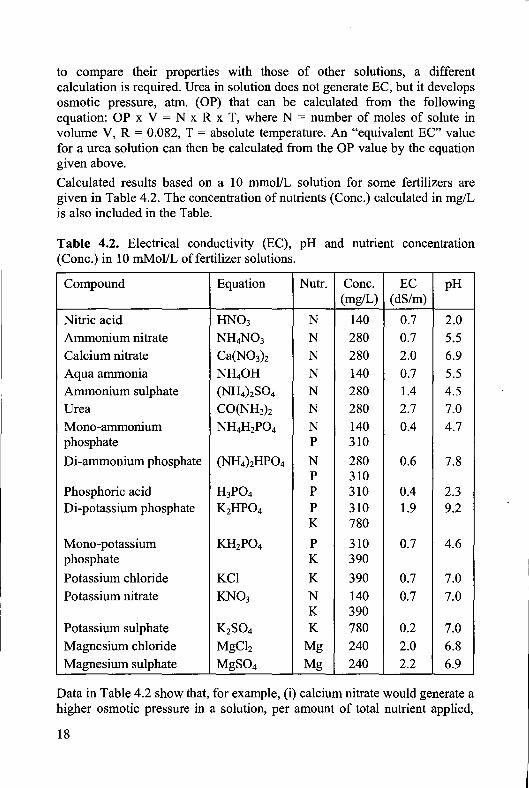
Calculated results based on a 10 mmoVL solution for some fertilizers are given in Table 4.2. The concentration of nutrients (Cone.) calculated in mg!L is also included in the Table.
Table 4.2. Electrical conductivity (EC), pH and nutrient concentration (Cone.) in 10 mMoVL offertilizer solutions.
Compound Equation Nutr. Cone. EC pH (mg/L) (dS/m)
Nitric acid HN03 N 140 0.7 2.0 Ammonium nitrate NH4N03 N 280 0.7 5.5 Calcium nitrate Ca(N03)2 N 280 2.0 6.9 Aqua ammonia NH40H N 140 0.7 5.5 Ammonium sulphate (N~)2S04 N 280 1.4 4.5 Urea CO(NH2h N 280 2.7 7.0 Mono-ammonium NH4H2P04 N 140 0.4 4.7 phosphate p 310 Di-ammonium phosphate (N~)2HP04 N 280 0.6 7.8
p 310 Phosphoric acid H3P04 p 310 0.4 2.3 Di-potassium phosphate K2HP04 p 310 1.9 9.2
K 780
Mono-potassium KH2P04 p 310 0.7 4.6 phosphate K 390 Potassium chloride KCl K 390 0.7 7.0 Potassium nitrate KN03 N 140 0.7 7.0
K 390 Potassium sulphate K2S04 K 780 0.2 7.0 Magnesium chloride MgCh Mg 240 2.0 6.8 Magnesium sulphate MgS04 Mg 240 2.2 6.9
Data in Table 4.2 show that, for example, (i) calcium nitrate would generate a higher osmotic pressure in a solution, per amount of total nutrient applied,
18
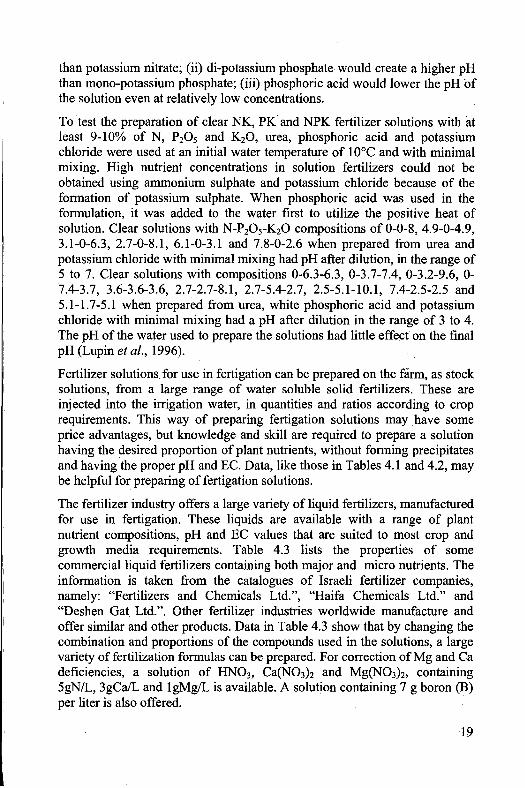
than potassium nitrate; (ii) di-potassium phosphate would create a higher pH than mono-potassium phosphate; (iii) phosphoric acid would lower the pH of the solution even at relatively low concentrations.
To test the preparation of clear NK, PK and NPK fertilizer solutions with at least 9-10% of N, P20 5 and K20, urea, phosphoric acid and potassium chloride were used at an initial water temperature of 1 ooc and with minimal mixing. High nutrient concentrations in solution fertilizers could· not be obtained using ammonium sulphate and potassium chloride because of the formation of potassium sulphate. When phosphoric acid was used in the formulation, it was added to the water first to utilize the positive heat of solution. Clear solutions with N-P20 5-K20 compositions of 0-0-8, 4.9-0-4.9, 3.1-0-6.3, 2.7-0-8.1, 6.1-0-3.1 and 7.8-0-2.6 when prepared from urea and potassium chloride with minimal mixing had pH after dilution, in the range of 5 to 7. Clear solutions with compositions 0-6.3-6.3, 0-3.7-7.4, 0-3.2-9.6, 0-7.4-3.7, 3.6-3.6-3.6, 2.7-2.7-8.1, 2.7-5.4-2.7, 2.5-5.1-10.1, 7.4-2.5-2.5 and 5.1-1.7-5.1 when prepared from urea, white phosphoric acid and potassium chloride with minimal mixing had a pH after dilution in the range of 3 to 4. The pH of the water used to prepare the solutions had little effe~t on the final pH (Lupin et al., 1996).
Fertilizer solutions for use in fertigation can be prepared on the farm, as stock solutions, from a large range of water soluble solid fertilizers. These are injected into the irrigation water, in quantities and ratios according to crop requirements. This way of preparing fertigation solutions may have some price advantages, but knowledge and skill are required to prepare a solution having the desired proportion of plant nutrients, without forming precipitates and having the proper pH and EC. Data, like those in Tables 4.1 and 4.2, may be helpful for preparing of fertigation solutions.
The fertilizer industry offers a large variety of liquid fertilizers, manufactured for use in fertigation. These liquids are available with a range of plant nutrient compositions, pH and EC values that are suited to most crop and growth media requirements. Table 4.3 lists the properties of some commercial liquid fertilizers containing both major and micro nutrients. The information is taken from the catalogues of Israeli fertilizer companies, namely: "Fertilizers and Chemicals Ltd.", "Haifa Chemicals Ltd." and "Deshen Gat Ltd.". Other fertilizer industries worldwide manufacture and offer similar and other products. Data in Table 4.3 show that by changing the combination and proportions of the compounds used in the solutions, a large variety of fertilization formulas can be prepared. For correction ofMg and Ca deficiencies, a solution of HN03, Ca(N03h and Mg(N03)2, containing 5gNIL, 3gCa/L and lgMg!L is available. A solution containing 7 g boron (B) per liter is also offered.
19
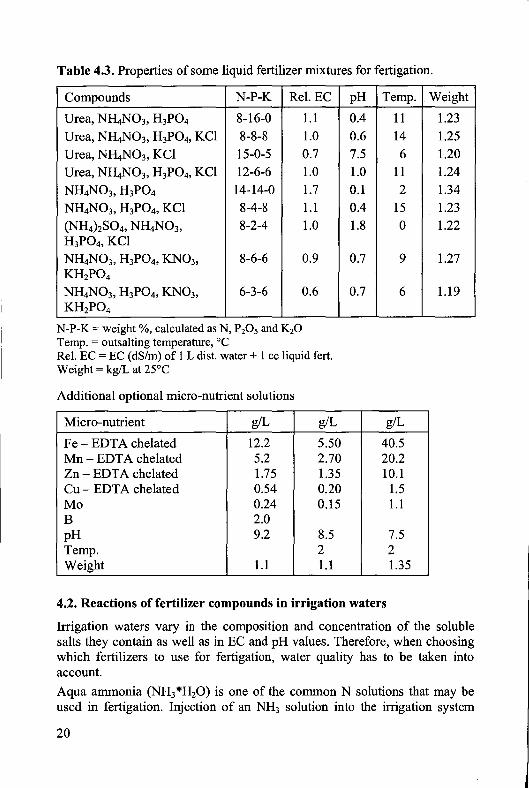
Table 4.3. Properties of some liquid fertilizer mixtures for fertigation.
Compounds N-P-K Rel. EC
Urea, NRtN03, H3P04 8-16-0 Urea, NRtN03, H3P04, KCl 8-8-8 Urea, NRtN03, KCl 15-0-5 Urea, NRtN03, H3P04, KCl 12-6-6 NRtN03, H3P04 14-14-0 NRtN03, H3P04, KCl 8-4-8 (NH4)zS04, NRtN03, 8-2-4 H3P04, KCl NRtN03, H3P04, KN03, 8-6-6 KH2P04 NRtN03, H3P04, KN03, 6-3-6 KH2P04
N-P-K =weight%, calculated as N, P20 5 and K20 Temp. = outsalting temperature, °C
1.1 1.0 0.7 1.0 1.7 1.1 1.0
0.9
0.6
Rei. EC = EC (dS/m) of I L dist. water+ 1 cc liquid fert. Weight= kg/L at 25°C
Additional optional micro-nutrient solutions
Micro-nutrient g/L g/L
Fe - EDT A chelated 12.2 5.50 Mn - EDT A chelated 5.2 2.70 Zn - EDT A chelated 1.75 1.35 Cu- EDTA chelated 0.54 0.20 Mo 0.24 0.15 B 2.0 pH 9.2 8.5 Temp. 2 Weight 1.1 1.1
pH Temp.
0.4 11 0.6 14 7.5 6 1.0 11 0.1 2 0.4 15 1.8 0
0.7 9
0.7 6
g/L
40.5 20.2 10.1
1.5 1.1
7.5 2 1.35
4.2. Reactions of fertilizer compounds in irrigation waters
Weight
1.23 1.25 1.20 1.24 1.34 1.23 1.22
1.27
1.19
Irrigation waters vary in the composition and concentration of the soluble salts they contain as well as in EC and pH values. Therefore, when choosing which fertilizers to use for fertigation, water quality has to be taken into account.
Aqua ammonia (NH3*H20) is one of the common N solutions that may be used in fertigation. Injection of an NH3 solution into the irrigation system
20
may cause clogging by raising the water pH. In water rich in divalent cations (Ca2+, Mg2+) and bicarbonate (HC03) anion, the increase in pH induces precipitation of calcium and magnesium carbonates (CaC03, MgC03) that may clog water emitters and filters. The amount of precipitation depends on both the concentration of NH3 injected and the concentration and composition of the salts in the water. Water with an EC of 0.2 dS/m and containing 10 mg!L of Ca + Mg can safely tolerate an NH3 - N concentration of 30 g/L. Water with a somewhat higher salt concentration, having an EC of 0.8 dS/m and Ca + Mg concentration of 30 mg!L, can only tolerate 1 g/L of NH3 -N.
Such data can be used to develop fertigation recommendations; for example, to prevent precipitates forming with the water quality encountered in dry areas. Assuming water with an EC of 2.5 dS/m and a divalent cation concentration (Ca + Mg) of 200 mg/L, the injected NH3 - N concentration should not exceed 0.25 g/L (Whiting, 1975).
High concentrations of ammonium sulphate (N~)2S04 may slightly acidify the water. At very high concentrations, the sulphate anion· (S04
2) may
combine with the Ca2+ dissolved in the water and calcium sulphate (CaS04)
precipitate out. Other N sources, like urea and ammonium nitrate (N~N03) do not tend to interact with salts dissolved in irrigation water and their addition does not pose any risk.
Phosphate containing fertilizers used in fertigation may react in several ways with salts dissolved in irrigation water. One of the common sources of phosphates is phosphoric acid, or to be more precise, orthophosphoric acid (H3P04). This is a relatively strong acid and by lowering the pH of the irrigation water it causes dissolution of some precipitated salts and thus acts as a cleaning or anti-clogging agent in the system. Mono-ammonium phosphate (N~H2P04), a salt of the orthophosphoric acid, is used in many mixtures for fertigation. Above a certain concentration of both phosphate anions and divalent cations, like Ca2
+, precipitates such as di-calcium phosphate (CaHP04) or tri-calcium phosphate [Ca3(P04)2] will precipitate out of the solution and cause clogging. The critical concentration of phosphate added to irrigation water is difficult to predict, because it depends, in addition to the concentration of Ca and Mg, on the presence and concentration of other ions and the pH of the solution. For example a precipitate was produced in irrigation water containing 200 mg Ca /L, when ammonium phosphate was added to give a concentration of P greater than 7.5% (Duis and Burman, 1969).
Polyphosphates are used in some formulations as sources of P, especially if there is a risk of forming precipitates when orthophosphates are used~ Polyphosphate acids are polymers of orthophosphoric acid and the structure of these acids and a schematic representation of polymerisation is given in
21

Figure 4.1. Formation of a pyrophosphoric acid molecule from two orthophosphoric acid molecules, with exclusion of one molecule of water is shown. In a similar process by addition of another orthophosphoric acid molecule to a pyrophosphoric acid molecule, tripolyphosphoric acid is formed. Longer chains may be polymerized. Polyphosphate fertilizers contain mostly a mixture of compounds of varying chain length.
Orthophosphoric acid Pyrophosphoric acid
/OH O=P-OH
"oH
OH OH I I /OH
+ O=E'-OH "-oH
O=P-0-P=O + H20 I I
OH OH
9H 9H 9H O=P-0-P-0-P=O
\.. \. \. UH OH OH
Tripolyphosphoric acid
Fig. 4.1. Structure of some phosphoric acids.
Reaction of these acids with .cations may form s~lts like, ammonium polyphosphate that are used in fertilizer formulations. A relevant property of polyphosphates is their ability to sequester cations, like Ca. Adding sufficient polyphosphate to water rich in Ca, produces water-soluble Ca phosphates and thus prevents the formation of precipitates. Injection of small quantities of polyphosphate solution into water rich in Ca may precipitate calcium pyrophosphate of low water solubility, but increasing the amount of polyphosphate will dissolve the precipitate and prevent the formation of new precipitates. Some quantitative examples of 11-37-0 composition fertilizers are taken from Duis and Burman (1969) and Noy and Yoles (1979).
No precipitate will form by injection of any quantity of an ammonium polyphosphate into irrigation water containing 100 mg Ca /L.
In water having 200 mg Ca /L, if a polyphosphate solution is injected to generate a 1:300 dilution a precipitate will form, but not if the ratio is 1:200.
In water with 500 mg CalL, a dilution of 1:100 will cause precipitates to form but not at a dilution of 1:50.
Slightly different results to these related to the minimum concentration required to prevent precipitation are reported in the literature. The differences
22
are probably related to the ,varying ratios of polyphosphate chain length in · the fertilizers used. In practice, the quantity of polyphosphate to be used should be tested for every batch to establish the critical ratio.
The solubility of potassium (K) salts in water at usual air temperatures is such that in most cases large concentrations may be injected into the irrigation water. The data in Table 4.1 show that at 20°C KCl can give a solution of up to 34%, KN03 up to 32%, mono-potassium phosphate (KH2P04) up to 30% and di-potassium phosphate (K2HP04) has even greater solubility. K2S04 on the other hand has a lower solubility in water, only up to 11% at 20°C. In addition, in water rich in divalent cations, mainly Ca, CaS04 with relatively low solubility in water can be precipitated.
Elam et al. (1995) tested KCl, K2S04, and KN03, for use in fertigation where fast dissolving salt and a high final K concentration were required. The KCl was the most soluble up to 25°C and the solution had the highest concentration of K at lower temperatures. The solubility of KN03 increased with temperature, while K2S04 was the least soluble. For crops not sensitive to chloride or under leaching conditions, KCl was the most suitable fertilizer for fertigation because its dissolution was the fastest, its K content was the highest, its sensitivity to temperature change was the smallest, and it was the cheapest of the three fertilizers tested.
Micro-nutrients, which are usually used in chelated form, may be injected into irrigation water along with macro-nutrients (Table 4.3). In the chelated forms, most micro-nutrients do not form precipitates.
-. 4.3. Reactions of nutrients, applied through fertigatio~, in soils and growth media
Plant nutrients, applied in soluble forms in fertigation can move and react with soils and other growing media.
Urea (NH2 CO NH2), a simple organic molecule and not a salt, is found in a. number of fertilizer formulations (Table 4.3). Care should be taken to ensure that urea does not contain more than 0.25% biuret (NH2 CO NH CO NH2),
because this is toxic to plants. · ·
Urea is very soluble, 1 kg/L of water under normal conditions and for practical purposes there is no limit to the urea concentration in irrigation water. Urea will move with the water through the soil or growth media until it is hydrolyzed by the omnipresent enzyme, urease, to form ammonium carbonate:
CO(NHz)z + 2Hz0 = (NH4)zC03.
This compound is unstable and decomposes into ammonia and carbon dioxide: (N~)2C03 = 2NH3 + C02 + H20.
23
The ammonia (NH3) may be adsorbed on soil and growth media surfaces or dissolve in water as the ammonium cation (NH/), which may be adsorbed to the soil cation exchange sites (CE). In alkaline conditions, some NH3 may be lost by volatilization.
The time required for hydrolysis of half the amount of urea applied varies from several hours to several days (Balwinder-Singh et al., 1996). Temperature and pH of the media affect the rate of urea hydrolysis; within the range of 5-45°C the rate doubled for each l0°C increase in temperature (Moyo et al., 1989) and was maximum at about a pH of 6.5 (Cabrera et al., 1991). With increasing calcium carbonate content, salinity and alkalinity, the rate of hydrolysis tends to decrease, while it tends to increase with increasing clay and organic matter content in the growth media.
Other forms of nitrogen fertilizers used in fertigation are ammonium (N~) and nitrate (N03) salts. Ammonium salts will stay in solution in growth media and coarsely textured soils. In soils containing clay, part of the N~ will be adsorbed on CE sites and some may be fixed within the crystal lattice of the clay. Ammonium, both in solution and adsorbed is readily available to plants and to microorganisms. Under normal environmental conditions, NH4
will be oxidized to N03 by microorganisms. The rate of nitrification depends on environmental conditions and may take from several days to several weeks, for half of the initial NH4 to be nitrified. Autotrophic bacteria, with nitrite (N02) formed first and then N03 perform the process of nitrification. The process results in the release of energy. The reactions may be described by the following equations:
2N~+ + 302 = 4H+ + 2H20 + 2N02-2N02- + 02 = 2N03-
The equations show that oxygen is required and that H+ ions are released, acidifying the zone around the nitrification site. Thus, the application of ammonium salts or urea may have an acidifying effect on the growth media. Presence of calcium carbonate (CaC03) in soils or media will readily neutralize the acidity.
Soil texture affects the rate of nitrification because it determines the degree of aeration and the buffer capacity. In an experiment with apple trees grown on a gravelly sandy loam and fertigated with ammonium fertilizers, soil acidification began within one year in a zone extending 60 cm vertically and horizontally from the drip source. Acidification was most severe at 20-30 cm directly beneath the emitter where the soil pH decreased from 5.8 to 4.5 after 1 year and to 3. 7 after three years of fertigation. In addition, a rapid displacement ofK was observed (Parchomchuk et al., 1993).
The variation in the rate of nitrification between coarse and fine (clayey) textured soils is related also to the water content of the soil or growth
24
medium .. · If moisture is expressed by tension, the optimal moisture- and aeration are in the range of 0.1 to 1.0 bar. At a tension of approximately 0.0 I bar, the medium is saturated with water, and with no air nitrification stops because the bacteria require oxygen. Similarly, nitrification will stop above a tension of 15 bar, because oflack of available water for the microorganisms.
Some quantitative indications of the effect of pH on the rate of nitrification of N~ were reported by Kuldip-Singh (1996). In an incubation experiment with soil at 60% water filled pore space, the rate of nitrification was highest at pH 7.4 (7 mg N/kg soil per day), it was moderate (3 mg N/kg) at pH 9.4, and lowest (1 mg N/kg) at pH 4.8. In general, the optimum range for nitrifying activity is between pH 6.6 to 8.4. At a pH below 4.0 and above 9.5 nitrification stops. ·
The N~ source has an influence on the pH generated by the fertilizer application. In a nitrification study, ammonium was applied as ammonium sulphate, di-ammonium phosphate and urea to a moderately acidic, poorly pH-buffered soil. Nitrification rates were found to vary with the inherent alkalinity of the N source. The highest rate was obtained with urea, somewhat lower with di-ammonium phosphate and lowest with ammonium sulphate (Mclnnes and Fillery, 1989). -'""----
The movement and transformations of ammonium sulphate, ure:t'and calcium nitrate in the wetted volume of soil below the trickle emitter was studied in a field experiment (Haynes, 1990). Effects on soil pH in the wetted soil volume were also investigated. During a fertigation cycle (emitter rate 2 L/h) the applied ammonium was concentrated in the 10 cm of soil immediately below the emitter and little lateral movement occurred. In contrast, because of their greater mobility in the soil, fertigated urea and nitrate were more evenly distributed down the soil profile below the emitter and had moved laterally in the profile up to 15 cm radius from the emitter. The conversion of applied N to nitrate-N was more rapid with urea rather than ammonium sulphate, suggesting that the accumulation of large amounts of ammonium below the emitter in the ammonium sulphate treatment retarded nitrification. The nitrification of NH4 from both, ammonium sulphate and urea acidified the wetted soil volume. Acidification was confined to the surface 20 cm with the ammonium sulphate, but to 40 cm depth with urea.
Nitrate is the prevalent N-form in growth media irrespective of whether the fertilizer used is urea, an ammonium salt or a nitrate salt. Nitrate will move with irrigation water through the soil or growth medium because it does not react with soil components. In a fertigated system, movement of water and thus of N03 can be sufficiently well controlled so that leaching below the zone in which crop roots are active is minimized. However, some leaching and thus loss of N03 below the rooting depth is inevitable, due to the necessity of applying more water than is required to satisfy the water holding
2.S

capacity of the medium. Excess water is needed to remove excess salts that may accumulate in the medium. Compared to other irrigation and fertilization methods, fertigation minimizes N03 movement below the rooting depth and thus considerably reduces water pollution.
Loss of N03 from the growth media may be caused by denitrification, a microbial process in which N03 is reduced to nitrous oxide (N20) and fmally to nitrogen gas (N2). The necessary conditions for denitrification are a lack of free oxygen and the presence of organic matter as an energy source for the microorganisms responsible for denitrification. Under such conditions, a variety of microorganisms derive their energy by using the oxygen from the N03 to oxidize organic molecules. The denitrification process goes through a number of stages. The overall reaction, using glucose as the organic energy source and ending with gaseous nitrogen, may be written as follows:
5C6H120 6 + 24 N03- = 6C02 + 24HC03- + 18H20 + 12N2 •
The rate of denitrification is relatively fast, under optimum conditions it may be completed within 1-4 days. As is any microbial process, denitrification is temperature dependent. It does not occur at extreme temperatures, such as ooc and 70°C, within the normal range of soil temperatures, the rate doubles for each 10°C increase in temperature.
Phosphate fertilizers used for fertigation have, by definition, to be completely water soluble compounds. Conventional phosphate fertilizers, like superphosphates which are essentially mono-calcium phosphate [Ca(H2P04)z*H20], although water soluble, are not suitable for fertigation, because of their incongruent dissolution. This means that in the process of dissolution new compounds, like di-calcium phosphate (CaHP04), having very low water solubility, are formed, causing clogging of emitters. The incongruent dissolution reaction may be described as follows:
Ca(HzP04)z*HzO = CaHP04 + H3P04 + HzO
Ammonium- and potassium-phosphates and phosphoric acid (See Table 1) are, under normal environmental conditions, completely soluble and are good sources ofN and K, as well asP. Although, when in soil these salts may react with di- and tri-valent cations and form less soluble compounds. Ammoniumand potassium-phosphates have a higher pH in solution than phosphoric acid, making them less reactive and thus generating a larger phosphate emiched soil volume.
Experiments with cucumber and muskmelon when grown in containers in soilless media showed that mono-potassium phosphate (MKP) was very effective as a source of both P and K (Nerson et al., 1997). The efficiency of MKP was the same as that of a combination of phosphoric acid (H3P04) and KCL The authors concluded that use of MKP is preferable, as it is safer to handle than H3P04.
26

Polyphosphate fertilizers, after coming· in contact with soil or growth media, are hydrolyzed by an enzymatic reaction. The reaction is rather complicated because the ammonium polyphosphate solution contains several species like orthophosphate, pyrophosphate, tri-poly-phosphate and higher polymers. The end product of polyphosphate hydrolysis is orthophosphate. As a schematic example, the hydrolysis oftri-poly-phosphate acid proceeds as follows:
H5P30 10 + 2H20 = 3H3P04.
The growth medium temperature, moisture, pH and other factors influence the rate of hydrolysis. It is relatively fast and completed within several hours to several days.
Potassium reactions in growth media and coarse-textured soils differ from those in soils containing clay. Potassium fertilizers used in fertigation are readily soluble and the K remains as the positively charged ion in nonreactive growth media and sandy soils. When the soil contains clay most of the K added as soluble fertilizer will be retained as exchangeable and non-_ exchangeable, fixed K. Exchangeable K is usually readily available to plants. Both exchangeable and fixed K are retained in soil as the positively charged ion held by negative charges on the surface or within clay particles. By defmition exchangeable K is that fraction of the K which exchanges with other cations when these are leached in excess through the soil: As plant roots take up K from the soil solution it is replenished first by the exchangeable K and this in turn can be replenished by fixed K.
Calcium as Ca2+ is often present in adequate and sometimes in large
quantities in irrigation waters and in soils in areas with fertigation systems. Therefore, in most cases there is no need to apply Ca.
The divalent magnesium ion (Mg2+) is not found as often as Ca in irrigation water and soil. In soil, plant available Mg is found in the soil solution and as an exchangeable cation. Magnesium deficiencies may occur in sandy soils and growth media due to their low CEC. Intensive cropping under these conditions may lead within a short period to exhaustion of plant available Mg. In clayey soils, an imbalance between plant available Mg, Ca and K may cause Mg deficiency. For example, applying too high a rate of K may cause Mg deficiency if there is only a small amount of exchangeable M g. In case of deficiency, Mg salts may be applied in fertigation (Tables 4.1 and 4.2).
Sulphur (S) can be applied as a specific fertilizer in fertigation when required as a plant nutrient. In some formulations S is included as an accompanying ion, such as magnesium sulphate or ammonium sulphate. If S deficiency is likely because of the nature of the growth media and with sandy soils, sulphate-containing fertilizers may be added to the fertigation solution. In most arid and semi-arid soils, S deficiency would not be expected. The sulphate ion (SO/) is plant available. Some S is released into a plant
21
available form by mineralization of soil organic matter. On the other hand, sulphate not absorbed by plant roots, nor leached, may be incorporated into organic forms by microorganisms.
Cationic micronutrients, iron (Fe), zinc (Zn), copper (Cu) and manganese (Mn) in fertigation are mostly applied in a chelated form. Chelates are synthetic organic compounds that contain the cation in a complex form that protects it from reacting with components in water and soil. Plant roots can take up the soluble chelate and thus circumvent any undesirable reaction.
Boron (B) and molybdenum (Mo), if deficient, are applied as soluble salts in minute quantities and stay available to plants.
4.4. Fertigation applied nutrient distribution in soils and growth media
Vertical nutrient distribution in fertigated soils and growth media is a function of the movement of the applied water and the properties of the soil or growth media. The soluble nutrient salts move with the applied water, unless reactions occur with components of the soil or growth medium. For example, phosphates may be precipitated in presence of Ca, Fe or Al in the soil solution, while K, Mg and N~ ions may be retained on CE sites in the soil. Thus, in soils, these reactions may prevent the extensive movement of the nutrients with water. On the other hand, no precipitation or adsorption reactions may be expected with nitrates or with some phosphate species, like polyphosphates.
The movement of water and with it N03 and other very soluble salts is different in fine textured soils compared to that in coarse textured soils and inert growth media, where the movement depends on the growth medium properties. In a growth medium with coarse particles of uniform size and packing or in a coarse sandy soil, the pores through which water and with it the N03 move are large, uniform and continuous and the flow of water and with it of dissolved nutrients is even and unobstructed. This is called pistonlike flow and the N03 flux may be described by a simple equation:
qN = qw ° CN
where the flux of N03 (qN) is a function of the flux of water (qw) and concentration ofN03 in that water (CN).
In a fine textured, structured soil, with a range of sand, silt and clay particles, the N03 flux will be different because of the variety of pore width, length and continuity. Water will move more rapidly through larger pores than through smaller ones and may be blocked in those that are not continuous. Thus some of the N03 in solution is displaced ahead of, and some behind of the main flux of N03 through the soil hydrodynamic dispersion. As a result, a N03
concentration wave is formed, the shape of which changes with time, becoming gradually flatter and longer (Figure 4.2).
28

f•'-
Fig. 4.2. Nitrate distribution, changing with time.
!I Initial DMedium •Late
The simplest equation describing the flux of nitrate by ~hydrodynamic dispersion is:
qN = qw • CN-D • (dCN/dx)
where the flux ofN03 (qN) is proportional to the water flux (q~) and the N03
concentration (CN) and is continuously diminished relative to a factor D and to the change in soil depth (x). The factor D depends on soil properties, such as texture and structure, determining pore size and distribution.
In fertigation technologies, applying water in furrows or by flooding and fertilizers from tanks, an uneven horizontal distribution of water ahd nutrients may be expected. The pressurized water supply in drip irrigation linked to controlled fertilizer injection may insure a more even spatial and temporal water and fertilizer distribution. The volume of field soil wetted by drip fertigation and enriched with nutrients varies according to quantities of water applied and water holding capacity of the soil. For example, in an apple orchard, water and nutrient distribution was found to be within a radius of 40 cm from the dripper (Komosa et al., 1999a and 1999b).
5. Technology
5.1. Irrigation technology
Fertigation can be employed with any irrigation technology, but the uniformity and efficiency of the nutrient application may differ with the different irrigation methods, surface, non-pressurized irrigation, or pressurized irrigation.
29

5.1.1. Surface irrigation
Surface irrigation is the most widespread irrigation technology, covering more than 90% of the 250 Mha under irrigation worldwide. Generally, it is regarded as a wasteful technology, only 30% and 70% of the total water applied remains in the active root zone. Plate 5.1 shows a flood irrigated field in China. Water use efficiency is greater and may reach 90% in more advanced techniques such as zero slope and surge irrigation.
Selection of the surface irrigation method depends on factors such as climate, soil type, topography, cropping technology, water availability and quality, distribution facilities, farmers' managerial skill and tradition. The soil characteristics considered are structure, texture, surface encrustation, permeability, range of available water from field capacity to wilting point, presence of compact soil layers and aeration. The relevant climate factors are rainfall and evaporation rate during the growing season. When all these factors are carefully considered and the best management practice adopted, water use efficiency will be above average for this type of systems and good yields and quality can be achieved.
Flood irrigation
(i) Border .'>trip flooding: The level border bed (broad-bed, or paddy) resembles a shallow broad ditch, 4 to 18 m wide, bordered by levees, with a zero slope across its width and a longitudinal slope not greater than 1%. By opening the floodgate at the head of the bed, or by activating siphons, the bed is filled with water from a channel or furrow. This method requires some soil levelling and high-volume water flows. Wetting the bed for only a short period of time prevents water loss below the depth of rooting. Performance of the system is monitored by measuring the advance and retreat of water as a function of time. Rice, banana, cotton, alfalfa and other field crops are irrigated by this method.
(ii) Graded borders: This layout is applied where the land is not completely level. The graded borders keep the height difference inside one bordered bed to a minimum and so ensure considerable uniformity of water distribution.
(iii) Levelled beds between contour lines: This method is similar to graded border strip flooding, except that the contour lines are the borders. This layout is the only one feasible where the topography is uneven.
(iv) Dead level layout: This zero slope layout can be used with high precision land levelling using laser sensors. Irrigation efficiency in this layout can be much higher than in the previous three methods. Width of the land between the borders is limited to 100-150 m.
30
Furrows
Water is distributed in the field by means of narrow ditches. Each one provides water to one or two rows of plants. To optimize water use efficiency necessitates applying the water in two steps. In the first, a large flow is sent to rapidly wet the soil surface along the whole furrow. Then a second flow of low volume is delivered over a longer time-span to wet the soil to the depth of rooting.
Surge irrigation
Surge irrigation and zero slope levelling increase the efficiency of surface irrigation equivalent to that of pressurized irrigation. Surge irrigation can be applied to systems employing both flood and furrow irrigation. The principle of surge irrigation is to split the application of water into several pulses. The first pulse applies a great volume of water, wetting as fast as possible the entire length of the irrigated bed or furrow, without inducing erosion. This first flow partially seals the upper layer of the soil and thus enables the next pulses of water to be of smaller volumes for a longer period of time, so that the water percolates deeper into the soil along the flow path: Modern surge irrigation layouts employ automatic surge valves that direct water in alternating pulses to different sectors of the field according to a pre-planned timetable.
5 .1.2. Pressurized irrigation
Sprinkler irrigation
Sprinkler irrigation (Plate 5.2) is compatible with diverse topographic conditions, such as uneven land and steep slopes that cannot be irrigated by surface irrigation. Diverse types of emitters and nozzles facilitate the tuning of the water application rate to the rate of infiltration into the soil.
Uniform distribution of water in the field, accurate measurement of the applied water and high quality control accessories facilitate high water use efficiency. Sprinkler irrigation is sensitive to wind conditions. Wind reduces the uniformity of water distribution across the soil surface and decreases water use efficiency. Overhead irrigation may enhance leaf and fruit cryptogamic diseases and with water containing a high salt concentration may cause leaf-bum.
The utilization of solid-sets and self-propelled systems minimizes the requirement for labour. When investment capital is short and labour is cheap; hand-move systems enable the irrigation of vast areas with relatively low initial capital investment. The operating routine is simple and reliable and operators require only a short period of training.
31
All versions of sprinkler irrigation systems are adaptable to fertigation. Care has to be taken to avoid corrosion of metallic components by contact with corrosive fertilizers and scorching of the plant canopy by caustic fertilizers when using overhead sprinkler irrigation.
Sprinklers are made of metal and plastic materials. Reinforced plastic moving parts and nozzles wear much less than metallic ones. The sprinklers are mounted on risers of various heights, according to the technique and the crop characteristics.
With a dense plant population, like field crops and vegetables, even water distribution over the whole surface area is required. This is achieved by appropriate spacing between the laterals and between the sprinklers along the laterals, ensuring adequate overlapping. On the other hand, in orchards, even coverage of the soil surface is not feasible because of the interference of the tree canopy and in fact it is not required. Under-canopy sprinklers, without full overlapping between them, are used. In this case, each tree has to get the same water amount and the water distribution in the soil has to correspond with the spatial distribution of the root system.
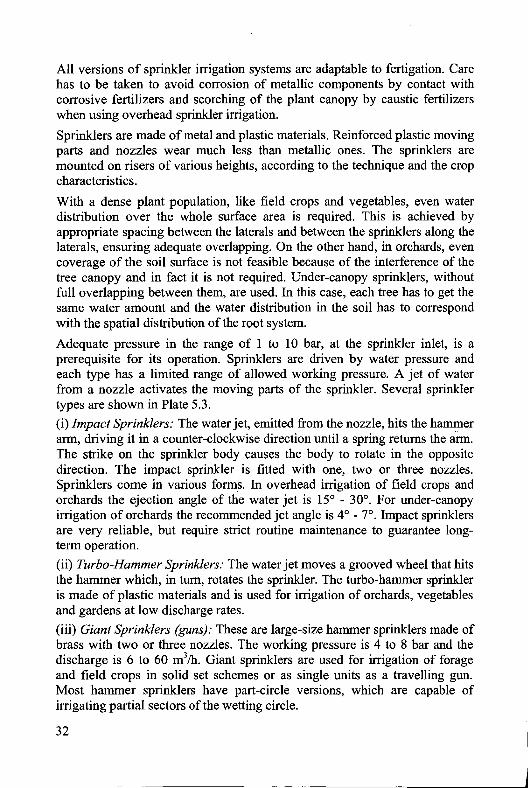
Adequate pressure in the range of 1 to 10 bar, at the sprinkler inlet, is a prerequisite for its operation. Sprinklers are driven by water pressure and each type has a limited range of allowed working pressure. A jet of water from a nozzle activates the moving parts of the sprinkler. Several sprinkler types are shown in Plate 5.3.
(i) Impact Sprinklers: The water jet, emitted from the nozzle, hits the hammer arm, driving it in a counter-clockwise direction until a spring returns the arm. The strike on the sprinkler body causes the body to rotate in the opposite direction. The impact sprinkler is fitted with one, two or three nozzles. Sprinklers come in various forms. In overhead irrigation of field crops and orchards the ejection angle of the water jet is 15° - 30°. For under-canopy irrigation of orchards the recommended jet angle is 4 o - 7°. Impact sprinklers are very reliable, but require strict routine maintenance to guarantee longterm operation.
(ii) Turbo-Hammer Sprinklers: The water jet moves a grooved wheel that hits the hammer which, in turn, rotates the sprinkler. The turbo-hammer sprinkler is made of plastic materials and is used for irrigation of orchards, vegetables and gardens at low discharge rates.
(iii) Giant Sprinklers (guns): These are large-size hammer sprinklers made of brass with two or three nozzles. The working pressure is 4 to 8 bar and the discharge is 6 to 60 m3 /h. Giant sprinklers are used for irrigation of forage and field crops in solid set schemes or as single units as a travelling gun. Most hammer sprinklers have part-circle versions, which are capable of irrigating partial sectors of the wetting circle.
32
(iv) Pop-Up Sprinklers: Pop-up sprinklers are commonly used for -the, irrigation of lawns and recreational grass. The sprinkler jumps upward at the start of the irrigation period and falls back into its underground, covered housing after shutdown. It remains there in a stand-by position until the next irrigation. There is a wide-range of pop-up sprinkler types, including partcircle sprinklers, as well as rise-ups of various heights.
(v) Static Sprinklers: They are made of brass or rigid plastic materials, without moving parts. These sprinklers are used mainly in gardens and irrigate a full or partial circle. The wetting range is smaller than that of rotating sprinklers.
Sprinkler irrigation techniques
(i) Hand-move: Sprinkler laterals of 50 and 75 mm diameter and 6 or 12 m long segments are moved from one position to another. Each lateral is transferred to several positions during the irrigation cycle. At the beginning of the next irrigation cycle, the laterals are moved forward along the distribution line and the terminal lateral is returned to the beginning of the field. This method is known as the "clock method" and is widely used. The hand-move method is usually applied with small areas of field .:crops, vegetables and orchards, and also in fields that are not suitable for the towline method. The method is labour intensive and requires physical effort.
(ii) Towlines: The laterals are towed by tractor from one position to the next one. The number of tow positions will be twice the number of distribution lines.·corinllonly, laterals are towed between six positions but there are also fields with four, eight or even more positions. c
(iii) Hand-move in Orchards: Soft polyethylene laterals (grade 6) of 16, 20 or 25 mm diameter and up to 50 m long, with one or two sprinklers at the end of the lateral are pulled along the tree rows. At the beginning of the irrigation cycle the lateral is fully stretched. At the end of the first shift the lateral is pulled to its next position and so on until the cycle is completed. The equipment is returned to the starting position, by a "large move" to await the start of the next irrigation cycle.
(iv) Solid-Set in Orchards (a) Under Canopy Irrigation: Soft polyethylene (grade 4) pipes of 16, 20 or
25 mm diameters are laid out along the rows of the trees beside the trunks. Low-volume sprinklers, micro-sprinklers or micro-jets (up to 250 L/h) are mounted on the pipes or connected by means of a small diameter plastic tube. The application rate is low, ranging from 3 to 5 mm/h. The distance between emitters along the lateral corresponds to the tree spacing, one emitter per one or two trees. The sub-mains are commonly made of grade 4 or 6 bar, rigid polyethylene and are buried underground
33_
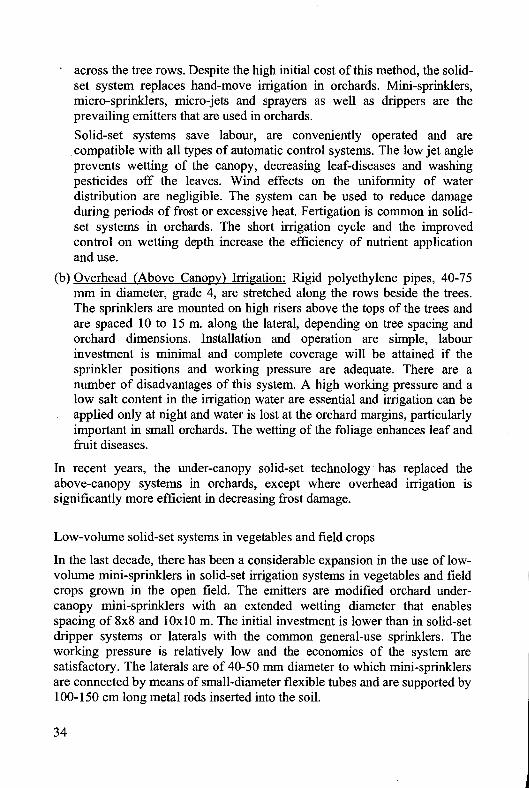
across the tree rows. Despite the high initial cost of this method, the solidset system replaces hand-move irrigation in orchards. Mini-sprinklers, micro-sprinklers, micro-jets and sprayers as well as drippers are the prevailing emitters that are used in orchards.
Solid-set systems save labour, are conveniently operated and are compatible with all types of automatic control systems. The low jet angle prevents wetting of the canopy, decreasing leaf-diseases and washing pesticides off the leaves. Wind effects on the uniformity of water distribution are negligible. The system can be used to reduce damage during periods of frost or excessive heat. Fertigation is common in solidset systems in orchards. The short irrigation cycle and the improved control on wetting depth increase the efficiency of nutrient application and use.
(b) Overhead (Above Canopy) Irrigation: Rigid polyethylene pipes, 40-75 mm in diameter, grade 4, are stretched along the rows beside the trees. The sprinklers are mounted on high risers above the tops of the trees and are spaced 1 0 to 15 m. along the lateral, depending on tree spacing and orchard dimensions. Installation and operation are simple, labour investment is minimal and complete coverage will be attained if the sprinkler positions and working pressure are adequate. There are a number of disadvantages of this system. A high working pressure and a low salt content in the irrigation water are essential and irrigation can be applied only at night and water is lost at the orchard margins, particularly important in small orchards. The wetting of the foliage enhances leaf and fruit diseases.
In recent years, the under-canopy solid-set technology has replaced the above-canopy systems in orchards, except where overhead irrigation is significantly more efficient in decreasing frost damage.
Low-volume solid-set systems in vegetables and field crops
In the last decade, there has been a considerable expansion in the use of lowvolume mini-sprinklers in solid-set irrigation systems in vegetables and field crops grown in the open field. The emitters are modified orchard undercanopy mini-sprinklers with an extended wetting diameter that enables spacing of 8x8 and lOxlO m. The initial investment is lower than in solid-set dripper systems or laterals with the common general-use sprinklers. The working pressure is relatively low and the economics of the system are satisfactory. The laterals are of 40-50 mm diameter to which mini-sprinklers are connected by means of small-diameter flexible tubes and are supported by 100-150 cm long metal rods inserted into the soil.
34
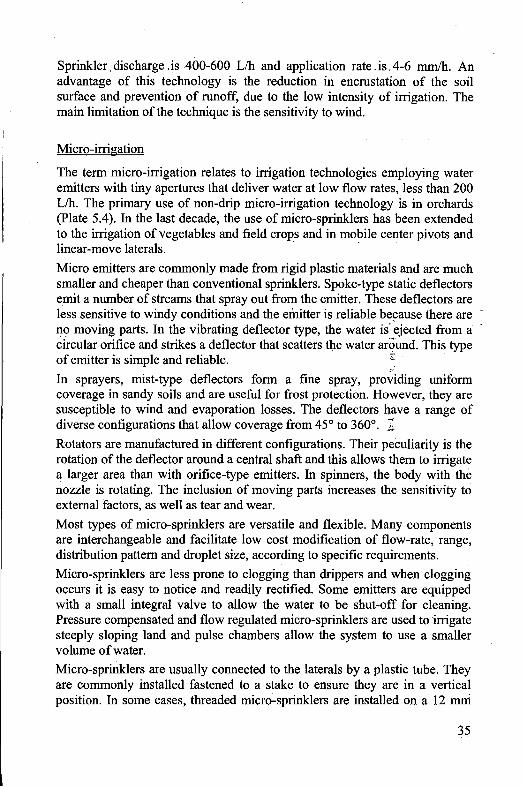
Sprinkler: discharge .is 400-600 L/h and application rate . is ,4-6 mm/h. An advantage of this technology is the reduction in encrustation of the soil surface and prevention of runoff, due to the low intensity of irrigation. The main limitation of the technique is the sensitivity to wind.
Micro-irrigation
The term micro-irrigation relates to irrigation technologies employing water emitters with tiny apertures that deliver water at low flow rates, less than 200 L/h. The primary use of non-drip micro-irrigation technology is in orchards (Plate 5.4). In the last decade, the use of micro-sprinklers has been extended to the irrigation of vegetables and field crops and in mobile center pivots and linear-move laterals. · ·
Micro emitters are commonly made from rigid plastic materials and are much smaller and cheaper than conventional sprinklers. Spoke-type static deflectors emit a number of streams that spray out from the emitter. These deflectors are less sensitive to windy conditions and the emitter is reliable be~ause there are ' no moving parts. In the vibrating deflector type, the water is-ejected from a circular orifice and strikes a deflector that scatters the water arQund. This type of emitter is simple and reliable. ::: · ,_ In sprayers, mist-type deflectors form a fine spray, providing uniform coverage in sandy soils and are useful for frost protection. However, they are susceptible to wind and evaporation losses. The deflectors have a range of diverse configurations that allow coverage from 45° to 360°. Z Rotators are manufactured in different configurations. Their peculiarity is the rotation of the deflector around a central shaft and this allows them to irrigate a larger area than with orifice-type emitters. In spinners, the body with the nozzle is rotating. The inclusion of moving parts increases the sensitivity to external factors, as well as tear and wear.
Most types of micro-sprinklers are versatile and flexible. Many components are interchangeable and facilitate low cost modification of flow-rate, range, distribution pattern and droplet size, according to specific requirements.
Micro-sprinklers are less prone to clogging than drippers and when clogging occurs it is easy to notice and readily rectified. Some emitters are equipped with a small integral valve to allow the water to be shut-off for cleaning. Pressure compensated and flow regulated micro-sprinklers are used to irrigate steeply sloping land and pulse chambers allow the system to use a smaller volume of water.
Micro-sprinklers are usually connected to the laterals by a plastic tube. They are commonly installed fastened to a stake to ensure they are in a vertical position. In some cases, threaded micro-sprinklers are installed on a 12 mni
35
to 18 mm rigid riser or directly on the lateral. In greenhouses, microsprinklers may be installed upside down for overhead irrigation.
Micro-irrigation with foggers is used frequently in greenhouses for increasing the relative humidity and decreasing the temperature of the ambient air. They are operated intermittently in pulses by an automatic controller. Bridge type micro-sprinklers provide improved support to the rotating spinner, but the vertical part of the bridge creates a dry area behind the vertical support.
Drip irrigation
Drip irrigation is used for the most precise water application related to crop water requirement and root system development. Drip irrigation employs a lower pressure than sprinkler irrigation and can be conveniently integrated with different levels of automatic control. Thus, it is very well suited to fertigation. Drip irrigation is independent of wind conditions and can be applied at any time of the day. Weed development is restricted because there is only partial wetting of the soil surface. A voiding the wetting of crop leaves decreases infection and spread of leaf diseases and leaf scorch. A pattern of soil wetting under drip irrigation is illustrated in Plate 5.5.
Dripper types
A low flow rate is the working principle of a dripper system. The low flow rate through an ordinary orifice would require an extremely small opening increasing the risk of clogging. This risk is reduced by using a wider water passage and dissipating the water pressure by friction within the walls of the dripper by a long spiral water path, or a labyrinth path, or by a vortex. Several types of drippers are shown in Plate 5.6.
The dependence of the dripper's flow rate on pressure can be expressed by the following equation: q = kP", where: q = dripper's flow rate in L/h. k = dripper's constant, relates to the units of the flow rate and the pressure. P =the pressure head at the dripper's inlet. e = exponent, depends on the flow regime in the dripper.
In non-regulated drippers the range of e is 0.4-1.0; in laminar flow in very thin tubes, the value of e is 1.0; in long spiral path drippers it is 0.7 and in vortex drippers it is 0.5.
The dependence of the flow rate on the pressure head decreases as e decreases. Because the flow rate is less dependent on the pressure head it is possible to have a small difference in the drippers flow rate, between the initial and the distal end of the dripper's lateral.
36
Historically, long path drippers were the first to be used. ,The labyrinth and the vortex types were developed later and allowed the production of smaller and cheaper drippers. The turbulent water flow in these two types dissipates the water pressure along a relatively short path. The pressure loss in the labyrinth type is created by changing the direction and diameter of the flow path along its length to generate turbulent flow. In the vortex drippers, the water enters the dripper in a tangential direction causing turbulence and a large loss in pressure. The working pressure of drippers ranges between 0.5 and 4.0 bars and the flow rate between 1.0 and 8.0 Llh. In some types of tape dripper laterals, lower flow rates of 0.1 to 0.5 Llh from each emitter outlet are feasible.
The low flow-rate of emitters in drip irrigation requires close spacing of the drippers on the lateral, ranging between 0.2 and 2 m. The distance between laterals depends on the spacing between the rows. In orchards, one or two laterals per tree row is common. In more densely grown annuals, like cotton and tomatoes, one lateral irrigates one or two crop rows. With thin-wall tapes the water outlets can be at 0.1 m along the lateral at no extra cost. ;~
Most of the drip-irrigated area is "on-surface" but in the last two. decades, sub-surface drip irrigation has expanded. The risk of clogging by root intrusion is prevented by routine injection of chemicals that sterilize the soil in close proximity to the dripper and prevent root penetration. The clogging of drippers by soil particles, caused by suction after water shut-off, is prevented by the installation of vacuum break valves that enable air flow into the system immediately after shut-off. "-
The wall thickness of dripper laterals made of soft polyethylene and P.V.C. depends on the working pressure. The grade is defined according to the allowed working pressure in the range of0.5-4.0 bar (5-40 m). Because of the relative low working pressure, drip systems require the use of pressure regulators in the control head.
Mechanized irrigation
Shortage of skilled manpower, accelerated conversion from surface to pressurized irrigation and the necessity to irrigate vast areas, triggered the development of mechanized irrigation. The first technologies were the towline as a replacement to hand-moved, and the mechanized side-roll as a modification of the manual side-roll. Later on, more advanced systems were developed such as the traveling gun, the linear move and the center pivot. Mechanized irrigation is suitable for large, over 10-20 ha rectangular plots on flat land or moderate slope, while with irregular shaped land its irrigation efficiency is low. Mechanized irrigation saves manpower but requires skilled and highly qualified operators and takes various forms.
37

(i) Towline: Towlines consist of ordinary, 6-12 m. long, aluminum pipes. Reinforced couplers connect the pipes, in order to minimize the risk of detachment during the tow operation. Gliders or wheels spaced 6-12 m. apart support the pipes. In the longer pipe units, the riser is mounted in the middle of the pipe, for better stability during towing. Towing is performed along the rows. (ii) Side Roll: The side roll consists of an aluminum or galvanized steel pipe, 75 to 150 mm in diameter. The pipe is the axle of metal wheels of 0.5-1 m radius. The maximum length of the lateral is 300-400 m. Sprinklers are mounted along the lateral on swiveling connectors equipped with ballast to secure the vertical position of the riser. The width of the irrigated area in each position ranges between 20 to 30 m. An engine mounted on the system propels the wheels from one irrigation position to the next after the predetermined amount of water has been applied, usually 3-12 hours. The operator has to start the engine and to advance the system to the next position, 12-24 m. forward. The side-roll system is compatible with slopes of up to 5% and with low-canopy crops only.
(iii) Travelling Gun: Travelling guns require a high working pressure of 6 to 8 bar. The discharge of a single gun may be up to 60 m3 /h and the wetting radius up to 50 m. Water is supplied by means of a wide diameter flexible hose on a reel mounted on a trailer. The gun can be pulled towards the trailer by winding the hose onto the reel, or propelled forwards by an integral engine or by water pressure. In a different assemblage the gun is mounted on a wheeled cart and pulled to the end of the field by cable.
(iv) Linear Move: The linear move lateral is constructed from a wide diameter, 100-200 mm aluminum pipe, 200-400 m. long, mounted on moving towers, equipped with wheels (Plate 5.7). Water emitters mounted along the lateral can be sprinklers, static or dynamic sprayers, rotators and spinners. A diesel or electric engine drives the system. The water inlet is located in the pipe end or in the center. The water is supplied from hydrants in the field or pumped directly from a canal along the field boundary by a wide diameter, flexible hose. The speed of advance depends on the amount of water to be applied, the intake rate of the soil and the discharge of the emitters. The length of advance may be 1000-2000 m. At the end of the trail, the lateral can be rotated by 180° and returned along an adjacent trail.
(v) Center Pivot: The lateral rotates in a circle around a fixed point (pivot) like a clock hand. The water supply outlet is connected to the lateral end. Because of the circular movement and in order to keep irrigation uniform along the lateral, each emitter has to discharge a different amount of water, less at the center and more at the margins. In a square field only 80% of the area is wetted. To wet the whole square, corner attachments are used. These devices add roughly 25% to the cost of the system. A center pivot with 400 m
38
long boom can irrigate ,a circle of 50 ha. and a 60 ha square when equipped with a corner attachment. The cost of the. required infrastructure, like the water supply network, hydrants, automation and electricity installation, when relevant, may amount to 25-50% of the gross cost of the system.
Water emitters
The early mechanized systems were equipped with ordinary high-pressure sprinklers. Frequently, distribution uniformity was not satisfactory, due to wind interference, excessive distance between the emitters and water runoff triggered by the high application rate and impact of water drops on the soil surface. Another drawback of these sprinklers was the high energy consumption.
In moving irrigation systems, in addition to the application rate factor, the parameter "Specific Longitudinal Discharge" (SLD), namely, the hourly discharge per unit length, along the moving lateral is very important. This parameter is required to estimate the maximal would-be irrigated area. The SLD is the hourly discharge divided by the lateral length. ~"
For example: System discharge- 600 m3/h, lateral length- 4oo::m. SLD = 600/400 = 1.5 m3 /m/h. ~,
With an increasing SLD the system can irrigate a larger area in a given time, provided no surface runoff occurs. The common SLD range is 0.5 -2m3/m/h. Common advance velocity is 50 - 100 m/h. .,
In the last decade, the tendency is to use more densely mounted low-volume emitters. Static and dynamic sprayers, rotators and spinners have been developed and are now installed 2 - 4 m apart along the lateral. The common emitter discharge is 1 - 2 m3 /h.
The modem mechanized units are equipped with sophisticated controllers that enable full control of the velocity of motion, discharge rate and the start and shut off of the water supply system.
Some units are equipped with built-in automatic filters, especially when water is pumped directly from a ditch in the field.
5.2. Fertilizer injection technology
5.2.1. Fertigation in surface irrigation
Fertigation is not a common practice in surface irrigation. When fertigation is applied, solid fertilizer or fertilizer solution can be poured into the water canal in a pre-determined amount. The instrumentation used is chosen from a wide range of devices beginning with a tank having an adjustable aperture in the bottom for solid fertilizers or a manually adjusted valve for fertilizer
39

solutions, and ending with the most sophisticated injection equipment integrated with automatic valves in surge irrigation.
Anhydrous ammonia is injected into the irrigation system by its intrinsic pressure.
The application of fertilizers in surface irrigation may be wasteful. A significant amount of the fertilizer, notably N, may be lost in tail water and in deep percolation. Nevertheless, there are growers that apply fertilizers with surface irrigation, insisting that the larger yields and better quality compensate for the financial cost of the fertilizer lost. Fertigation is used frequently in zero slope and surge irrigation, where its efficiency has been proved.
5.2.2. Fertigation technology in pressurized irrigation
In pressurized irrigation there is, by definition, pressure within the network. Injecting fertilizer solution into the system requires generating a pressure differential to overcome the internal pressure.
(i) Fertilizer tank (Plate 5.8): A pressure differential is generated by decreasing the water flow in the control head and diverting a fraction of the water through a tank containing the fertilizer solution. A gradient of 0.1-0.2 bar is needed to divert an adequate amount of water through a tube of 9-12 mm diameter. The tank, made of corrosion resistant enamel-coated or galvanized cast iron, stainless steel or fiberglass, has to withstand the network working pressure. Solid soluble fertilizers dissolving gradually in the tank, or liquid fertilizers mix with the flowing water. The nutrient concentration is more or less constant, as long as some solid fertilizer remains in the tank. At later stages, once the solid has gone, the concentration decreases, due to continued dilution of the fertilizer solution. The system is relatively simple and cheap. There is no need for an external energy source and a vast dilution ratio can be achieved. There are some drawbacks, however, the fertilizer injection rate and nutrient concentration in the irrigation water cannot be precisely regulated and before each application, the tank has to be refilled with fertilizer. The valve throttling induces pressure losses and the system is not compatible with automation.
(ii) Venturi (Plate 5.9): Suction by a Venturi apparatus is achieved by water passing through a constricted section. This increases the water flow velocity and generates a negative pressure, which sucks fertilizer solution from an open fertilizer tank via a tube mounted in the constricted section. Venturi devices are made of corrosion-resistant materials, such as copper, plastic and stainless steel. The injection rate of the Venturi device depends on the pressure loss which ranges from 10-7 5% of the initial pressure, depending on the injector type and operating conditions. The operation of Venturi
40
-------------------
devices requires excess pressure to allow for the necessary pressure .-loss. Constant pressure in the inlet of the injector guarantees uniform nutrient concentration over time. Pressure loss is indicated as a percentage of the inlet pressure. Suction usually commences above 33% of the inlet pressure, but double stage devices function with 10% pressure loss only. The suction rate depends on the inlet pressure, the pressure loss and the diameter of the water pipe and may be adjusted by means of valves and regulators. The suction rate may vary from 100 mllh- 2000 llh. Venturi injectors are installed in-line or on a by-pass. In greenhouses, the water flow in the bypass is boosted with an auxiliary water pump. Advantages of a Venturi system are: no external energy source is required; low cost suction from an open tank; wide range of suction rates; simple operation and low wear rate; easy installation and convenient mobility; compatible with automation; uniform nutrient concentration; corrosion resistant. Limitations of the system are: significant pressure losses; injection rates affected by pressure fluctuations.
(iii) Injection pumps: Fertilizer pumps can be driven by electiicity, an internal combustion engine, the tractor PTO or hydraulically by .!he water pressure of the irrigation system. Hydraulic pumps are versatile, reliable and have low operation and maintenance costs (Plates 5.10, 5.11 and 5":'i2). Some types of diaphragm and piston hydraulic pumps that are driven by · th<i pressure of the irrigation system, cast a fraction of the propelling water after its energy has been dissipated. Centrifugal pumps are used when high capacity is needed or the fertilizer solution is turbid. Roller pump~ are used for precise injection of small amounts of the nutrient solution.: The . most prevalent pump types are the water driven diaphragm and piston pumps that combine precision, reliability and low maintenance costs. Pumps used for fertigation are mostly automatically controlled. A pulse transmitter is mounted on the pump and converts its piston or diaphragm motion into electrical signals to monitor the discharge. This information is sent to the controller which allocates the amount of the injected fertilizer solution according to the preset program. The amount of the fertilizer solution that is delivered can be set to proportional or quantitative. In the proportional pattern, the fertilizer is applied at a constant ratio to the irrigation water over the period of irrigation. In the quantitative system, a preset amount of the fertilizer solution is injected in short pulses during the irrigation period. In glasshouses, simultaneous application of a multi-nutrient fertilizer solution is routine practice. When the fertilizers cannot be mixed together as a concentrated solution due to the risk of breakdown or precipitation, two or three injectors are installed in-line in the control head. The application ratio between the different injectors is coordinated and monitored by the irrigation controller.
41
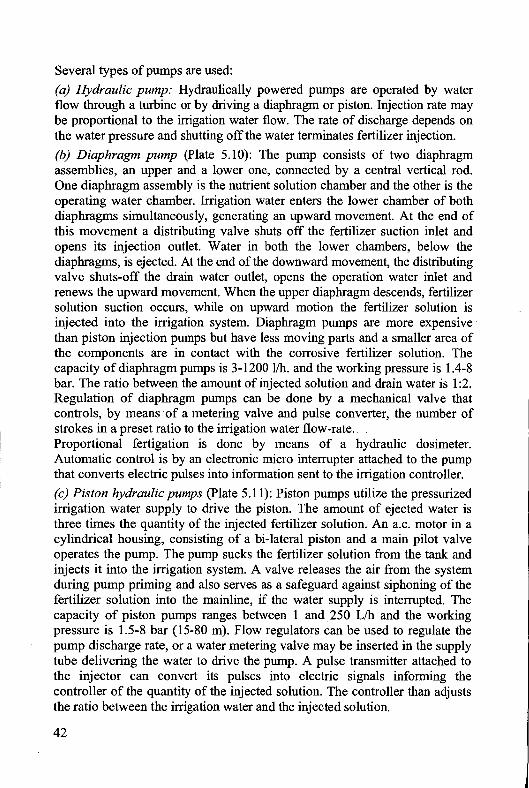
Several types of pumps are used:
(a) Hydraulic pump: Hydraulically powered pumps are operated by water flow through a turbine or by driving a diaphragm or piston. Injection rate may be proportional to the irrigation water flow. The rate of discharge depends on the water pressure and shutting off the water terminates fertilizer injection.
(b) Diaphragm pump (Plate 5.10): The pump consists of two diaphragm assemblies, an upper and a lower one, connected by a central vertical rod. One diaphragm assembly is the nutrient solution chamber and the other is the operating water chamber. Irrigation water enters the lower chamber of both diaphragms simultaneously, generating an upward movement. At the end of this movement a distributing valve shuts off the fertilizer suction inlet and opens its injection outlet. Water in both the lower chambers, below the diaphragms, is ejected. At the end of the downward movement, the distributing valve shuts-off the drain water outlet, opens the operation water inlet and renews the upward movement. When the upper diaphragm descends, fertilizer solution suction occurs, while on upward motion the fertilizer solution is injected into the irrigation system. Diaphragm pumps are more expensive· than piston injection pumps but have less moving parts and a smaller area of the components are in contact with the corrosive fertilizer solution. The capacity of diaphragm pumps is 3-1200 1/h. and the working pressure is 1.4-8 bar. The ratio between the amount of injected solution and drain water is 1:2. Regulation of diaphragm pumps can be done by a mechanical valve that controls, by means ·of a metering valve and pulse converter, the number of strokes in a preset ratio to the irrigation water flow-rate. Proportional fertigation is done by means of a hydraulic dosimeter. Automatic control is by an electronic micro interrupter attached to the pump· that converts electric pulses into information sent to the irrigation controller.
(c) Piston hydraulic pumps (Plate 5.11): Piston pumps utilize the pressurized irrigation water supply to drive the piston. The amount of ejected water is three times the quantity of the injected fertilizer solution. An a.c. motor in a cylindrical housing, consisting of a bi-lateral piston and a main pilot valve operates the pump. The pump sucks the fertilizer solution from the tank and injects it into the irrigation system. A valve releases the air from the system during pump priming and also serves as a safeguard against siphoning of the fertilizer solution into the mainline, if the water supply is interrupted. The capacity of piston pumps ranges between 1 and. 250 L/h and the working pressure is 1.5-8 bar (15-80 m). Flow regulators can be used to regulate the pump discharge rate, or a water metering valve may be inserted in the supply tube delivering the water to drive the pump. A pulse transmitter attached to the injector can convert its pulses into electric signals informing the controller of the quantity of the injected solution. The controller than adjusts the ratio between the irrigation water and the injected solution.
42
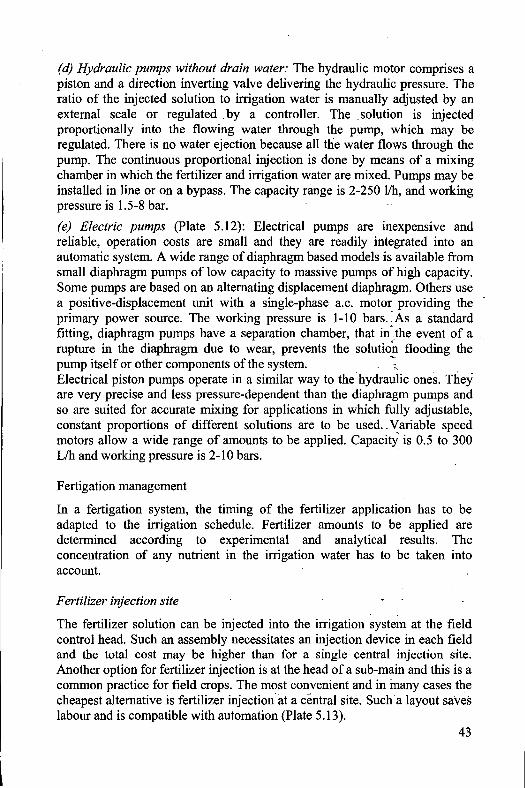
(d) Hydraulic pumps without drain water: The hydraulic motor comprises a piston and a direction inverting valve delivering the hydraulic pressure. The ratio of the injected solution to irrigation water is manually adjusted by an external scale or regulated . by a controller. The . solution is injected proportionally into the flowing water through the pump, which may be regulated. There is no water ejection because all the water flows through the pump. The continuous proportional injection is done by means of a mixing chamber in which the fertilizer and irrigation water are mixed. Pumps may be installed in line or on a bypass. The capacity range is 2-250 1/h, and working pressure is 1.5-8 bar.
(e) Electric pumps (Plate 5.12): Electrical pumps are inexpensive and reliable, operation costs are small and they are readily integrated into an automatic system. A wide range of diaphragm based models is available from small diaphragm pumps of low capacity to massive pumps of high capacity. Some pumps are based on an alternating displacement diaphragm. Others use a positive-displacement unit with a single-phase a.c. motor providing the primary power source. The working pressure is 1-10 bars. ~As a standard fitting, diaphragm pumps have a separation chamber, that in"the event of a rupture in the diaphragm due to wear, prevents the solution flooding the pump itself or other components of the system. -,. Electrical piston pumps operate in a similar way to the· hydraulic ones. They are very precise and less pressure-dependent than the diaphragm pumps and so are suited for accurate mixing for applications in which fully adjustable, constant proportions of different solutions are to be used .. Variable speed motors allow a wide range of amounts to be applied. CapacitY is 0.5 to 300 L/h and working pressure is 2-10 bars.
Fertigation management
In a fertigation system, the timing of the fertilizer application has to be adapted to the irrigation schedule. Fertilizer amounts to be applied are determined according to experimental and analytical results. The concentration of any nutrient in the irrigation water has to be taken into account.
Fertilizer injection site
The fertilizer solution can be injected into the irrigation system at the field control head. Such an assembly necessitates an injection device in each field and the total cost may be higher than for a single central injection site. Another option for fertilizer injection is at the head of a sub-main and this is a common practice for field crops. The most convenient and in inany cases the cheapest alternative is fertilizer injection at a central site~ Such a layout saves labour and is compatible with automation (Plate 5.13).
43
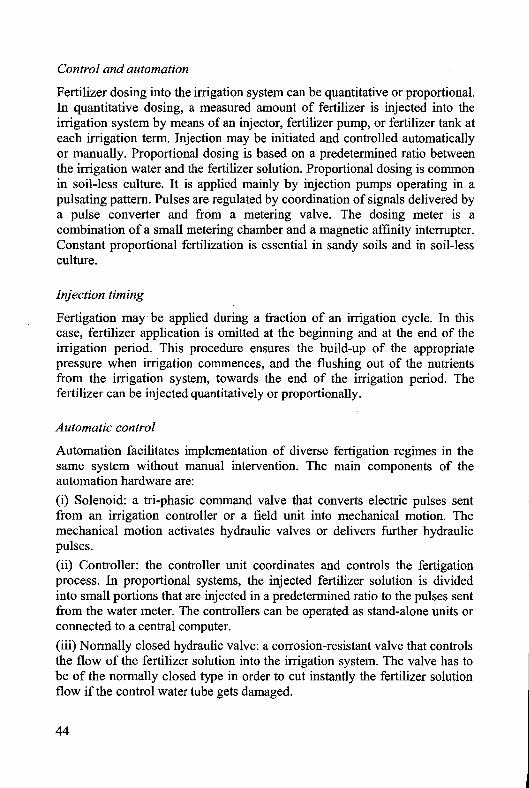
Control and automation
Fertilizer dosing into the irrigation system can be quantitative or proportional. In quantitative dosing, a measured amount of fertilizer is injected into the irrigation system by means of an injector, fertilizer pump, or fertilizer tank at each irrigation term. Injection may be initiated and controlled automatically or manually. Proportional dosing is based on a predetermined ratio between the irrigation water and the fertilizer solution. Proportional dosing is common in soil-less culture. It is applied mainly by injection pumps operating in a pulsating pattern. Pulses are regulated by coordination of signals delivered by a pulse converter and from a metering valve. The dosing meter is a combination of a small metering chamber and a magnetic affinity interrupter. Constant proportional fertilization is essential in sandy soils and in soil-less culture.
Injection timing
Fertigation may be applied during a fraction of an irrigation cycle. In this case, fertilizer application is omitted at the beginning and at the end of the irrigation period. This procedure ensures the build-up of the appropriate pressure when irrigation commences, and the flushing out of the nutrients from the irrigation system, towards the end of the irrigation period. The fertilizer can be injected quantitatively or proportionally.
Automatic control
Automation facilitates implementation of diverse fertigation regimes in the same system without manual intervention. The main components of the automation hardware are:
(i) Solenoid: a tri-phasic command valve that converts electric pulses sent from an irrigation controller or a field unit into mechanical motion. The mechanical motion activates hydraulic valves or delivers further hydraulic pulses.
(ii) Controller: the controller unit coordinates and controls the fertigation process. In proportional systems, the injected fertilizer solution is divided into small portions that are injected in a predetermined ratio to the pulses sent from the water meter. The controllers can be operated as stand-alone units or connected to a central computer.
(iii) Normally closed hydraulic valve: a corrosion-resistant valve that controls the flow of the fertilizer solution into the irrigation system. The valve has to be of the normally closed type in order to cut instantly the fertilizer solution flow if the control water tube gets damaged.
44

Avoiding corrosion damage
Most of the fertilizer solutions are corrosive and may seriously damage metallic components. The accessories that are exposed to the injected solution should be made of corrosion-resistant materials. Furthermore, the injection device and the irrigation system should be thoroughly flushed after each fertilizer injection.
Back-flow prevention ~
When the domestic water supply network is connected to the irrigation water supply network, strict precautions have to be taken to avoid back-flow of irrigation water containing fertilizers, into the domestic water supply network. Back-flow occurs when the water supply fails. There are two principal methods of preventing back-flow: back-siphonage and back-pressure.
Back-siphonage occurs when low pressure in the supply line is created by an excessive hydraulic gradient in the undersized pipes in the supply line, or by a break in the supply line, or pump or power failure. ;;-
·»?!
Back-pressure occurs when the pressure in the irrigation system is higher than in the domestic water supply system. This happens when"booster pumps are used in irrigation or when the irrigated area is topographically higher than the domestic supply tank.
Physically separating the potable water supply system from the fertigation solution can prevent back-flow. Some back-flow preventers may protect against back-siphonage only. Other types protect against both back-siphonage and back-pressure. For public safety, in many cases a double check valve assembly is required. In other cases a reduced pressure back-flow check valve is sufficient.
An atmospheric vacuum breaker, installed beyond the last valve allows air to enter downstream when pressure is reduced. A pressure vacuum breaker has an atmospheric vent valve that is internally loaded by a spring. This valve is not suitable for fertigation systems operated by external energy. Vacuum breakers are effective against back-siphonage only and cannot be used to, prevent back-pressure.
A double check valve assembly has two check valves in tandem, loaded by a spring or weight and installed as a unit between two tightly closing valves. The device is effective against back-flow caused by back-pressure or backsiphonage. It is installed ahead of the injection system._
A reduced pressure back-flow preventer consists of two separate internally loaded check valves, isolated by a reduced pressure zone. In the reduced pressure zone the pressure is lower than the pressure at the inlet and higher
45

than the pressure at the outlet. When the pressure at the outlet approaches the pressure level of the inlet, both valves are closed and back-flow is prevented.
6. Nutrient requirements and fertilizer dosage and timing
A fertigation system allows coordination of nutrient supply with changing demands of the growing crop. This requires a knowledge of the amount and rate of nutrient uptake by the crop in the growing cycle. Nutrient uptake at any one time depends on crop characteristics, the expected final yield, the nutrient content in the harvested crop and in the residual biomass, and environmental conditions: temperature, humidity and light. For crops grown in soil, the availability of the inherent nutrients has to be considered, in calculating the amount of nutrient to add. Also specific fertilizer recommendations for a crop have to be based on nutrient uptake measurements done under conditions as near as possible to those in which the crop is to be grown.
In view of the above, it is obvious that only generalized fertilizer recommendations can be given for nutrient uptake by a specific crop and its different cultivars. However, fertigation is a practical agrotechnique and the grower has to optimize fertilizer use based on the best possible knowledge of nutrient uptake and complemented by leaf, irrigation and drainage water analyses and soil testing.
Several examples of data on nutrient uptake, nutrient levels in leaves and fertilizer recommendations obtained from various sources follow. Fertilizer recommendations quoted are mainly those used by the Israel Ministry of Agriculture Extension Service.
6.1. Tomato
Bar Yosef (1995) gave data on the nutrient uptake by glasshouse tomatoes growing in a sandy soil and yielding 195 tlha fruit. The total amount of each nutrient taken up was:
N, 450; P 65; K 710 kg/ha. The uptake varied with time (Figure 6.1) increasing from the day of planting to peak first at 40 to 80 days after planting and then between 150 to 180 days.
46
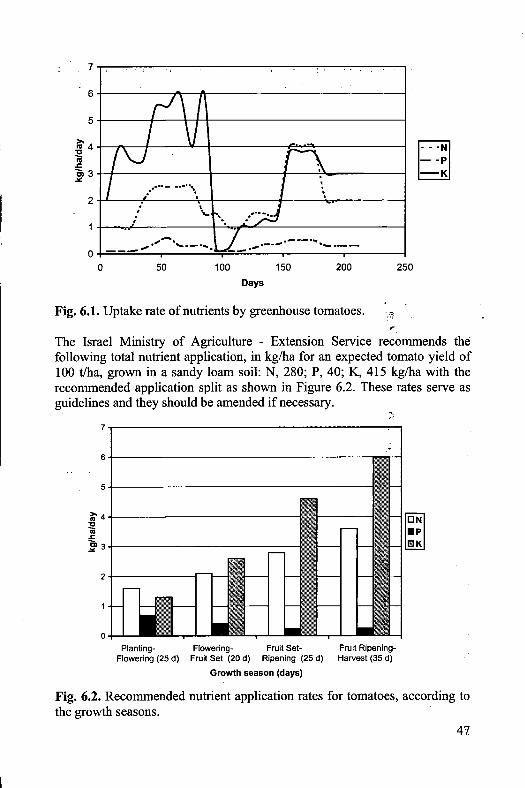
a p
K
.·····- .......... , 2+L----~------7-+---------~----~--------~ .
:' .....
,. ....... 0 ___ ,.,. """'""·-· .....
0 50 100 150 200 250
Days
Fig. 6.1. Uptake rate of nutrients by greenhouse tomatoes.
"· The Israel Ministry of Agriculture - Extension Service recommends the following total nutrient application, in kg/ha for an expected tomato yield of 100 tlha, grown in a sandy loam soil: N, 280; P, 40; K, 415 kg/ha with the recommended application split as shown in Figure 6.2. These rates serve as guidelines and they should be amended if necessary.
~.
7
6
5
~4
~ ..<:
}a
2
0
Planting· Flowering- Fruit Set- Fruit Ripening-Flowering (25 d) Fruit Set (20 d) Ripening (25 d) Harvest (35 d)
Growth season (days)
Fig. 6.2. Recommended nutrient application rates for tomatoes, according to the growth seasons.
47.

Nutrient consumption is a function of growth conditions, in addition to other factors. To illustrate this, data for nutrient uptake by tomatoes grown in the field on a sandy soil and yielding 127 t/ha, were N 250; P 24; K 370 kg/ha (Bar Yosef, 1995). Figure 6.3 gives the daily uptake ofN, P and K and this is very different from that of glasshouse tomatoes (Figure 6.1 ).
9
8
7
6
3
2
0 0
----- .. . -. 50
£"'.. I \
I \ /\ I ... -,., \
I \I . · .. \ ; ....... . ~
j' · ...... · _JI" ...,.·---- ..... . ·-·
100 150
Days
Fig. 6.3. Uptake rates of nutrients by field-grown tomatoes.
For different growing conditions, Wolf et al. (1985) suggested that a 67 tlha crop of tomatoes takes up: N, 201; P, 23.5; K, 312; Mg, 31; S, 46 kg/ha, while Achilea considered that a 90 tlha tomato crop takes up N, 350; P, 35; K, 415; Ca, 100; Mg, 18 kg/ha. On the basis of nutrient uptake per tonne fruit the variation between the different sets of data is not very substantial, except for Mg. Leaf analysis serves as a good indicator for estimating the optimal level of nutrient application. Normal levels of nutrients correlated to crop yield have to be determined experimentally. For example, Westerman (1990) gave normal nutrient levels in tomato leaves (Table 6.1 ). Concentrations lower than normal indicate that the plant is deficient in the specific nutrient and fertilizer rates should be increased, while higher ones indicate an excess, suggesting a reduction in nutrient supply.
Table 6.1. Normal nutrient concentrations in trellised tomato (1st mature fruit), youngest full mature leaves.
%incir matter N p K Ca Mg
2.5-4.0 0.3-0.6 3.0-4.0 0.5-2.0 0.6-1.0
ppm in dry matter Cu Zn Mn I Fe B Mo
5-10 30-40 50-100 100-300 30-100 0.4
48

6.2. Bell pepper
Another example of a fertigated vegetable crop is bell pepper for which the total uptake of nutrients by a 75 tlha crop grown in a sandy soil was N, 205; P, 31; K, 370 kg/ha (Bar Yosef, 1995). The uptake pattern varied with time and reached a peak between 70 to 110 days after seeding (Figure 6.4). Recommended nutrient rates of application are presented in Figure 6.5. Haifa Chemicals Ltd. cite, from several sources, the , following total nutrient requirement by a pepper yield of 50-70 tlha growing in a medium sandy soil: N, 300-400; P, 87-114; K, 290-415 kg/ha.
6~-------------------------------.
0 50 100 150
Days
Fig. 6.4. Uptake rates of nutrients by bell pepper.
6~--------------------------------------~.-,----,
5+------------------------------
0
PlantingFlowering
FloweringFruit Set
Fruit SetRipening
Growth season
Fruit RipeningHarvest
Fig. 6.5. Recommended nutrient application rates for bell pepper, according to the growth seasons.
49

Normal nutrient concentrations in the leaves of bell pepper (Westerman, 1990) are given in Table 6.2.
Table 6.2. Normal nutrient concentrations m bell pepper (midgrowth), youngest fully mature leaves.
%in dr: matter N p K Ca Mg
3.0-4.5 0.3-0.7 4.0-5.4 0.4-0.6 1.0-1.7
ppm in dry matter Cu Zn Mn I Fe B Mo
10-20 40-50 80-120 200-300 40-100 0.4
6.3. Banana
Lahav and Turner (1989) calculated the average amount of each nutrient removed by a banana crop yielding 50 tlha fresh fruit, and the amount of nutrient in the plant residue (Figures 6.6 and 6.7).
1600
1400
1200
1000
-----------1 Ill Plant residue •Fruit
Ill .c 800 c, .le:
600
400
200
0 N p K ea Mg s
Nutrient
Fig. 6.6. Nutrients removed by a banana crop, yielding 50 tlha fresh fruit.
50
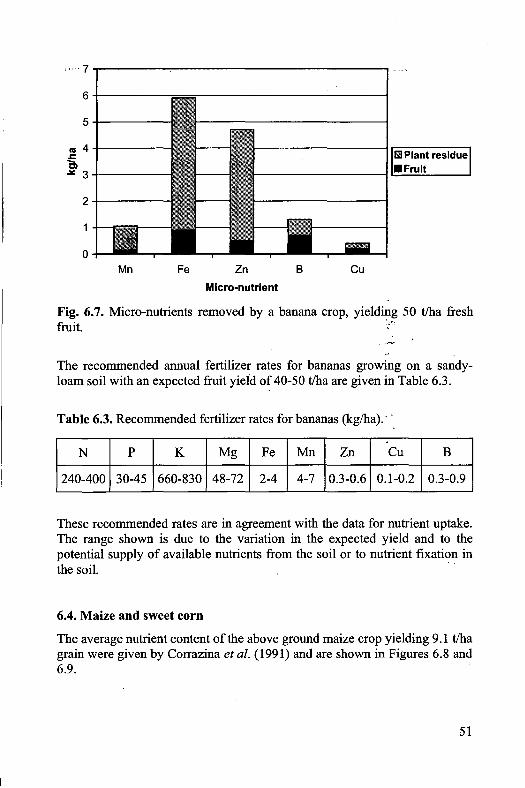
,, .. 7 ....------,..----------------,
6+-----
5-1-----
ca4+-----
~ .10: 3+-----
1i!11 Plant residue
-----------1 ~.=•::..;F..:..ru:.:i.:...t __ .....
2-1-----
0 Mn Fe Zn
Micro-nutrient
B Cu
Fig. 6.7. Micro-nutrients removed by a banana crop, yielding 50 t!ha fresh fruit. ~~~
The recommended annual fertilizer rates for bananas growing on a sandyloam soil with an expected fruit yield of 40-50 t/ha are given in Table 6.3.
Table 6.3. Recommended fertilizer rates for bananas (kg/ha).
N p K Mg Fe Mn Zn Cu B
240-400 30-45 660-830 48-72 2-4 4-7 0.3-0.6 0.1-0.2 0.3-0.9
These recommended rates are in agreement with the data for nutrient uptake. The range shown is due to the variation in the expected yield and to the potential supply of available nutrients from the soil or to nutrient fixation in the soil. .
6.4. Maize and sweet corn
The average nutrient content of the above ground maize crop yielding 9.1 t/ha grain were given by Corrazina et al. (1991) and are shown in Figures 6.8 and 6.9.
51
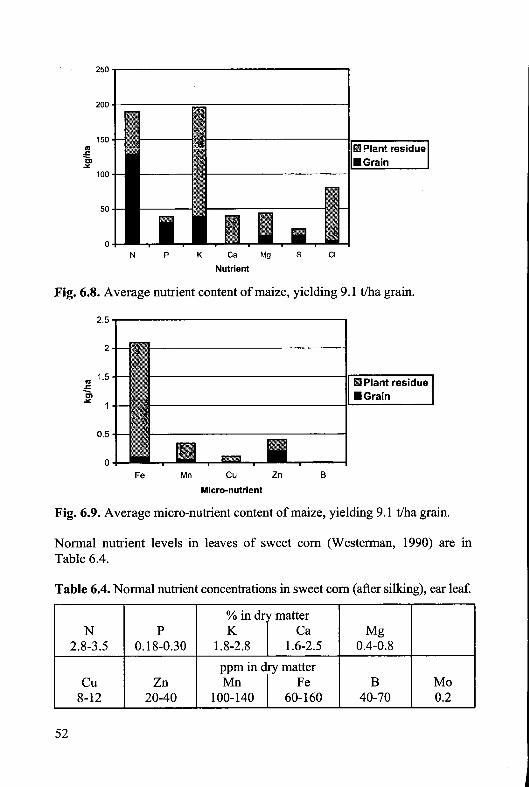
250
200
150 .. .r; c. ....
100
50
0 N p K ea
Nutrient
Mg s Cl
!i!l Plant residue •Grain
Fig. 6.8. Average nutrient content of maize, yielding 9.1 t/ha grain.
2.5 or----------------., 2
.. 1.5 .r;
]>
0.5
0 Fe Mn Cu
Micro-nutrient
Zn B
m Plant residue •Grain
Fig. 6.9. Average micro-nutrient content of maize, yielding 9.1 t/ha grain.
Normal nutrient levels in leaves of sweet corn (Westerman, 1990) are in Table 6.4.
Table 6.4. Normal nutrient concentrations in sweet corn (after silking), ear leaf.
% in dry matter N p K Ca Mg
2.8-3.5 0.18-0.30 1.8-2.8 1.6-2.5 0.4-0.8
ppm in dry matter Cu Zn Mn I Fe B Mo
8-12 20-40 100-140 60-160 40-70 0.2
52
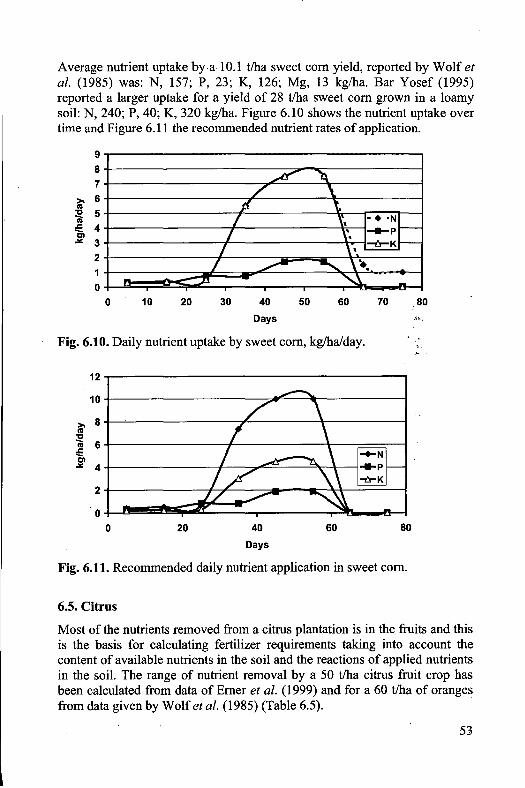
Average nutrient uptake by a 10.1 tlha sweet corn yield, reported by Wolf et al. (1985) was: N, 157; P, 23; K, 126; Mg, 13 kg/ha. Bar Yosef (1995) reported a larger uptake for a yield of 28 tlha sweet corn grown in a loamy soil: N, 240; P, 40; K, 320 kg/ha. Figure 6.10 shows the nutrient uptake over time and Figure 6.11 the recommended nutrient rates of application.
9 8
7
>- 6 ea ~ 5 :E 4 Cl -" 3
2 1
0 0
"J;.
10 20
~ /
t! I
I I
I
30
_,..--
40
Days
~ \
'· ~. • + •N
\'. ....... p 1--
\' ~KI--• ....=......;.;.
......... \~. ""-.\..
50 60 70 ,80
Fig. 6.10. Daily nutrient uptake by sweet corn, kg/ha/day.
12
10
>- 8 ea
~ 6 :E ~ 4
2
0 0 20 40 60 80
Days
Fig. 6.11. Recommended daily nutrient application in sweet corn.
6.5. Citrus
Most of the nutrients removed from a citrus plantation is in the fruits and this is the basis for calculating fertilizer requirements taking into account the content of available nutrients in the soil and the reactions of applied nutrients in the soil. The range of nutrient removal by a 50 tlha citrus fruit crop has been calculated from data of Erner et al. (1999) and for a 60 tlha of oranges from data given by Wolf et al. (1985) (Table 6.5).
53
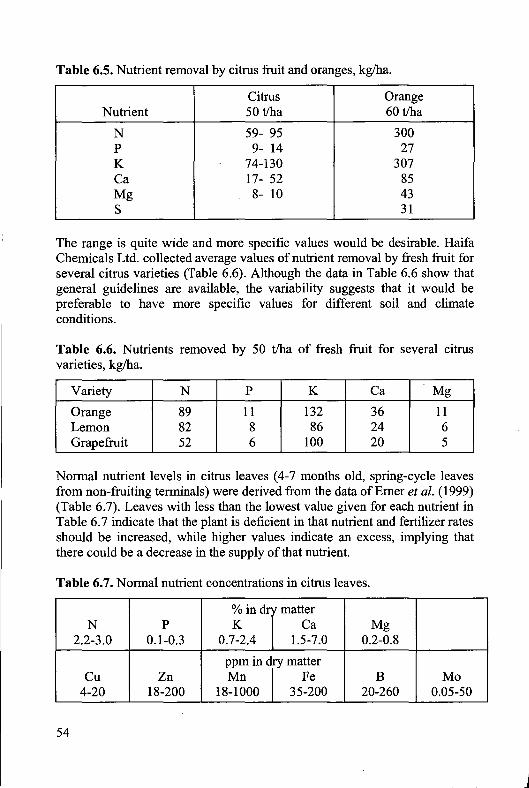
Table 6.5. Nutrient removal by citrus fruit and oranges, kg/ha.
Citrus Orange Nutrient 50 tlha 60 tlha
N 59- 95 300 p 9- 14 27 K 74-130 307 Ca 17- 52 85 Mg 8- 10 43 s 31
The range is quite wide and more specific values would be desirable. Haifa Chemicals Ltd. collected average values of nutrient removal by fresh fruit for several citrus varieties (Table 6.6). Although the data in Table 6.6 show that general guidelines are available, the variability suggests that it would be preferable to have more specific values for different soil and climate conditions.
Table 6.6. Nutrients removed by 50 tlha of fresh fruit for several citrus varieties, kg/ha.
Variety N p K Ca Mg
Orange 89 11 132 36 11 Lemon 82 8 86 24 6 Grapefruit 52 6 100 20 5
Normal nutrient levels in citrus leaves ( 4-7 months old, spring-cycle leaves from non-fruiting terminals) were derived from the data ofErner et al. (1999) (Table 6.7). Leaves with less than the lowest value given for each nutrient in Table 6.7 indicate that the plant is deficient in that nutrient and fertilizer rates should be increased, while higher values indicate an excess, implying that there could be a decrease in the supply of that nutrient.
Table 6.7. Normal nutrient concentrations in citrus leaves.
% in dry matter N p K Ca Mg
2.2-3.0 0.1-0.3 0.7-2.4 1.5-7.0 0.2-0.8
ppm in dry matter Cu Zn Mn I Fe B Mo
4-20 18-200 18-1000 35-200 20-260 0.05-50
54
General guidelines on fertigation rates of various other crops may be found in publications such as those of Haifa Chemicals Ltd. and International Potash Institute, Basel.
7. Monitoring and control
Fertigation is a precision agrotechnical tool. In order to exploit its potential to supply water and nutrients in the quantity required by plants and with minimal losses to the environment, a basic knowledge of plant requirements and intensive monitoring are needed.
7.1. Water requirement monitoring
In a well controlled system like that of fertigation, irrigation has to provide plants with sufficient water to prevent stress causing a reduction in yield. At the same time, no more water should be applied than is required to leach excess salts below the root zone. Basic data on crop water requirements are obtained by standard measurements of climatic data and~. of the water potential of the soil or growth media. These have to be done under crop and environmental conditions as close as possible to the real . situation. The simplest and very inefficient way for determining the need for irrigation is by observing changes in the appearance of the crop like colour or loss of turgor. Obviously, when such indicators are observed it is too late to prevent some plant stress. Several methods are available for estimating crop water requirement and thus the amount of water to be applied during an irrigation period .. A widely used method is based on estimates and measurements of evapo-transpiration (ET) which is the combined loss of water by evaporation from the water or soil surface and by transpiration from the plant (Burman et al., 1980). Potential evapo-transpiration (ET P) for any given period is often estimated by measuring the fall in the depth of water in an open pan and may be expressed in units like mm/day. The standard is the U.S. Class A Pan, having a diameter of 121 cm and depth of25.5 cm (Plate 7.1). The rate of evaporation from the pan integrates the surrounding climatic conditions, like air temperature and humidity, radiation, and wind velocity. At any period of growth the actual ET from a crop varies from ET P because of the changes in the percentage of the soil surface covered by the crop, crop density and foliage characteristics. In addition, the method of irrigation influences the evapo-transpiration. Under drip irrigation only a part of the soil or growth medium surface is wetted, while by sprinkler irrigation all the surface is wetted. Thus, the extent of . water distribution influences the rate of evaporation. The ET has to be predetermined experimentally by water loss ·measurements for each crop, variety, growth period and agrotechnique.
55

The ratio between the ET of a specific crop and at a specific growth period, and the ETp is defined as the crop coefficient (Kc), accordingly Kc = ET/ ET P· As an example, crop coefficients for tomatoes grown in the open field and recommended by the Israeli Extension Service (Reshef, 2000) are as follows:
At the beginning of the growth period Kc = 0.4. It increases with plant development and during the period of vegetative growth until the beginning of fruit set the value of Kc is 0.5-0.6. From the start of fruit development until color change of the first fruit the value of Kc is 0.7-0.8. Late in the season at harvest time Kc reaches the value of0.9. The amount of water to be applied in an irrigation period is calculated by multiplying the measured ET P
by theKc.
The water requirement of a crop may also be estimated by direct measurement of soil moisture (Campbell and Mulla, 1990). This gravimetric method is simple and straight-forward but time and labour consuming. Soil samples, taken with an auger from the active root zone, are weighed, dried at 105°C and weighed again. The weight difference represents the soil moisture. It may be expressed as a percentage on a mass basis, (weight /weight) or, if an undisturbed sample of known volume is taken, on a volume basis (volume of water/volume of soil). The amount of irrigation needed is calculated from the difference in soil water content between the present and previous measurement, done shortly after the last irrigation. A better way of obtaining the water requirement is by determining the "field capacity" and calculating the difference between the "field capacity" value and the measured value. The field capacity is a soil parameter measured gravimetrically and defined as the amount of water held in soil after excess water has drained below a predetermined depth.
More sophisticated methods for determining soil moisture status are available. (i) Tensiometers: Tensiometers measuring soil water tension are widely used (Plate 7.2). Prior to their use for determining the water requirement, the relation between soil water tension and the amount of water present in the soil has to be established. This relation is a soil characteristic and it varies according to soil texture and structure. It is derived from the measurement of residual soil moisture after subjecting samples to various pressures on a closed ceramic porous pressure plate. The tensiometer is a water filled sealed tube, with a porous ceramic cup at one end, inserted into the soil and a pressure gauge on the other end. Water moves, by suction through the porous cup, until equilibrium is reached between the tension of the soil water and the pressure in the tensiometer. The reading on the pressure gauge gives the soil water tension value, which is calculated into water amounts and irrigation requirement. The tensiometer is
56

useful only within certain limits of soil water tension. At a-tension ofabout 0.8 -bar, air may penetrate the porous cup and disrupt the pressure measurement. Tensiometers estimate the soil moisture point-wise and therefore several measurements within each area to be irrigated and at several depths are necessary.
(ii) Neutron probe: One of nuclear methods is based on neutron scattering from a high energy neutron source into the soil. Collision of the neutrons with hydrogen atoms reduces their kinetic energy and these slow neutrons are counted by a detector. Most of the hydrogen atoms in soil are ~ound in water molecules and therefore, the neutron count can be calibrated into soil moisture. When calibrating the meters the volume of soil into which the neutrons are scattered varies with the amount of water present and therefore the size of this volume has to be taken into account. In a relatively dry soil the scatter is wider than in a wet soil. The diameter of the measured soil sphere varies from a few to a few tens of centimeters.
(iii) Time- Domain Reflectometry (TDR): In the last decade, TDR has come into use for soil moisture measurements. The method is base<ton the electric properties of water molecules. Water molecules are conductive, polar and with a relatively high dielectric response, which is a measure of the capacity to absorb electromagnetic energy. The instrument consists of two parallel metal rods, having a length of several tens of centimeters, which are inserted into the soil. A microwave energy pulse generator is connected to the rods and an oscilloscope records voltage amplitudes and transit time of the energy between the rods at various depths in the soil medium .. The dielectric response data are calibrated into volumetric soil water content.·,. Soil moisture may be estimated indirectly and crudely by plant indicators, like the measurement of trunk and fruit enlargement and shrinkage.
7.2. Nutrient requirement monitoring by plant testing
Plant nutrient requirements are experimentally determined amounts and rates of nutrient uptake by a specific crop variety, grown under conditions resembling as close as possible the real field state. These data would be sufficient to determine the amounts of nutrients to apply under ideal conditions, where there are no reactions of nutrients with, or detention of water by the growth medium so that the plant would absorb the total amount applied. In reality, water is retained by the growth medium by a matrix potential, that is increased by the osmotic pressure generated by the fertilizers in the applied water. The plant absorbs water and with it nutrients by developing an osmotic gradient across the root cell membrane. The concentration of nutrients in the water and in the soil or growth medium changes because of precipitation reactions, adsorption and desorption or release of nutrients into the soil solution.
57

------------------------------------------------ ----
Although, nutrient requirement and rate of uptake of nutrients by a crop is an important parameter for determining the supply strategy, additional data is needed for taking decisions on the optimum amount of nutrient to be added. Various methods are used to do this.
Visual nutrient deficiency symptoms in plants are used as a diagnostic tool. Although, deficiency of a specific nutrient induces leaf colour changes from normal, scorching of leaves and deformation of plant organs, similar symptoms may be caused by other factors. Thus, a high level of expertise is a prerequisite for a valid diagnosis. A drawback of this approach is that often the symptoms do not appear until the deficiency is serious and too late to correct to achieve maximum yield.
The concentration of a nutrient in plant tissue is considered a good indicator of its availability to the plant. For some nutrients and crops, levels in leaves defmed as adequate or deficient, are given in the previous chapter. However, deducing fertilizer recommendations from leaf analysis data is not always straightforward. Concentrations of plant nutrients in tissues change with the physiological age of the tissue. Air humidity and temperature and soil moisture affect the concentration of nutrients by influencing transpiration and solute transport in the plant as well as the plant growth rate. Therefore, a very strict standardization of plant tissue sampling is necessary. In general, sampling should be done from active, vigorously growing plants, that do not show any signs of drought stress. For example, the Israeli Extension Service recommends sampling leaves of mature citrus trees from the current growth, in the vicinity of fruit, at a height of 1.5 m from the soil surface and on the northern side of the tree. For bananas, leaf blades and petioles are sampled separately. A segment from the leaf blade of the third leaf and a segment of the petiole of the seventh leaf, counted from above, are taken for analysis.
The concept of critical nutrient concentration in plant tissue is often used. At concentrations below the critical level the yield of the crop will be restricted. However, the critical level of one nutrient is influenced by the concentration of others. In cases where more than one nutrient is deficient, raising the level of one changes the critical concentration of others. In view of these constrains the DRIS (Diagnosis and Recommendation Integrated System) method was developed by Sumner (1979). In this method fertilizer recommendations for major nutrients (N, P, K) are based on calculated indices, derived by a series of measurements and calculations, that express the degree of sufficiency of a nutrient. For example, nutrient concentrations are measured in plant tissue and their ratios are calculated. These ratios are then compared to those for the same nutrients derived from high yielding plants of the same variety grown under similar conditions and sufficiency indices are calculated. This method is a better diagnostic tool for estimating fertilizer requirements, than the critical value of a single nutrient. However, there are some limitations.
58
Measurements are done on growing plants and therefore the method is valid only for correcting nutrient deficiencies and preventing possible deficiency in a subsequent crop. Also the calculation of indices require data on nutrient ratios in a high yielding crop and these are not always available.
7.3. Soil testing
Estimating the nutrient requirements of plants grown in soil-less culture is usually not dependent on testing the nutrient status of the growth medium because usually it does not release or absorb them. Nutrients are taken up by the plants with the water present in the growth medium. On prolonged use of the growth medium, plant pathogens may multiply in larger numbers than are desirable. In such cases, microbiological tests and sterilizing are recommended to prevent outbreaks of plant diseases.
For plants grown in soil, soil testing is an essential tool for determining fertilizer requirements. The test should indicate the degree of deficiency or sufficiency of a nutrient in the soil for the specific crop to· be grown. Nutrients are present in the soil naturally, or as residues from previous fertilizer and manure applications. However, only a fraction of the nutrient present in the soil is available to the growing plant. Most of the nitrogen is bound into organic compounds and only the fraction released as N~ and N03 by microbial decomposition of the organic matter, is available to plants, Only a small fraction of the soil P may be immediately available in the soil solution but release of P from the soil reserves can often maintain the concentration in the soil solution. Only that fraction of the soil• K that is exchangeable or in soil solution is available to plants, but release of fixed K to the soil solution as K is taken up by the plant can supply extra K. Measuring the total amount of nutrients present in the soil does not provide the necessary information on their availability to plants. Methods that extract that fraction of the tested nutrient that is potentially available for plant uptake have been developed and are widely used in soil testing laboratories to provide reliable estimates of nutrient availability.
The extraction methods are specific for the nutrient and the soi~
characteristics. Some methods are based on mild acid or basic extractants, others use ion-exchange resins, to mimick the absorption of nutrient by the root. Cation availability, e.g. K is often measured by extraction of the exchangeable fraction. The analytical data have to be thoroughly calibrated with results from field experiments on the response of the crop to the nutrient, prior to their application as a diagnostic tool.
To determine the fertilizer requirement of a crop, the availability of the nutrients in the soil has to be deducted from the total amount of nutrient required by the crop. On the other hand, water soluble nutrients applied in
59
fertigation, especially phosphates, may react in the soil and become less immediately available. This may be taken into account in fertilizer recommendations for soil grown crops, where for example, the amount of P to be applied is often greater than would be needed just to match total uptake.
Soil and growth media testing should include the measurement of two additional parameters. The electrical conductivity (EC) of a soil or growth media water-extract is an indicator of the concentration of soluble salt in the soil or media. Salt may accumulate as a residue from irrigation water or from applied fertilizer compounds not utilized by the plant and not leached out. Excessive salt raises the osmotic pressure of the root environment and reduces water and nutrient uptake, followed by a decrease in yield. Excess of some ions may have toxic effects on the plant and negative structural effects on the soil.
The pH of the soil or growth media extract, indicates its acidity or alkalinity. Most plants thrive best when the pH is near neutral. Application of some fertilizers may have an acidifying effect. For example, application of ammonium compounds induces acidity by its oxidation to N03• Acidification is more pronounced in a poorly buffered medium, such as a coarse textured sandy soil than in a fine textured one. A soil may become alkaline when irrigation water contains excess Na.
The Israeli Extension Service has issued directives to standardize sampling procedures.
The soil sample is taken by an auger. In general, representative samples are taken from two soil layers: 0-20 cm and 20-40 cm from the surface. For deeprooted crops sampling should be from 0-30 cm and 30-60 cm layers. For soils affected by salinity, sampling below 60 cm is recommended. The field should be inspected for its uniformity. Changes in surface soil color, slope and cultivation history are indicators for division of the field into sub-fields for the purpose of sampling. About 30-40 samples are taken from one uniform field or sub-field and soil layer. These samples are very well mixed and about 1 kg of soil is sub-sampled and sent to the laboratory for analysis. Sampling during the growth period is done prior to irrigation. The upper 5cm of soil is removed and samples to a depth of 15-20 cm are taken. Otherwise the procedure is as described above.
7.4. Water quality monitoring
Initial chemical water measurements are necessary to determine its suitability for use in fertigation. The pH of the water has to be near to neutral and its EC to be within acceptable limits that are not well defmed, but a value of around 1 dS/m is acceptable. Addition of fertilizers to the water raises its EC and changes its pH. The objective is to have a fertigation solution somewhat acid
60
an& with ·a low EC. These parameters are decisive for choosing a fertilizer combination compatible with the water quality. For water with a relatively high EC, the ratio of cations Na!Ca+Mg is important to prevent potential alkalization of the soil. The level ofbicarbonate is important for the selection of the P fertilizer. In water with relatively high bicarbonate level, mostly coupled with Ca, precipitation of orthophosphate compounds is very likely. In such cases, the use of polyphosphate fertilizers would be preferred.
Monitoring the fertigation water quality is a major tool for controlling plant nutrition in soilless culture. The Israeli Extension Service has issued detailed recommendations regarding irrigation and drainage water quantity and quality monitoring. The number of irrigation cycles per day is varied according to the crop and the season. Frequency of irrigation should be regulated so that 20-30% of the applied water appears in drainage.
The pH of the fertigation solution leaving the dripper and that collected in drainage should be monitored frequently. The optimum pH of the fertigation water is 5.5-6.0. A pH lower than 5.5 indicates a need-!to revise the composition of the fertigation solution.
The anticipated EC of the fertigation solution is calculated by measuring the EC of irrigation water prior to addition of the fertilizer solution and adding to it the estimated EC of the fertilizer solution. The measirred EC of the fertigation solution collected from the dripper should be within 10% of the calculated value. Any deviation greater than this, necessitates checking the fertilizer injection devices, the fertilizer dilution process or !4.e composition of the fertilizer solution. Comparing the EC in the fertigation_solution to that in the drainage water indicates the risk of salinization of the growth medium. A similar EC in both solutions is normal and if the EC of the drainage solution is more than 20% higher than that of the fertigation solution there is a risk of salinization. Excess of chlorides in the drainage water indicates that the higher EC is caused by irrigation water salinity. In this case, the amount of water applied has to be increased to enhance salt leaching from the growth medium.
Comparing nutrient concentrations in the fertigation solution and drainage water indicates the extent of nutrient uptake. Excessive amounts of nutrients in the drainage water show that the rate of nutrient application should be reduced. An EC value in the drainage water that is lower than that in the fertigation solution indicates a high uptake of nutrients and an increase in the nutrient application rate should be considered.
Measuring the nitrite concentration in the drainage water monitors the level of aeration in the growth medium, the presence of nitrites indicates anaerobic conditions. In normal well-aerated media, N compounds are fully oxidized to N03 and no nitrites are found. Increasing the interval between irrigation would, in most cases, relieve the anaerobic condition.
61

Controlling the fertigation system requires frequent analyses of both the fertigation and the drainage solution on pH, EC, nitrate, ammonium, chloride, calcium, magnesium, phosphate, potassium, sodium, bicarbonate and micronutrients.
8. References
Aamer, K., Lowengart, A. and Omar, S. (1997): Response of seedless watermelon to different nitrogen application through fertigation. A summary of 1996/7 season in vegetables. The Extension Service and the Agricultural Research Organization, Ministry of Agriculture. pp. 101-112 (Hebrew).
Achilea, 0.: Multi-K for fertigation in field-grown crops, top yields in vegetables and row crops. Haifa Chemicals Ltd, p. 24.
Alam, S.M., Zafar-Iqbal and Latif, A. (1999): Fertigation technology for improved phosphorus use efficiency in wheat. Pakistan J. Sci. Indust. Res. 42: 380-383.
Alcantar, G.G., Villarreal, R.M., Aguilar, S.A. and Papadopoulos, A.P. (1999): Tomato growth (Lycopersicon esculentum Mill), and nutrient utilization in response to varying fertigation programs. Intern. Symp. on growing media and hydroponics, Windsor, Ontario, Canada. Vol. 1 Acta Horticulturae No. 481: 385-391.
Alva, A.K. and Mozaffari, M. (1995): Nitrate leaching in a deep sandy soil as influenced by dry broadcast or fertigation of nitrogen for citrus production. Dahlia Greidinger Intematl. Symp. on Fertigation. Proc. pp. 67-78.
Alva, A.K., Paramasivam, S. and Graham, W.D. (1998): Impact of nitrogen management practices on nutritional status and yield of Valencia orange trees and groundwater nitrate. J. Environ. Qual. 27: 904-910.
Avidan, A., Yoles, D. and Sneh, M. (1996): Fertilizer characteristics. Ministry of Agriculture, Extension Service, Field Service Department, p. 107 (Hebrew).
Balwinder-Singh, Lakhwinder-Singh, Singh-B and Singh-L (1996): Studies on urea hydrolysis in Typic Ustochrepts of Punjab. J. Indian Soc. Soil Sci. 44: 638-643.
Bar-Yosef, B. (1988): Control of tomato fruit yield and quality through fertigation. Optimal Yield Management (Ed. D. Rymon). Avebury. pp. 175-184.
Bar-Yosef, B. and Imas, P. (Eds. P. Adams, A.P. Hidding, J.A. Kipp, C.
62
Sonneveld and C. Kreij) (1995): Phosphorus fertigation and growth substrate effects on dry matter production and nutrient content in greenhouse tomatoes. Internatl. Symp. on growing media and plant
- nutrition in horticulture, Naaldwijk, Netherlands. Acta-Horticulturae No. 401. pp. 337-346.
Bar-Yosef, B. (1995): Fertigated vegetables in arid and semi-arid zones. In: Scaife, A. and Bar-Yosef, B.: Nutrient and fertilizer management in field grown vegetables. IPI-Bull. No. 13, pp. 54-104.
Bas!loi, L.H. and Reichardt, K. (1995): Dry matter and nitrogen accumulation in maize grown during winter given nitrogen fertiliser by soil application. and fertigation. Pesquisa Agropecuaria Brasileira 30: 1361-1373. '
Bemardoni, C., Cerioni, G., Fabbri, A. and Paoletti, M. (1990): Fertigation experiments in horticulture. Colture-Protette. 19: 109-112.
Bharambe, P.R., Narwade, S.K., Oza, S.R., Vaishnava, V.G., Shelke, D.K. and Jadhav, G.S. (1997): Nitrogen management in cotton through drip irrigation. J. Indian Soc. Soil Sci. 45: 705-709.
Boman, B.J. (1995): Effects of fertigation and potash source on grapefruit size and yield. Dahlia Greidinger Inteml. Symp. on Fertigation, Technion, Israel. pp. 55-66. ._
Boman, B.J. (1996): F ertigation versus conventional fertilization of Flatwoods grapefruit. Fert. Res. 44: 123-128.
Bravdo, B., Heffner, Y., Naor, A., Cohen, S. and Zur, D. (1988): The influence of NPK fertigation in drip irrigated vineyard- on yield and quality of 'Sauvignon Blanc' wine grapes. Annual Reports for 1987. Hebrew University of Jerusalem, The Faculty of Agriculture, pp. 19-33 (Hebrew).
Bravdo, B., Salomon, E., Emer, Y., Saada, D., Shufman, K and Oren, Y. (1992): Effect of drip and microsprinkler fertigation on citrus yield and quality. Proc. Intern. Soc. Citriculture, Vol. 2: 646-650.
Brito, J.M.C., Ferreira, D., Guerrero, C.A.C., Machado, A.V., Beltrao, J., Anar;:, D. (ed.) and Martin Prevel, P. (1999): Soil pollution by nitrates using sewage sludge and mineral fertilizers. In: Improved crop quality by nutrient management. Kluwer Acad. Publ., Dordrecht, Netherlands, pp. 223-227.
Burman, R.D., Nixon, P.R., Wright, J.L. and Pruitt, W.O. (1980): Water requirements. In: Design and operation of farm irrigation systems. ASAE Monograph 3 (Ed. M.E. Jensen), pp. 189-232.
Cabrera, M.L., Kissel, D.E. and Bock, B.R. (1991): Urea hydrolysis in soil: effects of urea concentration and soil pH. Soil Bioi. Biochem. 23: 1121-1124.
Campbell, G.S. and Mulla, D.J. (1990): Measurement of soil water content and potential. In: Irrigation of agricultural crops. ASA pub I. 30 (Eds. B.A. Stewart and D.R. Nielsen), pp. 127-142.
Castellanos, J.Z., Lazcano, 1., Sosa-Baldibia, A., Badillo, V. and Villalobos, S. (1999): Nitrogen fertilization and plant nutrient status monitoring- the
63
basis for high yields and quality of broccoli in potassium-rich Vertisols of central Mexico. Better Crops Intern. 13: 25-27.
Cavazza, D. (1988): Irrigazione a Goccia. Edagricole, Bologna, 150 p. Champion, D. and Bartholomay, R. (1992): Fertigation through surge valves.
Coop Ext. U.S. Dept. of Agr. Colorado State University. Online. Corrazina, E., Gething, P.A. and Mazzali, E. (1991): Fertilizing for high yield
Maize. IPI Bull. No. 5, 87 p. Deolankar, K.P. and Pandit, P.S. (1998): Use of drip and fertigation of liquid
fertilizers in chickpea. J. Maharashtra Agric. Univ. 23: 307-308. Deutschmann, G.V. (1998): History of Hydroponics. Online. Dillon, J., Edinger-Marshall, S. and Letey, J. (1999): Farmers adopt new
irrigation and fertilizer techniques. California Agric. 53: 24-28. Dolega, E.K., Link, H. and Blanke, M. (1998): Fruit quality in relation to
fertigation of apple trees. Proc. 2nd Workshop pome fruit quality, BonnRottgen, Germany, Acta Hortic. No. 466: 109-114.
Duis, J.H. and Burman, K.A. (1969): Polyphosphates in irrigation systems. Fert. Sol. 13 (2): 46-48.
Eizenkot, A., Steinberg, Y., Levy, U., Levy, D., Golan, T. and Yutal, Y. (1998). P and K fertigation in subsurface drip irrigated cotton. Field experiments and research in cotton in 1998. Ministry of AgricultureExtension Service, Cotton production and marketing board. pp. 120-125 (Hebrew).
Elam, M., Ben Ari, S. and Magen, H. (1995): The dissolution of different types of potassium fertilizers suitable for fertigation. Dahlia Greidinger Internl. Sym. on fertigation, Technion, Haifa, Israel, pp. 165-174.
Erner, Y., Cohen, A. and Magen, H. (1999): Fertilizing for high yield Citrus. IPI-Bull. No. 4, 59 p.
Finn, C.E., Warmund, M.R., Yarborough, D.E. and Smagula, J.M. (1997): Fertigation vs. surface application of nitrogen during blueberry plant establishment. Proc 6th Intern. Sym. Vaccinium culture, Orono, Maine, USA, Acta-Hortic. 446: 397-401.
Gratten, S. (1999): The history & future of hydroponics. Irrig. Jour. JulyAug. Online.
Griffin, R.A. and Jurinak, J.J. (1973): Estimation of activity coefficients from the electrical conductivity of natural aquatic systems and soil extracts. Soil Sci. 116: 26-30.
Hagin, J. and Lowengart, A. (1996): Fertigation for minimizing environmental pollution by fertilizers. Fert. Res. 43: 5-7.
Hagin, J. and Tucker, B. (1982): Fertilization of dryland and irrigated soils. Springer Verlag, 188 p.
Harrison, C.B., Graharn, W.D., Lamb, S.T. and Alva, A.K. (1999): Impact of alternative citrus management practices on groundwater nitrate in the
64
. Central Florida ridge: 11. Numerical modeling. Transct ASAE. 42: 1669-1678.
Haynes, R.J. (1990): Movement and transformations of fertigated nitrogen below trickle emitters and their effects on pH in the wetted soil volume. Fert. Res. 23: 105-112.
Heffner, Y., Bravdo, B., Louanja, S., Cohen, S. and Tabekman, H. (1982): NPK fertigation in vineyard. HASSADEH, Vol. 62: 828-831 (Hebrew).
Hipps, N.A. (1992): Fertigation of newly planted Queen Cox I M9 apple trees: establishment, early growth and precocity of cropping. J. Hortic. Soc. 67: 25-32.
Imas, P., Bar-Yosef, B. and Munuz-Carpena, R. (1998): Response of lettuce plants grown on different substrates to phosphorus fertigation. Acta Hortic. 1988, pp. 171-178.
Katkafi, U. and Bar-Yosef, B. (1980): Trickle irrigation and fertilization of tomatoes in highly calcareous soils. Agron. J. 72: 893-897.
Koeman, R. (1998): Chiefly the large enterprises irrigate, fertigate and cool. Fruiteelt-Den Haag 88: 13, pp. 19-21. , ..
Kuldip-Singh, Aulakh, M.S., Bijay-Singh, Doran, J.W., Singh-K and Singh-B (1996): Effect of soil pH on kinetics of nitrification in semi-arid subtropical soils under upland and flooded conditions. J. Indian Soc. Soil Sci. 44: 378-381. ·
Komosa, A., Pacholak, E., Stafecka, A. and Treder, W. (1999a): Changes in nutrient distribution in apple orchard soil as the effect of fertigation and irrigation. I. Ammonium and nitrates. J. Fruit and Ornamental Plant Res. 7: 27-40. ~-
Komosa, A., Pacholak, E., Stafecka, A. and Treder, W. (1999b): Changes in nutrient distribution in apple orchard soil as the effect of fertigation and irrigation. 11. Phosphorus, potassium and magnesium. J. Fruit and Ornamental Plant Res. 7: 71-80.
Kwong, K.F.N.K., Paul, J.P. and Deville, J. (1999): Drip fertigation- a means for reducing fertilizer nitrogen to sugarcane. Exp. Agric. 35: 31-37.
Lahav, E., Lowengart, A. and Kalmar, D. (1995): Response of avocados to different nitrogen applications through fertigation. Western Gali1ee Res. and Develop.- Annual Reports 1994-95. pp. 100-106 (Hebrew).
Lahav, E. and Kalmar, D. (1995): Fertigation and water regimes on a Banana plantation. Dahlia Greidinger Intern!. Symp. on Fertigation, Technion, Israel pp. 25-33.
Lahav, E. and Lowengart, A. (1998): Water and nutrient efficiency in growing bananas in subtropics. Acta Hort. 490: 117-125.
Lahav, E. and Turner, D.W. (1989): Fertilizing for high yield Banana. IPI Bull. No. 7, 62 p.
65
Layne, R.E.C., Tan, C.S., Hunter, D.M. and Cline, R.A. (1996): Irrigation and fertilizer application methods affect performance of high-density peach orchards. Hort. Sci. 31: 370-375.
Lowengart, A. and Manor, H. (1998): Irrigation and fertigation recommendations for drip-irrigated processing tomatoes. The Extension Service, Ministry of Agriculture and Rural Development (Hebrew).
Lupin, M., Magen, H. and Gambash, Z. ( 1996): Preparation of solid fertiliser based solution fertilisers under grass roots field conditions. Fert. News 41: 69-72.
Magen, H. (1995): Fertigation: An overview of some practical aspects. Fert. News. The Fert. Assoc. of India, New Delhi, India.
Malik, R.S. and Kumar, K. (1996): Effect of drip irrigation levels on yield and water use efficiency of pea. J. Indian Soc. Soil Sci. 44: 508-509.
Marr, C. (1993): Fertigation of vegetable crops. Agr. Exp. St. & Coop. Ext. Kansas State University. Online.
Mclnnes, K.J. and Fillery, I.R.P. (1989): Modeling and field measurements of the effect of nitrogen source on nitrification. Soil Sci. Soc. Am. J. 53: 1264-1269.
McPharlin, I.R., Aylmore, P.M. and Jeffery, R.C. (1995): Nitrogen requirements under sprinkler irrigation and trickle fertigation on a Spearwood sand. J. Plant Nutr. 18: 219-241.
Microsoft Encarta Encyclopedia (1999): Online. Mosler, C.T., Schnitzler, W.H. and Ben Yehoshua, S. (1998): Influence of
drip laterals placement on root development of field cucumber plants. Inter. Cong. on Plastics in Agriculture, Tel Aviv, Israel, pp. 435-444.
Moyo, C.C., Kissel, D.E. and Cabrera, M.L. (1989): Temperature effects on soil urease activity. Soil Bioi. Biochem. 21: 935-938.
Neilsen, D. and Roberts, T.L. (1996): Potassium fertigation of high density apple orchards. Better Crops with Plant Food 80: 12-13.
Neilsen, G.H., Parchomchuk, P., Neilsen, D. and Zebarth, B.J. (2000): Drip fertigation of apple trees affects root distribution and development of K deficiency. Can. J. Soil Sci. 80: 353-361.
Nerson, H., Edelstein, M., Berdugo, R. and Ankorion, Y. (1997): Monopotassium phosphate as a phosphorus and potassium source for greenhouse-winter-grown cucumber and muskmelon. J. Plant Nutr. 20: 335-344.
Noy, J. and Yoles, D. (1979): Precipitates formed by APP 11-37-0 in irrigation water. Hassadeh 59: 2129-2130 (Hebrew).
Pan, H.Y., Fisher, K.J. and Nichols, M.A. (1999): Fruit yield and maturity characteristics of processing tomatoes in response to drip irrigation. J. Veget. Crop Prod. 5: 13-29.
Paoli, N. (1997): What does fertigation have to offer? Obstbau-Weinbau 34: 10-13.
66

Parchomchuk, P.; Neilsen, G.H. and Rogue, E.J. (1993): Effects of drip fertigation of Nfit-N and P on soil pH and cation leaching. Can. J. Soil Sci. 73: 157-164.
Phene, C.J. and Lamm, F.R. (1995): The sustainability and potential of subsurface drip irrigation. Microirrigation for a changing world: conserving resources-preserving the environment. Proc. 51
h Intemat. Microirrigation Cong., Orlando, Florida, pp. 359-367.
Playan, E. and Faci, J.M. (1997): Border fertigation: Field experiments and a simple model. Irrigation Sci. 17: 163-171.
Postel, S. (1999): Pillar of Sand. W.W. Norton & Company, New York. 313 p.
Raymon, D. and Or, U. (1990): Advanced technologies in traditional agriculture: A new approach. A case study: Drip fertigation in the Jiftlik Valley. ICID Bull. 39: 49-61.
Reist, A., Pivot, D. and Gillioz, J.M. (1999): Closed cultivation systems: Living with pathogens. Rev. Suisse Viticul. Arboricul. Horticul. 31: 259-263. .
Reshef, G. (2000): Fertilization and irrigation of soil grown vegetables in the coastal plains. Extension Service, Ministry of Agriculture, Israel.
Richards, L.A. (ed.) (1954): Diagnosis and improvement of saline and alkali soils. USDA Handbook 60, p. 13.
Rincon, L., Pellicer, C. and Saez, J. (1998): Effect of different nitrogen application rates on the yield and nitrates concentration of lettuces. Agrochimica 42: 304-312. .
Shani, M., Sneh, M. and Sapir, E. (1988): Fertigation. 2nd. edit. Ministry of Agriculture, Extension Service, 32 p. (Hebrew).
Shemesh, D., Noy, Y., Gera, G., Lowengart, A. and Spencer, Y. (1995): NPK fertilization in cotton. Field Experiments and Research in Cotton. pp. 141-146 (Hebrew).
Silva, W.L.C., Giordano, L. de B., Marouelli, W.A., Fontes, R.R., Gomat, B. and Biech, B.J. (1999): Response of six processing tomato cultivars to subsurface drip .fertigation. Workshop on Irrigation and fertigation of processing tomato, Pamplona, Spain. Acta Hortic. 487: 569-573.
Siviero, P. and Sandei, L. (1999): Fertigation of tomatoes with the mobile bench irrigation system. Informatore Agrario 55: 79-82.
Sneh, M. (1987): Fertigation. Ministry of Agriculture, CINADCO, 53 p. Sneh, M. (1995): The history offertigation in Israel. Dahlia Greidinger Interl.
Symp. on Fertigation, Technion, Israel, pp. 1-10. Sonneveld, C. (1995): Fertigation in the greenhouse industry. Dahlia
Greidinger Inteml. Symp. on Fertigation, Technion, Israel, pp. 121-140. Sposito, G. and Mattigod, S.V. (1980): Geochem: A computer program for
the calculation of chemical equilibria in soil solution and other natural
61
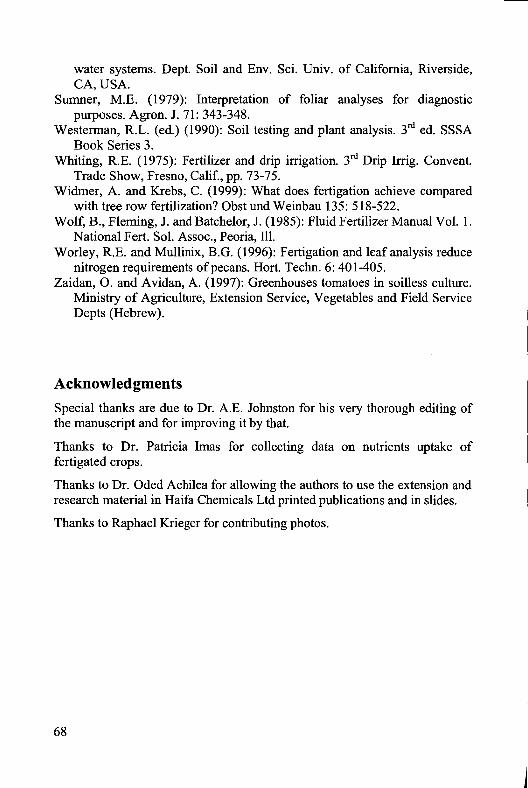
water systems. Dept. Soil and Env. Sci. Univ. of California, Riverside, CA, USA.
Sumner, M.E. (1979): Interpretation of foliar analyses for diagnostic purposes. Agron. J. 71: 343-348.
Westerman, R.L. (ed.) (1990): Soil testing and plant analysis. 3'd ed. SSSA Book Series 3.
Whiting, R.E. (1975): Fertilizer and drip irrigation. 3'd Drip Irrig. Convent. Trade Show, Fresno, Calif., pp. 73-75.
Widmer, A. and Krebs, C. (1999): What does fertigation achieve compared with tree row fertilization? Obst und Weinbau 135: 518-522.
Wolf, B., Fleming, J. and Batchelor, J. (1985): Fluid Fertilizer Manual Vol. 1. National Fert. Sol. Assoc., Peoria, Ill.
Worley, R.E. and Mullinix, B. G. (1996): Fertigation and leaf analysis reduce nitrogen requirements of pecans. Hort. Techn. 6:401-405.
Zaidan, 0. and Avidan, A. (1997): Greenhouses tomatoes in soilless culture. Ministry of Agriculture, Extension Service, Vegetables and Field Service Depts (Hebrew).
Acknowledgments
Special thanks are due to Dr. A.E. Johnston for his very thorough editing of the manuscript and for improving it by that.
Thanks to Dr. Patricia Imas for collecting data on nutrients uptake of fertigated crops.
Thanks to Dr. Oded Achi1ea for allowing the authors to use the extension and research material in Haifa Chemicals Ltd printed publications and in slides.
Thanks to Raphael Krieger for contributing photos.
68

Appendix 1: Calculation of water and nutrient requirements -examples
Fertigation is a precision tool for applying water and nutrients in amounts satisfying the crop demand and minimizing losses to the environment. A crucial steps for achieving that goal is the calculation of the amounts of fertilizer to be applied. Those are related to crop requirement, inherent nutrient content in the growth medium, area to be fertigated and rate of irrigation. Examples of the most frequently used calculations follow.
Conversion of nutrient amount to be applied to quantity of commercial fertilizer
Qc = Quantity of commercial fertilizer (kg) Nu = Nutrient amount (kg) P% =Percentage (per weight) of the nutrient in the commercial fertilizer(%) ~=~I~ ' Example: 50 kg of nitrogen (Nu) to be applied. Ammonium sulphate contains 21% of nitrogen. Qc =50 kg I 21% =50 I 21 x 100 = 238.1 kg (N~)2S04
Conversion of weight of liquid fertilizer into volume
Measuring quantities of liquid fertilizer by volume is often more convenient than by weight. Vc =Volume of the liquid commercial fertilizer (L) to be applied Qc = Quantity of commercial fertilizer in weight units (kg) Sd =Specific density of the liquid fertilizer (kgiL) Vc = QciSd Example: Weight of ammonium nitrate to be applied (Qc) = 250 kg Specific density of the ammonium nitrate solution (Sd) = 1.27 kg per liter Vc = 250 kg/1.27 = 196.8 L NH4N03
Combination of two fertilizers
Simultaneous application of two or more nutrients requires mixing two or more commercial fertilizers. Qa = Quantity of fertilizer a (kg) to be applied Qb = Quantity of fertilizer b (kg) to be applied Nul =Quantity of nutrient 1 (kg) to be applied Nu2 = Quantity of nutrient 2 (kg) to be applied
69
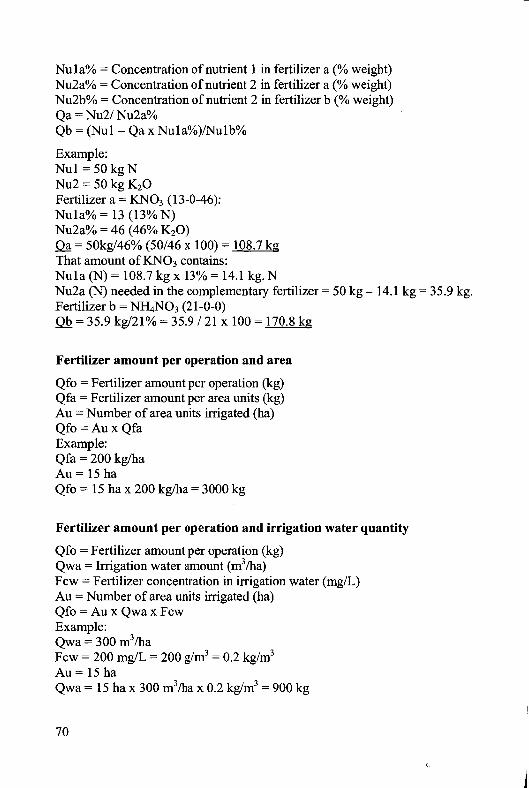
Nu la%= Concentration of nutrient 1 in fertilizer a(% weight) Nu2a% = Concentration of nutrient 2 in fertilizer a (% weight) Nu2b% = Concentration of nutrient 2 in fertilizer b (% weight) Qa = Nu2/ Nu2a% Qb =(Nul- Qa x Nula%)/Nulb%
Example: Nul =50kgN Nu2 = 50 kg K20 Fertilizer a= KN03 (13-0-46): Nul a%= 13 (13% N) Nu2a% = 46 (46% K 20) ~ = 50kg/46% (50/46 X 100) = 108.7 kg That amount ofKN03 contains: Nul a (N) = 108.7 kg x 13% = 14.1 kg. N Nu2a (N) needed in the complementary fertilizer= 50 kg- 14.1 kg= 35.9 kg. Fertilizer b = NH4N03 (21-0-0) QQ = 35.9 kg/21% = 35.9 I 21 X 100 = 170.8 kg
Fertilizer amount per operation and area
Qfo =Fertilizer amount per operation (kg) Qfa =Fertilizer amount per area units (kg) Au =Number of area units irrigated (ha) Qfo =AuxQfa Example: Qfa = 200 kg/ha Au= 15 ha Qfo = 15 ha x 200 kg/ha= 3000 kg
Fertilizer amount per operation and irrigation water quantity
Qfo =Fertilizer amount per operation (kg) Qwa =Irrigation water amount (m3/ha) Few= Fertilizer concentration in irrigation water (mg/L) Au =Number of area units irrigated (ha) Qfo = Au x Qwa x Few Example: Qwa =300m3/ha Few= 200 mg/L = 200 g/m3 = 0.2 kg/m3
Au= 15 ha Qwa = 15 ha x 300m3/ha x 0.2 kg/m3 = 900 kg
70
_ __j
Nutrient solution volume _
Nsv =Nutrient solution volume (L) Fs% =Fertilizer solubility at the relevant temperature(% w/v) Qf= Fertilizer amount to be applied (kg) Wv = Minimal water volume needed for dissolution of the given amount of fertilizer (1) Ww =Weight ofWv (kg) Sd =Specific density of the solution (kg/L) Nsv = (Qf!Fs%+Qf)/Sd Example: Qf = 200 kg ~)zS04 Fs% (N~)zS04 at 20° C = 750 g/L Wv = 200 kg/75% = 200/75 x 100 = 266.7 L Ww=266.7kg
In the dissolution process the volume of the solution will be smaller than the total volume of the fertilizer and the water. The actual volume will be determined by measurement of the specific density of the solution Sd = 1.2 (has to be measured) ' Nsv = 266.7 kg+ 200 kg/1.2 = 466.7/1.2 = 388.9 L
Nutrient concentration in nutrient solution, per weight
Nus% =Nutrient concentration in the nutrient solution(%) Qf = Fertilizer quantity (kg) Nu%= w/w percentage of the nutrient in the fertilizer(%) Nsv =Volume of the nutrient solution (L) Sd =Specific density of the fertilizer solution (kg/L) Nus% = Qfx Nu%/(Nsv x Sd) Example: Qf= 200 kg Nu%=61% Nsv = 500 Sd = 1.12 Nus% = 200kg x 61%/(500 x 1.12)= 200 x 61/100 I (500 x 1.12) =21.8%
Nutrient concentration in nutrient solution, per volume
Nus% =Nutrient concentration in the nutrient solution(%) Qf= Fertilizer quantity (kg) Nu%= w/w percentage of the nutrient in the fertilizer(%) Nsv =Volume of the nutrient solution (L) Nus% = Qfx Nu%/Nsv
71

Example: Qf=200kg Nu%= 61% Nsv = 500 Nus% = 200kg x 61%1500 = 200 x 611100 I 500 = 24.4%
Required dilution ratio
The required dilution ratio is calculated for adjusting the ratio between the quantity of irrigation water applied and the amount of the injected fertilizer solution. Or = Dilution ratio Fnc =Final nutrient concentration in irrigation water wlv (mgiL) Nuc =Nutrient concentration in fertilizer stock solution wlv (%) Dr= Fnc/Nuc Example: Fnc = 50 mgiL N Nuc = 26.7% N = 267 g/L = 267,000 mgiL Or= 50 I 267,000 = 1: 5340 = 187 ml!m3
Fertilizer pump flow-rate
Calculation of the flow-rate of fertilizer pumps is needed for the selection of the appropriate pump and for the adjustment of the pump flow-rate in the field, manually or by the irrigation controller. Pfr = Pump flow-rate (L/h) Fnc =Final nutrient concentration in irrigation water wlv (mgiL) Nuc =Nutrient concentration in fertilizer stock solution wlv (%) Wfr = Irrigation water flow-rate (m3 /h) Pfr = Wfr x Fnc I Nuc Example: Wfr= 80m3
Fnc =50 mg/L Nuc=26.7% Pfr =80 m3/h x 50 mgll 126.7% =80.000 1 x 50 mg/1 1267,000 mg/1=14.5 1/h
72
Appendix 2: Coloured plates
(Plates numbered according to the related chapter number)
Plate 1.1. Close-up of a dripper and surrounding avocado rootlets.
Plate 2.1. Hanging Bahai gardens in Haifa, Israel.
73
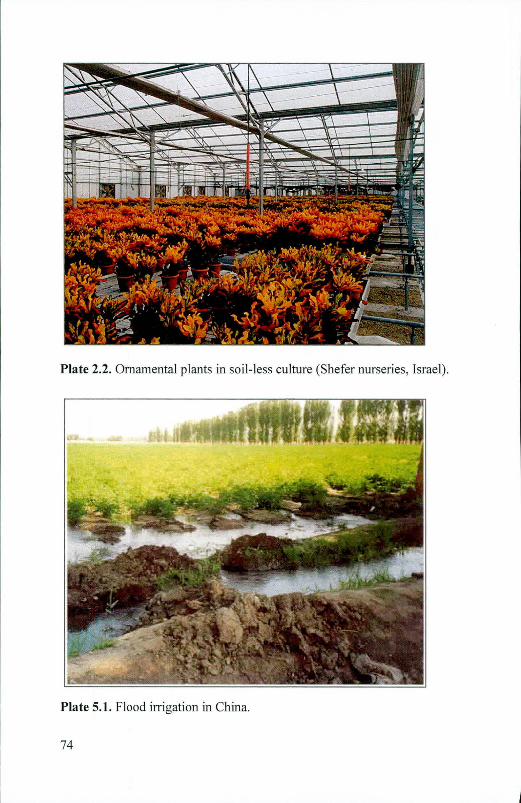
Plate 2.2. Ornamental plants in soil-less culture (Shefer nurseries, Israel).
Plate 5.1. Flood irrigation in China.
74
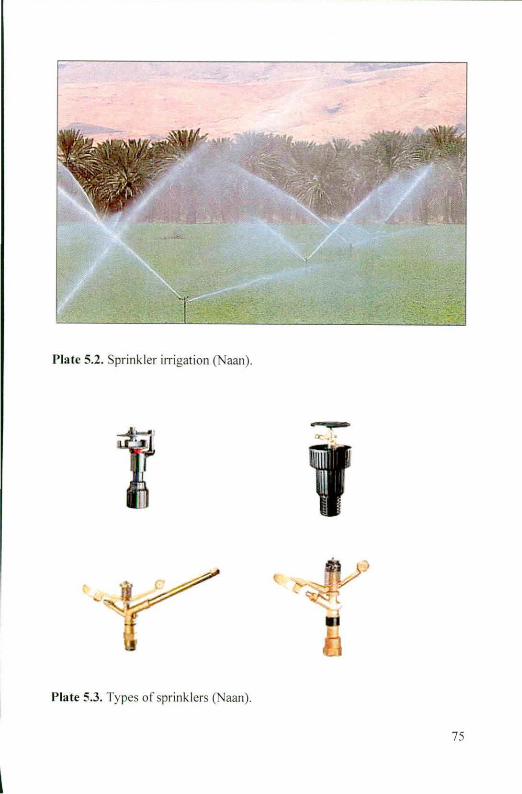
Plate 5.2. Sprinkler irrigation (Naan).
..... .
Plate 5.3. Types of sprinklers (Naan).
75

Plate 5.4. Micro irrigation in an orchard (Naan).
-~ - .,.::"'"
-rff~ .,;r
Plate 5.5. Wetted soil pattern under drip irrigation (Netafim).
76
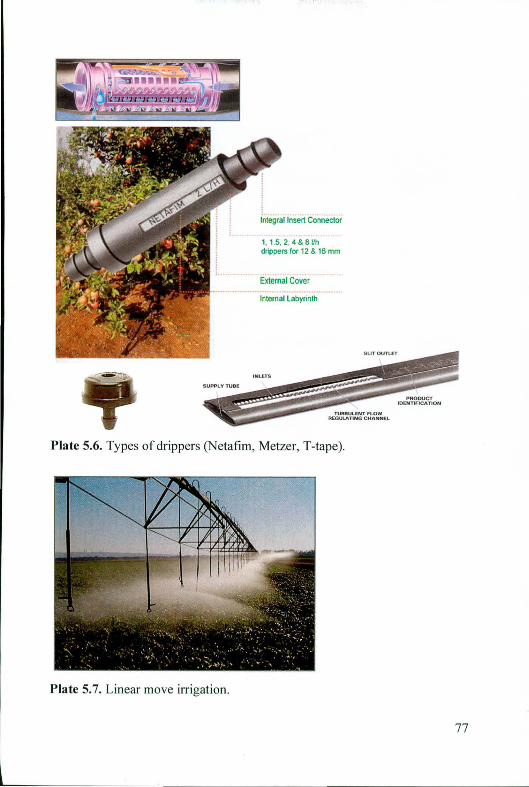
integral Insert Connector
1. 1.5, 2, 4 & 8 Vh drippers for 12 & 16 mm
External Cover
Internal Labyrinth
i!!~'"!'n!!s !!!!!!!!!!!!!!!!!!~::::~ S UP9CY TUBE
TURBULENT FLOW REGUlATING CHANNEL
Plate 5.6. Types of drippers (Netafim, Metzer, T-tape).
Plate 5.7. Linear move irrigation.
77
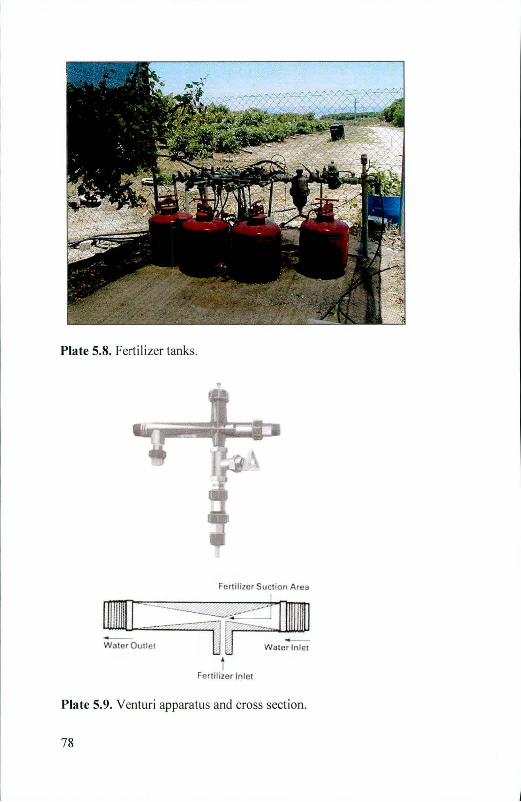
Plate 5.8. Fertilizer tanks.
"
Fcr1ilizer Suction Area I
i Ferti lizer Inlet
Plate 5.9. Venturi apparatus and cross section.
78

SUCTION TYPE INJECTOR (4-01 )
I
1 o ,wc water hand valve 2 Raecord connector 3 DriVe water f11tcr 4 Automrthc cul-oul
5 SuetJOn head 6 AJt release valv<! 1 1n1ec1.on ~ne hand 8 water exhaust Cat No. 08-5060
Plate 5.10. Fertilizer pumps (Amiad and TMB).
Plate 5.11. Dosatron fertilizer pump.
79

Plate 5.12. Electric fertilizer pump (Prominent) .
Plate 5.13. Fertilizer mixer (Rotern).
80
