fertility transition in sub-saharan · pdf filefertility transition in sub-saharan africa:...
TRANSCRIPT
Fertility transition in sub-Saharan Africa: Translation of fertility preferences into
reproductive behaviours
Improving health worldwide www.lshtm.ac.uk
Kazuyo Machiyama, MPH, PhD
Research Fellow, Faculty of Epidemiology and Population Health
London School of Hygiene & Tropical Medicine (LSTHM)
School of Tropical Medicine and Global Health, Nagasaki University
10 November 2015, Nagasaki, Japan
1. Why is African fertility transition important?
2. Investigation of reasons for non-use of family planning(FP) in Ghana
3. Assessment of childbearing preferences in Malawi
Outline
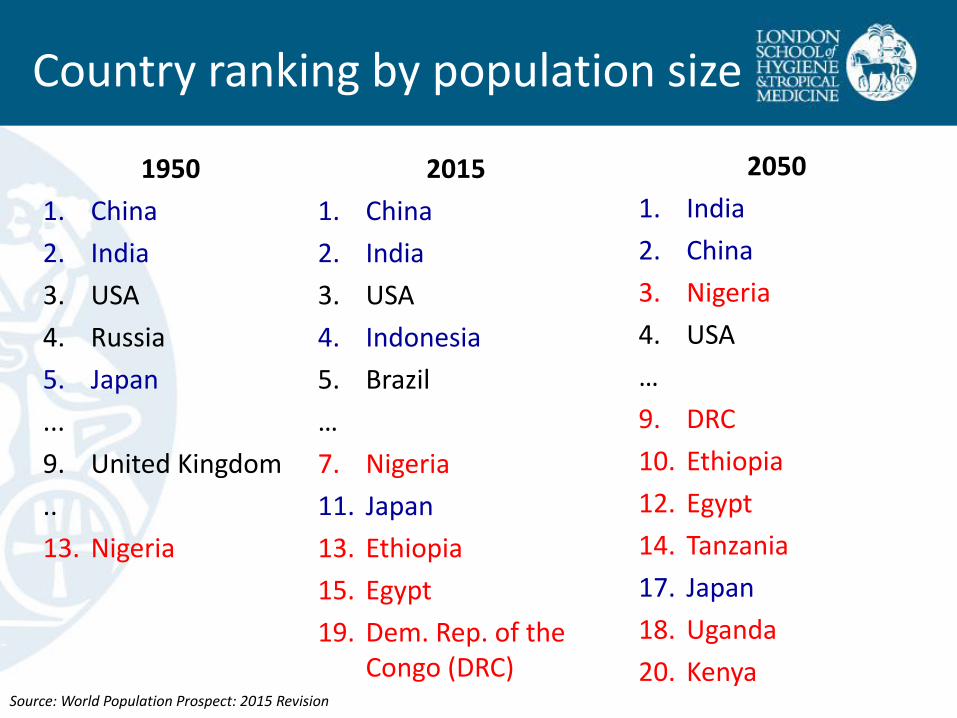
Country ranking by population size
1950
1. China
2. India
3. USA
4. Russia
5. Japan
...
9. United Kingdom
..
13. Nigeria
2015
1. China
2. India
3. USA
4. Indonesia
5. Brazil
…
7. Nigeria
11. Japan
13. Ethiopia
15. Egypt
19. Dem. Rep. of the Congo (DRC)
2050
1. India
2. China
3. Nigeria
4. USA
…
9. DRC
10. Ethiopia
12. Egypt
14. Tanzania
17. Japan
18. Uganda
20. Kenya
Source: World Population Prospect: 2015 Revision

9.1%
55.2%
21.7%
6.7% 6.8% 0.5% Africa
Asia
Europe
Latin America & Caribbean
Northern America (1.4 billion)
Source: World Population Prospect: 2015 Revision
World Population in 1950
1950: 2.5 billion
(0.2 billion)
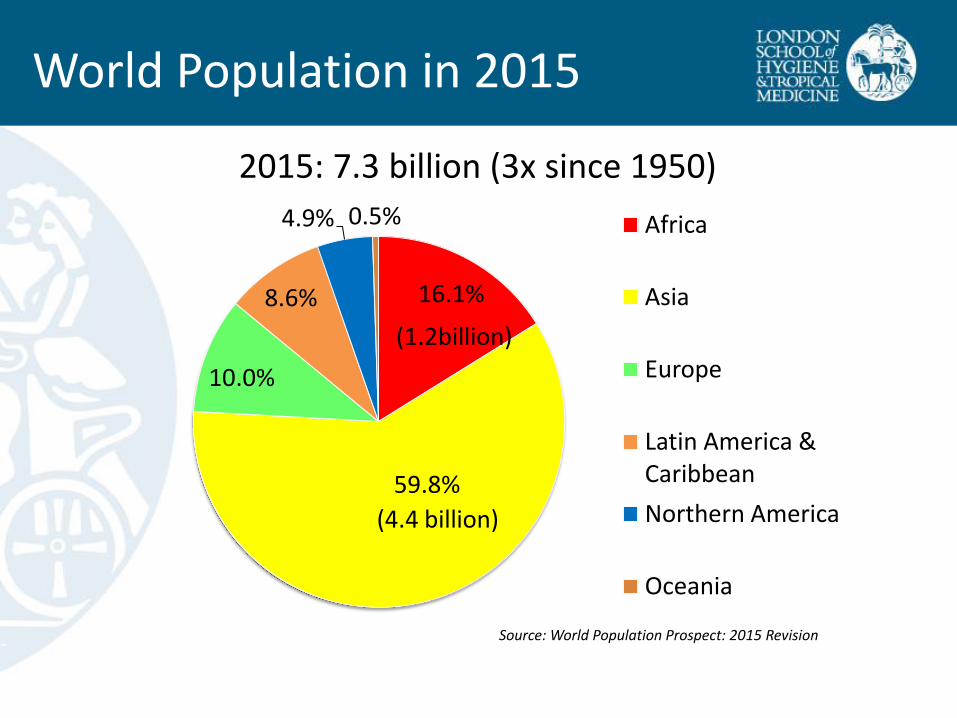
World Population in 2015
2015: 7.3 billion (3x since 1950)
16.1%
59.8%
10.0%
8.6%
4.9% 0.5% Africa
Asia
Europe
Latin America & Caribbean
Northern America
Oceania
(4.4 billion)
(1.2billion)
Source: World Population Prospect: 2015 Revision
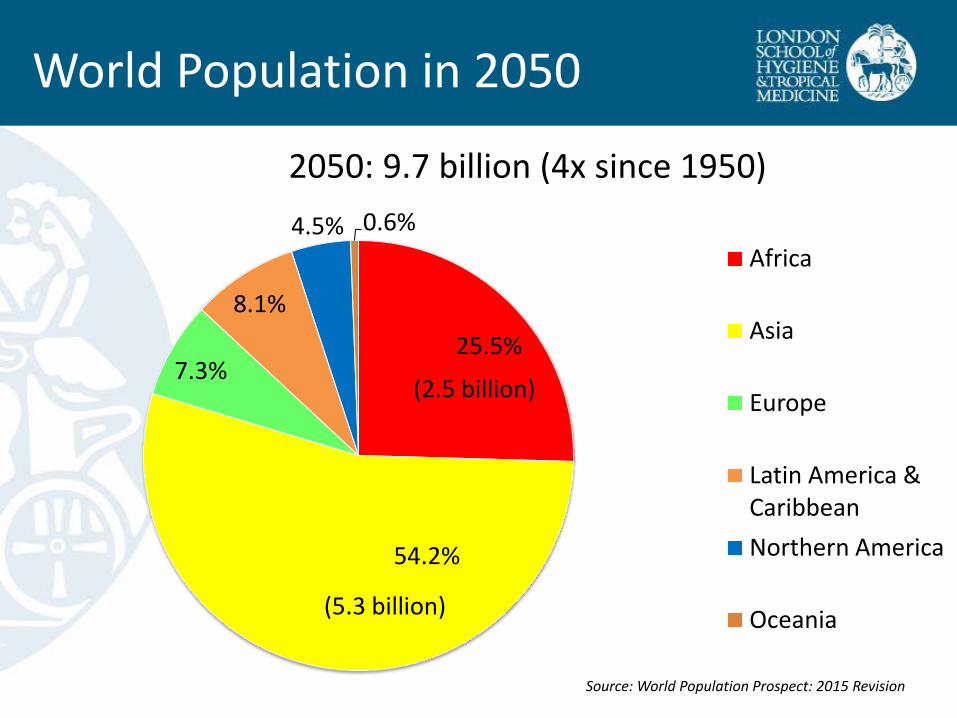
World Population in 2050
2050: 9.7 billion (4x since 1950)
25.5%
54.2%
7.3%
8.1%
4.5% 0.6%
Africa
Asia
Europe
Latin America & Caribbean
Northern America
Oceania
(2.5 billion)
(5.3 billion)
Source: World Population Prospect: 2015 Revision

Oldest and youngest populations
Source: World Population Prospect: 2015 Revision World Bank. World Development Indicator
Japan Niger
Median age
Percentage of 65+ yrs old
Dependency ratio
GDP per capita, PPP
Total fertility rate
Dependency ratio= ratio of population aged 0-14 and 65+ per 100 population 15-64 Total fertility rate= average number of children per woman PPP=purchasing power parity
46.5 years old 14.8 years old
26.3% 2.6%
64.5% 113%
USD 36,426 USD937
1.40 7.63
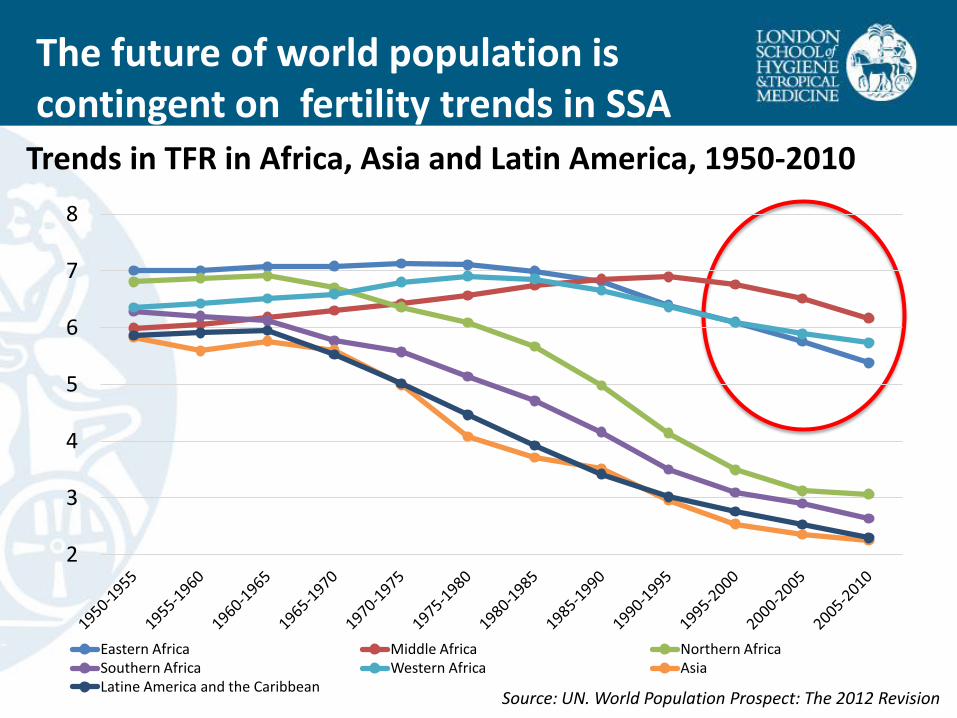
The future of world population is contingent on fertility trends in SSA
Source: UN. World Population Prospect: The 2012 Revision
Trends in TFR in Africa, Asia and Latin America, 1950-2010
2
3
4
5
6
7
8
Eastern Africa Middle Africa Northern Africa Southern Africa Western Africa Asia Latine America and the Caribbean
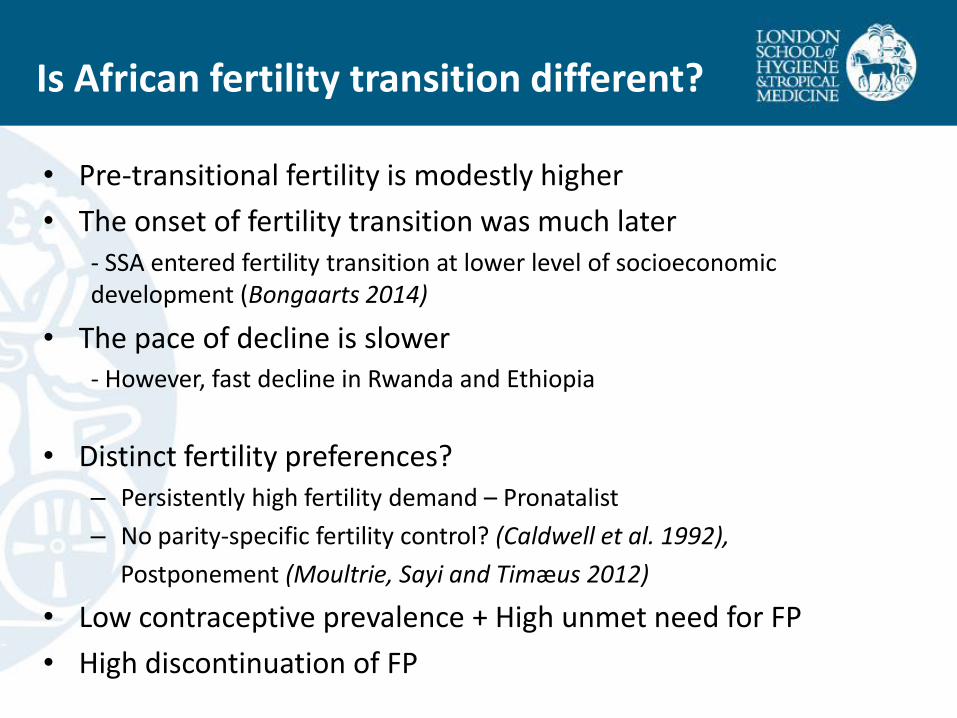
• Pre-transitional fertility is modestly higher
• The onset of fertility transition was much later - SSA entered fertility transition at lower level of socioeconomic development (Bongaarts 2014)
• The pace of decline is slower - However, fast decline in Rwanda and Ethiopia
• Distinct fertility preferences? – Persistently high fertility demand – Pronatalist
– No parity-specific fertility control? (Caldwell et al. 1992),
Postponement (Moultrie, Sayi and Timæus 2012)
• Low contraceptive prevalence + High unmet need for FP
• High discontinuation of FP
Is African fertility transition different?
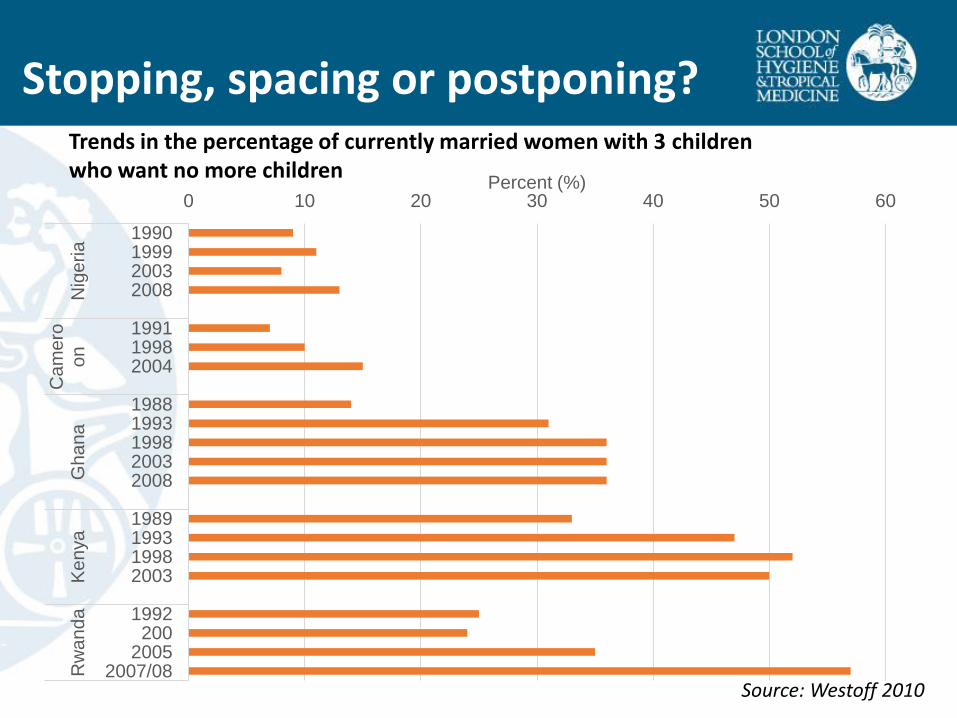
Trends in the percentage of currently married women with 3 children who want no more children
Stopping, spacing or postponing?
Source: Westoff 2010
0 10 20 30 40 50 60
1990 1999 2003 2008
1991 1998 2004
1988 1993 1998 2003 2008
1989 1993 1998 2003
1992 200
2005 2007/08
Nig
eria
C
am
ero
on
Ghana
K
en
ya
R
wa
nd
a
Percent (%)
0
2
4
6
8
0
20
40
60
80
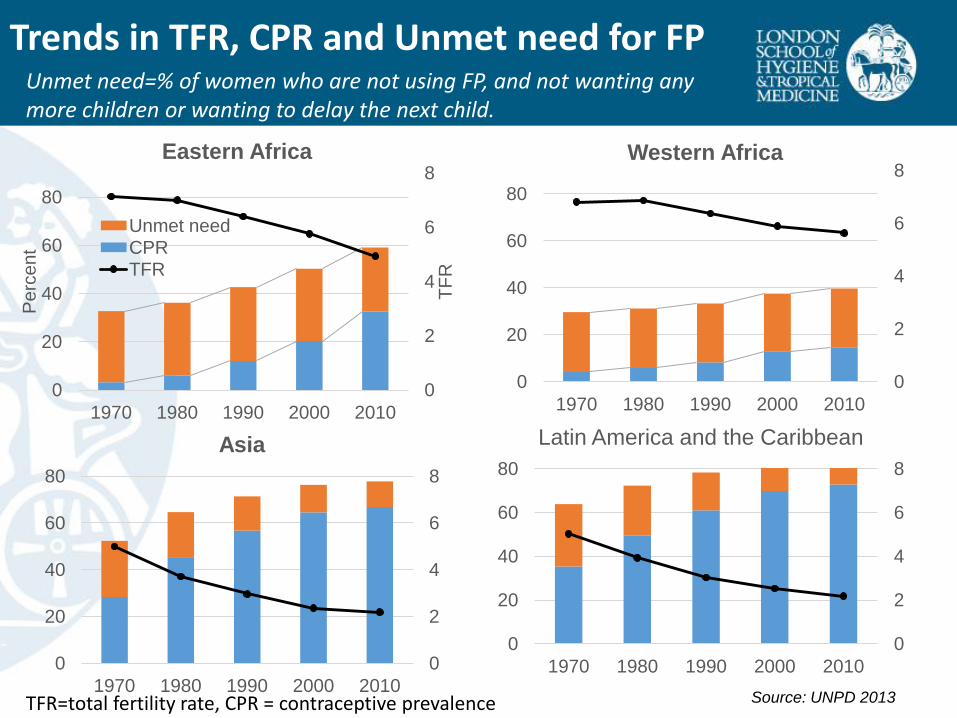
1970 1980 1990 2000 2010
TF
R
Pe
rce
nt
Eastern Africa
Unmet need CPR TFR
0
2
4
6
8
0
20
40
60
80
1970 1980 1990 2000 2010
Western Africa
0
2
4
6
8
0
20
40
60
80
1970 1980 1990 2000 2010
Asia
0
2
4
6
8
0
20
40
60
80
1970 1980 1990 2000 2010
Latin America and the Caribbean
Source: UNPD 2013
Trends in TFR, CPR and Unmet need for FP Unmet need=% of women who are not using FP, and not wanting any more children or wanting to delay the next child.
TFR=total fertility rate, CPR = contraceptive prevalence

Unmet need for FP
Source: Sedgh and Hussain 2014
Percentages of married women aged 15-49 citing key reasons for nonuse of contraception, by region, 2006-13

Method mix: among all married users, percent using specific method
Source: United Nations (2011) World Contraceptive Use 2011
0
10
20
30
40
50
60
70
80
90
100
More Developed Asia Latin America North Africa Sub-Saharan Africa
Pre
vale
nce (
%)
Region
Sterilization (Male and Female)
IUD
Pill
Injectable
Condom
Other
Method mix of contraception
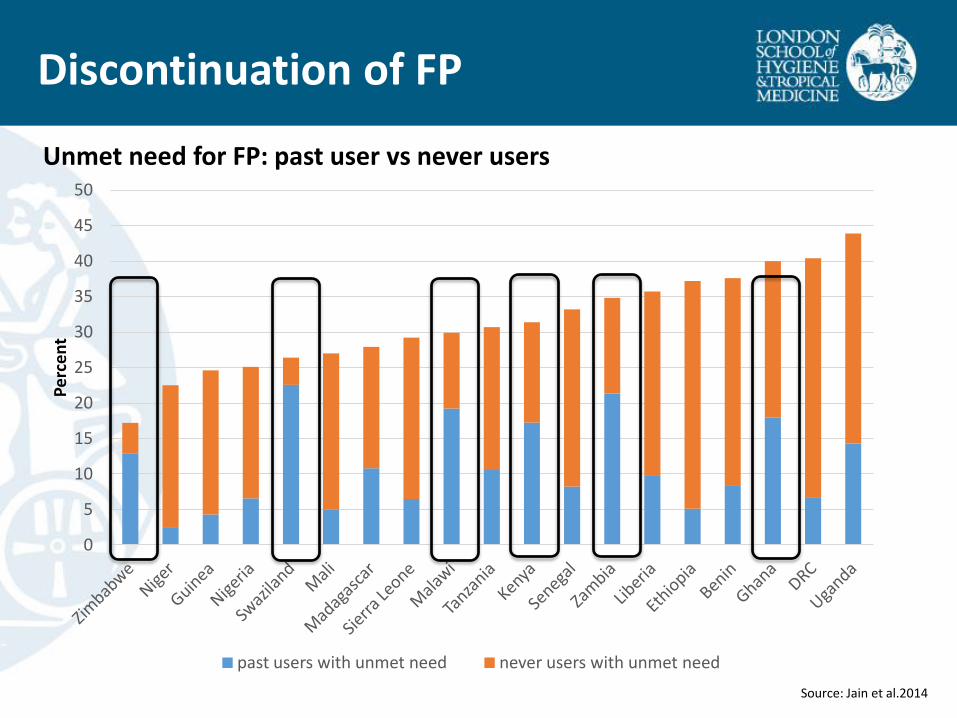
Discontinuation of FP
0
5
10
15
20
25
30
35
40
45
50
Pe
rce
nt
past users with unmet need never users with unmet need
Source: Jain et al.2014
Unmet need for FP: past user vs never users
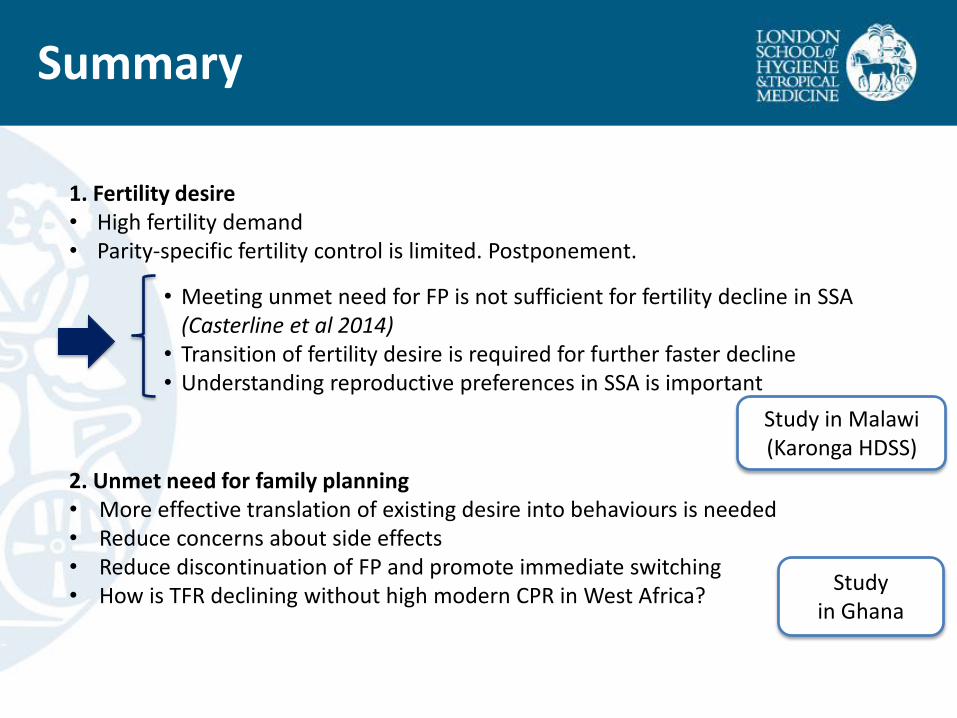
Summary
1. Fertility desire • High fertility demand • Parity-specific fertility control is limited. Postponement.
2. Unmet need for family planning • More effective translation of existing desire into behaviours is needed • Reduce concerns about side effects • Reduce discontinuation of FP and promote immediate switching • How is TFR declining without high modern CPR in West Africa?
Study in Malawi (Karonga HDSS)
Study in Ghana
• Meeting unmet need for FP is not sufficient for fertility decline in SSA (Casterline et al 2014)
• Transition of fertility desire is required for further faster decline • Understanding reproductive preferences in SSA is important
1. Insights into unmet need for family planning
A Case Study in Ghana
Machiyama and Cleland. 2014. Unmet need for family planning in Ghana: The shifting contributions of lack of access and attitudinal resistance. Studies in Family Planning 45(2):203-226.
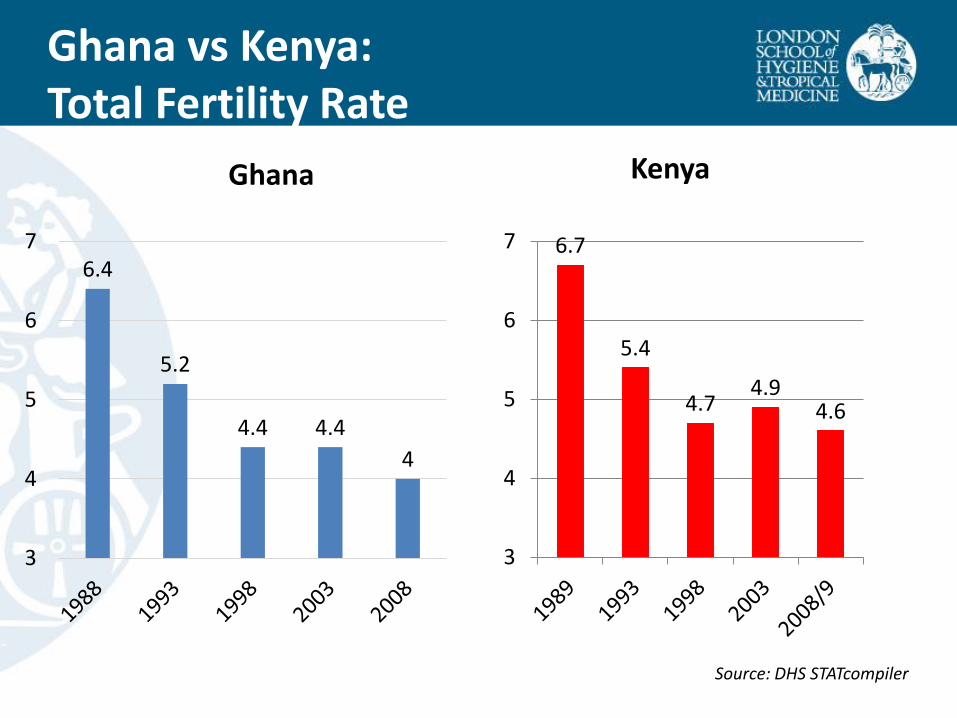
Ghana vs Kenya: Total Fertility Rate
Source: DHS STATcompiler
6.7
5.4
4.7 4.9
4.6
3
4
5
6
7
Ghana Kenya
6.4
5.2
4.4 4.4
4
3
4
5
6
7

Ghana vs Kenya: Contraceptive prevalence (modern methods)
Among currently married women Source: DHS STATcompiler
Ghana Kenya
17.9
27.3
31.5 31.5
39.4
1989 1993 1998 2003 2008/9
4.2
10.1 13.3
18.7 16.6
0
5
10
15
20
25
30
35
40
45
1988 1993 1998 2003 2008

Background
Source: ICF Macro 2010
Ghana: CPR

Objective
Assess reasons for non-use of family planning and
Investigate fertility decline with low modern CPR in Ghana
Data
– Ghana DHS 2008
– Married women aged 15-49
Objectives and Methods
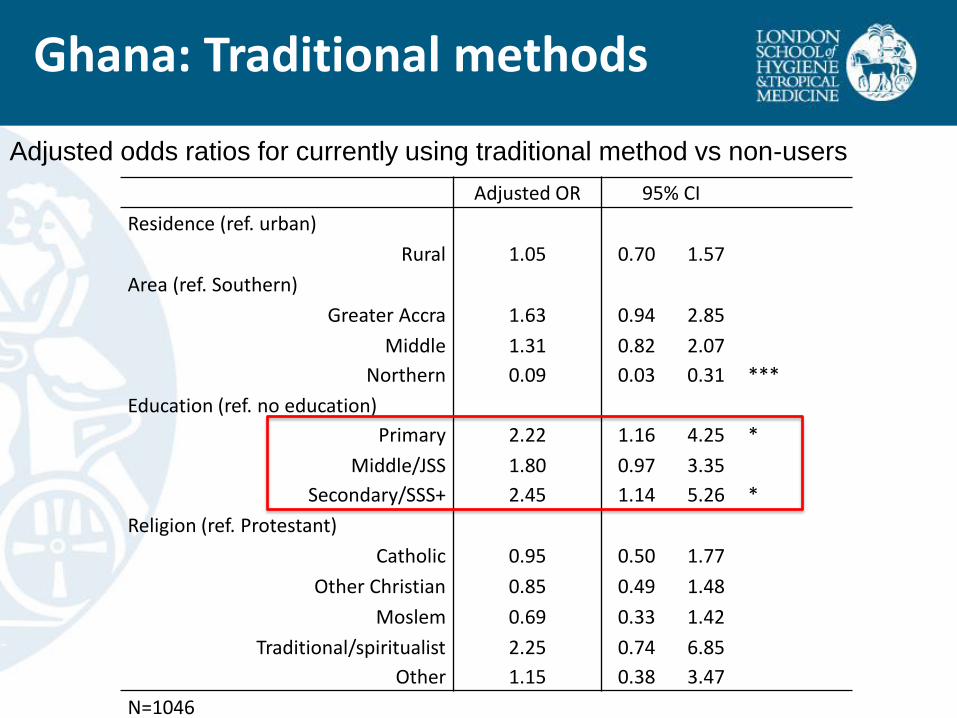
Adjusted odds ratios for currently using traditional method vs non-users
Adjusted OR 95% CI
Residence (ref. urban)
Rural 1.05 0.70 1.57
Area (ref. Southern)
Greater Accra 1.63 0.94 2.85
Middle 1.31 0.82 2.07
Northern 0.09 0.03 0.31 ***
Education (ref. no education)
Primary 2.22 1.16 4.25 *
Middle/JSS 1.80 0.97 3.35
Secondary/SSS+ 2.45 1.14 5.26 *
Religion (ref. Protestant)
Catholic 0.95 0.50 1.77
Other Christian 0.85 0.49 1.48
Moslem 0.69 0.33 1.42
Traditional/spiritualist 2.25 0.74 6.85
Other 1.15 0.38 3.47
N=1046
Ghana: Traditional methods
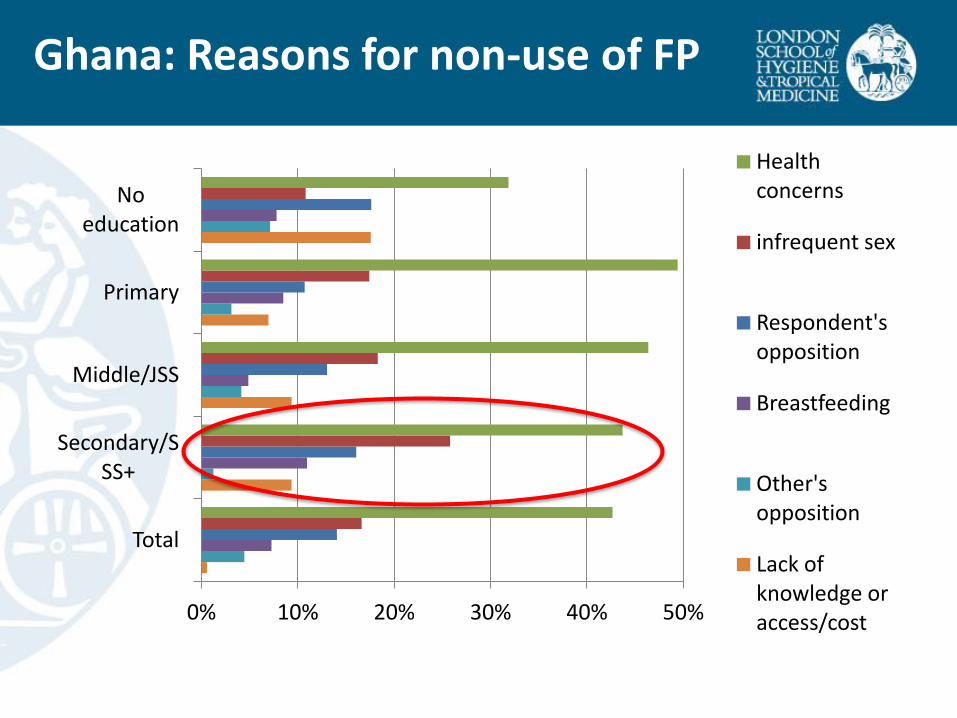
0% 10% 20% 30% 40% 50%
Total
Secondary/SSS+
Middle/JSS
Primary
No education
Health concerns
infrequent sex
Respondent's opposition
Breastfeeding
Other's opposition
Lack of knowledge or access/cost
Ghana: Reasons for non-use of FP
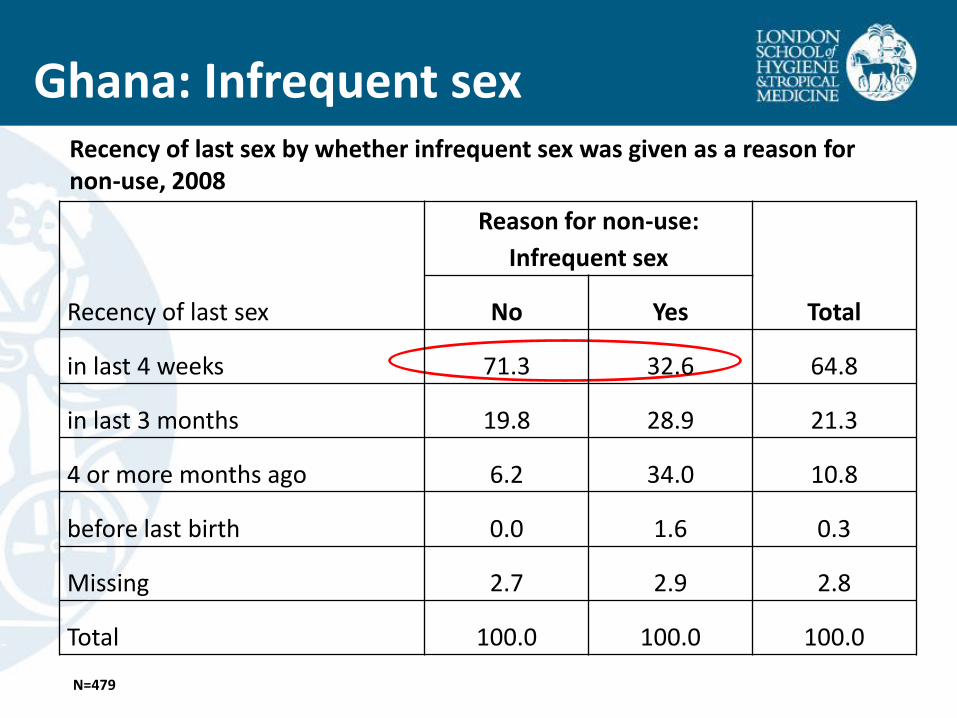
Ghana: Infrequent sex
Recency of last sex
Reason for non-use:
Infrequent sex
Total No Yes
in last 4 weeks 71.3 32.6 64.8
in last 3 months 19.8 28.9 21.3
4 or more months ago 6.2 34.0 10.8
before last birth 0.0 1.6 0.3
Missing 2.7 2.9 2.8
Total 100.0 100.0 100.0
N=479
Recency of last sex by whether infrequent sex was given as a reason for non-use, 2008
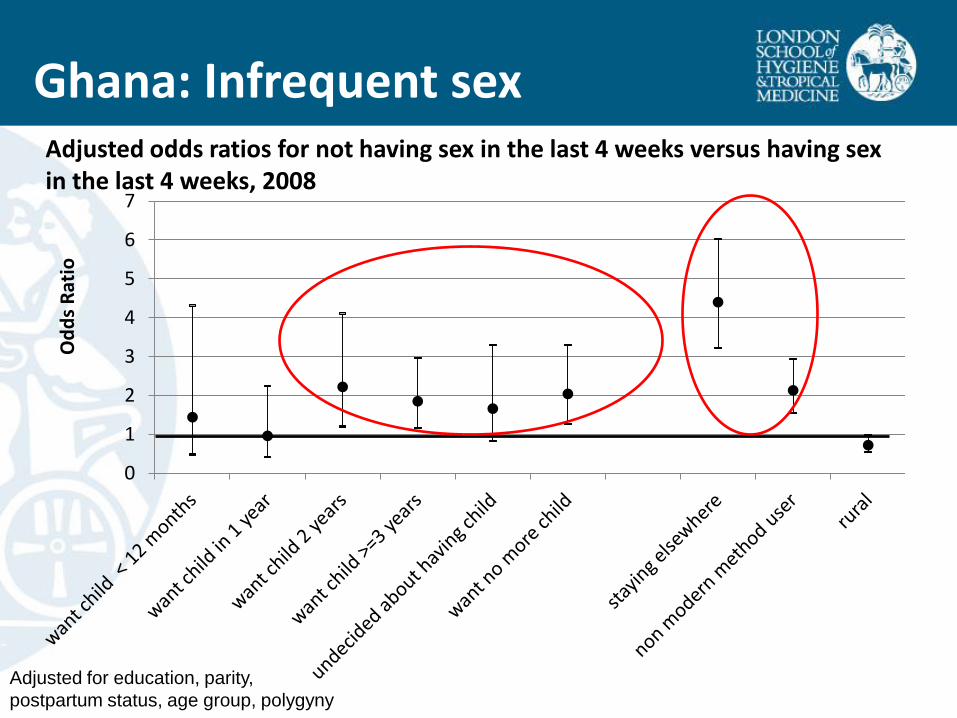
Ghana: Infrequent sex
Adjusted for education, parity,
postpartum status, age group, polygyny
0
1
2
3
4
5
6
7
Od
ds
Rat
io
Adjusted odds ratios for not having sex in the last 4 weeks versus having sex in the last 4 weeks, 2008
• An enduring resistance to hormonal methods may lead many Ghanaian women to use non-hormonal methods, i.e. male condom, periodic abstinence or reduced coital frequency as an alternative means of reducing pregnancy-risk.
Implications
The elite group use less effective method, but the TFR has continuously declined.
Is Ghanaian fertility transition powered by less effective methods with medical abortion as back-up? (Osei 2009)
2. An assessment of childbearing preferences
A Case Study in Northern Malawi
Machiyama K, Baschieri A, Albert D, Crampin, AC, Glynn, JR, French, N, Cleland J. (2015) An Assessment of childbearing preferences in Malawi. Studies in Family Planning. 46(2): 161-176

• Fertility decision-making is complex in first place
– Pregnancy is not always an outcome of reasoned action
– Multi-dimensional
• An appreciable proportion of women report births resulting from accidental pregnancy due to discontinuation or failure of contraceptives as wanted
• 18% of women in US are neither avoiding nor trying pregnancy (Väisänen and Jones 2014)
– Fluid, tentative, or ambivalent, especially in SSA?
– Sequential over time
Measuring fertility intention

• The major source of fertility intention data is predominantly cross-sectional surveys, which is vulnerable to post-factum rationalisation
• Few prospective studies were conducted in SSA
• A high degree of instability of fertility preferences among young women was suggested by studies in Ghana and Malawi (Johnson-Hanks 2002, 2005, Kodzi et al. 2010, Sennott and Yeatman 2012)
• High stability among married women who want to cease childbearing in Egypt, Morocco and Pakistan over 2-3 years at individual level (Westoff and Bankole 1998, Casterline et al. 2003, Jain et al. 2014)
Measuring fertility intention

Objectives
Investigate prospective fertility intention in terms of their degree of spousal agreement and association with future childbearing
Setting
– Karonga HDSS, Malawi (patrilineal)
Data
– Fertility intention study nested in Karonga HDSS over 3 rounds between 2008-2011
– Married women aged 15-49
– Matched couple data are used
Objectives and Methods
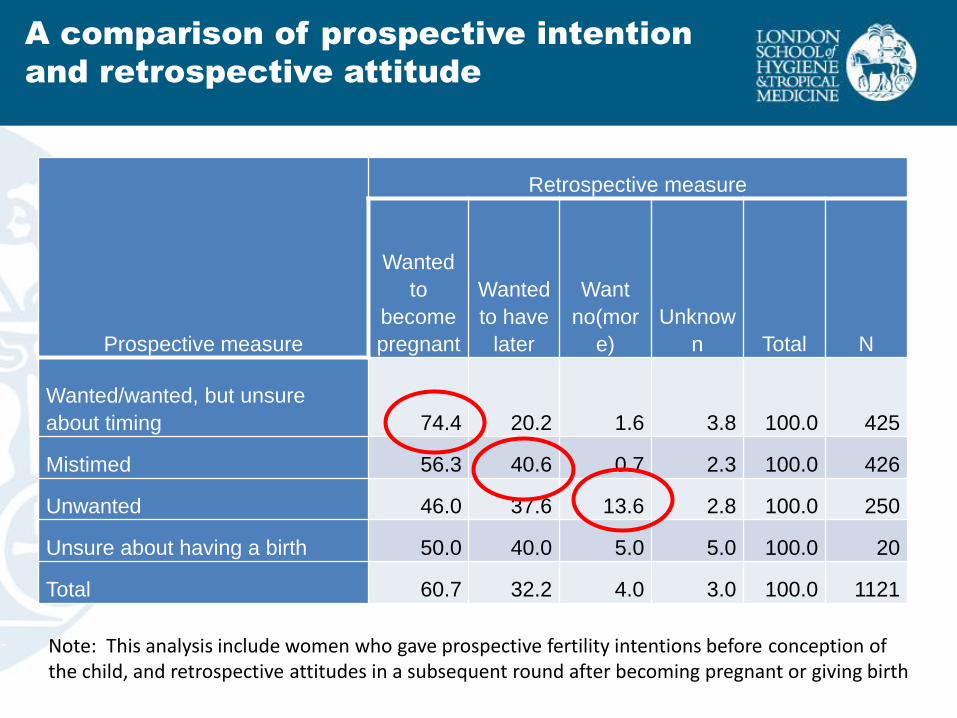
A comparison of prospective intention
and retrospective attitude
Prospective measure
Retrospective measure
Wanted
to
become
pregnant
Wanted
to have
later
Want
no(mor
e)
Unknow
n Total N
Wanted/wanted, but unsure
about timing 74.4 20.2 1.6 3.8 100.0 425
Mistimed 56.3 40.6 0.7 2.3 100.0 426
Unwanted 46.0 37.6 13.6 2.8 100.0 250
Unsure about having a birth 50.0 40.0 5.0 5.0 100.0 20
Total 60.7 32.2 4.0 3.0 100.0 1121
Note: This analysis include women who gave prospective fertility intentions before conception of the child, and retrospective attitudes in a subsequent round after becoming pregnant or giving birth

Spousal agreement of fertility intention
Wife's fertility
intention
Husband's fertility intention (%)
Total
(%)
Want no
more
children
Unsure
about
having a
child
Want to
wait 3+
years
Want within 3
years/unsure
about the
timing
No
intention
Want no more
children 66.6 3.2 6.3 17.9 6.2 100.0
Unsure about
having a child 46.1 11.2 6.7 31.5 4.5 100.0
Want to wait 3+
years 21.7 3.9 33.5 38.5 2.4 100.0
Want within 3
years/unsure
about timing 15.3 2.0 12.9 66.9 2.9 100.0
Total 39.9 3.2 13.3 39.4 4.2 100.0
N=2,071
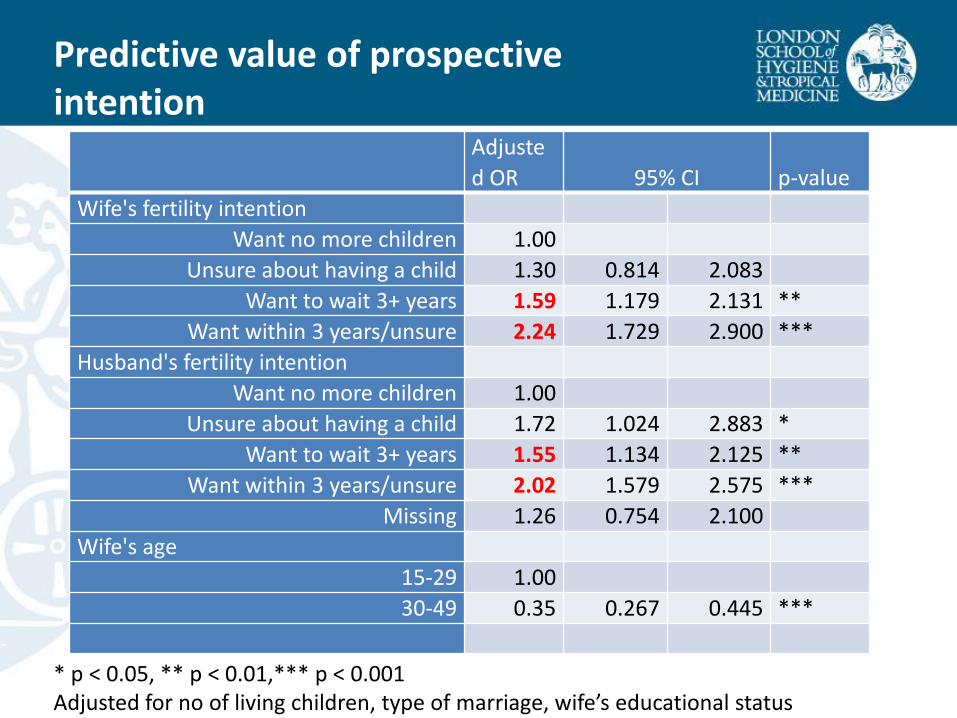
Predictive value of prospective intention
Adjuste
d OR 95% CI p-value
Wife's fertility intention
Want no more children 1.00
Unsure about having a child 1.30 0.814 2.083
Want to wait 3+ years 1.59 1.179 2.131 **
Want within 3 years/unsure 2.24 1.729 2.900 ***
Husband's fertility intention
Want no more children 1.00
Unsure about having a child 1.72 1.024 2.883 *
Want to wait 3+ years 1.55 1.134 2.125 **
Want within 3 years/unsure 2.02 1.579 2.575 ***
Missing 1.26 0.754 2.100
Wife's age
15-29 1.00
30-49 0.35 0.267 0.445 ***
* p < 0.05, ** p < 0.01,*** p < 0.001 Adjusted for no of living children, type of marriage, wife’s educational status
Summary
• Predictive validity of the stated intention to stop childbearing is
high and consistent with the findings from the previous studies in Morocco, Egypt and Pakistan
• Weaker spousal agreement and predictive power of desire to postpone childbearing
• The influence of the reproductive wishes of husband and wife on subsequent childbearing were symmetrical
1. Fertility intention
– Meeting unmet need will not be sufficient for fertility decline in SSA (Casterline et al 2014)
– Transition of fertility demand is required
– Further understanding of reproductive decision-making is needed.
2. High unmet need for family planning
– Shifting contributions of from lack of access to attitudinal resistance
– Re-visit ‘traditional’ (natural) methods
Conclusions
More effective translation of existing desire into behaviours by strong FP programmes
1. Design and validate that measures women’s reasons for non-use of a modern contraceptive method
2. Design and validate a concise data collection instrument of unintended pregnancy through a longitudinal study design and cross-sectional surveys
Sites:
• Nairobi HDSS (African Population Health Research Centre, APHRC)
• Matlab HDSS(icddr, b)
• Ouagadougou HDSS (l'Institut Supérieur des Sciences de la Population (ISSP))?
Next Steps

• UKaid (STEP-UP)
• ESRC/Hewlett Foundation
• Karonga Prevention Study
• Population Studies Group, LSHTM
Acknowledgement
The STEP UP (Strengthening Evidence for Programming on
Unintended Pregnancy) Research Programme Consortium is
coordinated by the Population Council in partnership with the African
Population and Health Research Center; icddr,b; the London School of
Hygiene and Tropical Medicine; Marie Stopes International; and Partners
in Population and Development. STEP UP is funded by UK aid from the
UK Government.