feeding rates of the jellyfish aurelia aurita on fish larvae
TRANSCRIPT
RESEARCH ARTICLE
Josefin Titelman Æ Lars Johan Hansson
Feeding rates of the jellyfish Aurelia aurita on fish larvae
Received: 5 April 2005 / Accepted: 22 November 2005 / Published online: 17 December 2005� Springer-Verlag 2005
Abstract We quantified feeding rates of field caughtAurelia aurita feeding on yolk sac cod (Gadus morhua)larvae in a series of incubation experiments. A short-time (�1 h) functional response experiment with a widerange of prey concentrations (0.5–16 prey l�1, initialconcentration) revealed that ingestion rates increasedlinearly over this range, such that clearance rates weresimilar between the different prey concentrations. Thissuggests that A. aurita is capable of efficiently utilizingdense prey patches. This indication was furthersupported by a linear increase of prey captured byA. aurita during 2.5 h of feeding at extremely high preyconcentration (>200 prey l�1). Clearance rate indarkness scaled with jellyfish diameter to a power of�1.7 for jellyfish 3.9–9.5 cm in diameter. The jellyfishdid not alter their umbrella pulse frequency in responseto presence of fish larvae. There were no significantdifferences between A. aurita feeding rates in light anddarkness for yolk sac prey ages 0–7 days (at 7.5�C).Although prey vision and escape abilities of fish maydevelop rapidly during early larval ontogeny, thesefactors apparently have little impact on interactionswith predators such as A. aurita during the yolk sacstage.
Introduction
Fish larvae of commercially important species are oftenamong the gut contents of field caught jellyfish (Moller
1980, 1984; Brodeur et al. 2002; Purcell and Arai 2001).Experiments have confirmed that gelatinous zooplank-ton may cause substantial mortality of fish eggs andlarvae (Bailey 1984; Bailey and Batty 1984; Duffy et al.1997). Feeding rates of jellyfish vary with factors such asspecies, size (Fancett and Jenkins 1988; Gamble andHay 1989) and behavior of the predator (Costello andColin 2002) as well as species, size and behavior of theprey (Bailey 1984; Elliott and Leggett 1997; Suchmanand Sullivan 1998). Despite the focus on jellyfish feedingrates on fish larvae both experimentally and in the field(Cowan and Houde 1993; Cowan et al. 1992; Purcell andArai 2001), there are few published relationships ofsimple controlled functional response experiments over awide range of prey concentrations (but see De Lafon-taine and Leggett 1987; Gamble and Hay 1989). Typicalprey concentrations in most published studies are in theorder of 0.01–0.1 l�1 (e.g., Gamble and Hay 1989, re-viewed in Purcell and Arai 2001) with few exceptions(e.g., Bailey and Batty 1983). While such larval fishconcentrations can be obtained from net tows for manypopulations (e.g., Møller 1984; Munk et al. 1999, 2002),densities can locally be even higher (e.g., Munk et al.1986; Taggart and Leggett 1987), especially soon afterspawning when eggs and larvae are distributed inpatches.
The body of literature on jellyfish feeding on cope-pods and other crustacean plankton is relatively large(e.g., Sørnes and Aksnes 2004). While copepods usemainly hydrodynamic cues to assess potential predationrisk (e.g., Titelman 2001), fish larvae also use vision toassess their surroundings (e.g., Blaxter 1968, 1986).Therefore, jellyfish predation rates on fish larvae mightvary with the amount of available light. Here we useyolk sac cod (Gadus morhua) larvae as our model fishprey, Aurelia aurita as a predator to experimentallydetermine feeding rates over a wide prey concentration(0.5–16 l�1) as a function of predator size, prey con-centration, prey age and light. We discuss our data inrelation to published feeding rates of jellyfish on fishlarvae and zooplankton.
Communicated by M. Kuhl, Helsingør
J. Titelman (&)Department of Biology, University of Bergen,PO BOX 7800, 5020 Bergen, NorwayE-mail: [email protected].: +47-55-584545
L. J. HanssonDanish Institute for Fisheries Research,Kavalergarden 6, 2920 Charlottenlund, Denmark
Marine Biology (2006) 149: 297–306DOI 10.1007/s00227-005-0200-5
Methods
Experimental animals
All animal maintenance was carried out at 7–8�C, undera 14–10 h light–dark regime in 1 lm filtered seawater.The cod larvae were raised from fertilized eggs (Sa-gaFjord Sea Farm AS, Stord, Norway). The eggs wereincubated in 1 lm filtered seawater in 75 l containerswith a water renewal rate of �100–200 ml min�1, andkept in suspension by gentle aeration. Upon hatchingthe larvae were transferred to clean 1 lm filtered sea-water and kept in gently aerated 100 l containers with-out food. Approximately 10 l of the water wasexchanged daily, and dead eggs or larvae were removed.For each experiment the total length of a sub-sample offish larvae was measured under a dissecting microscopeor by digital image analysis.
The jellyfish A. aurita were collected with buckets inVagsbypollen, a semi-enclosed bay of Raunefjorden,Bergen, Norway. In the laboratory the jellyfish weretransferred to 1 lm filtered seawater, and allowed toacclimatize to the experimental temperature andsalinity conditions (8�C, 34 psu) for ‡6 h. All jellyfishused were visually undamaged, healthy looking andactively pulsing individuals caught within 24 h prior toexperiments. At the end of the experiments the size ofeach jellyfish was measured as the distance betweenopposite rophalia.
Feeding experiments
All feeding experiments were carried out with individualjellyfish. All experiments were conducted following thesame general protocol. Details pertaining only to specificexperiments are dealt with in their respective section.Individual laboratory acclimatized jellyfish were placedin 25 l of 1 lm filtered seawater. Fish larvae were sortedout individually by scooping them gently into 2 l buck-ets. The experiments were started by adding the fish tothe jellyfish containers, mixing carefully, and adjustingthe total volume to 27 l. From visual inspection it ap-peared that this created a homogeneous prey distribu-tion in the incubation containers at start of theexperiments. After �1 h of incubation, the experimentswere terminated by removing the jellyfish. Remainingfish larvae were counted live in contrast-favorable plasticscoops without applying any prior filtration. A series ofinitial trials without jellyfish asserted that all addedlarvae were re-found using this method.
Individual clearance rates (F, l ind�1 h�1) were
calculated as F ¼ Vt � ln Cstart
Cend
� �; where V is the con-
tainer volume (l), t the incubation time (h) and Cstart
and Cend are prey concentrations (l�1) at the beginningand the end of the incubation, respectively. Aver-age prey concentrations (Cav) during the incubations
were calculated from initial and final prey concentra-tions as Cav ¼ Cstart�Cend
lnCendCstart
� � : Finally, ingestion rates (I, prey
ind�1 h�1) were calculated as I ¼ F � Cav:
Several experiments with other gelatinous zooplank-ton (i.e., ctenophores) have revealed that killing ratesoften exceed actual feeding rates (Reeve and Walter1978; Kremer 1979; Sørnes and Aksnes 2004). We didnot discriminate between live and dead fish larvae whenterminating our experiments. Hence, the feeding ratesobtained here are conservative estimates of killing ratesin A. aurita. However, no boluses were observed sug-gesting that prey were not regurgitated by the jellyfish inour experiments.
Functional response
We conducted an initial functional response experimentwith similarly sized jellyfish (mean ± SD 6.8±0.54 cm)to ensure that subsequent experiments were carried outin the linear part of this curve. The experimental setupwas three replicates with an initial target prey concen-tration of 0.5, 1, 2, 4, 8 and 16 fish l�1. These incuba-tions were carried out in darkness as described above.All incubations were carried out in parallel.
Feeding at assumed ad libitum concentrations
To examine the potential feeding rates at very high foodconcentrations and to ensure that prey capture rate wasconstant over the incubation times used in the experi-ments, about 20 jellyfish (7.4±0.51 cm) were placed in a150 l container with fish larvae at extreme concentra-tions (>200 l�1). Every 10–15 min a jellyfish was gentlyscooped out and all its ingested and captured fish larvaewere enumerated under a dissecting microscope.
Feeding as a function of jellyfish size
An incubation series was carried out to determineclearance rate as a function of size for the size range ofjellyfish (3.9–13.3 cm) that we were able to obtain bybucket sampling. The jellyfish were incubated in dark-ness at a prey concentration of two fish larvae l�1 asdescribed above. The incubation series was conductedduring 2 days using fish larvae of slightly different size(4.7±0.32 and 3.5±0.71 mm in experiments A and B,respectively).
Effects of light and prey size on feeding rates
To examine if fish larvae use their vision in escaping thejellyfish, a series of incubations in light (36 W halogentube, indirect general lighting) and complete darknesswere conducted. The setup was normally five replicates
298
for each light treatment. Because the vision (Blaxter1968) and behavior (Bailey 1984; Bailey and Batty 1983,1984) of fish larvae develops during the early ontogenythe experiment was repeated for several age groups offish; 1, 3, 5 and 7 days after hatching at 7.5�C. Initialprey concentration was always 4 l�1, and all prey orig-inated from the same egg batch. As much as possible wetried to use predators of about 7 cm size (but see Fig. 4for exact sizes). The experiments were carried out asdescribed above. A two-factor ANOVA was used to testfor differences in clearance rate, with light conditionsand prey age as factors.
Aurelia behavior
Because encounter rates depend strongly on predatorbehavior we tested if the jellyfish altered their behaviorin the presence of fish larvae. Bell pulse rate frequencieswere measured on jellyfish of various sizes (4.3–12.0 cm)in 27 l of 1 lm filtered seawater with or without fishlarvae (3 l�1) in light. Swimming pulses were counted
over 1 min, and measurements were repeated four timeswith 10 min intervals for each individual. These obser-vations were made in light.
Results
Feeding rates
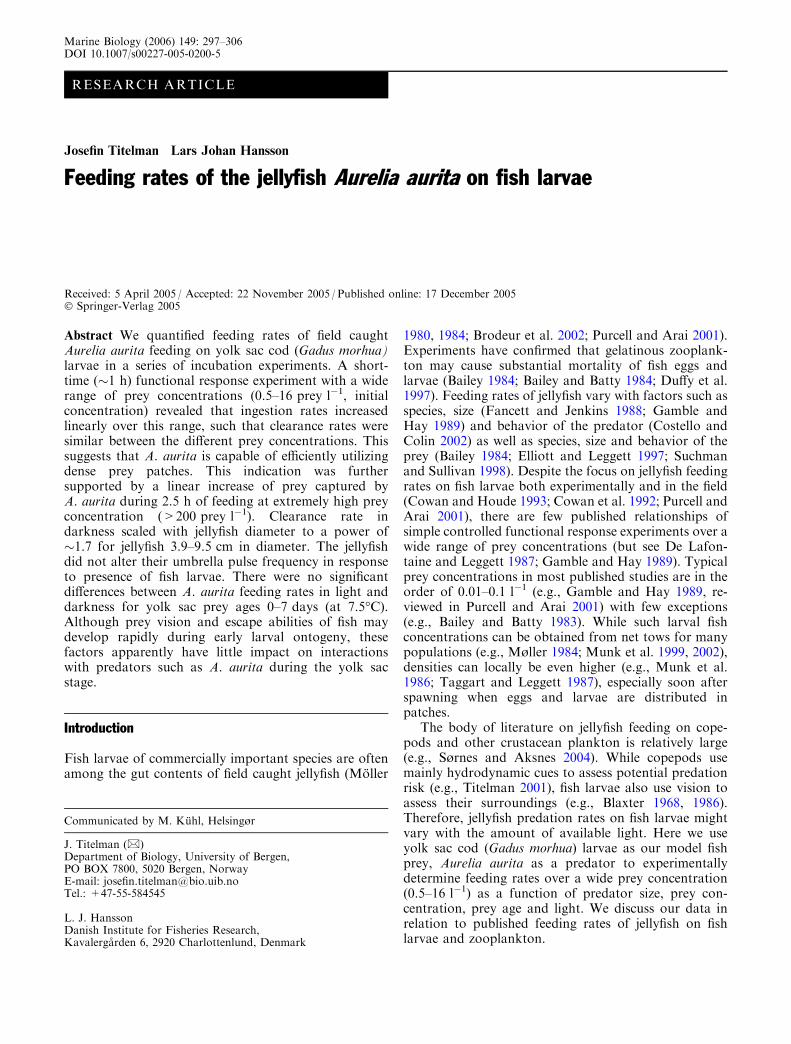
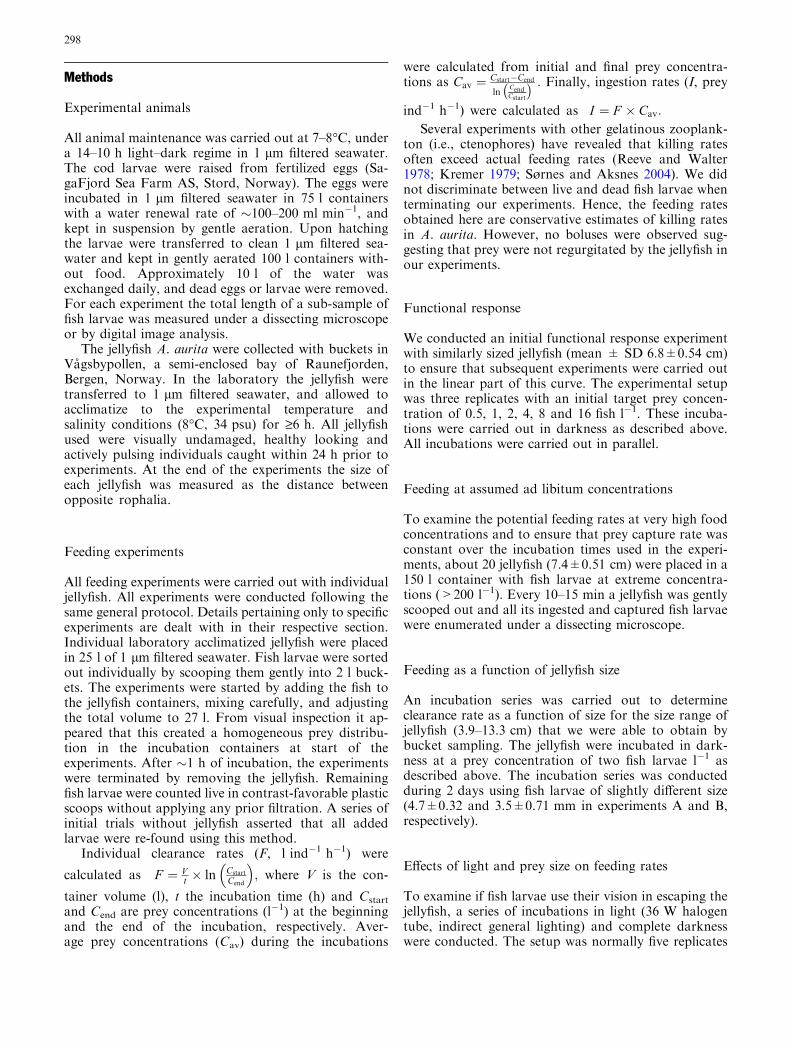
Ingestion rates increased linearly with concentration offish larvae for the entire range of prey concentrationsused in the functional response experiment (Fig. 1a).Clearance rates did not statistically differ between preyconcentrations (Fig. 1b). Average A. aurita clearancerate in the functional response experiment was9.7 l ind�1 h�1 (Fig. 1). In accordance with the func-tional response experiment, cumulative ingestion in-creased linearly with time even when jellyfish wereexposed to an extreme prey abundance (>200 l�1,Fig. 2). The slope of this line (Fig. 2) implies an inges-tion rate of �110 prey ind�1 h�1, which is similar tothat observed at the highest prey concentration in the
Average prey concentration (prey l-1)
0 2 4 6 8 10 12 14 16
Cle
aran
ce r
ate
(l in
d.-1
h-1
)
0
5
10
15
20
25
A
0 2 4 6 8 10 12 14 16
Inge
stio
n ra
te (
prey
ind.
-1 h
-1)
0
50
100
150
B
Fig. 1 Aurelia aurita feeding oncod larvae. Data points aremean values of three replicates.Error bars are SD. The sizes ofthe jellyfish and fish larvae were6.8±0.05 cm and4.7±0.33 mm, respectively. aIngestion rates as a function ofaverage prey concentration.Average prey concentrationswere calculated from preyconcentrations at the beginningand end of the experiment. Theregression is y=4.74+6.61x,R2=0.92. b Clearance rate as afunction of average preyconcentration during theincubations. An ANOVA onraw data (n=18) suggested nosignificant change in clearancerate with prey concentration(F=1.823, P=0.196)
299
functional response experiment, suggesting that thislevel may represent maximum ingestion rates for thesesizes of jellyfish. After �2.5 h at such high food con-centration the medusae had ingested 300 prey, whichillustrates the high food processing capacity in A. aurita.This corresponds to feeding for �3 h at the maximumingestion rate of 105 prey h�1 observed at the highestprey concentration in the functional response experi-ment (Fig. 1a). Thus, feeding rates would not have sat-urated at the prey concentrations used in the functionalresponse experiment, but could have been maintainedfor longer exposure times.
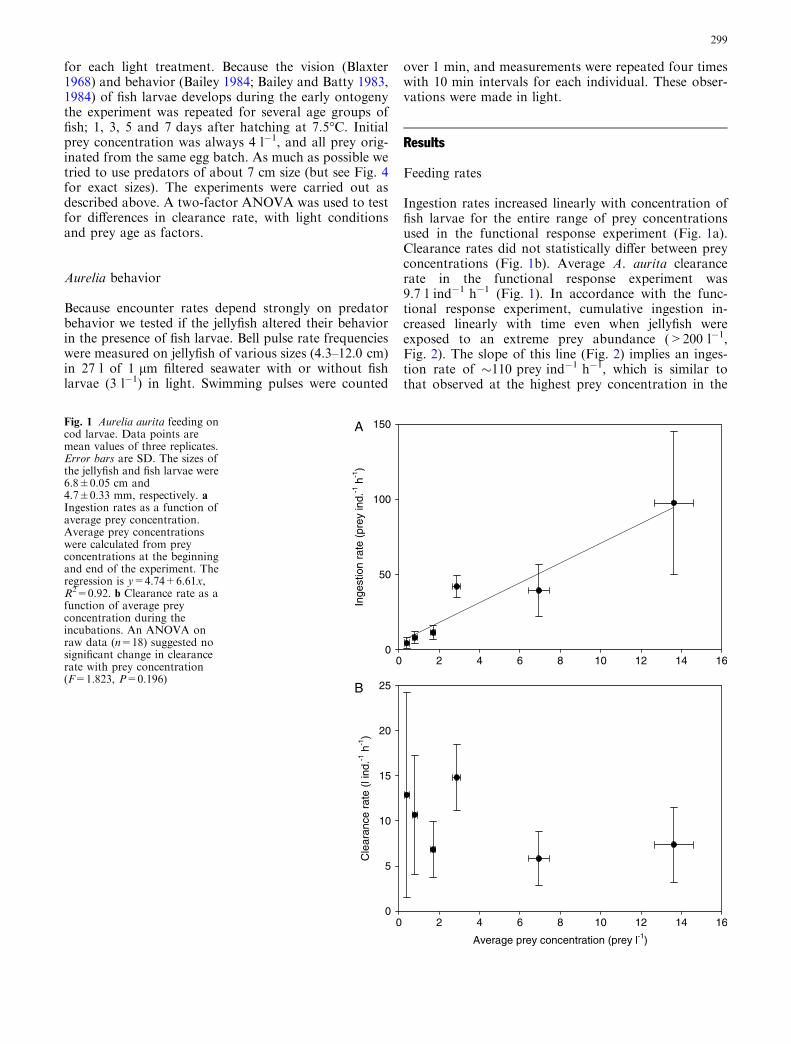
Clearance rates in darkness increased with jellyfishsize to a power of 1.40±0.32 in the first experiment and1.44±0.36 in the second experiment (Fig. 3a). A test forhomogeneity of slopes of linear regressions on log–logtransformed data revealed no significant interactions ordifferences, and thus ensured that the data could bepooled. The total pooled data set yielded a scaling of1.29±0.23 (Fig. 3a). Plotting the diameter of A. auritaversus the residuals from the overall analysis revealedthat residuals increased with size, and that the fractionof negative residuals also increased with size suggestingsome non-random effect on the larger A. aurita(Fig. 3b). Because the variation increased for jellyfishlarger than �10 cm (Fig. 3), we also analyzed thesmaller jellyfish separately by pooling the data from thetwo experiments. For jellyfish <9.5 cm the observedpower was 1.70±0.37 (Fig. 3a).
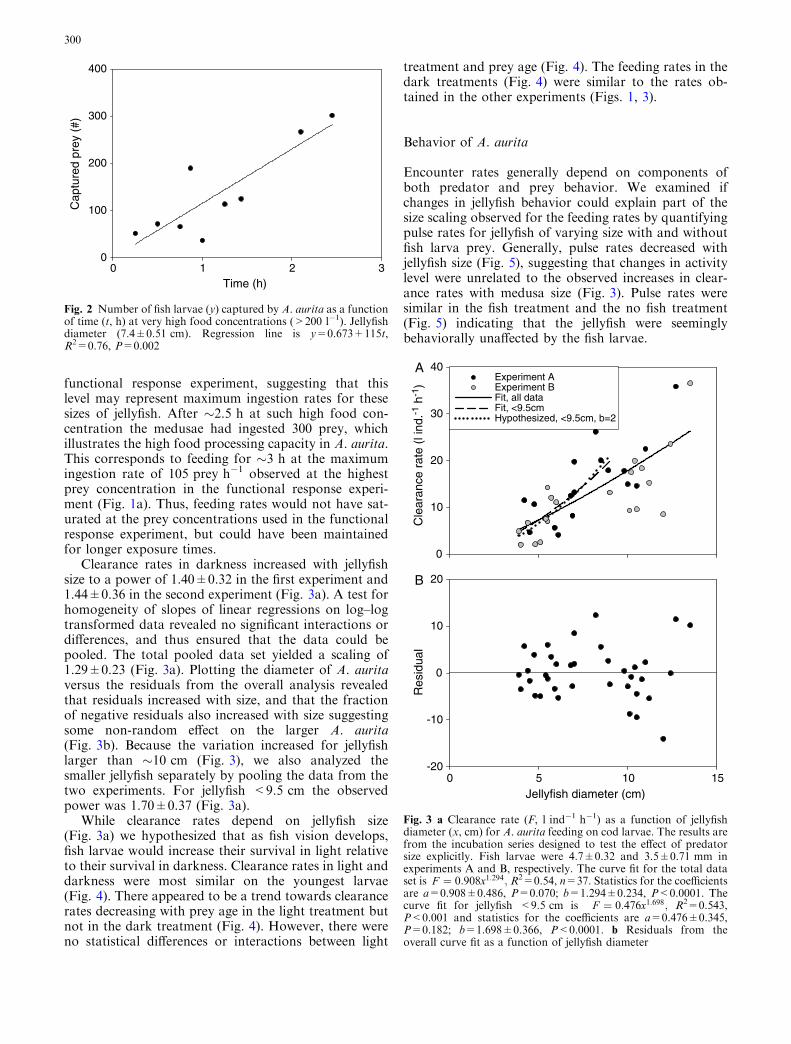
While clearance rates depend on jellyfish size(Fig. 3a) we hypothesized that as fish vision develops,fish larvae would increase their survival in light relativeto their survival in darkness. Clearance rates in light anddarkness were most similar on the youngest larvae(Fig. 4). There appeared to be a trend towards clearancerates decreasing with prey age in the light treatment butnot in the dark treatment (Fig. 4). However, there wereno statistical differences or interactions between light
treatment and prey age (Fig. 4). The feeding rates in thedark treatments (Fig. 4) were similar to the rates ob-tained in the other experiments (Figs. 1, 3).
Behavior of A. aurita
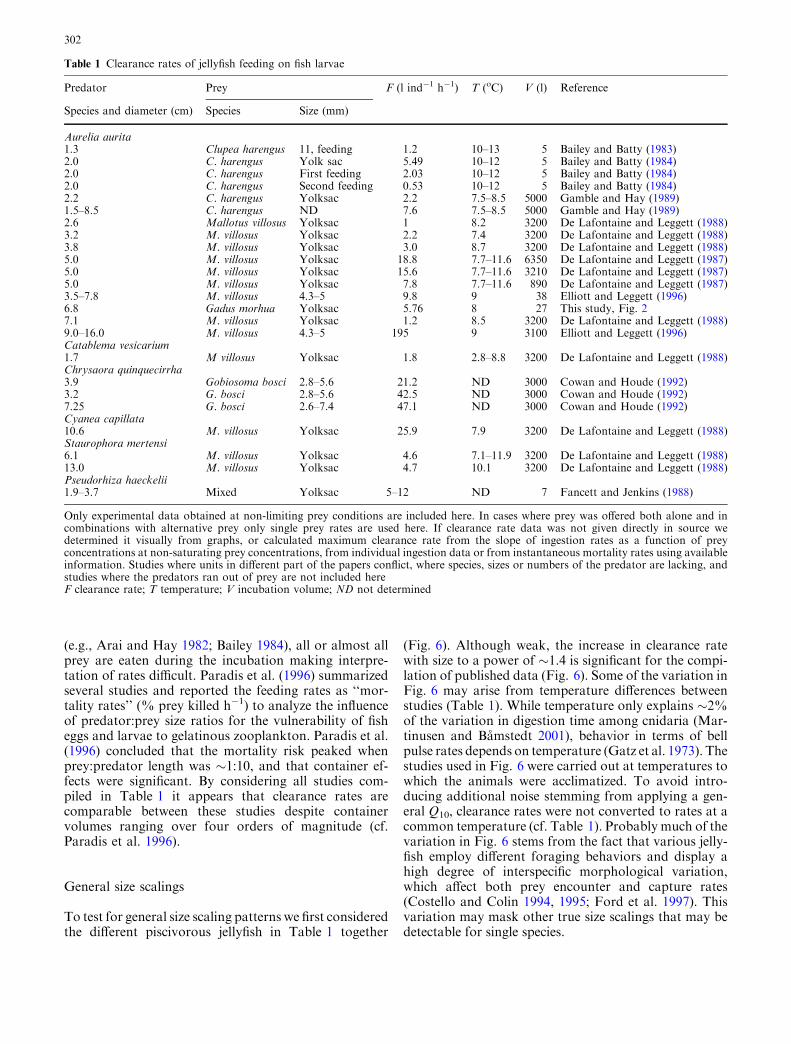
Encounter rates generally depend on components ofboth predator and prey behavior. We examined ifchanges in jellyfish behavior could explain part of thesize scaling observed for the feeding rates by quantifyingpulse rates for jellyfish of varying size with and withoutfish larva prey. Generally, pulse rates decreased withjellyfish size (Fig. 5), suggesting that changes in activitylevel were unrelated to the observed increases in clear-ance rates with medusa size (Fig. 3). Pulse rates weresimilar in the fish treatment and the no fish treatment(Fig. 5) indicating that the jellyfish were seeminglybehaviorally unaffected by the fish larvae.
Time (h)0 1 2 3
Cap
ture
d pr
ey (
#)
0
100
200
300
400
Fig. 2 Number of fish larvae (y) captured by A. aurita as a functionof time (t, h) at very high food concentrations (>200 l�1). Jellyfishdiameter (7.4±0.51 cm). Regression line is y=0.673+115t,R2=0.76, P=0.002
B
Jellyfish diameter (cm)0 5 10 15
Res
idua
l
-20
-10
0
10
20
A
Cle
aran
ce r
ate
(l in
d.-1
h-1
)
0
10
20
30
40Experiment AExperiment BFit, all dataFit, <9.5cmHypothesized, <9.5cm, b=2
Fig. 3 a Clearance rate (F, l ind�1 h�1) as a function of jellyfishdiameter (x, cm) for A. aurita feeding on cod larvae. The results arefrom the incubation series designed to test the effect of predatorsize explicitly. Fish larvae were 4.7±0.32 and 3.5±0.71 mm inexperiments A and B, respectively. The curve fit for the total dataset is F ¼ 0:908x1:294; R2=0.54, n=37. Statistics for the coefficientsare a=0.908±0.486, P=0.070; b=1.294±0.234, P<0.0001. Thecurve fit for jellyfish <9.5 cm is F ¼ 0:476x1:698; R2=0.543,P<0.001 and statistics for the coefficients are a=0.476±0.345,P=0.182; b=1.698±0.366, P<0.0001. b Residuals from theoverall curve fit as a function of jellyfish diameter
300
Discussion
Predation rates
Gelatinous coelenterate plankton are often characterizedas voracious predators with high killing efficiency at veryhigh prey concentrations (Sørnes and Aksnes 2004).
A. aurita did not saturate its feeding response at the preyconcentrations offered in the functional responseexperiment (i.e., 0.5–16 larvae l�1, Fig. 1). The ability ofsome scyphozoan jellyfish to feed at maximum rate invery high prey concentrations (cf. Fig. 2) implies thatthese jellyfish can efficiently exploit dense prey patches,at least for short time periods. The mechanistic basis forpatterns of predatory interactions involves a cocktail offactors such as predator size and behavior, as well asprey size and behavior. These different components af-fect encounter rates, capture or escape success, ingestionrates, hydrodynamics, physiological demands and costs.The interactions between these factors are complex be-cause behavioral patterns and fluid dynamics are oftenalso related to size within a species (Mc Henry and Jed2003).
To compare our observations with other experimen-tally obtained rates we reviewed the literature onexperimentally determined feeding or mortality ratesand converted them to clearance rates (Table 1). Clear-ance rate is a suitable currency for comparison asclearance rates are by definition independent of con-tainer volumes and prey concentration given that preydo not run out during the incubation, and that experi-ments are conducted at non-saturating prey concentra-tions. Purcell and Arai (2001) also reviewed feeding ratesreported as either ingestion rates or clearance rates onlarval fish and fish eggs. Purcell and Arai (2001) foundthat eggs were generally more vulnerable than larvae,and that there was a positive selection for fish eggs andlarvae over other prey in all cases where that had beenexamined. In some of the studies compiled in the reviewsby Purcell and Arai (2001) and Paradis et al. (1996)
Jellyfish diameter (cm)0 5 10 15
Bel
l pul
se fr
eque
ncy
(pul
ses
min
-1)
15
20
25
30
35
40
without fish larvaewith fish larvae
Fig. 5 Umbrella pulse rate (y, min�1) of A. aurita in absence andpresence of cod larvae. Each dot represents one individual. Theerror bars are SD of four measurements for that individual. AnANCOVA with light regime as a factor and size as a covariaterevealed that pulse rates depended on size (x, cm) (P<0.00001)while there were no significant differences between light and dark(P=0.181). The overall regression line for the entire data set isy=40.8�1.37x, R2=0.39
Prey age (days at 8°C)0 1 2 3 4 5 6 7 8
Rel
ativ
e cl
eara
nce
rate
, Flig
ht /
(Mea
n F
dark
)
0.0
0.5
1.0
1.5
2.0
Flight = Fdark = 1
Flight < Fdark
Flight > Fdark
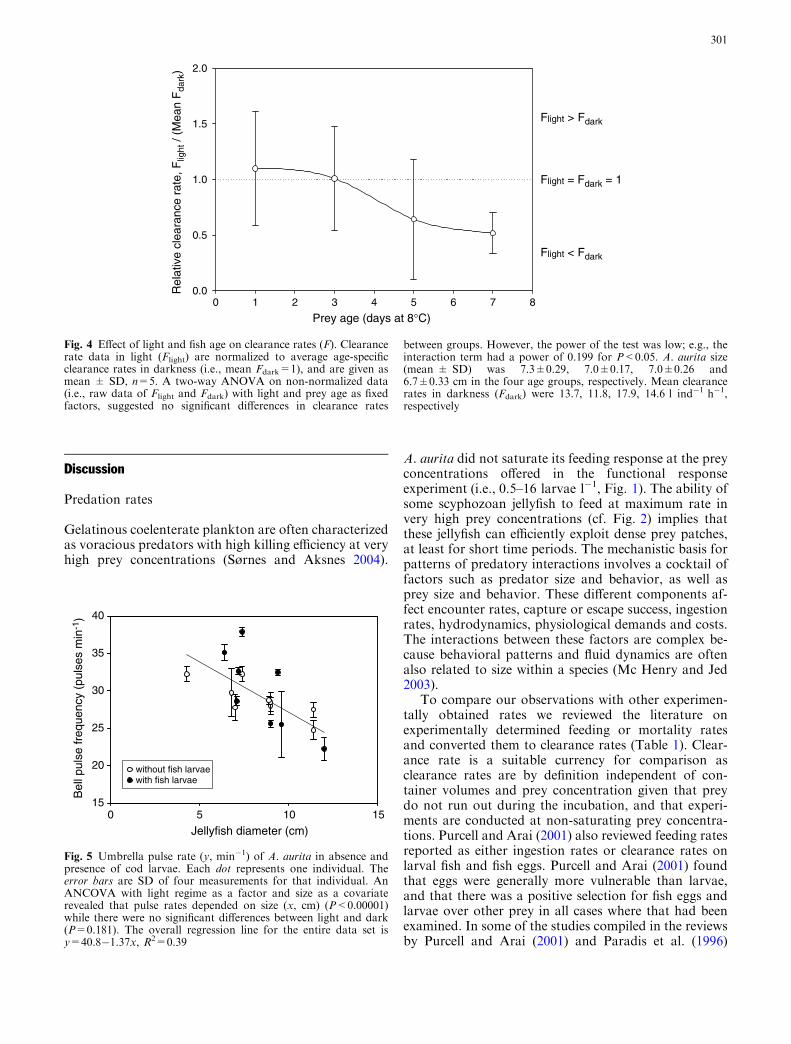
Fig. 4 Effect of light and fish age on clearance rates (F). Clearancerate data in light (Flight) are normalized to average age-specificclearance rates in darkness (i.e., mean Fdark=1), and are given asmean ± SD, n=5. A two-way ANOVA on non-normalized data(i.e., raw data of Flight and Fdark) with light and prey age as fixedfactors, suggested no significant differences in clearance rates
between groups. However, the power of the test was low; e.g., theinteraction term had a power of 0.199 for P<0.05. A. aurita size(mean ± SD) was 7.3±0.29, 7.0±0.17, 7.0±0.26 and6.7±0.33 cm in the four age groups, respectively. Mean clearancerates in darkness (Fdark) were 13.7, 11.8, 17.9, 14.6 l ind�1 h�1,respectively
301
(e.g., Arai and Hay 1982; Bailey 1984), all or almost allprey are eaten during the incubation making interpre-tation of rates difficult. Paradis et al. (1996) summarizedseveral studies and reported the feeding rates as ‘‘mor-tality rates’’ (% prey killed h�1) to analyze the influenceof predator:prey size ratios for the vulnerability of fisheggs and larvae to gelatinous zooplankton. Paradis et al.(1996) concluded that the mortality risk peaked whenprey:predator length was �1:10, and that container ef-fects were significant. By considering all studies com-piled in Table 1 it appears that clearance rates arecomparable between these studies despite containervolumes ranging over four orders of magnitude (cf.Paradis et al. 1996).
General size scalings
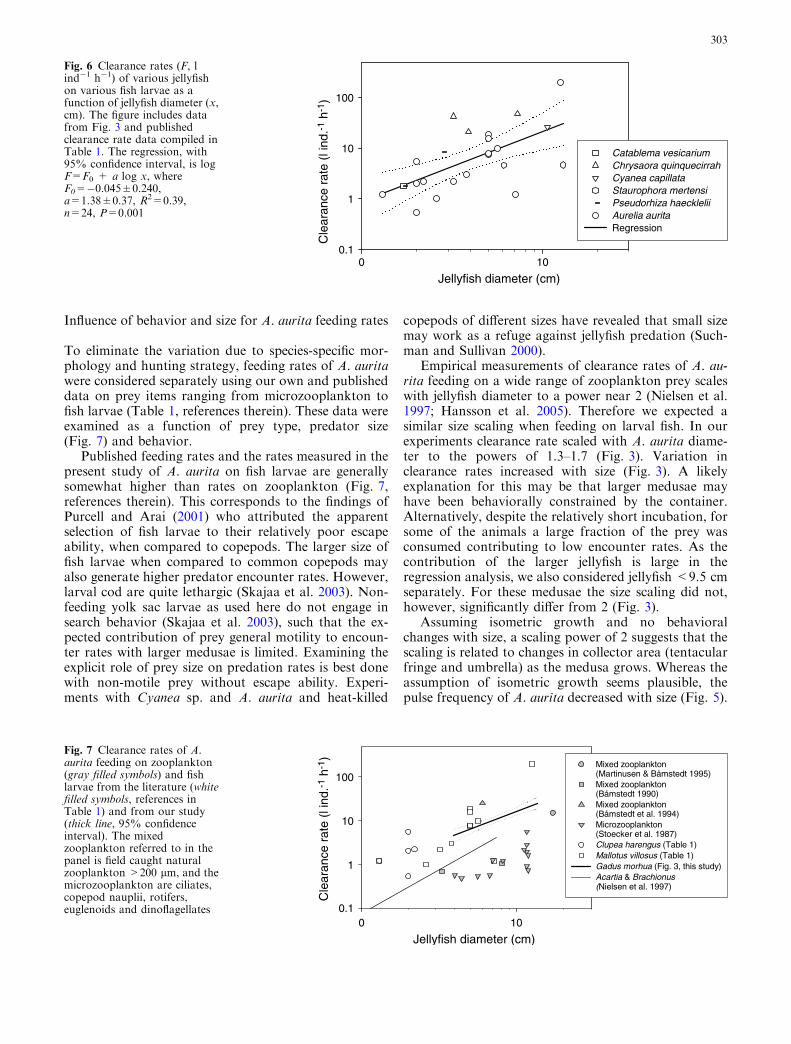
To test for general size scaling patterns we first consideredthe different piscivorous jellyfish in Table 1 together
(Fig. 6). Although weak, the increase in clearance ratewith size to a power of �1.4 is significant for the compi-lation of published data (Fig. 6). Some of the variation inFig. 6 may arise from temperature differences betweenstudies (Table 1). While temperature only explains �2%of the variation in digestion time among cnidaria (Mar-tinusen and Bamstedt 2001), behavior in terms of bellpulse rates depends on temperature (Gatz et al. 1973). Thestudies used in Fig. 6 were carried out at temperatures towhich the animals were acclimatized. To avoid intro-ducing additional noise stemming from applying a gen-eral Q10, clearance rates were not converted to rates at acommon temperature (cf. Table 1). Probably much of thevariation in Fig. 6 stems from the fact that various jelly-fish employ different foraging behaviors and display ahigh degree of interspecific morphological variation,which affect both prey encounter and capture rates(Costello and Colin 1994, 1995; Ford et al. 1997). Thisvariation may mask other true size scalings that may bedetectable for single species.
Table 1 Clearance rates of jellyfish feeding on fish larvae
Predator Prey F (l ind�1 h�1) T (oC) V (l) Reference
Species and diameter (cm) Species Size (mm)
Aurelia aurita1.3 Clupea harengus 11, feeding 1.2 10–13 5 Bailey and Batty (1983)2.0 C. harengus Yolk sac 5.49 10–12 5 Bailey and Batty (1984)2.0 C. harengus First feeding 2.03 10–12 5 Bailey and Batty (1984)2.0 C. harengus Second feeding 0.53 10–12 5 Bailey and Batty (1984)2.2 C. harengus Yolksac 2.2 7.5–8.5 5000 Gamble and Hay (1989)1.5–8.5 C. harengus ND 7.6 7.5–8.5 5000 Gamble and Hay (1989)2.6 Mallotus villosus Yolksac 1 8.2 3200 De Lafontaine and Leggett (1988)3.2 M. villosus Yolksac 2.2 7.4 3200 De Lafontaine and Leggett (1988)3.8 M. villosus Yolksac 3.0 8.7 3200 De Lafontaine and Leggett (1988)5.0 M. villosus Yolksac 18.8 7.7–11.6 6350 De Lafontaine and Leggett (1987)5.0 M. villosus Yolksac 15.6 7.7–11.6 3210 De Lafontaine and Leggett (1987)5.0 M. villosus Yolksac 7.8 7.7–11.6 890 De Lafontaine and Leggett (1987)3.5–7.8 M. villosus 4.3–5 9.8 9 38 Elliott and Leggett (1996)6.8 Gadus morhua Yolksac 5.76 8 27 This study, Fig. 27.1 M. villosus Yolksac 1.2 8.5 3200 De Lafontaine and Leggett (1988)9.0–16.0 M. villosus 4.3–5 195 9 3100 Elliott and Leggett (1996)Catablema vesicarium1.7 M villosus Yolksac 1.8 2.8–8.8 3200 De Lafontaine and Leggett (1988)Chrysaora quinquecirrha3.9 Gobiosoma bosci 2.8–5.6 21.2 ND 3000 Cowan and Houde (1992)3.2 G. bosci 2.8–5.6 42.5 ND 3000 Cowan and Houde (1992)7.25 G. bosci 2.6–7.4 47.1 ND 3000 Cowan and Houde (1992)Cyanea capillata10.6 M. villosus Yolksac 25.9 7.9 3200 De Lafontaine and Leggett (1988)Staurophora mertensi6.1 M. villosus Yolksac 4.6 7.1–11.9 3200 De Lafontaine and Leggett (1988)13.0 M. villosus Yolksac 4.7 10.1 3200 De Lafontaine and Leggett (1988)Pseudorhiza haeckelii1.9–3.7 Mixed Yolksac 5–12 ND 7 Fancett and Jenkins (1988)
Only experimental data obtained at non-limiting prey conditions are included here. In cases where prey was offered both alone and incombinations with alternative prey only single prey rates are used here. If clearance rate data was not given directly in source wedetermined it visually from graphs, or calculated maximum clearance rate from the slope of ingestion rates as a function of preyconcentrations at non-saturating prey concentrations, from individual ingestion data or from instantaneous mortality rates using availableinformation. Studies where units in different part of the papers conflict, where species, sizes or numbers of the predator are lacking, andstudies where the predators ran out of prey are not included hereF clearance rate; T temperature; V incubation volume; ND not determined
302
Influence of behavior and size for A. aurita feeding rates
To eliminate the variation due to species-specific mor-phology and hunting strategy, feeding rates of A. auritawere considered separately using our own and publisheddata on prey items ranging from microzooplankton tofish larvae (Table 1, references therein). These data wereexamined as a function of prey type, predator size(Fig. 7) and behavior.
Published feeding rates and the rates measured in thepresent study of A. aurita on fish larvae are generallysomewhat higher than rates on zooplankton (Fig. 7,references therein). This corresponds to the findings ofPurcell and Arai (2001) who attributed the apparentselection of fish larvae to their relatively poor escapeability, when compared to copepods. The larger size offish larvae when compared to common copepods mayalso generate higher predator encounter rates. However,larval cod are quite lethargic (Skajaa et al. 2003). Non-feeding yolk sac larvae as used here do not engage insearch behavior (Skajaa et al. 2003), such that the ex-pected contribution of prey general motility to encoun-ter rates with larger medusae is limited. Examining theexplicit role of prey size on predation rates is best donewith non-motile prey without escape ability. Experi-ments with Cyanea sp. and A. aurita and heat-killed
copepods of different sizes have revealed that small sizemay work as a refuge against jellyfish predation (Such-man and Sullivan 2000).
Empirical measurements of clearance rates of A. au-rita feeding on a wide range of zooplankton prey scaleswith jellyfish diameter to a power near 2 (Nielsen et al.1997; Hansson et al. 2005). Therefore we expected asimilar size scaling when feeding on larval fish. In ourexperiments clearance rate scaled with A. aurita diame-ter to the powers of 1.3–1.7 (Fig. 3). Variation inclearance rates increased with size (Fig. 3). A likelyexplanation for this may be that larger medusae mayhave been behaviorally constrained by the container.Alternatively, despite the relatively short incubation, forsome of the animals a large fraction of the prey wasconsumed contributing to low encounter rates. As thecontribution of the larger jellyfish is large in theregression analysis, we also considered jellyfish <9.5 cmseparately. For these medusae the size scaling did not,however, significantly differ from 2 (Fig. 3).
Assuming isometric growth and no behavioralchanges with size, a scaling power of 2 suggests that thescaling is related to changes in collector area (tentacularfringe and umbrella) as the medusa grows. Whereas theassumption of isometric growth seems plausible, thepulse frequency of A. aurita decreased with size (Fig. 5).
Jellyfish diameter (cm)0 10
Cle
aran
ce r
ate
(l in
d.-1
h-1
)
0.1
1
10
100
Catablema vesicariumChrysaora quinquecirrahCyanea capillataStaurophora mertensiPseudorhiza haeckleliiAurelia auritaRegression
Fig. 6 Clearance rates (F, lind�1 h�1) of various jellyfishon various fish larvae as afunction of jellyfish diameter (x,cm). The figure includes datafrom Fig. 3 and publishedclearance rate data compiled inTable 1. The regression, with95% confidence interval, is logF=F0 + a log x, whereF0=�0.045±0.240,a=1.38±0.37, R2=0.39,n=24, P=0.001
Mixed zooplankton(Martinusen & Båmstedt 1995)Mixed zooplankton(Båmstedt 1990)Mixed zooplankton(Båmstedt et al. 1994)Microzooplankton(Stoecker et al. 1987)Clupea harengus (Table 1)Mallotus villosus (Table 1)Gadus morhua (Fig. 3, this study)Acartia & Brachionus(Nielsen et al. 1997)
Jellyfish diameter (cm)0 10
Cle
aran
ce r
ate
(l in
d.-1
h-1
)
0.1
10
1
100
Fig. 7 Clearance rates of A.aurita feeding on zooplankton(gray filled symbols) and fishlarvae from the literature (whitefilled symbols, references inTable 1) and from our study(thick line, 95% confidenceinterval). The mixedzooplankton referred to in thepanel is field caught naturalzooplankton >200 lm, and themicrozooplankton are ciliates,copepod nauplii, rotifers,euglenoids and dinoflagellates
303
For medusae of a given size a decreasing pulse rateimplies a decreasing encounter volume rate. This is,however, not necessarily the case for ontogenetic de-creases in pulse rates that are accompanied by increasinganimal size (cf. Mc Henry and Jed 2003). Although pulsefrequency decreases with size in A. aurita (e.g., Fig. 5)larger jellyfish move faster than smaller ones because ofinteractions with ontogenetic changes in body shape,which affect hydrodynamics when swimming (Mc Henryand Jed 2003). The amount of water influenced by eachpulse also increases with jellyfish size (Dabiri et al. 2005).This means that decreasing pulse frequency with sizedoes not necessarily translate to a decreased encountervolume rate. Because the flow fields around cruisingmedusae are complicated (Dabiri et al. 2005) and varywith both species and ontogeny it is difficult to modelthe interactions between size and behavior realistically(Colin and Costello 2002; Mc Henry and Jed 2003).
Predator size also affects capture efficiency. Forexample, the capture success of 0.6–2.1 cm diameter A.aurita on feeding stage herring larvae increases withjellyfish radius (Bailey and Batty 1983). In turn, the sizescaling depends on larval behavior, which is both speciesand age related (Bailey and Batty 1984). Generally,feeding stage larvae have more developed motility andescape behavior than yolk sac larvae (Bailey 1984; Baileyand Batty 1983, 1984; Purcell et al. 1987). For relativelyslack escapers such as cod, high predator efficiency isreached at a lower predator size than for the more avidherring larvae (Bailey and Batty 1984). This implies thatthe high variation in feeding rates for the larger A. auritaobserved in our experiments cannot be explained by preybehavior.
Influence of light
Light generally does not affect medusa behavior, mea-sured as pulse frequency, much (Mackie et al. 1981;Horstman 1934; Horridge 1956). Pulse rates of 18–25 cm A. aurita are 20.9 and 18.8 min�1 in light anddarkness, respectively (Mackie et al. 1981) suggestingthat the predator components of feeding rates also aresimilar in light and darkness. In accordance, gelatinouszooplankton feed efficiently on crustacean zooplanktonregardless of light conditions (Fancett and Jenkins 1988;Sørnes and Aksnes 2004), and jellyfish may thereforeout-compete fish in waters with optical properties thatinterfere with visual hunting (Eiane et al. 1999; Aksneset al. 2004). Light may also govern the direct interac-tions between jellyfish and larval fish prey by affectingthe ability of the prey to see the predator. Fish larvae areexposed to many different predators and use a mix ofsensory modes to assess predation risk (e.g., Fuiman andCowan 2003). These sensory abilities generally improvewith age and size (e.g., Blaxter 1968; Higgs and Fuiman1996, 1998). Visual cues are important for fish larvaewhen determining whether to respond to a potentialpredator by flight or not (Blaxter and Fuiman 1990).
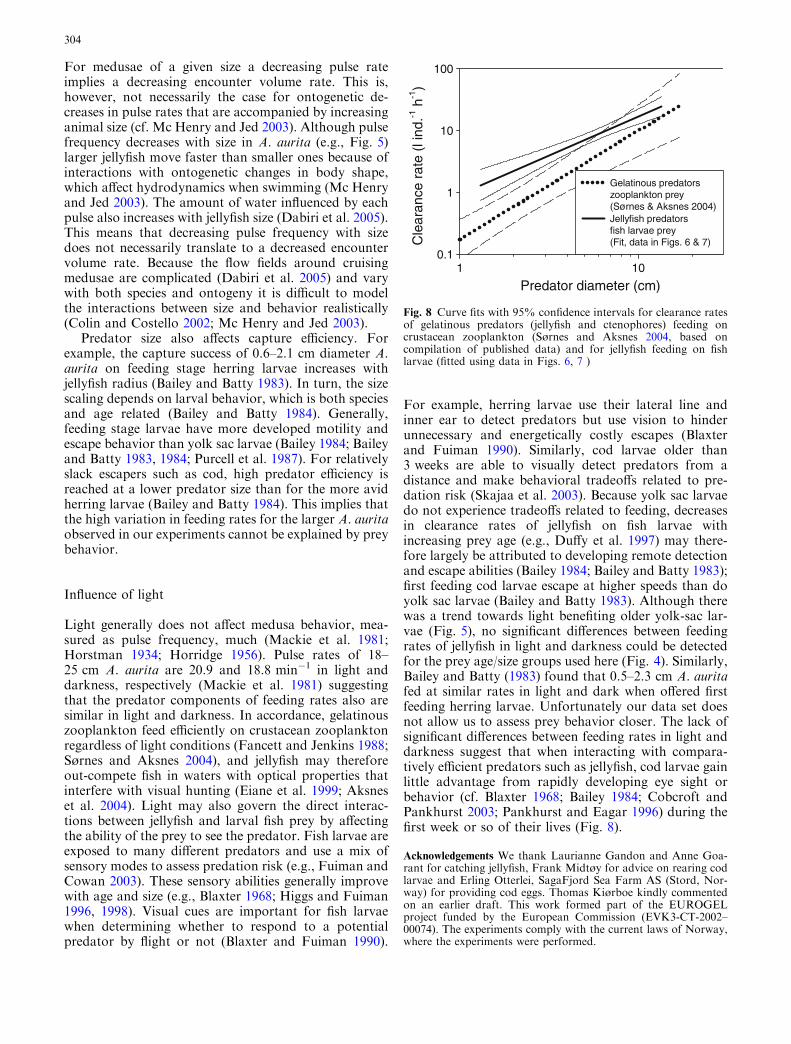
For example, herring larvae use their lateral line andinner ear to detect predators but use vision to hinderunnecessary and energetically costly escapes (Blaxterand Fuiman 1990). Similarly, cod larvae older than3 weeks are able to visually detect predators from adistance and make behavioral tradeoffs related to pre-dation risk (Skajaa et al. 2003). Because yolk sac larvaedo not experience tradeoffs related to feeding, decreasesin clearance rates of jellyfish on fish larvae withincreasing prey age (e.g., Duffy et al. 1997) may there-fore largely be attributed to developing remote detectionand escape abilities (Bailey 1984; Bailey and Batty 1983);first feeding cod larvae escape at higher speeds than doyolk sac larvae (Bailey and Batty 1983). Although therewas a trend towards light benefiting older yolk-sac lar-vae (Fig. 5), no significant differences between feedingrates of jellyfish in light and darkness could be detectedfor the prey age/size groups used here (Fig. 4). Similarly,Bailey and Batty (1983) found that 0.5–2.3 cm A. auritafed at similar rates in light and dark when offered firstfeeding herring larvae. Unfortunately our data set doesnot allow us to assess prey behavior closer. The lack ofsignificant differences between feeding rates in light anddarkness suggest that when interacting with compara-tively efficient predators such as jellyfish, cod larvae gainlittle advantage from rapidly developing eye sight orbehavior (cf. Blaxter 1968; Bailey 1984; Cobcroft andPankhurst 2003; Pankhurst and Eagar 1996) during thefirst week or so of their lives (Fig. 8).
Acknowledgements We thank Laurianne Gandon and Anne Goa-rant for catching jellyfish, Frank Midtøy for advice on rearing codlarvae and Erling Otterlei, SagaFjord Sea Farm AS (Stord, Nor-way) for providing cod eggs. Thomas Kiørboe kindly commentedon an earlier draft. This work formed part of the EUROGELproject funded by the European Commission (EVK3-CT-2002–00074). The experiments comply with the current laws of Norway,where the experiments were performed.
Predator diameter (cm)101
Cle
aran
ce r
ate
(l in
d.-1
h-1
)
0.1
1
10
100
Gelatinous predatorszooplankton prey(Sørnes & Aksnes 2004)Jellyfish predatorsfish larvae prey(Fit, data in Figs. 6 & 7)
Fig. 8 Curve fits with 95% confidence intervals for clearance ratesof gelatinous predators (jellyfish and ctenophores) feeding oncrustacean zooplankton (Sørnes and Aksnes 2004, based oncompilation of published data) and for jellyfish feeding on fishlarvae (fitted using data in Figs. 6, 7 )
304
References
Aksnes DL, Nejstgaard J, Soedberg E, Sørnes T (2004) Opticalcontrol of fish and zooplankton populations. Limnol Oceanogr49 (1):233–238
Arai MN, Hay DE (1982) Predation by medusae on Pacific herring(Clupea harengus Pallasi) larvae. Can J Fish Aquat Sci 39:1537–1540
Bailey KM (1984) Comparison of laboratory rates of predation onfive species of marine fish larvae by three planktonic inverte-brates—effects of larval size on vulnerability. Mar Biol 79:303–309
Bailey KM, Batty RS (1983) A laboratory study of predation byAurelia aurita on larval herring (Clupea harengus): experimentalobservations compared with model predictions. Mar Biol72:295–301
Bailey KM, Batty RS (1984) Laboratory study of predation byAurelia aurita on larvae of cod, flounder, plaice and her-ring—development and vulnerability to capture. Mar Biol83:287–291
Blaxter JHS (1968) Visual thresholds and spectral sensitivity ofherring larvae. J Exp Biol 48:39–53
Blaxter JHS (1986) Development of sense-organs and behavior ofteleost larvae with special reference to feeding and predatoravoidance. Trans Am Fish Soc 115:98–114
Blaxter JHS, Fuiman LA (1990) The role of the sensory systems ofherring larvae in evading predatory fishes. J Mar Biol AssocUK 70:413–427
Brodeur RD, Sugisaki H, Hunt GL (2002) Increases in jellyfishbiomass in the Bering Sea: implications for the ecosystem. MarEcol Prog Ser 233:89–103
Bamstedt U (1990) Trophodynamics of the scyphomedusae Aureliaaurita—predation rate in relation to abundance, size and typeof prey organism. J Plankton Res 12:215–229
Bamstedt U, Martinussen MB, Matsakis S (1994) Trophodynamicsof the 2 scyphozoan jellyfishes, Aurelia-aurita and Cyanea-capillata, in western Norway. ICES J Mar Sci 51:369–382
Cobcroft JM, Pankhurst PM (2003) Sensory organ development incultured striped trumpeter larvae Latris lineata: implications forfeeding behaviour. Mar Freshwater Res 54(5):669–682
Colin SP, Costello JH (2002) Morphology, swimming performanceand propulsive mode of six co-occurring hydromedusae. J ExpBiol 205:427–437
Costello JH, Colin SP (1995) Flow and feeding by swimmingscyphomedusae. Mar Biol 124:399–406
Costello JH, Colin SP (1994) Morphology, fluid motion and preda-tion by the scyphomedusa Aurelia aurita. Mar Biol 121:327–334
Costello JH, Colin SP (2002) Prey resource use by coexistenthydromedusae from Friday Harbor, Washington. LimnolOceanogr 47:934–942
Cowan JH Jr, Birdsong RS, Houde ED, Priest JS, Sharp WC,Mateja GB (1992) Enclosure experiments on survival andgrowth of black drum eggs and larvae in lower Chesapeake bay.Estuaries 15:392–402
Cowan JH Jr, Houde ED (1992) Size-dependent predation onmarine fish larvae by ctenophores, scyphomedusae, andplanktovorous fish. Fish Oceanogr 1:113–126
Cowan JH, Houde ED (1993) Relative predation potentials ofscyphomedusae, ctenophores and planktivorous fish on ich-thyoplankton in Chesapeake Bay. Mar Ecol Prog Ser 95:55–65
Dabiri JO, Colin SP, Costello JH, Gharib M (2005) Flow patternsgenerated by oblate medusan jellyfish: field measurements andlaboratory analyses. J Exp Biol 208:1257–1265
De Lafontaine Y, Legett WC (1987) Effect of container size onestimates of mortality and predation rates in experiments withmacrozooplankton and larval fish. Can J Fish Aquat Sci44:1534–1543
De Lafontaine Y, Legett WC (1988) Predation by jellyfish on larvalfish: an experimental evaluation employing in situ enclosures.Can J Fish Aquat Sci 45:1173–1190
Duffy JT, Epifanio CE, Fuiman LA (1997) Mortality rates imposedby three scyphozoans on red drum (Sciaenops ocellatus Linna-eus) larvae in field enclosures. J Exp Mar Biol Ecol 212 (1):123–131
Eiane K, Aksnes DL, Bagøien E, Kaartvedt S (1999) Fish or jel-lies—a question of visibility? Limnol Oceanogr 44:1352–1357
Elliott JK, Leggett WC (1996) The effect of temperature on pre-dation rates of a fish (Gasterosteus aculeatus) and a jellyfish(Aurelia aurita) on larval capelin (Mallotus villosus). Can J FishAquat Sci 53:1393–1402
Elliott JK, Leggett WC (1997) Influence of temperature on size-dependent predation by a fish (Gasterosteus aculeatus) and ajellyfish (Aurelia aurita) on larval capelin (Mallotus villosus).Can J Fish Aquat Sci 54:2759–2766
Fancett MS, Jenkins GP (1988) Predatory impact of scyphome-dusae on ichtyoplankton and other zooplankton in Port PhillipBay. J Exp Mar Biol Ecol 116:63–77
Ford MD, Costello JH, Heidelberg KB, Purcell JE (1997) Swim-ming and feeding by the scyphomedusa Chrysaora quin-quecirrha. Mar Biol 129:355–362
Fuiman LA, Cowan JH (2003) Behavior and recruitment success infish larvae: Repeatability and covariation of survival skills.Ecology 84:53–67
Gamble JC, Hay SJ (1989) Predation by the scyphomedusan Aur-elia aurita on herring larvae in large enclosures: effects ofpredator size and prey starvation. Rapp P-v Reun Cons IntExplor Mer 191:366–375
Gatz Jr AJ, Kennedy VS, Mihursky JA (1973) Effects of temper-ature on activity and mortality of the scyphozoan medusa,Chrysaora quinquecirrha. Chesapeake Sci 14:171–180
Hansson LJ, Moeslund O, Kiørboe T, Riisgard HU (2005) Clear-ance rates of jellyfish and their potential predation impact onzooplankton and fish larvae in a neritic ecosystem (Limfjorden).Mar Ecol Prog Ser 304:117–131
Higgs DM, Fuiman LA (1996) Ontogeny of visual and mechano-sensory structure and function in Atlantic menhaden Brevoortiatyrannus. J Exp Biol 199:2619–2629
Higgs DM, Fuiman LA (1998) Associations between behaviouralontogeny and habitat change in clupeoid larvae. J Mar Biol AssUK 78 (4):1281–1294
Horridge GA (1956) The nerves and muscles of medusae V. Doubleinnervation in Scyphozoa. J Exp Biol 33:366–383
Horstman E (1934) Untersuchungen zur Physiologie derSchwimmbewegungen der Scyphomedusan. Pflugers ArchivGes Physiol 234:406–420
Kremer P (1979) Predation by the ctenophore Mnemiopsis leidyi inNarragansett Bay, Rhode-Island. Estuaries 2:97–105
Mackie GO, Larson RJ, Larson KS (1981) Swimming and verticalmigration of Aurelia aurita in a deep tank. Mar Behav Physiol7:321–329
Martinussen MB, Bamstedt U (1995) Diet, estimated daily foodration and predator impact by the scyphozoan jellyfishes Aur-elia aurita and Cyanea capillata. In: Skjoldal HR, Hopkins C,Erikstad KE, Leinaas HP (eds) Ecology of fjords and coastalwaters. Elsevier, Amsterdam, pp 127–145
Martinussen MB, Bamstedt (2001) Digestion rate in relation totemperature of two gelatinous planktonic predators. Sarsia86:21–35
McHenry MJ, Jed J (2003) The ontogenetic scaling of hydrody-namics and swimming performance in jellyfish (Aurelia aurita).J Exp Biol 206:4125–4137
Munk P, Christensen V, Paulsen H (1986) Studies of a larval her-ring (Clupea harengus L.) patch in the Buchan area. II. Growth,mortality and drift of larvae. Dana 6:11–24
Munk P, Larsson PO, Danielssen DS, Moksness E (1999) Vari-ability in frontal zone formation and distribution of gadoid fishlarvae at the shelf break in the northeastern North Sea. MarEcol Prog Ser 177:221–233
Munk P, Wright PJ, Pihl NJ (2002) Distribution of the early larvalstages of cod, plaice and lesser sandeel across haline fronts inthe North Sea. Estuar Coast Shelf Sci 55:139–149
305
Moller H (1980) Scyphomedusae as predators and food competi-tors of larval fish. Meeresforschung 28:90–100
Moller H (1984) Reduction of a larval herring population by ajellyfish predator. Science 224:621–622
Nielsen AS, Pedersen AW, Riisgard HU (1997) Implications ofdensity driven currents for interaction between jellyfish (Aureliaaurita) and zooplankton in a Danish fjord. Sarsia 82:297–305
Pankhurst PM, Eagar R (1996) Changes in visual morphologythrough life history stages of the New Zealand snapper, Pagrusauratus. New Zealand J Mar Freshw Res 30(1):79–90
Paradis AR, Pepin P, Brown JA (1996) Vulnerability of fish eggsand larvae to predation: review of the influence of the relativesize of prey and predator. Can J Fish Aquat Sci 53:1226–1235
Purcell JE, Siferd TD, Marliave JB (1987) Vulnerability of larvalherring (Clupea harengus pallasi) to capture by the jellyfishAequorea victoria. Mar Biol 94:157–162
Purcell JE, Arai MN (2001) Interactions of pelagic cnidarians andctenophores with fish: a review. Hydrobiol 451:27–44
Reeve MR, Walter MA (1978) Laboratory studies of ingestion andfood utilization in lobate and tentaculate ctenophores. LimnolOceanogr 23:740–751
Skajaa K, Ferno A, Folkvord A (2003) Swimming, feeding andpredator avoidance in cod larvae (Gadus morhua L.): trade-
offs between hunger and predation risk. In: Browman HT,Skiftesvik AB (eds) The big fish Bang. Proceedings of the26th annual larval fish conference. Institute of Marine Re-search, pp 105–121
Suchman CL, Sullivan BK (1998) Vulnerability of the copepodAcartia tonsa to predation by the scyphomedusa Chrysaoraquinquecirrha: effect of prey size and behavior. Mar Biol132:237–245
Suchman CL, Sullivan BK (2000) Effect of prey size on vulnera-bility of copepods to predation by the scyphomedusae Aureliaaurita and Cyanea sp. J Plankton Res 22:2289–2306
Stoecker DK, Michaels AE, Davis LH (1987) Grazing by the jel-lyfish, Aurelia-aurita, on microzooplankton. J Plankton Res9:901–915
Sørnes TA, Aksnes DL (2004) Predation efficiency in visual andtactile zooplanktivores. Limnol Oceanogr 49 (1):69–75
Taggart CT, Leggett WC (1987) Short-term mortality in post-emergent larval capelin Mallotus villosus. I. Analysis of multiplein situ estimates. Mar Ecol Prog Ser 41:205–217
Titelman J (2001) Swimming and escape behavior of copepodnauplii: implications for predator–prey interactions among co-pepods. Mar Ecol Prog Ser 213:203–213
306