federal reserve bulletin february 1936 - st. louis fed · 2018-11-06 · federal reserve bulletin...
TRANSCRIPT
FEDERAL RESERVEBULLETIN
OF
FEBRUARY 1936
ISSUED BY THE
BOARD OF GOVERNORSTHE FEDERAL RESERVE SYSTEM
AT WASHINGTON
Appointment of New BoardIncrease in Margin RequirementsMoney Markets AbroadLoans of Federal Credit Agencies
«# ©?<§©&?§• #
UNITED STATES
GOVERNMENT PRINTING OFFICE
WASHINGTON : 1936
Digitized for FRASER http://fraser.stlouisfed.org/ Federal Reserve Bank of St. Louis
BOARD OF GOVERNORS OF THE FEDERAL RESERVE SYSTEM
MARRINER S. ECCLES, Chairman
JOSEPH A. BRODERICK RONALD RANSOMM. S. SZYMCZAK RALPH W. MORRISONJOHN K. MCKEE
CHARLES S. HAMLIN, Special CounselLAWRENCE CLAYTON, Assistant to the ChairmanELLIOTT THURSTON, Special Assistant to the ChairmanCHESTER MORRILL, Secretary
LISTON P. BETHEA, Assistant SecretaryS. R. CARPENTER, Assistant SecretaryJ. C. NOELL, Assistant Secretary
WALTER WYATT, General CounselGEORGE B. VEST, Assistant General CounselB. MAGRUDER WINGFIELD, Assistant General CounselJ. P. DREIBELBIS, Assistant General Counsel
LEO H. PAULGER, Chief, Division of ExaminationsR. F. LEONARD, Assistant Chief, Division of ExaminationsC. E. CAGLE, Assistant Chief, Division of ExaminationsFRANK J. DRINNEN, Federal Reserve Examiner
E. A. GOLDENWEISER, Director, Division of Research and StatisticsWOODLIEF THOMAS, Assistant Director, Division of Research and StatisticsLAUCHLIN CTJRRIE, Assistant Director, Division of Research and Statistics
E. L. SMEAD, Chief, Division of Bank OperationsJ. R. VAN FOSSEN, Assistant Chief, Division of Bank OperationsJ. E. HORBETT, Assistant Chief, Division of Bank Operations
CARL E. PARRY, Chief, Division of Security LoansPHILIP E. BRADLEY, Assistant Chief, Division of Security Loans
O. E. FOULK, Fiscal AgentJOSEPHINE E. LALLY, Deputy Fiscal Agent
FEDERAL ADVISORY COUNCIL
District no. 1 (BOSTON) THOMAS M. STEELE.District no. 2 (NEW YOBK) JAMES H. PERKINS.District no. 3 (PHILADELPHIA) HOWARD A. LOEB, Vice President.District no. 4 (CLEVELAND) ARTHUR E. BRAUN.District no. 5 (RICHMOND) CHARLES M. GOHEN.District no. 6 (ATLANTA) H. LANE YOUNG.District no. 7 (CHICAGO) EDWARD E. BROWN.District no. 8 (ST. LOUIS) WALTER W. SMITH, President.District no. 9 (MINNEAPOLIS) - - THEODORE WOLD.District no. 10 (KANSAS CITY) W. T. KEMPER.District no. 11 (DALLAS) JOSEPH H. FROST.District no. 12 (SAN FRANCISCO) M. A. ARNOLD.
WALTER LICHTENSTEIN, Secretaryn
Digitized for FRASER http://fraser.stlouisfed.org/ Federal Reserve Bank of St. Louis
OFFICERS OF FEDERAL RESERVE BANES
Federal ReserveBank of-
BostonNew York
Philadelphia
Cleveland
Richmond
Atlanta
Chicago..
St. Louis _.
Minneapolis
Kansas City
Dallas
San Francisco
Chairman and FederalReserve agent
F. H. CurtissJ.H. Case
R. L. Austin
E. 8. Burke, Jr.s
E. M. Stevens
J. 8. Wood
J. N. Peyton
J. J. Thomas...
O.O.Walsh
Governor
R. A. YoungG. L. Harrison
G. W. Norrls
M. J. Fleming
G. J. Seay_
Oscar Newton _
G.J. Schaller
W. McO. Martin
W. B. GeeryG. H. Hamilton
B. A. McKlnney
J. IT. Calkins
Deputy Governor
W. W. PaddockW. R. BurgessL. R. RoundsL. F. SailerW. 8. LoganJ. H. Williams.Allan SprouL—0. H. CoeW. H. Hutt
0. A. Mcllhenny
F. J. ZurlindenH. F. StraterR. H. BroaddusJ. S. Walden, Jr.H. W. Martin . .H. F. ConniffH. P. PrestonC. R. McKayJ. H. Dillard
0. M. AtteberyJ. G. McConkey
Harry YaegerH T Ziemfir0. A. WorthingtonT w TTftimR. R.GilbertR. B. Coleman.-W. A. DayIra Clerk
Cashier
W. Willett.J. W. Jones.*W. B. Matteson.iJ. M. Rice.iH. H. Kimball.iL. W. Knoke.iValentine Willis, iA. Phelan. i0. A. Mcllhenny.W J T>ft\ri<i 1W. G. McCreedy.*L. E. Donaldson.1W. F. Taylor.0. W. Arnold.*G. H. Keesee.
M. W. Bell.W. S. McLarin, Jr.*W. H. Snyder.«W. 0. Bachman.*0. J. Netterstrom.1A. T. Sihler.iE. A. Delaney.*A. L. Olson.*S. F. Gilmore.*A. H. HallUF. N. Hall.«G. 0. Hollocher.*0. 0. Phillips.*H. I. Ziemer.F. C. Dunlop.*J. W. Helm.
R. B. Coleman.W. 0. Ford.iW. M. Hale.
^Assistant Deputy Governor.»Controller.
3 Acting chairman; W. H. Fletcher, acting Federal Reserve agent.
MANAGING DIRECTORS OF BRANCHES OF FEDERAL RESERVE BANKS
Federal Reserve Bank of—
New York:Buffalo branch._ _
Cleveland:Cincinnati branchPittsburgh branch
Richmond:Baltimore branchCharlotte branch
Atlanta:Birmingham branchJacksonville branchNashville branchNew Orleans branch
Chicago:Detroit branch
St. Louis:Little Rock branchLouisville branchMemphis branch
Managing director
R. M. O'Hara.
B. J. Lazar.T. 0. Griggs.
Hugh Leach.W. T. Clements.
J. H. Frye.G. 8. Vardeman, Jr.J. B. Fort, Jr.Marcus Walker.
R. H. Buss.
A. F. Bailey.J. T. Moore.W. H. Glasgow.
Federal Reserve Bank of—
Minneapolis:Helena branch
Kansas City:Denver branch _Oklahoma City branchOmaha branch
Dallas:El Paso branchHouston branchSan Antonio branch
San Francisco:Los Angeles branchPortland branch..Salt Lake City branchSeattle branchSpokane branch
Managing director
R. E. Towle.
J. E. Olson.0. E. Daniel.L. H. Earhart.
J. L. Hermann.W. D. Gentry.M. Crump.
W. N. Ambrose.R. B. West.W. L. Partner.0. R. Shaw.D. L. Davis.
SUBSCRIPTION PRICE OF BULLETIN
The FEDERAL RESERVE BULLETIN is the Board's medium of communication with memberbanks of the Federal Reserve System and is the only official organ or periodical publication ofthe Board. The BULLETIN will be sent to all member banks without charge. To others thesubscription price, which covers the cost of paper and printing, is $2. Single copies will be soldat 20 cents. Outside of the United States, Canada, Mexico, and the insular possessions, $2.60;,single copies, 25 cents.
m
Digitized for FRASER http://fraser.stlouisfed.org/ Federal Reserve Bank of St. Louis
TABLE OF CONTENTSPage
Review of the month—Appointment of new Board—Increase in margin requirements—Money marketsabroad 71
Membership of the Federal Reserve Board, 1913-1936 - 84Retiring Board Members 77Loans and investments of all member banks 77Loans of United States Government corporations and credit agencies 78Proclamation of President extending powers conferred by Gold Reserve Act 82Earnings and expenses of Federal Reserve banks for year 1935 128-129National summary of business conditions 85Financial, industrial, and commercial statistics:
Reserve bank credit, gold stock, money in circulation, etc 86-90Member and nonmember bank credit:
All banks in the United States 92All member banks ._ 91, 93, 94, 130Weekly reporting member banks in leading cities 95, 96,131, 132
Acceptances, commercial paper, and brokers' borrowings 97Discount rates and money rates : 98Security prices, bond yields, and security issues 99Treasury finance 100Assets and liabilities of governmental credit agencies 101Reconstruction Finance Corporation—Loans, purchases, and allocations 102Farm Credit Administration—Loans and discounts outstanding, by institutions 103Federal Home Loan Bank Board—Loans outstanding, by institutions 103Obligations fully guaranteed by the United States—Amounts outstanding, by agencies— 103Production, employment, car loadings, and commodity prices— 104Merchandise exports and imports 105Department stores—Indexes of sales and stocks 105Freight-car loadings, by classes 105
International financial statistics:Gold reserves of central banks and governments 106Gold production 107Gold movements 107-109Central banks 110-113Bank for International Settlements 113Commercial banks 114Discount rates of central banks 115Money rates._, 115Foreign exchange rates 116Price movements:
Wholesale prices 117Retail food prices and cost of living 118Security prices 118
Law department:Rulings of Board:
Classification of various types of deposits as savings deposits 119Deposits of credit unions and citrus growers' associations not classified as savings deposits 120Classification as savings deposit of funds of an individual used in his business 120Christmas Club accounts not within classification of savings deposits 120Appointment as executive officer of member bank of person indebted to such bank 121Granting of overdrafts or carrying of cash items for executive officers of member banks 121
Amendment no. 7 of regulation T 122Supplement to regulation T 122Ruling No. 48 interpreting regulation T 122Discounts for individuals, partnerships, and corporations—Extension of time limit 123
Federal Reserve statistics by districts, etc.:Banking and financial statistics 125-134Industrial and commercial statistics 135-140
IV
Digitized for FRASER http://fraser.stlouisfed.org/ Federal Reserve Bank of St. Louis
FEDERAL RESERVE BULLETINVOL. 22 FEBRUARY 1936 No. 2
REVIEW OF THE MONTH
On January 27, 1936, the President sent tothe Senate the nominations of six members of
the Board of Governors of thef Federal Keserve System, ap-
pointed under the provisionsof the Banking Act of 1935, for terms beginningFebruary 1, 1936. These appointments wereapproved by the Senate on January 30.
The initial terms of office of the newly ap-pointed members of the Board are so arrangedas to provide for the expiration of terms at2-year intervals and vary from 2 to 14 years.Members holding office subsequent to theexpiration of these terms will be appointed forterms of 14 years each.
The newly appointed members of the Board,the Federal Reserve districts from which theyare appointed, and their terms are as follows:
Marriner S. Eccles, San Francisco district,4 years.
Joseph A. Broderick, New York district, 14years.
M. S. Szymczak, Chicago district, 12 years.John K. McKee, Cleveland district, 10 years.Ronald Ransom, Atlanta district, 6 years.Ralph W. Morrison, Dallas district, 2 years.A seventh member with an 8-year term is
still to be appointed. The President hasdesignated Marriner S. Eccles to be Chairmanof the Board for a term of 4 years.
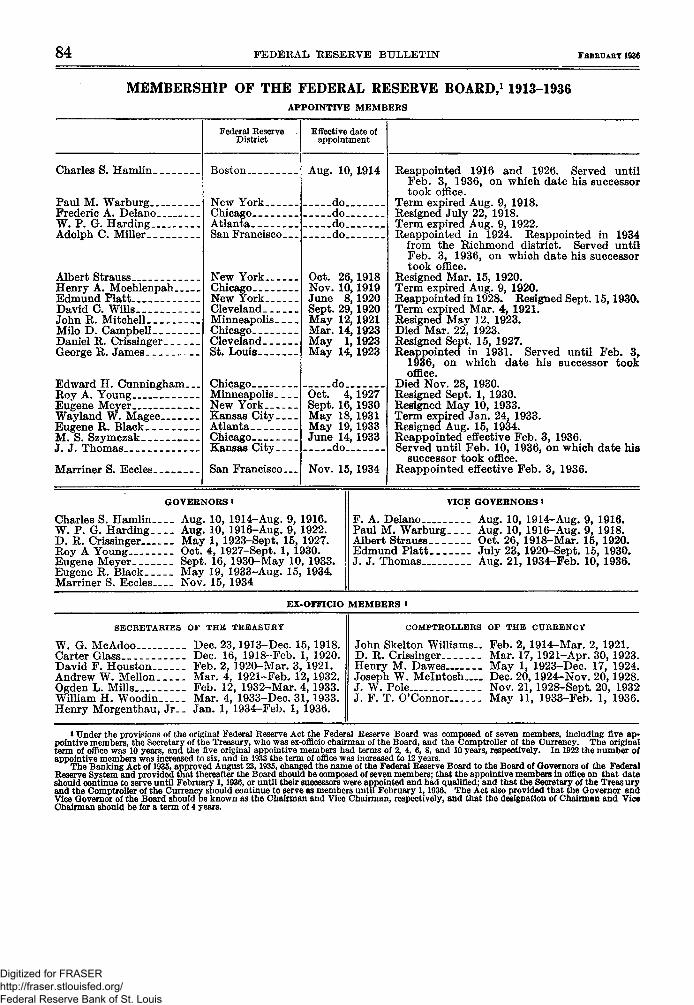
On page 84 of this BULLETIN is a table whichgives a list of all members of the FederalReserve Board from the beginning of theFederal Reserve System, with informationregarding the districts from which they wereappointed and their terms of office.
The Board as constituted prior to February 1,1936, consisted of eight members, includingthe Secretary of the Treasury and the Comp-troller of the Currency as ex officio members.
Under the terms of the Banking Act of 1935,on August 23, the name of the Federal ReserveBoard was changed to the Board of Governorsof the Federal Reserve System, and the Gov-ernor and Vice Governor became Chairman andVice Chairman, respectively, but the member-ship of the Board remained unchanged untilFebruary 3, 1936.
Mr. Eccles was appointed to the FederalReserve Board and designated as Governor
effective November 15, 1934,Members of new r • r>n • A J.Board. becoming Chairman on August
23, 1935, upon passage of theBanking Act of 1935. He came to Washingtonin January 1934 as an assistant to the Secretaryof the Treasury. He was born in Logan, Utah,September 9, 1890. Prior to coming to Wash-ington he had been engaged in banking andindustry in the West for more than 20 years.
Mr. Broderick was born in New York Cityin December 1881. He began his bankingcareer in New York City. After being chiefclerk and auditor in a trust company, he becamean examiner in the New York State BankingDepartment. He was a member of the com-mittee appointed by the Secretary of theTreasury to work out technical organizationof the Federal Reserve banks. He was thefirst Chief Examiner of the Federal ReserveBoard, and in 1918 he became the Secretaryof the Board. He resigned in 1919 to become avice president in the foreign department of theNational Bank of Commerce in New York.Ten years later he was appointed superin-tendent of banks for the State of New York,serving throughout the most difficult period inbanking history.
Mr. Szymczak was appointed a member ofthe Federal Reserve Board effective June 14,1933. He was born in Chicago, August 15,1894, received his A. B. and A. M. degrees at St.
71
Digitized for FRASER http://fraser.stlouisfed.org/ Federal Reserve Bank of St. Louis
72 FEDERAL RESERVE BULLETIN FEBRUARY 1936
Mary's College, Kentucky, and De PaulUniversity, Chicago, and pursued furtherstudies at other schools. He spent someyears in business and also taught businessadministration, economics, and allied subjectsin the College of Commerce at De Paul Uni-versity and in other schools for many years.At the time of his appointment to the Boardhe was comptroller of the city of Chicago.
Mr. McKee was born in Pittsburgh, Novem-ber 19, 1891, and received his education inthe public schools there, Allegheny Prepara-tory School, and the University of Pittsburgh,specializing in banking and commercial law.He has had a wide general experience in busi-ness and banking. In 1931-32 he representedthe Comptroller of the Currency as receiver forinsolvent national banks in Ohio and Pennsyl-vania, and subsequently became examiner forthe Keconstruction Finance Corporation incharge of bank reorganizations. Since 1933he has been Chief of the Examining Divisionof the Reconstruction Finance Corporation.
Mr. Ransom was born in Columbia, S. C ,January 21, 1882, received his LL. B. degreeat the University of Georgia in 1903 and wasadmitted to the bar the same year. He en-gaged in the general practice of law in Atlantauntil 1922, when he became vice president ofthe Fulton National Bank. At the time of hisappointment to the Board he was executivevice president of that bank and in charge of itstrust department. He has been a director inseveral corporations, president of the AtlantaClearing House Association, president of theGeorgia Bankers' Association, and for manyyears has been active in the American Bankers'Association and the Reserve City Bankers'Association.
Mr. Morrison was born in Howell County,Mo., September 7, 1882, and educated inpublic schools and college at West Plains, Mo.He began his business career in the operatingdepartment of a railroad and then engaged inthe sale of railroad equipment in the UnitedStates and various foreign countries. Heafterward became interested in developmentof water power and the operation of electric
power plants which in 1916 were incorporatedinto the Central Power & Light Co., andoperated until sold in 1925. Since then he hasbeen in business in San Antonio and engagedin the development of a large ranch. In 1933Mr. Morrison served as a member of theAmerican delegation to the World Monetaryand Economic Conference at London.
On January 24 the Board of Governors,acting under the powers granted it by the
Securities Exchange Act of1934> announced an increaseeffective February 1 in margin
requirements on loans made by brokers anddealers in securities. Under the new rule,the minimum required margin on a loan col-lateraled by a security that has advanced inprice by less than 33 percent above its lowestprice since July 1, 1933, will continue to be 25percent of current market price, while themargin on loans on securities that have had thelargest increases in price will be 55 percent,rather than 45 percent as heretofore. Marginsrequired on other securities will vary between25 percent and 55 percent of current marketprice, depending upon the degree of their priceadvance. An amendment to Regulation Tadopted by the Board and a supplement pre-scribing the new margin requirements areprinted on page 122.
Since March of last year the stock markethas shown increasing activity at advancing
prices. Beginning in Marchprices1!1 S t°Ck a n d A P r i l 1935> P r i c e s advanced
with little interruption for aperiod of nearly 8 months and the volumeof transactions increased. Average prices ofcommon stocks, as measured by the index of theStandard Statistics Co. for more than 400stocks, increased by about 50 percent in thisperiod. For the most part the increase inprices reflected cash purchases and was notaccompanied by a corresponding increase inbank loans on securities. The absence offlotation of new issues, other than for refundingoutstanding issues, contributed in an importantdegree to the rise in prices of existing securities.
Digitized for FRASER http://fraser.stlouisfed.org/ Federal Reserve Bank of St. Louis
FEBRUARY 1936 FEDERAL RESERVE BULLETIN 73
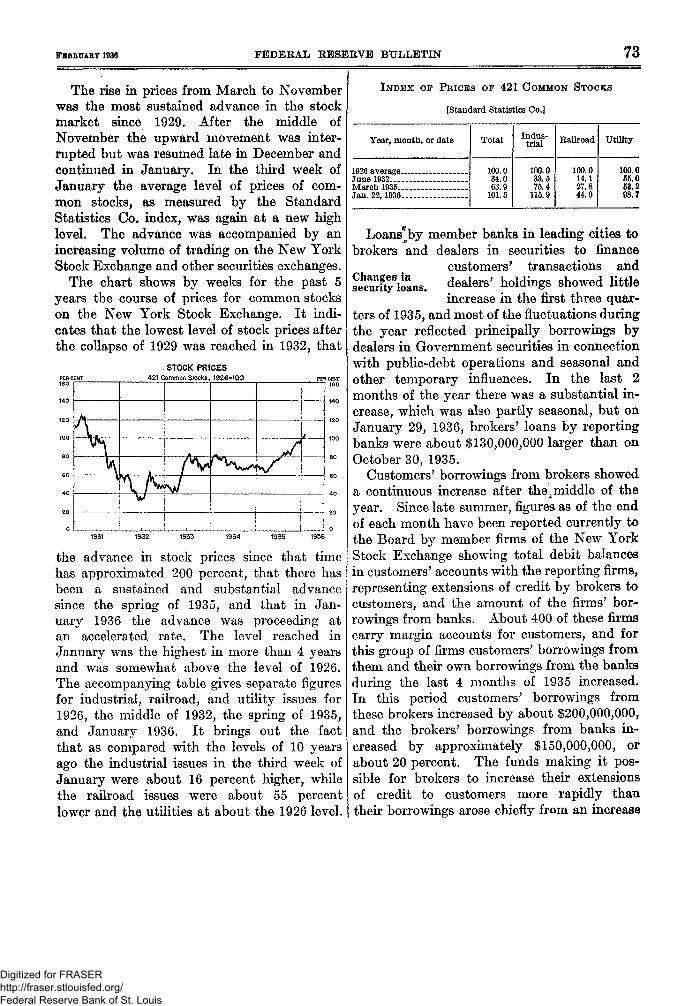
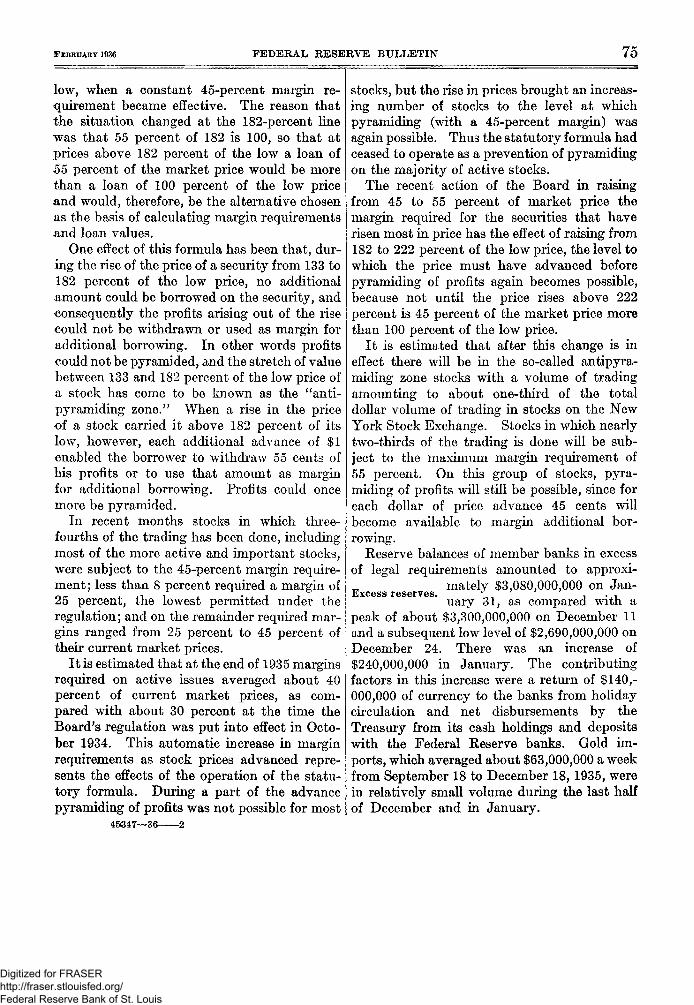
The rise in prices from March to Novemberwas the most sustained advance in the stockmarket since 1929. After the middle ofNovember the upward movement was inter-rupted but was resumed late in December andcontinued in January. In the third week ofJanuary the average level of prices of com-mon stocks, as measured by the StandardStatistics Co. index, was again at a new highlevel. The advance was accompanied by anincreasing volume of trading on the New YorkStock Exchange and other securities exchanges.
The chart shows by weeks for the past 5years the course of prices for common stockson the New York Stock Exchange. It indi-cates that the lowest level of stock prices afterthe collapse of 1929 was reached in 1932, that
PER CENT
140
80
60
4 0
0
U
STOCK PRICES421 Common Stocks, 1926=100
V
A
/V. /
PER CENT
f
\ —
.. . , ...I.. ..
140
80
60
0
the advance in stock prices since that timehas approximated 200 percent, that there hasbeen a sustained and substantial advancesince the spring of 1935, and that in Jan-uary 1936 the advance was proceeding atan accelerated rate. The level reached inJanuary was the highest in more than 4 yearsand was somewhat above the level of 1926.The accompanying table gives separate figuresfor industrial, railroad, and utility issues for1926, the middle of 1932, the spring of 1935,and January 1936. It brings out the factthat as compared with the levels of 10 yearsago the industrial issues in the third week ofJanuary were about 16 percent higher, whilethe railroad issues were about 55 percentlower and the utilities at about the 1926 level.
INDEX OF PKICBS OF 421 COMMON STOCKS
[Standard Statistics Co.]
Year, month, or date
1926 averageJune 1932March 1935Jan. 22,1936
Total
100.034.063.9
101.5
Indus-trial
100.033.575.4
115.9
Railroad
100.014.127.844.9
Utility
100.055.053.298.7
Loans^by member banks in leading cities tobrokers and dealers in securities to finance
customers' transactions andd e a l e r S > h 0 l d i n S s s h ° W e d K t t l e
increase in the first three quar-ters of 1935, and most of the fluctuations duringthe year reflected principally borrowings bydealers in Government securities in connectionwith public-debt operations and seasonal andother temporary influences. In the last 2months of the year there was a substantial in-crease, which was also partly seasonal, but onJanuary 29, 1936, brokers' loans by reportingbanks were about $130,000,000 larger than onOctober 30, 1935.
Customers' borrowings from brokers showeda continuous increase after the^ middle of theyear. Since late summer, figures as of the endof each month have been reported currently tothe Board by member firms of the New YorkStock Exchange showing total debit balancesin customers' accounts with the reporting firms,representing extensions of credit by brokers tocustomers, and the amount of the firms' bor-rowings from banks. About 400 of these firmscarry margin accounts for customers, and forthis group of firms customers' borrowings fromthem and their own borrowings from the banksduring the last 4 months of 1935 increased.In this period customers' borrowings fromthese brokers increased by about $200,000,000,and the brokers' borrowings from banks in-creased by approximately $150,000,000, orabout 20 percent. The funds making it pos-sible for brokers to increase their extensionsof credit to customers more rapidly thantheir borrowings arose chiefly from an increase
Digitized for FRASER http://fraser.stlouisfed.org/ Federal Reserve Bank of St. Louis
74 FEDERAL RESERVE BULLETIN FEBRUARY 193G
in the credit balances held with brokers by suchof their customers as were not indebted tothem.
The course of bank loans on securities toborrowers other than brokers and dealers insecurities is indicated by the weekly figures re-ported to the Board by member banks in lead-ing cities. These figures, after decreasing con-tinuously over a period of years, increased fromSeptember 18 to December 31, 1935, by ap-proximately $50,000,000, which represented atemporary increase arising partly from end-of-year needs for cash. In January they againdeclined.
It is an unusual development for a rise of 50percent in stock prices in a short period of time
not to be accompanied by a sub-Margins as an stantial increase in the amountinstrument ofcredit control. oi bank credit used lor carrying
securities. The abundance offunds in the hands of investors is in large partresponsible for this unusual turn of events in1935, and the margin requirements appear alsoto have been a factor, in that they limited with-drawals of cash from margin accounts for thepurpose of realizing profits from a rise in stockprices and thereby reduced the need of bor-rowing by brokers.
By the latter part of 1935, however, moststocks had advanced in price to a point atwhich, by reason of the mechanical effect ofthe price advance on margin requirements,withdrawal of profits or their use as margin forfurther commitments was again possible.There were evidences of increased borrowingby brokers' customers, and to some extent bythe brokers themselves, for the purpose ofpurchasing and carrying securities. In orderto forestall an excessive growth in the use ofcredit for these purposes, the Board increasedthe margin requirements on the stocks thathave risen most in price.
The power of the Board to raise margin re-quirements provides an instrument for control-ling the demand for credit from speculators inthe stock market without restricting the supplyavailable for other borrowers. It differs fromother means of credit control in that it affects
directly the demand for credit rather than theavailable supply or cost. Through the use ofthis instrument it may be possible for the Boardto exert a restraining influence on the use ofcredit for speculation in the stock marketbefore it has reached a stage at which thegeneral business and credit situation is un-favorably affected. The use of the instrumentexercises a restraint on speculation withoutlimiting the supply or raising the cost of creditto agriculture, trade, and industry.
It will be recalled that the Securities Ex-change Act contains a formula on which margin
requirements shall be based butEffect of margin p r o v ides that the Board mayrequirements on ^ .. 1 _ . _ J
loans. prescribe lower or higher re-quirements, if conditions make
it desirable to do so. The statutory formulawas adopted by the Board on October 1, 1934,,and continues in effect, except that the highestrequired margin has been increased by theBoard's recent action. The statutory formulaprovides in effect that a loan on a securitymust not be greater than whichever is thehigher of:
(1) Fifty-five per centum of the currentmarket price of the security, or
(2) One hundred per centum of the lowestmarket price of the security since July 1, 1933,but not more than 75 per centum of the currentmarket price.
The theory on which the statutory marginformula was based was to provide for a con-stant increase of restraining influences as theprices of stocks advanced above their lows.So long as the price of a stock is less than 133percent of the low price in the period prescribeda customer may borrow from a broker as muchas 75 percent of its market price, because up tothat point 75 percent of the market price wouldnot exceed 100 percent of the low price. Whenthe price of a security advances above 133percent of its low price, the amount that canbe borrowed on it does not increase and thepercentage margin requirement, therefore, in-creases as the price advances. Under thestatutory formula this condition continueduntil the price rose above 182 percent of its
Digitized for FRASER http://fraser.stlouisfed.org/ Federal Reserve Bank of St. Louis
FEBBUARY 1936 FEDERAL RESERVE BULLETIN 75
low, when a constant 45-percent margin re-quirement became effective. The reason thatthe situation changed at the 182-percent linewas that 55 percent of 182 is 100, so that atprices above 182 percent of the low a loan of55 percent of the market price would be morethan a loan of 100 percent of the low priceand would, therefore, be the alternative chosenas the basis of calculating margin requirementsand loan values.
One effect of this formula has been that, dur-ing the rise of the price of a security from 133 to182 percent of the low price, no additionalamount could be borrowed on the security, andconsequently the profits arising out of the risecould not be withdrawn or used as margin foradditional borrowing. In other words profitscould not be pyramided, and the stretch of valuebetween 133 and 182 percent of the low price ofa stock has come to be known as the "anti-pyramiding zone." When a rise in the priceof a stock carried it above 182 percent of itslow, however, each additional advance of $1enabled the borrower to withdraw 55 cents ofhis profits or to use that amount as marginfor additional borrowing. Profits could oncemore be pyramided.
In recent months stocks in which three-fourths of the trading has been done, includingmost of the more active and important stocks,were subject to the 45-percent margin require-ment; less than 8 percent required a margin of25 percent, the lowest permitted under theregulation; and on the remainder required mar-gins ranged from 25 percent to 45 percent oftheir current market prices.
It is estimated that at the end of 1935 marginsrequired on active issues averaged about 40percent of current market prices, as com-pared with about 30 percent at the time theBoard's regulation was put into effect in Octo-ber 1934. This automatic increase in marginrequirements as stock prices advanced repre-sents the effects of the operation of the statu-tory formula. During a part of the advancepyramiding of profits was not possible for most
45-347—36 2
stocks, but the rise in prices brought an increas-ing number of stocks to the level at whichpyramiding (with a 45-percent margin) wasagain possible. Thus the statutory formula hadceased to operate as a prevention of pyramidingon the majority of active stocks.
The recent action of the Board in raisingfrom 45 to 55 percent of market price themargin required for the securities that haverisen most in price has the effect of raising from182 to 222 percent of the low price, the level towhich the price must have advanced beforepyramiding of profits again becomes possible,because not until the price rises above 222percent is 45 percent of the market price morethan 100 percent of the low price.
It is estimated that after this change is ineffect there will be in the so-called antipyra-miding zone stocks with a volume of tradingamounting to about one-third of the totaldollar volume of trading in stocks on the NewYork Stock Exchange. Stocks in which nearlytwo-thirds of the trading is done will be sub-ject to the maximum margin requirement of55 percent. On this group of stocks, pyra-miding of profits will still be possible, since foreach dollar of price advance 45 cents willbecome available to margin additional bor-rowing.
Reserve balances of member banks in excessof legal requirements amounted to approxi-
mately $3,080,000,000 on Jan-uary 31, as compared with a
peak of about $3,300,000,000 on December 11and a subsequent low level of $2,690,000,000 onDecember 24. There was an increase of$240,000,000 in January. The contributingfactors in this increase were a return of $140,-000,000 of currency to the banks from holidaycirculation and net disbursements by theTreasury from its cash holdings and depositswith the Federal Reserve banks. Gold im-ports, which averaged about $63,000,000 a weekfrom September 18 to December 18, 1935, werein relatively small volume during the last halfof December and in January.
Excess reserves.
Digitized for FRASER http://fraser.stlouisfed.org/ Federal Reserve Bank of St. Louis
76 FEDEKAL RESERVE BULLETIN
With the cessation of the gold outflow fromFrance early in December the movement of gold
from Europe to the United£ b X maFketS S t a t e s t h a t h a d b e ^ u n 3 months
earlier subsided. On January2 the Bank of France reduced its discount rateto 5 percent, and a week later to 4 percent.The lower rate was retained in the face of therenewed loss of gold accompanying the over-turn of the Laval government, and open-market discount rates remained close to the 4percent level to which they had becomeadjusted.
A similar process of reduction of centralbank and open-market discount rates hadbegun in October in the Netherlands, and bythe end of January open-market rates inAmsterdam had fallen substantially below the3 percent rate established in the middle of themonth by the Netherlands Bank. Notwith-standing these recent declines, however, thelevel of rates in the three gold-bloc countries—France, Netherlands, and Switzerland—remained considerably higher than rates inLondon and New York.
This higher level of rates in the gold-bloccountries began to develop, somewhat irregu-larly, early in 1933 but did not become pro-nounced until the spring of 1935. The un-usually easy conditions that prevailed in worldmoney markets in the last half of 1932, exceptin Berlin, where the crisis of 1931 had seriouslyimpaired the lending power of the commercialbanks, arose from the large volume of bankfunds seeking short-term investment and thelow volume of business activity. Subsequentdevelopments have reflected chiefly the alteredreserve position of the commercial banks andcentral bank discount policies.
In the past 3 years reserves of commercialbanks in the gold-bloc countries have re-peatedly been reduced by outward movementsof capital. To some extent commercial bankshave met the withdrawal of funds by borrowingat the central bank. This has been particu-larly marked since the spring of 1935 in Swit-zerland and France, and as a result centralbank rates in those countries have largely
FEBRUARY 1936
governed market rates. In the Netherlands,the commercial banks have also borrowedheavily at those periods when the outwardmovement of gold has been severe, and promptaction by the Netherlands Bank has beenfollowed by sharp advances in open-marketrates. Subsequently, however, most of theborrowings have been repaid, leaving the mar-ket relatively independent of the central bank.This is reflected at the present time in thespread between central bank and open-marketrates in Amsterdam.
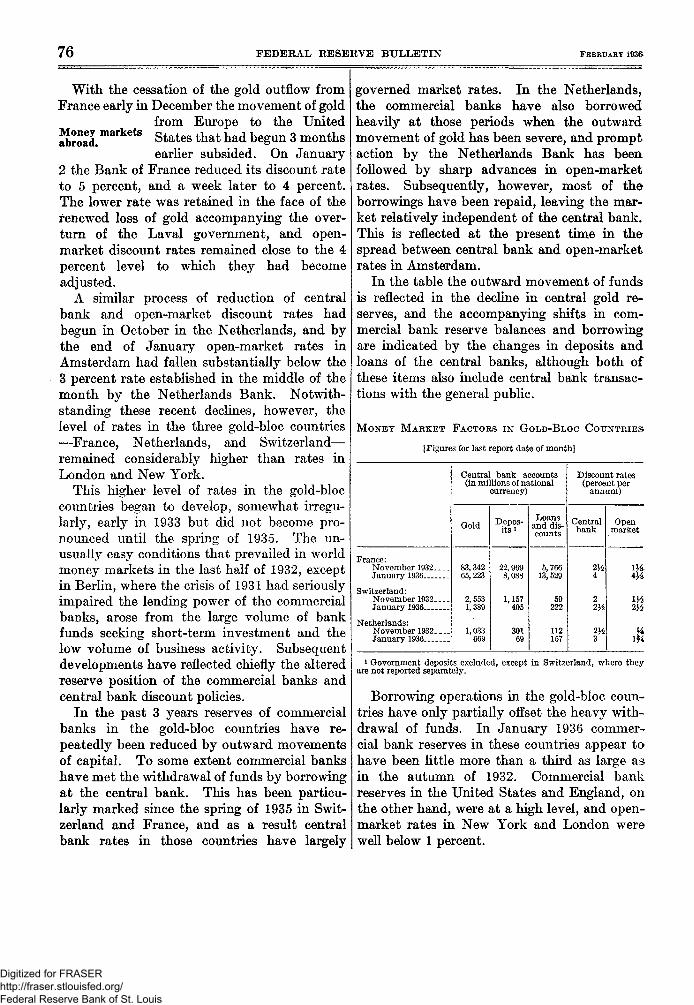
In the table the outward movement of fundsis reflected in the decline in central gold re-serves, and the accompanying shifts in com-mercial bank reserve balances and borrowingare indicated by the changes in deposits andloans of the central banks, although both ofthese items also include central bank transac-tions with the general public.
M O N E Y M A R K E T FACTORS I N G O L D - B L O C C O U N T R I E S
[Figures for last report date of month]
France:November 1932January 1936
Switzerland:November 1932January 1936
Netherlands:November 1932January 1936 _
Central bank accounts(in millions of national
currency)
Gold
83,34265, 223
2,5531,389
1,033669
Depos-its i
22, 9698,088
1,157405
30169
Loansand dis-counts
5,76613,529
59222
112157
Discount rates(percent per
annum)
Centralbank
2H4
2
2\b3
Openmarket
2H
%m1 Government deposits excluded, except in Switzerland, where they
are not reported separately.
Borrowing operations in the gold-bloc coun-tries have only partially offset the heavy with-drawal of funds. In January 1936 commer-cial bank reserves in these countries appear tohave been little more than a third as large asin the autumn of 1932. Commercial bankreserves in the United States and England, onthe other hand, were at a high level, and open-market rates in New York and London werewell below 1 percent.
Digitized for FRASER http://fraser.stlouisfed.org/ Federal Reserve Bank of St. Louis
FEBRUARY 1936 FEDERAL RESERVE BULLETIN 77
Except for temporary variations, cash re-serves of the English commer-c i a l b a n k s d u r i n g t h e P a s t 3
years have been maintained atthe high figure reached at the end of 1932, andshort-term money rates have shown onlyminor fluctuations. Early in 1932 the Bank ofEngland began to increase its holdings of securi-ties and gold, and this contributed to furtherease in the money market and facilitated theGovernment's program of converting the publicdebt to a lower interest basis. Between Apriland December 1932 the cash reserves of theLondon clearing banks increased nearly 20percent; and largely on the basis of these addedreserves the banks expanded by two-thirdstheir holdings of bills and securities, the bulkof which consists of Government obligations.In part the increase represented the employ-ment of resources released by the continuedcontraction of commercial loans. At the endof 1932 both short-term money rates and high-grade bond yields were substantially lower thanthey had been earlier in the year.
Since the end of 1932 high-grade bond yieldshave declined further. There has been littlefurther increase in commercial bank reserves,but the banks have continued to purchasesecurities with resources released by the reduc-tion in their holdings of Treasury bills thataccompanied refunding operations of the Gov-ernment. At the end of 1935 long-term invest-ments constituted about a third of the earningassets of the London clearing banks, which ismore than double the portfolio maintained inthe years immediately preceding the depression.
At the present time the London clearingbanks, in contrast with member banks in theUnited States, have no reserves in excess of thecustomary ratio to deposits. The inflow offunds since the abandonment of the goldstandard in 1931 has gone only in small partinto bank reserves. Much private foreigncapital transferred to England has been utilizedto purchase gold, which has thus been tem-porarily withdrawn from monetary use. Goldoperations of the Exchange Equalization Ac-count have also been without effect. When, as
the result of an excess of payments due toGreat Britain from abroad, the account buysgold, the funds so placed in the market areautomatically withdrawn by the sale of securitiesto finance the gold purchase. Similarly, whenthe account sells gold, the proceeds are investedin securities and so returned to the market. TheBank of England has purchased gold only at itsown discretion and in conformity with its otheroperations. Consequently neither inward noroutward movements of gold since 1931 havematerially influenced the available volume ofmoney market resources in England.
Retiring Board Members
At the request of the Board of Governors ofthe Federal Reserve System, Mr. Adolph C.Miller, who was a member of the Federal Re-serve Board from the time it was establishedin 1914, will continue, in an advisory capacity,the supervision he has exercised over the plansfor and construction of the Board's new build-ing since its inception.
Mr. Charles S. Hamlin, another member ofthe original Board, who was also its first gov-ernor, has accepted appointment as a specialcounsel to the Board, acting in an advisorycapacity.
Mr. J. J. Thomas has been appointed a classC director of the Federal Reserve Bank ofKansas City and designated as chairman andFederal Reserve agent to fill the vacancy whichhas existed since the death of Mr. M. L. Mc-Clure. Judge Thomas' appointment as a classC director is for the unexpired term endingDecember 31, 1938, and his designation aschairman and Federal Reserve agent is for theremainder of the current year.
Mr. George R. James, who had accepted re-appointment in 1931 for the emergency period,will resume his business connections in Mem-phis, Tenn.
LOANS AND INVESTMENTS OF ALL MEMBERBANKS
According to preliminary figures tabulatedfrom December 31 call reports, total loans andinvestments of all member banks inci eased byan additional $630,000,000 during the periodfrom November 1 1935, to December 31, 1935,making a total increase of $1,780,000,000 for
Digitized for FRASER http://fraser.stlouisfed.org/ Federal Reserve Bank of St. Louis
78 FEDERAL RESERVE BULLETIN FEBRUARY 1936
the entire year. Detailed figures are shown inthe table on page 93 of this BULLETIN.
The largest increase during the last 2 monthsof 1935 occurred in the banks' holdings ofdirect obligations of the United States Govern-ment, which rose by $420,000,000, comparedwith an increase of $170,000,000 for the pre-ceding 10 months. Holdings of obligationsfully guaranteed by the Government remainedpractically unchanged in the last 2 months,after a substantial increase during the pre-ceding year and a half. Holdings of othersecurities declined somewhat at the end of theyear but showed an increase for 1935 as awhole. Loans to customers on securities,which had decreased steadily since 1930,showed little change in November and De-cember 1935, while other loans to customerscontinued the increase which characterizedthe entire year. Loans to security biokersand dealers, which showed little change in thefirst 10 months of 1935, increased by $230,000,-
000 in the last 2 months, reflecting in partseasonal influences.
The largest expansion in loans and invest-ments in the last 2 months of 1935, as well asfor the year as a whole, occurred at centralreserve and reserve city banks. Holdings ofdirect Government obligations increased dur-ing November and December by $170,000,000at central reserve city banks, by $190,000,000at reserve city banks, and by $60,000,000 atcountry banks. For the year as a wholeholdings of direct obligations of the Govern-ment by country banks decreased somewhat,reflecting the retirement of bonds held ascollateral for national bank notes, while theirholdings of guaranteed obligations and of othersecurities showed substantial increases. Cus-tomers7 loans increased during the year atreserve city banks and declined at countrybanks. The increase in brokers' loans occurredalmost entirely at New York City banks,which now make the bulk of these loans.
LOANS OF UNITED STATES GOVERNMENT CORPORATIONS AND CREDIT AGENCIES
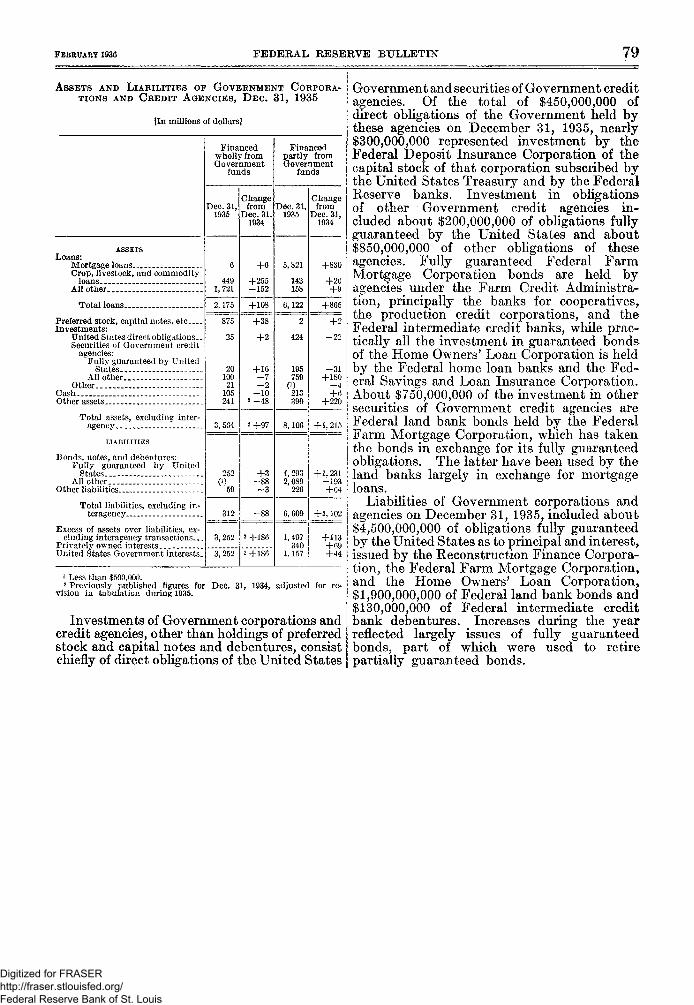
On December 31, 1935, the outstandingloans of United States Government corpora-tions and credit agencies totaled $8,300,000,000,an increase of $1,000,000,000 from December31, 1934. The growth reflected principallyincreases in farm and home mortgage loansmade by agencies of the Farm Credit Adminis-tration and by the Home Owners' LoanCorporation and in crop loans made by theCommodity Credit Corporation. Investmentsof Government corporations and credit agenciesin preferred stock and capital notes anddebentures of private companies, chiefly invest-ments by the Reconstruction Finance Corpora-tion in banks and trust companies, totaledabout $880,000,000 on December 31, 1935, anincrease of $40,000,000 during the year.
Loans and investments of the variousagencies on December 31, 1935, as shown in astatement published by the Treasury Depart-ment, appear in the table on page 101, which isregularly published in the BULLETIN. Figuresfor the Reconstruction Finance Corporationand the credit agencies under the Farm CreditAdministration and the Home Loan Bank Boardappear in more detail on pages 102 and 103.
As shown in the following table, the increasein loans of Government corporations and creditagencies during 1935 was largely in loans ofagencies which derived nearly all of their fundsfrom issuing their own securities, some of which
are fully guaranteed by the United States asto payment of interest and principal. Loansby corporations and agencies thus financedpartly from Government funds and partlyfrom private funds amounted to $6,100,000,000on December 31, 1935, an increase of about$900,000,000 during the year.
Loans of the corporations and agencies whichare financed wholly from Government fundsincreased by about $100,000,000 during 1935,to a total of $2,200,000,000 at the end of theyear, and their holdings of preferred stock andcapital notes and debentures increased by$40,000,000, to a total of about $880,000,000.Most of the loans were made directly by theReconstruction Finance Corporation, whichsells its obligations to the United StatesTreasury, or by other agencies from fundsadvanced by the Reconstruction Finance Cor-poration. The increase during 1935 reflectedchiefly an increase of more than $250,000,000in loans on crops, livestock, and commoditiesand was principally in loans of the CommodityCredit Corporation, which is financed throughthe Reconstruction Finance Corporation. Italso included an increase in such loans made bythe Farm Credit Administration from Govern-ment funds. A more detailed discussion ofthe changes in the loans and investments of theReconstruction Finance Corporation and incrop loans appears in subsequent paragraphs.
Digitized for FRASER http://fraser.stlouisfed.org/ Federal Reserve Bank of St. Louis
FEBRUARY 1936 FEDERAL RESERVE BULLETIN 79
ASSETS AND LIABILITIES OF GOVERNMENT CORPORA-TIONS AND CREDIT AGENCIES, DEC. 31, 1935
[In millions of dollars]
ASSETSLoans:
Mortgage loansCrop, livestock, and commodity
loans _All other _ _
Total loans __
Preferred stock, capital notes, etcInvestments:
United States direct obligations._Securities of Government credit
agencies:Fully guaranteed by United
States-All other .__ - .__
OtherCashOther assets.. _
Total assets, excluding inter-agency
LIABILITIES
Bonds, notes, and debentures:Fully guaranteed by United
StatesAll other .
Other liabilities _
Total liabilities, excluding in-teragencv
Excess of assets over liabilities, ex-cluding interagency transactions...
Privately o"wned interestsUnited States Government interests-
Financedwholly fromGovernment
funds
Dec. 31,1935
6
4491,721
2,175
875
25
2010021
105241
3,564
252
W 5 0
312
3,252
3,252
Changefrom
Dec. 31,1934
+6
+255-152
+108
+38
+2
+16- 7- 2
- 1 02-48
2+97
+3- 8 8
q
- 8 8
2 +186
2+186
Financedpartly fromGovernment
funds
Dec. 31,1935
5,821
143158
6,122
2
424
195759
(i)213390
8,106
4, 2932,089
226
6,609
1,497340
1,157
Changefrom
Dec. 31,1934
+830
+2G+9
+865
+2
- 2 2
- 3 1+180
—4+6
+220
+1,215
+1.231-193
+64
+1,102
+113+69+44
1 Less than $500,000.2 Previously published figures for Dec. 31, 1934, adjusted for re-vision in tabulation during 1935.
Investments of Government corporations andcredit agencies, other than holdings of preferredstock and capital notes and debentures, consistchiefly of direct obligations of the United States
Government and securities of Government creditagencies. Of the total of $450,000,000 ofdirect obligations of the Government held bythese agencies on December 31, 1935, nearly$300,000,000 represented investment by theFederal Deposit Insurance Corporation of thecapital stock of that corporation subscribed bythe United States Treasury and by the FederalReserve banks. Investment in obligationsof other Government credit agencies in-cluded about $200,000,000 of obligations fullyguaranteed by the United States and about$850,000,000 of other obligations of theseagencies. Fully guaranteed Federal FarmMortgage Corporation bonds are held byagencies under the Farm Credit Administra-tion, principally the banks for cooperatives,the production credit corporations, and theFederal intermediate credit banks, while prac-tically all the investment in guaranteed bondsof the Home Owners7 Loan Corporation is heldby the Federal home loan banks and the Fed-eral Savings and Loan Insurance Corporation.About $750,000,000 of the investment in othersecurities of Government credit agencies areFederal land bank bonds held by the FederalFarm Mortgage Corporation, which has takenthe bonds in exchange for its fully guaranteedobligations. The latter have been used by theland banks largely in exchange for mortgageloans.
Liabilities of Government corporations andagencies on December 31, 1935, included about$4,500,000,000 of obligations fully guaranteedby the United States as to principal and interest,issued by the Reconstruction Finance Corpora-tion, the Federal Farm Mortgage Corporation,and the Home Owners' Loan Corporation,$1,900,000,000 of Federal land bank bonds and$130,000,000 of Federal intermediate creditbank debentures. Increases during the yearreflected largely issues of fully guaranteedbonds, part of which w ere used to retirepartially guaranteed bonds.
Digitized for FRASER http://fraser.stlouisfed.org/ Federal Reserve Bank of St. Louis
80 FEDERAL RESERVE BULLETIN FBBEUABY 1936
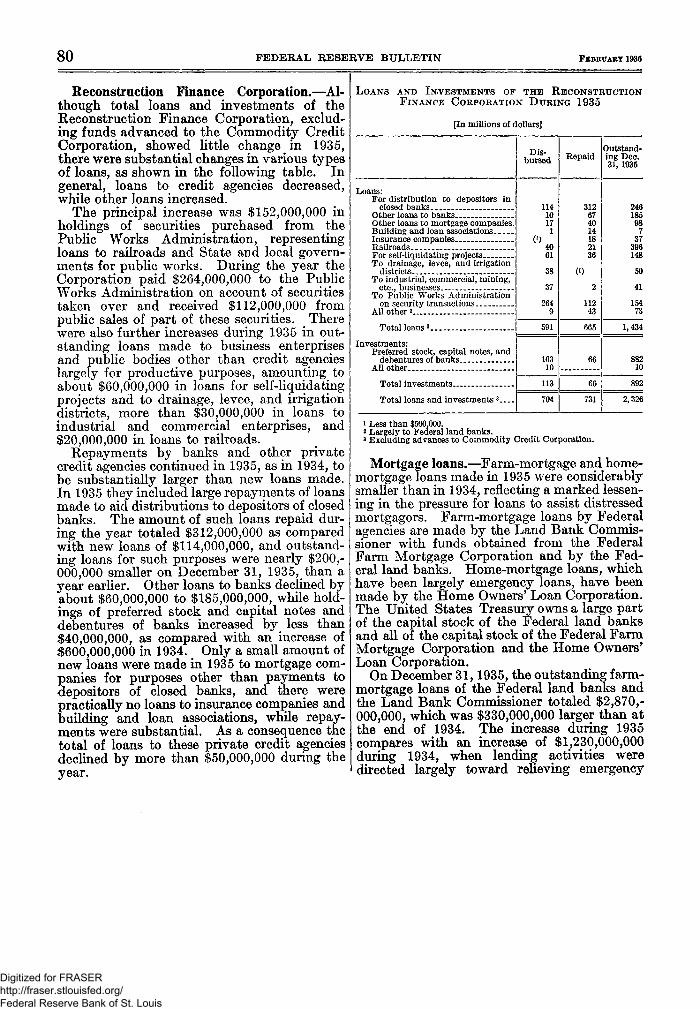
Reconstruction Finance Corporation.—Al-though total loans and investments of theReconstruction Finance Corporation, exclud-ing funds advanced to the Commodity CreditCorporation, showed little change in 1935,there were substantial changes in various typesof loans, as shown in the following table. Ingeneral, loans to credit agencies decreased,while other loans increased.
The principal increase was $152,000,000 inholdings of securities purchased from thePublic Works Administration, representingloans to railroads and State and local govern-ments for public works. During the year theCorporation paid $264,000,000 to the PublicWorks Administration on account of securitiestaken over and received $112,000,000 frompublic sales of part of these securities. Therewere also further increases during 1935 in out-standing loans made to business enterprisesand public bodies other than credit agencieslargely for productive purposes, amounting toabout $60,000,000 in loans for self-liquidatingprojects and to drainage, levee, and irrigationdistricts, more than $30,000,000 in loans toindustrial and commercial enterprises, and$20,000,000 in loans to railroads.
Repayments by banks and other privatecredit agencies continued in 1935, as in 1934, tobe substantially larger than new loans made.In 1935 they included large repayments of loansmade to aid distributions to depositors of closedbanks. The amount of such loans repaid dur-ing the year totaled $312,000,000 as comparedwith new loans of $114,000,000, and outstand-ing loans for such purposes were nearly $200,-000,000 smaller on December 31, 1935, than ayear earlier. Other loans to banks declined byabout $60,000,000 to $185,000,000, while hold-ings of preferred stock and capital notes anddebentures of banks increased by less than$40,000,000, as compared with an increase of$600,000,000 in 1934. Only a small amount ofnew loans were made in 1935 to mortgage com-panies for purposes other than payments todepositors of closed banks, and there werepractically no loans to insurance companies andbuilding and loan associations, while repay-ments were substantial. As a consequence thetotal of loans to these private credit agenciesdeclined by more than $50,000,000 during theyear.
LOANS AND INVESTMENTS OF THE RECONSTRUCTIONFINANCE CORPORATION DURING 1935
[In millions of dollars]
Loans:For distribution to depositors in
closed banksOther loans to banks.Other loans to mortgage companies.Building and loan associationsInsurance companiesRailroadsFor self-liquidating projectsTo drainage, levee, and irrigation
districtsTo industrial, commercial, mining,
etc., businessesTo Public Works Administration
on security transactionsAll other 2 . > ._
Total loans3 ._
Investments:Preferred stock, capital notes, and
debentures of banksAll other
Total investments
Total loans and investments 3
Dis-bursed
1141017
61
38
37
2649
591
10310
113
704~
Repaid
312674014182136
0)2
11243
665
66
66
731
Outstand-ing Dec.31, 1935
246185987
37396148
50
41
15473
1,434
88210
892
2,326
1 Less than $500,000.2 Largely to Federal land banks.3 Excluding advances to Commodity Credit Corporation.
Mortgage loans.—Farm-mortgage and home-mortgage loans made in 1935 were considerablysmaller than in 1934, reflecting a marked lessen-ing in the pressure for loans to assist distressedmortgagors. Farm-mortgage loans by Federalagencies are made by the Land Bank Commis-sioner with funds obtained from the FederalFarm Mortgage Corporation and by the Fed-eral land banks. Home-mortgage loans, whichhave been largely emergency loans, have beenmade by the Home Owners' Loan Corporation.The United States Treasury owns a large partof the capital stock of the Federal land banksand all of the capital stock of the Federal FarmMortgage Corporation and the Home Owners'Loan Corporation.
On December 31,1935, the outstanding farm-mortgage loans of the Federal land banks andthe Land Bank Commissioner totaled $2,870,-000,000, which was $330,000,000 larger than atthe end of 1934. The increase during 1935compares with an increase of $1,230,000,000during 1934, when lending activities weredirected largely toward relieving emergency
Digitized for FRASER http://fraser.stlouisfed.org/ Federal Reserve Bank of St. Louis
FEBRUARY 1936 FEDERAL RESERVE BULLETIN 81
situations. By December 31, 1935, the HomeOwners' Loan Corporation had made home-mortgage loans in an aggregate amount of$2,940,000,000. Of this amount $740,000,000was advanced during 1935 and practically theentire balance during the calendar year 1934.
In 1935, as in 1934, the majority of loans weremade by giving obligations fully guaranteed bythe United States in exchange for mortgages.During 1935, however, conditions became morefavorable for financing of mortgage obligationsthrough publicly offered issues. The practiceof disbursing Federal Farm Mortgage Corpora-tion bonds, rather than cash, in connection withfarm-mortgage loans was discontinued for loansclosed during the latter part of the year. TheFederal land banks refunded about $500,000,000of their bonds, bearing interest rates of A.% and5 percent, into 3 and 3% percent bonds. In De-cember, for the first time since 1930, a sub-stantial amount of Federal land bank bondswas issued to obtain funds for other than re-funding purposes, An issue of $100,000,000 of3-percent bonds was sold at 98% to provide$37,000,000 for new mortgage loans and theremainder for refunding called bonds.
Repayments of principal on mortgage loansof the Home Owners7 Loan Corporation arerequired by law to be applied to retirement ofbonds and by December 31, 1935, about$60,000,000 of the various issues of HomeOwners' Loan Corporation bonds had beenretired in this manner.
Institutions under the Home Loan BankBoard, with the exception of the Home Owners'Loan Corporation, are permanent home mort-gage financing agencies. The Home Loanbanks are organized with capital stock sub-scribed largely by the United States Treasury.They supply funds to member institutions,including Federal savings and loan associationsand other building and loan associations, whichmake home-mortgage loans directly to thepublic. During the first 3 months of 1935,loans of the home loan banks declined by about$15,000,000, but from March to the end of theyear they increased by about $30,000,000 andon December 31, 1935, exceeded $100,000,000.This increase occurred in a period when resi-dential building activity and the number ofassociations eligible to borrow were increasing.
There was a steady increase during 1935 inthe number of Federal savings and loan asso-ciations chartered. These are local organiza-tions for making home-mortgage loans whichare organized under Federal charter and receivea part of their operating capital from the United
States Treasury. At the end of the year over1,000 associations had been chartered, including600 new associations and 400 associationswhich, originally organized under State laws,have taken out Federal charters. Reports byabout 750 of these associations showed mort-gage loans on December 31, 1935, aggregatingabout $270,000,000, about one-fifth of whichwere made by the new associations formedunder Federal charter and the remainder byconverted associations.
The growth in number of Federal savings andloan associations was accompanied by an in-crease of nearly $40,000,000 m the capital stocksubscribed by the United States. In Septem-ber the Home Owners' Loan Corporation beganto use an allotment of $300,000,000 of HomeOwners' Loan Corporation bonds provided bylaw to make funds available to private homeloan institutions through the purchase of theirstock. By the end of the year it had investednearly $20,000,000 in this manner, the majorpart in shares of Federal savings and loanassociations.
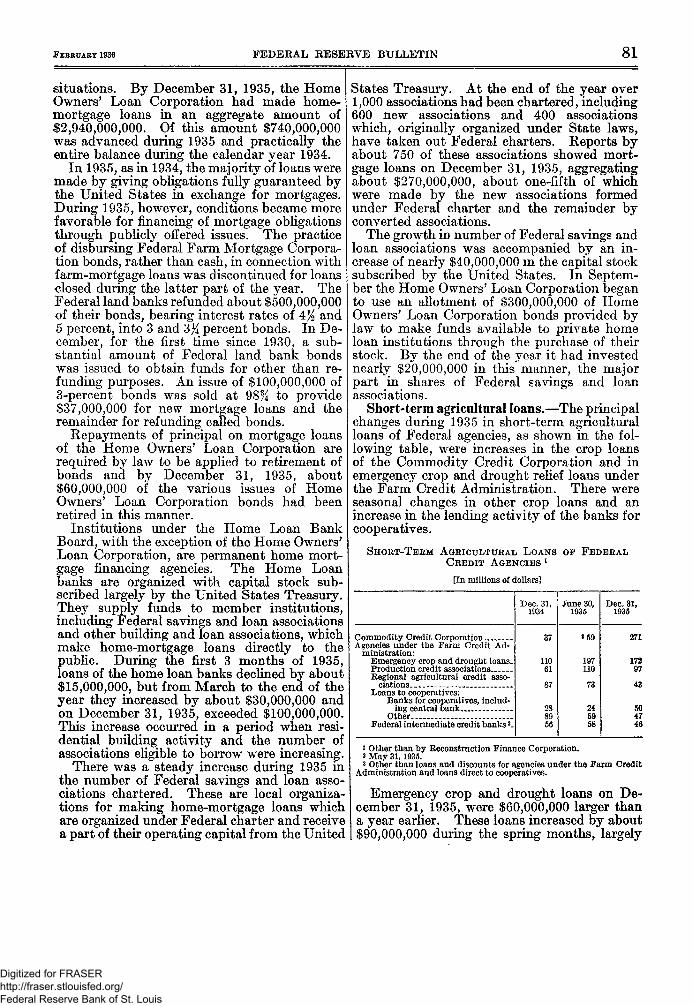
Short-term agricultural loans.—The principalchanges during 1935 in short-term agriculturalloans of Federal agencies, as shown in the fol-lowing table, were increases in the crop loansof the Commodity Credit Corporation and inemergency crop and drought relief loans underthe Farm Credit Administration. There wereseasonal changes in other crop loans and anincrease in the lending activity of the banks forcooperatives.
SHORT-TERM AGRICULTURAL LOANS OF FEDERALCREDIT AGENCIES X
[In millions of dollars]
Commodity Credit Corporation . - .Agencies under the Farm Credit Ad-
ministration:Emergency crop and drought loans-Production credit associationsRegional agricultural credit asso-
ciations . -. _ -_ _Loans to cooperatives:
Banks for cooperatives, includ-ing central bank
OtherFederal intermediate credit banks 3_
Dec. 31,1934
37
11061
87
288956
June 30,1935
»59
197110
73
245958
Dec. 31,1935
271
17297
43
504746
i Other than by Reconstruction Finance Corporation,a May 31, 1935.3 Other than loans and discounts for agencies under the Farm Credit
Administration and loans direct to cooperatives.
Emergency crop and drought loans on De-cember 31, 1935, were $60,000,000 larger thana year earlier. These loans increased by about$90,000,000 during the spring months, largely
Digitized for FRASER http://fraser.stlouisfed.org/ Federal Reserve Bank of St. Louis
82 FEDERAL RESERVE BULLETIN FEBRUARY 193$
as a result of an appropriation in March of$60,000,000 of Federal funds to provide for theneeds of farmers unable to obtain credit else-where for feed, seed, and fertilizer. In theautumn months loans were partially repaid ascrops were harvested. Aggregate loans ofproduction credit associations and of regionalagricultural credit corporations, which are beingreplaced by the production credit associations,showed a seasonal increase of about $30,000,000during the spring for crop and livestockfinancing, as well as for general agriculturalpurposes. In the latter part of the year theseloans declined by $40,000,000.
Loans are made to cooperatives by severallending agencies and for a variety of purposes,including processing and marketing of farmproducts, purchase and distribution of farmsupplies, and furnishing farm business services.These loans may run for longer periods thanthe usual crop loan depending on the creditneeds of the borrowing association. Afterdeclining slightly through June, outstandingloans to cooperatives by the banks for coopera-tives, including the central bank, increased$26,000,000 between June^ and the end of theyear. Greater lending activity resulted in partfrom the Farm Credit Act of 1935, approved inJune, which broadened the lending powers ofthese banks, reduced the interest rates, andprovided for rediscount of loans with theFederal intermediate credit banks. The in-crease in loans by the banks for cooperativeswas more than offset by a decline in otherloans to cooperatives made under the FarmCredit Administration, chiefly direct loans bythe Federal intermediate credit banks.
The Commodity Credit Corporation hasused funds advanced by the ReconstructionFinance Corporation to finance loans on com-modities connected with the adjustment andmarketing programs of the Agricultural Adjust-ment Administration. It has made crop loansdirectly to producers and has also taken overloans made by banks and other private lendingagencies with a purchase guarantee by theCorporation. Lending activities of the Cor-poration during 1935 comprised chiefly thepurchase of producers' notes for 12-cent loanson the 1934 cotton crop. The greater part ofthe increase took place in the summer, whenthe maturity date on these loans was extendedto February 1, 1936, and the Corporation tookover from private lending agencies a substantialportion of their holdings of producers' notes.
On December 31, 1935, the Corporation hadoutstanding loans of about $270,000,000, ascompared with less than $40,000,000 a yearearlier. The loans included more than$250,000,000 on 1934 cotton at 12 cents apound and small amounts on 1935 cotton at10 cents a pound, on the 1935 corn crop, andon gum, turpentine, and rosin.
EXTENDING POWERS CONFERRED BY SECTION10 OF THE GOLD RESERVE ACT OF 1934 ANDSECTION 43 OF THE ACT APPROVED MAY12, 1933
BY THE PRESIDENT OF THE UNITED STATES OFAMERICA
A PROCLAMATION
Whereas, section 10 of the Gold Reserve Actof 1934, approved January 30, 1934 (Public,Numbered 87, Seventy-third Congress), pro-vides among other things:
SEC. 10. * * *(c) All the powers conferred by this section shall
expire two years after the date of enactment of thisAct, unless the President shall sooner declare theexisting emergency ended and the operation of thestabilization fund terminated; but the President mayextend such period for not more than one additionalyear after such date by proclamation recognizing thecontinuance of such emergency.
and whereas, paragraph (b) (2), of section 43,.Title III, of the Act approved May 12, 1933(Public, Numbered 10, Seventy-third Congress)as amended, provides among other things:
(2) * * * The powers of the President specifiedin this paragraph shall be deemed to be separate,,distinct, and continuing powers, and may be exercisedby him, from time to time, severally or together, when-ever and as the expressed objects of this section in hisjudgment may require; except that such powers shallexpire two years after the date of enactment of theGold Reserve Act of 1934 unless the President shallsooner declare the existing emergency ended, but thePresident may extend such period for not more thanone additional year after such date by proclamationrecognizing the continuance of such emergency.and whereas, such emergency which existed onJanuary 30, 1934, the date of approval of saidGold Reserve Act of 1934, has not been termi-nated by international monetary agreement orotherwise, but, on the contrary, continues andhas been intensified in divers respects by un-settled conditions in international commerceand finance and m foreign exchange; and
Digitized for FRASER http://fraser.stlouisfed.org/ Federal Reserve Bank of St. Louis
FEBRUARY 1936 FEDERAL RESERVE BULLETIN 83
Whereas, by virtue of the continuance ofsuch emergency, it is necessary to extend theperiod during which the powers conferred bysaid Section 10 of said Gold Reserve Act of1934 and the powers specified in said paragraph(b) (2), of Section 43, Title III, of said Actapproved May 12, 1933, as amended, may beexercised,
Now, therefore, be it known that I, FranklinD. Roosevelt, President of the United Statesof America, by virtue of the authority vestedin me by the Acts of Congress above set forth,and by virtue of all other authority in mevested, recognizing the continuance of theemergency existing on January 30, 1934, dohereby proclaim, order, direct and declare:That the period of two years within which thepowers conferred by Section 10 of the GoldReserve Act of 1934, and the powers specifiedin paragraph (b) (2), of Section 43, Title III,
of the Act approved May 12, 1933, as amended,may be exercised be, and it hereby is, extendedfor one additional year from January 30, 1936.
In witness whereof I have hereunto set myhand and have caused the seal of the UnitedStates of America to be affixed.
Done at the City of Washington this 10 dayof January, in the year of our Lord nineteenhundred and thirty-six, and of the independenceof the United States of America the onehundred and sixtieth.
[SEAL]
FRANKLIN D ROOSEVELT.
By the President:
CORDELL HULL,Secretary of State,
Digitized for FRASER http://fraser.stlouisfed.org/ Federal Reserve Bank of St. Louis
84 FEDERAL RESERVE BULLETIN FEBRUARY 1936
MEMBERSHIP OF THE FEDERAL RESERVE BOARD,1 1913-1936APPOINTIVE MEMBERS
Federal ReserveDistrict
Effective date ofappointment
Charles S. Hamlin
Paul M. WarburgFrederic A. DelanoW. P. G. HardingAdolph C. Miller.. ._
Albert StraussHenry A. MoehlenpahEdmund PlattDavid C. WillsJohn It. MitchellMilo D. CampbellDaniel R. CrissingerGeorge R. James
Edward H. CunninghamRoy A. YoungEugene MeyerWay land W. MageeEugene R. BlackM. S. SzymczakJ. J. Thomas
Marriner S. Eccles
Boston.
New YorkChicagoAtlantaSan Francisco.
Aug. 10, 1914
-do.-do.-do.-do.
New York...ChicagoNew York__.ClevelandMinneapolis _ChicagoClevelandSt. Louis
ChicagoMinneapolisNew YorkKansas CityAtlantaChicagoKansas City
San Francisco
Oct. 26,1918Nov. 10,1919June 8, 1920Sept. 29,1920May 12, 1921Mar. 14,1923May 1,1923May 14, 1923
doOct. 4, 1927Sept. 16, 1930May 18, 1931May 19, 1933June 14, 1933
do
Nov. 15, 1934
Reappointed 1916 and 1926. Served untilFeb. 3, 1936, on which date his successortook office.
Term expired Aug. 9, 1918.Resigned July 22, 1918.Term expired Aug. 9, 1922.Reappointed in 1924. Reappointed in 1934
from the Richmond district. Served untilFeb. 3, 1936, on which date his successortook office.
Resigned Mar. 15, 1920.Term expired Aug. 9, 1920.Reappointed in 1928. Resigned Sept. 15,1930.Term expired Mar. 4, 1921.Resigned May 12, 1923.Died Mar. 22, 1923.Resigned Sept. 15, 1927.Reappointed in 1931. Served until Feb. 3,
1936, on which date his successor tookoffice.
Died Nov. 28, 1930.Resigned Sept. 1, 1930.Resigned May 10, 1933.Term expired Jan. 24, 1933.Resigned Aug. 15, 1934.Reappointed effective Feb. 3, 1936.Served until Feb. 10, 1936, on which date his
successor took office.Reappointed effective Feb. 3, 1936.
GOVERNORS 1
Charles S. Hamlin Aug. 10, 1914-Aug. 9, 1916.W. P. G. Harding Aug. 10, 1916-Aug. 9, 1922.D. R. Crissinger May 1, 1923-Sept. 15, 1927.Roy A Young Oct. 4, 1927-Sept. 1, 1930.Eugene Meyer_ Sept. 16, 1930-May 10, 1933.Eugene R. Black May 19, 1933-Aug. 15, 1934.Marriner S. Eccles Nov. 15, 1934
VICE GOVERNORS »
F. A. Delano Aug. 10, 1914-Aug. 9, 1916.Paul M. Warburg Aug. 10, 1916-Aug. 9, 1918.Albert Strauss Oct. 26, 1918-Mar. 15, 1920.Edmund Platt July 23, 1920-Sept. 15, 1930.J. J. Thomas Aug. 21, 1934-Feb. 10, 1936.
EX-OFFICIO MEMBERS
SECRETARIES OF THE TREASURY
W. G. McAdoo Dec. 23,1913-Dec. 15, 1918.Carter Glass Dec. 16, 1918-Feb. 1, 1920.David F. Houston Feb. 2, 1920-Mar. 3, 1921.Andrew W. Mellon Mar. 4, 1921-Feb. 12,1932.Ogden L. Mills Feb. 12, 1932-Mar. 4, 1933.William H. Woodin Mar. 4, 1933-Dec. 31, 1933.Henry Morgenthau, Jr_- Jan. 1, 1934-Feb. 1, 1936.
COMPTROLLERS OF THE CURRENCY
John Skelton Williams.. Feb. 2, 1914-Mar. 2, 1921.D. R. Crissinger Mar. 17, 1921-Apr. 30, 1923.Henry M. Dawes May 1, 1923-Dec. 17, 1924.Joseph W. Mclntosh.... Dec. 20,1924-Nov. 20, 1928.J. W. Pole Nov. 21, 1928-Sept. 20, 1932J. F. T. O'Connor May 11, 1933-Feb. 1, 1936.
i Under the provisions of the original Federal Reserve Act the Federal Reserve Board was composed of seven members, including five ap-pointive members, the Secretary of the Treasury, who was ex-officio chairman of the Board, and the Comptroller of the Currency. The originalterm of office was 10 years, and the five original appointive members had terms of 2, 4, 6, 8, and 10 years, respectively. In 1922 the number ofappointive members was increased to six, and in 1933 the term of office was increased to 12 years.
The Banking Act of 1935, approved August 23,1935, changed the name of the Federal Reserve Board to the Board of Governors of the FederalReserve System and provided that thereafter the Board should be composed of seven members; that the appointive members in office on that dateshould continue to serve until February 1,1936, or until their successors were appointed and had qualified; and that the Secretary of the Treas uryand the Comptroller of the Currency should continue to serve as members until February 1,1936. The Act also provided that the Governor andVice Governor of the Board should be known as the Chairman and Vice Chairman, respectively, and that the designation of Chairman and ViceChairman should be for a term of 4 years.
Digitized for FRASER http://fraser.stlouisfed.org/ Federal Reserve Bank of St. Louis
FEDERAL RESERVE BULLETIN 85
NATIONAL SUMMARY OF BUSINESS CONDITIONS
[Compiled Jan. 25 and released for publication Jan. 27]
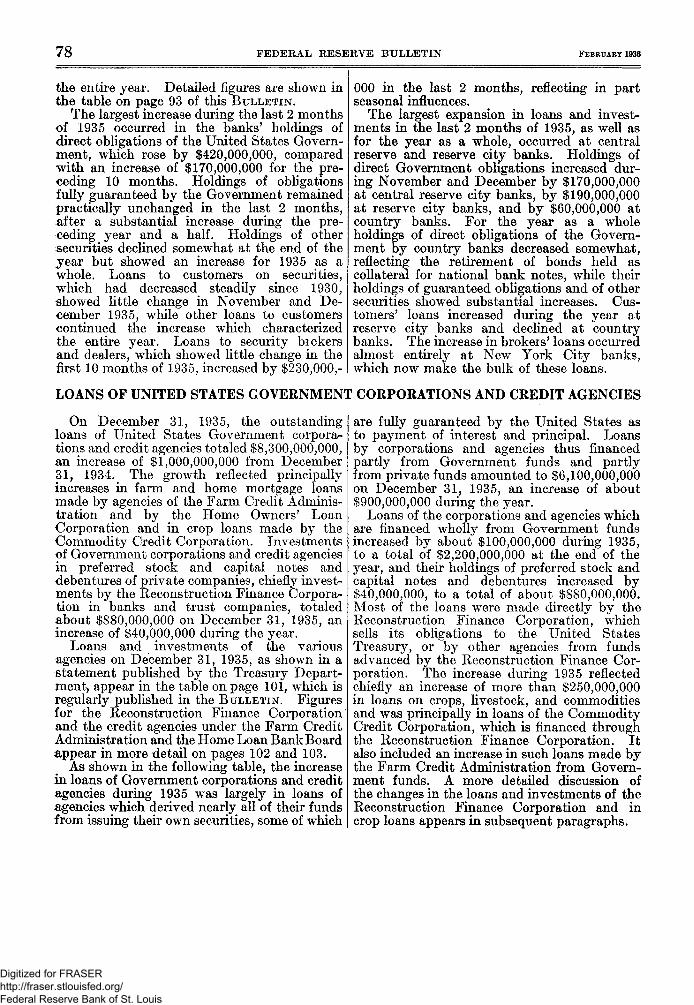
Industrial production and emplovmentshowed a further increase in December, whenallowance is made for the usual seasonalchanges, and distribution of commodities toconsumers was in increased volume.
Production and employment.—The Board'sseasonally adjusted index of industrial produc-tion, which takes account of the considerabledecline that usually occurs in December,advanced from 98 percent of the 1923-25 aver-age in November to 103 percent in December,the highest level reached by this index since thespring of 1930. As in other months during thelast half of 1935, the rise in the index was duein large part to increases in output of durablemanufactures, particularly iron and steel andautomobiles. During the first half of Januaryproduction of steel and automobiles increasedsomewhat, following declines in the holidayperiod. Output at mines was also larger inDecember than in November. Activity atcotton and silk textile mills declined less thanis usual in December, while at woolen millsthere was a more than seasonal decrease inoperation. Output at shoe factories increased.
Factory employment showed little changebetween the middle of November and the mid-dle of December, when a slight decline is cus-tomary. The number employed continued toincrease at steel mills, automobile factories,foundries and machine shops, and at railroadcar-building plants. There was also an increasein employment at shoe factories. Seasonaldeclines were reported by many other impor-tant industries. Factory pay rolls were larger inthe middle of December than a month earlier.
The value of construction contracts awardedincreased sharply in December, according to
figures of the F. W. Dodge Corporation, al-though a decline is usual in that month.There was a further substantial growth in thevolume of awards for publicly financed proj-ects, and residential building also increased.
Distribution.—Sales at department storesand variety stores, as well as sales by chainstores and mail-order houses serving ruralareas, showed larger increases than are usualin December. Freight-car loadings decreasedby less than the usual seasonal amount inDecember, and the Board's adjusted indexincreased from 66 percent of the 1923-25 aver-age in November to 71 percent, continuing theadvance begun last August.
Commodity prices.—The general level ofwholesale prices showed little change duringDecember. In the first 3 weeks of Januarythere was some decline in the general index,reflecting in part lower prices for cotton graygoods, flour, pork, and silk. Prices of hogs,rubber, and petroleum increased.
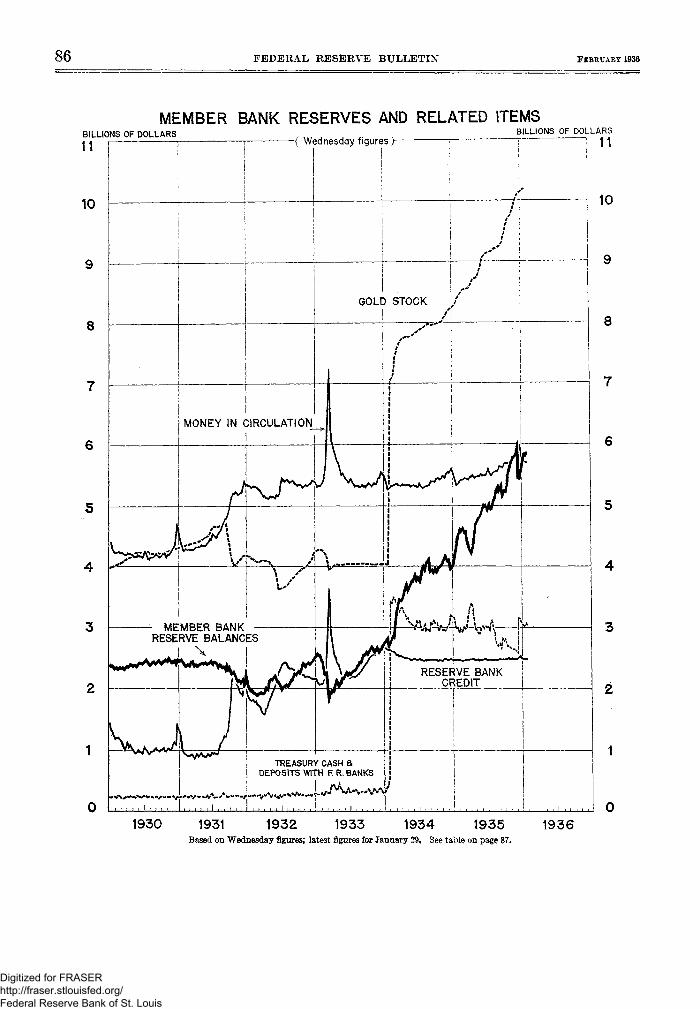
Bank credit.—Excess reserves of memberbanks, which declined by $600,000,000 in thethird week of December, increased by $320,-000,000 dunng the following 5 weeks, reflectingthe usual seasonal return flow of currency fromcirculation, a decline in Treasury balances withthe Federal Reserve banks, and a small increasein monetary gold stock. On January 22 excessreserves totaled $3,030,000,000, as comparedwith the peak of $3,300,000,000 on December11, 1935.
Changes in the condition of reporting memberbanks in leading cities between December 18and January 15 reflected largely the influencesof seasonal factors.
Digitized for FRASER http://fraser.stlouisfed.org/ Federal Reserve Bank of St. Louis
86 FEDERAL RESERVE BULLETIN FEBEUAET 1936
BILLIONS OF DOLLARS
11
10
MEMBER BANK RESERVES AND RELATED ITEMSBILLIONS OF DOLLARS
11~( Wednesday figures)
8
1 - 5
MONEY IN CIRCULATION
TREASURY CASH 8.DEPOSITS WITH F. R. BANKS
1930 1931 1932 1933 1934 1935 1936Based on Wednesday figures; latest figures for January 29, See table on page 87.
Digitized for FRASER http://fraser.stlouisfed.org/ Federal Reserve Bank of St. Louis
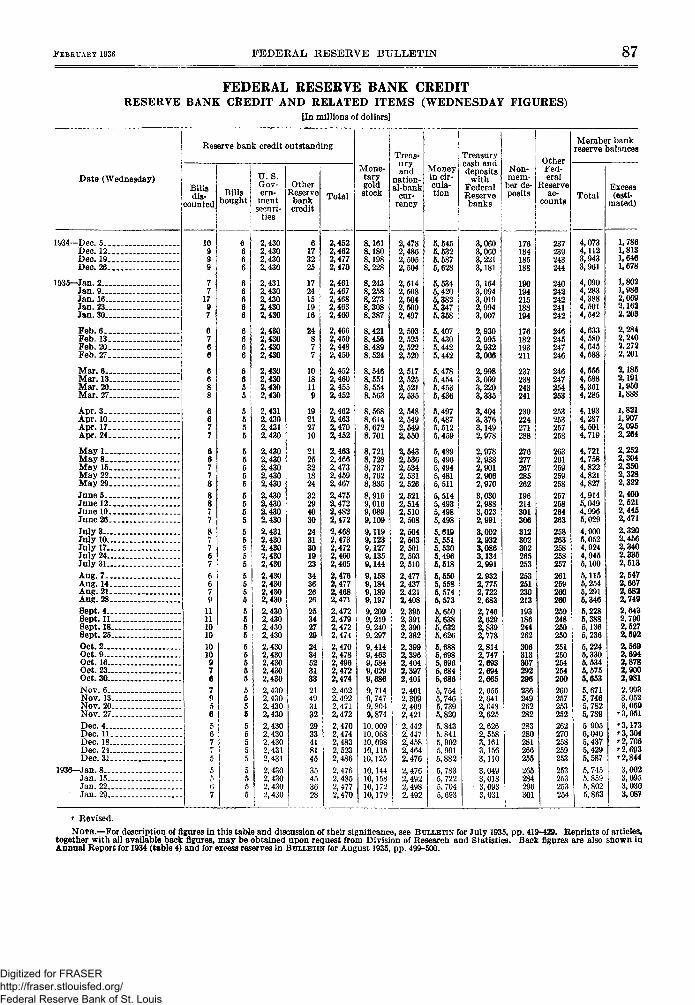
FEBRUARY 1936 FEDERAL RESERVE BULLETIN 87
FEDERAL RESERVE BANK CREDITRESERVE BANK CREDIT AND RELATED ITEMS (WEDNESDAY FIGURES)
[In millions of dollars]
!Reserve bank credit outstanding
Date (Wednesday)Billsdis-
countedBills
bought
U.S.Gov-ern-
mentsecuri-
ties
OtherReserve
bankcredit
Mone-tarygold
Total s t o c k
Treas-uryand
nation-al-bank
cur-rency
Moneyin cir-cula-tion
Treasurycash anddeposits
withFederalReservebanks
Non-mem-ber de-posits
OtherFed-eral
Reserveac-
counts
Member bankreserve balances
TotalExcess(esti-
mated)
1934—Dec. 5. .Dec. 12.Dec. 19.Dec. 26.
1935—Jan. 2...Jan. 9...Jan. 16..Jan. 23..Jan. 30..
Feb. 6-_.Feb. 13..Feb. 20..Feb. 27..
Mar. 6...Mar. 13..Mar. 20..Mar. 27-.
Apr. 3_-Apr. 10..Apr. 17_.Apr. 24 _
May 1. .May 8. .May 15.May 22-May 29.June 5._June 12.June 19_.June 26.July 3July 10—.July 17____July 24....July 31. . . .Aug. 7Aug. 14...Aug. 21- . .Aug.28_-Sept. 4.._.Sept. 11...Sept. 1 8 —Sept. 25...Oct. 2Oct. 9Oct. 16..-.Oct. 23....Oct. 30.—Nov. 6_ —Nov. 13...Nov. 20-.Nov. 27. __Dec. 4Dec. 11--.Dec. 18....Dec. 24....Dec. 31...
1936—Jan. 8...Jan. 15..Jan. 22..Jan. 29..
2,4302,4302,4302,430
2,4312,4302,4302,4302,430
2,4302,4302,4302,430
2,4306 2,4305 2,4305 i 2,430
2,4312,4302,4312,430
2,4302,4302,4302,4302,430
2,4302,4302,4302,430
2,4312,4302,4302,4302,430
2,4302,4302,4302,430
2,4302,4302,430
5 ; 2,430
55
2,4302,4302,4302,4302,4302,4302,4302,4302,430
2,4302,4302,4302,4312,431
2,4302,4302,4302,430
24877
1018119
19212710
2125321824
32294030
2431301923
34362626
25342729
2434523133
21493132
2933418145
35453628
2,4522,4622,4772,470
17 2,46124 2,46715 ! 2,46819 i 2,46316 2,460
2,4662,4502,4482,450
2,4522,4602,4552,452
2,4622,4632,4702,452
2,4632,4662,4732,4592,467
2,4752,4722,4822,472
2,4682,4732,4722,4602,465
2,4762,4772,4682,471
2,4722,4792,4722,474
2,4702,4782,4962,4722,474
2,4622,4922,4712,472
2,4702,4742,4832,5232,486
2,4762,4852,4772,470
8,1618,1808,1988,228
8,2438,2588,2738,3088,387
8,4218,4568,4898,524
8,5468,5518,5548,563
8,5688,6148,6728,701
8,7218,7288,7378,7628,835
8,9169,0169,0899,109
9,1199,1239,1279,1359,144
9,1589,1849,1899,197
9,2099,2199,2409,297
9,4149,4639,5849,6299,686
9,7149,7479,8049,874
10, 00910,06810, 09810,11510,125
10,14410,15810,17210,179
2,4782,4862,5052,504
2,5142,5082,5042,5002,497
2,5032,5252,5222,520
2,5172,5252,5212,535
2,5482,5492,5492,550
2,5432,5362,5342,5312,526
2,5212,5142,5102,5082,5042,5032,5012,5032,5102,4772,4372.4212,408
2,3952,3912,3902,382
2,3992,3962,4042,3972,4012,4012,3992,4092,421
2,4422,4472,4582,4642,4762,4762,4922,4982,492
5,5455,5325,5875,628
5,5345,4205,3825,3475,358 ;
5,407 i5,4305,4425,442
5,4785,4545,4535,436
5,4975,4875,5125,459
5,4895,4965,4945,4815,511
5,5145,4935,4985,498
5,8195,5515,5305,4965,518
5,5505,5585,574 !5,573
5,6505,6385,6325,626
3,0603,0603,2213,181
3,1643,0943,0192,9943,007
2,9302,9952,9323,006
2,9983,0093,2203,335
3,4043,3763,1492,978
2,9782,9382,9012,9062,970
5,6985,6965,6845,6865,7545,7465,7395,820
5,8435.8415,9025,9915,882
5,7835,7225, 7045,693
3,0232,991
3,0022,9323,0863,1342,991
2,9322,7752,7222,683
2,7462,6292,8392,7782,8142,7472,6932,6942,665
2,6552,6412,6482,625
2,6262,5583,1613,1563,110
3,0493,0183,0933,031
176184185188
190194215188194
176182193211
237238243241
230224271
276277267285262196214301306312302302265253
253251230213193188244262306313307292296236249262282283280281266255
265284296301
237239243244
240242242241242
246245247246
246247254253
253253257258
263261259259258257258264263
258263258258257261259260260259248250250251250254254260260257253252262270258259253253253253254
4,0734,1123,9433,961
4,0904,2834,3884,5014,542
4,6334,5804,6454,588
4,5554,5884,3614,285
4,1934,2874,5014,719
4,7214,7584,8224,8214,8274,9145,0494,9966,029
4,9005,0524,9244,9455,100
5,1155,2546,2915,346
6,2286,3885,1365,236
5,2245,3305, 5345,5755,8535,6715,7465,7825,789
5 9056,0405,4375,4295,587
5, 7455,8595,8025,1
1,7861,8131,6461,678
1,8021,9862,0692,1622,203
2,2842,2402,2722,201
2,1852,1911,9501,888
1,8211,9072,0962,264
2,2522,3042,3502,3282,322
2,4002,5212,4452,471
2,3202,4562,3402,3362,513
2,5472,6672,6822,7492,6432,7902,5272,502
2,5692,6942,8782,9002,981
3,0523,069
'3,051
'3,173'3,304'2,706'2,693'2,844
3,0023,0953,0303,087
' Revised.NOTE.—For description of figures in this table and discussion of their significance, see BULLETIN for July 1935, pp. 419-429. Reprints of articles,
together with all available back figures, may be obtained upon request from Division of Research and Statistics. Back figures are also shown inAnnual Report for 1934 (table 4) and for excess reserves in BULLETIN for August 1935, pp. 499-500.
Digitized for FRASER http://fraser.stlouisfed.org/ Federal Reserve Bank of St. Louis
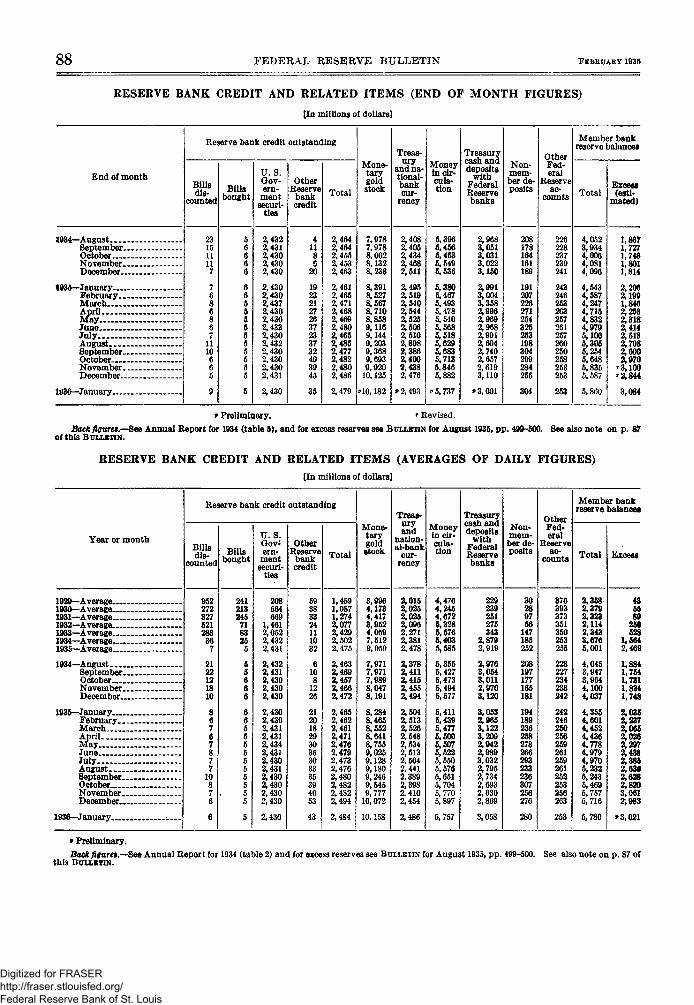
88 FEDERAL RESERVE BULLETIN FEBRUARY 1936
RESERVE BANK CREDIT AND RELATED ITEMS (END OF MONTH FIGURES)
[In millions of dollars]
End of monthBillsdis-
counted
Reserve bank credit outstanding
Billsbought
U.S.Gov-ern-
mentsecuri-
ties
Other
bankcredit
Total
Mone-tarygoldstock
Treas-ury
and na-tional-bankcur-
rency
Moneyin cir-cula-tion
Treasurycash anddeposits
withFederalReservebanks
Non-mem*ber de-posits
OtherFed-eral
Reserveac-
counts
Member bankreserve balances
TotalExcess(esti-
mated)
1934—AugustSeptember.October..-.November.December.
1935—January....February..MarchAprilMayJuneJulyAugustSeptember.October-November.December.
1936—January
2,4322,4312,4302,4302,430
2,4302,4302,4372,4302,4302,4332,4302,4322,4302,4302,4302,431
2,430
2,4642,4642,4552,4532,463
2,4612,4652,4712,4682,4692,4802,4652,4852,4772,4822,4802,486
2,479
7,9787,9788,0028,1328,238
8,3918,5278,5678,7108.8589,1169,1449,2039,3689,6939,920
10,125
P10, 182
2,4082,4052,4342,4682,511
2,4952,5192,5402,5442,5252,5062,5102,898
2,4002,4382,476
2,493
5,3965,4565,4535,5495,536
5,3805,4675,4935,4785,5405,5685,5185,6295,6835,7135,8465,882
"5,737
2,9683,0513,0313,0223,150
2,9913,0043,3582,996
2,9682,9912,6942,7402,6572, 6193,110
»3,001
208173164161189
191207226271254325253198304299284255
304
226228237239241
243246253263257261257260250258253253
253
4,0523,9344,0064,0814,096
4,5434,5874,2474,7154,8324,9795,1005,3055,2545,6485,8355,587
5,860
1,8671,7271,7481,8011,814
2,2062,1991,8462,2532,3182,4142,5132,7082,6002,970
'3,100'2,844
3,084
» Preliminary. r Revised.
Back figures.—See Annual Report for 1934 (table 5), and for excess reserves sea BULLETIN for August 1935, pp. 499-500. See also note on p. 87of this BULLETIN.
RESERVE BANK CREDIT AND RELATED ITEMS (AVERAGES OF DAILY FIGURES)[In millions of dollars]
Year or month
Reserve bank credit outstanding
Billsdis-
countedBills
bought
U.S.Gov-ern-mentsecuri-
ties
OtherReserve
bankcredit
Total
Mone-tarygoldstock
Treas-uryand
nation-al-bank
cur-rency
Moneyin cir-cula-tion
Treasurycash anddeposits
withFederal
banks
Non-mem-ber de-posits
OtherFed-eral
Reserveac-
counts
Member bankreserve balance!
Total Excess
1929—Average1930—Average1931—Average1932—Average1933—Average1934—Average1935—Average
1934—AugustSeptember-OctoberNovember-December
1935—JanuaryFebruary. . .March ,AprilMay ,JuneJulyAugustSeptember...OctoberNovember—.December—
1936—January
952272327521283367
2122121810
86767877
1087
241213245718325
564669
1,4612,0522,4322,431
2,4322,4312,4302,4302,430
2,4302,4302,4312,4312,4342,4312,4302,4312,4302,4302,4302,430
2,430
1,4591,0871,2742,0772,4292.5022,475
2,4632,4692,4572,4662,472
2,4652,4622,4612,4712,4762,4792,4732,4762,4802,4822,4822,494
2,484
3,9964,1734,4173,9524,0597,5129,059
7,9717,9717,9898,0478,191
8,2848,4658,5528,6418,7559,0259,1289,1809,2469,5459,777
10,072
10,158
2,0152,0252,0252,0962,2712,3812,478
2,3782,4112,4152,4552,494
2,5042,5132,5262,5482,5342,5132,5042,4412,3892,3982,4102,454
2,486
4,4764,2454,6725,3285,5765,4035,585
5,3555,4275,4735,4945,577
5,4115,4395,4775,5005,5075,5225,5505,5765,6515,7045,7705,897
5,757
229239251275343
2,8792,919
2,9763,0543,0112,9703,120
3,0532,9653,1223,2092,9422,9893,0322,7952,734
2,6302,869
3,058
30289756147185252
208197177165181
194189236258278266293233236307256276
280
376393373351350253255
228227234238242
242246250256259261259261252253256263
253
2,3582,3792,3232,1142,3433.6765,001
4,0453,9473,9644,1004,037
4,3554,6014,4524,4364,7784,9794,9705,2325,2435,4695,7575,716
5,780
435589256528
1,6642,469
1,8841,7541,7311,8341,748
2,0302,2372,0652,0262,2972,4382,3852,63a2,6282,8203,0612,983
*3,021
» Preliminary.
Back figures.—See Annual Report for 1934 (table 2) and for excess reserves see BULLETIN for August 1935, pp. 499-500.this BULLETIN.
See also note on p. 87 of
Digitized for FRASER http://fraser.stlouisfed.org/ Federal Reserve Bank of St. Louis
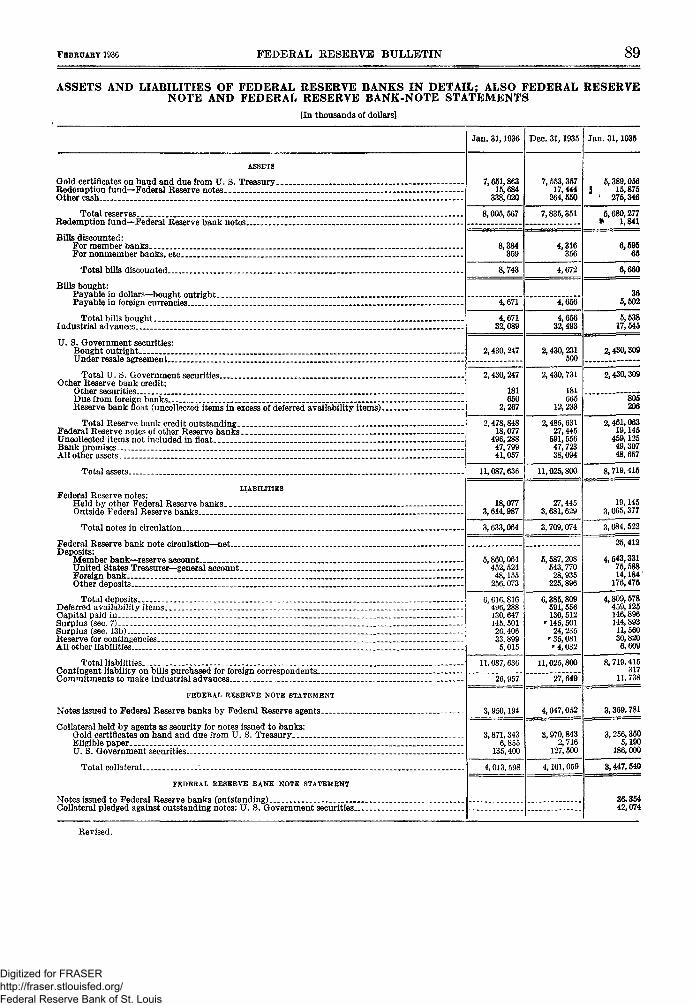
FEBRUARY 1936 FEDERAL RESERVE BULLETIN 89
ASSETS AND LIABILITIES OF FEDERAL RESERVE BANKS IN DETAIL; ALSO FEDERAL RESERVENOTE AND FEDERAL RESERVE BANK-NOTE STATEMENTS
[In thousands of dollars]
Jan. 31,1936 Dec. 31,1935 Jan. 31,1935
ASSETS
Gold certificates on hand and due from U. S. Treasury.Redemption fund—Federal Reserve notesOther cash
Total reservesRedemption fund—Federal Reserve bank notes-
Bills discounted:For member banksFor nonmember banks, etcTotal bills discounted..
Bills bought:Payable in dollars—bought outright.Payable in foreign currencies
Total bills bought.Industrial advances
U. S. Government securities:Bought outrightUnder resale agreement...
Total U. S. Government securitiesOther Reserve bank credit:
Other securitiesDue from foreign banks _Reserve bank float (uncollected items in excess of deferred availability items)..
Total Reserve bank credit outstanding ..Federal Reserve notes of other Reserve banksUncollected items not included in float _Bank premises.All other assets _
Total assets-
Federal Reserve notes:Held by other Federal Reserve banks _Outside Federal Reserve banks
Total notes in circulation.
Federal Reserve bank note circulation—netDeposits:
Member bank—reserve accountUnited States Treasurer—general account..Foreign bank _Other deposits _
Total depositsDeferred availability items.Capital paid inSurplus (sec. 7)Surplus (sec. 13b)Reserve for contingencies.._All other liabilities
Total liabilitiesContingent liability on bills purchased for foreign correspondents.Commitments to make industrial advances
FEDERAL RESERVE NOTE STATEMENT
Notes issued to Federal Reserve banks by Federal Reserve agents
Collateral held by agents as security for notes issued to banks:Gold certificates on hand and due from U. S. TreasuryEligible paperU. S. Government securities
Total collateral.
FEDERAL RESERVE BANK NOTE STATEMENT
Notes issued to Federal Reserve banks (outstanding) _Collateral pledged against outstanding notes: U. S. Government securities..
7,651,86315,684
338,020
8,005,567
8,384
8,743
4,671
4,671
2,430,247
2, 430,247
181650
2,267
2,478,84818,077
496,28847,79941,057
11,087,636
18,0773,614,987
3, 633,064
5,860,064452,524
48,155256,073
6, 616,816496,288130, 647145,50126, 40633,899
5,015
11,087,636
26," 957
3, 950,194
3,871,3436,855
135,400
4, 013, 598
7,553,35717,444
264,550
5,389,0561 15,875
f 276,346
7,835,351
4,316356
4,672
4,656
4,65632,493
2,430,231500
2,430,731
181665
12,233
2,485,63127,445
591,55647,72338,094
11,025,800
27,4453,681,629
3,709,074
5,587, 208543,770
28,935225,896
6,385,809591,556130, 512
' 145,50124,235
r 35,081' 4,032
11,025,800
27," 649"
4,047,052
3,970,8432,716
127,500
4,101,059
5,680,277* 1,841
65
6,660
5,502
5,53817,545
2,430,309
2,430,309
805206
2,461,06319,145
459,12549,30748,657
8,719,415
19,1453,065,377
~~3,084,522
26~412
4,543,33175,58814,184'
176,475
4,809,578459,125146,896144,893
11,56030,820
8,719,415317
11,738
3,369,781
3,256,3505,190
186,000
3,447,540
36,35442,074
Revised.
Digitized for FRASER http://fraser.stlouisfed.org/ Federal Reserve Bank of St. Louis
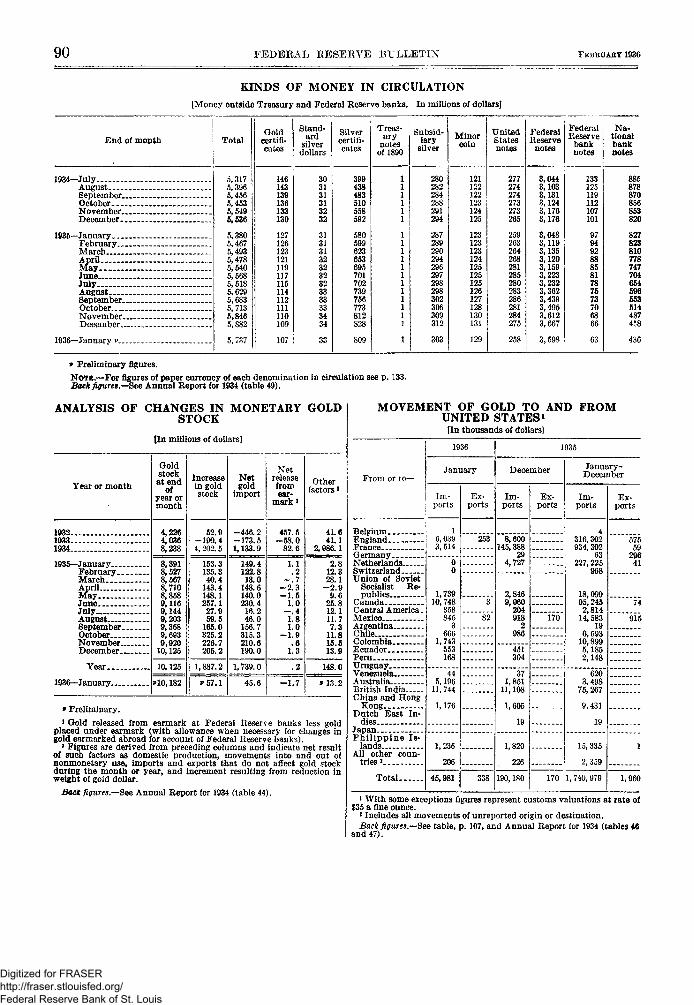
90 FEDERAL RESERVE BULLETIN FEBRUARY 1936
KINDS OF MONEY IN CIRCULATION[Money outside Treasury and Federal Reserve banks. In millions of dollars]
End of month TotalGold
certifi-cates
Stand-ard
silverdollars
Silvercertifi-
Treas-ury
notesof 1890
Subsid-iary
silver
280282284288291294
287289290294296297298298302306309312
303
Minorcoin
121122122123124125
123123123124125125125126127128130131
129
UnitedStatesnotes
277274274273273265
259263264268281285280283286281284275
258
FederalReserve
notes
3,0443,1033,1313,1243,1763,176
3,0483,1193,1353,1203,1593,2233,2323,3623,4393,4953,6123, 667
3,598
FederalReserve
banknotes
133125119112107101
979492888581787673706866
63
Na-tionalbanknotes
1934—JulyAugustSeptember.October. _.November.December.
1935—January...February. ,MarchAprilMayJuneJulyAugustSeptember.OctoberNovember.December.
1936—January *>_.
6,3175,3965,4565,4535,5495,536
5,3805,4675,4935,4785,5405,5685,5185,6295,6835,7136,8465,882
5, 737
146143139136133130
127126123121119117115114112111110109
107
303131313232
313131323232323333333434
33
399438483510558
580599623653695701702739756773812828
809
* \l S11111111111
1
878870856853820
827823810778747704654596553514487458
436
» Preliminary figures.
NOTE.—For figures of paper currency of each denomination in circulation see p. 133.Back figures.See Annual Report for 1934 (table 49).
ANALYSIS OF CHANGES IN MONETARY GOLDSTOCK
[In millions of dollars]
Year or month
1932...1933..-1934
1935—JanuaryFebruaryMarchAprilMayJuneJulyAugustSeptemberOctoberNovemberDecember
Year
1936—January.
Goldstockat end
ofyear ormonth
4,2264,0368,238
8,3918,5278,5678,7108,8589,1169,1449,2039,3689,6939,920
10,125
Increasein goldstock
52.9-190.44, 202. 5
153.3135.340.4
143.4148.1257.127.959.5
165.0325.2226.7205.2
1,887.2
Netgold
import
-446.2-173.51,133.9
149.4122.813.0
148.6140.0230.4
16.246.0
156.7315.3210.6190.0
Netreleasefromear-
mark i
457.5-58 .0
82.6
1.1.2
- . 7- 2 . 3- 1 . 5
1.0- . 41.81.0
- 1 . 9.6
1.3
Otherfactors >
41.641.1
2,986.1
2.812.328.1
- 2 . 99.6
25.812.111.77.3
11.816.613.9
v Preliminary.1 Gold released from earmark at Federal Reserve banks less gold
placed under earmark (with allowance when necessary for changes ingold earmarked abroad for account of Federal Reserve banks).
'Figures are derived from preceding columns and indicate net resultof such factors as domestic production, movements into and out ofnonmonetary use, imports and exports that do not affect gold stockduring the month or year, and increment resulting from reduction inweight of gold dollar.
Back figures—See Annual Report for 1934 (table 44).
MOVEMENT OF GOLD TO AND FROMUNITED STATES1
[In thousands of dollars}
From or to—
BelgiumEnglandFrance - .GermanyNetherlandsSwitzerlandUnion of Soviet
Socialist Re-publics
CanadaCentral America.MexicoArgentinaChileColombiaEcuadorPeruUruguayVenezuelaAustraliaBritish IndiaChina and Hong
KongDutch East In-
diesJapanPhilippine Is-
landsAll other coun-
tries*
Total
1936
January
Im-ports
16,0393,514
00
1,73910,748
358845
3666
1,743553168
445,196
11,744
1,176
1,236
206
45,981
Ex-ports
253
3
82
338
1935
December
Im-ports
8,600145,388
294,727
2,8469,060
204918
2986
451304
371,851
11,108
1,605
19
1,820
226
190,180
Ex-ports
170
170
January-December
Im-ports
4316,302934, 302
63227,225
968
18,09995,2452,814
14,58319
6,59310,8995,1852,148
6203,498
75, 267
9,431
19
15, 335
2,359
1, 740,979
Ex-ports
bib59
29641
74
915
1
1,960
i With some exceptions figures represent customs valuations at rate of$35 a fine ounce.
2 Includes all movements of unreported origin or destination.Back figures.—See table, p. 107, and Annual Report for 1934 (tables 46
and 47).
Digitized for FRASER http://fraser.stlouisfed.org/ Federal Reserve Bank of St. Louis
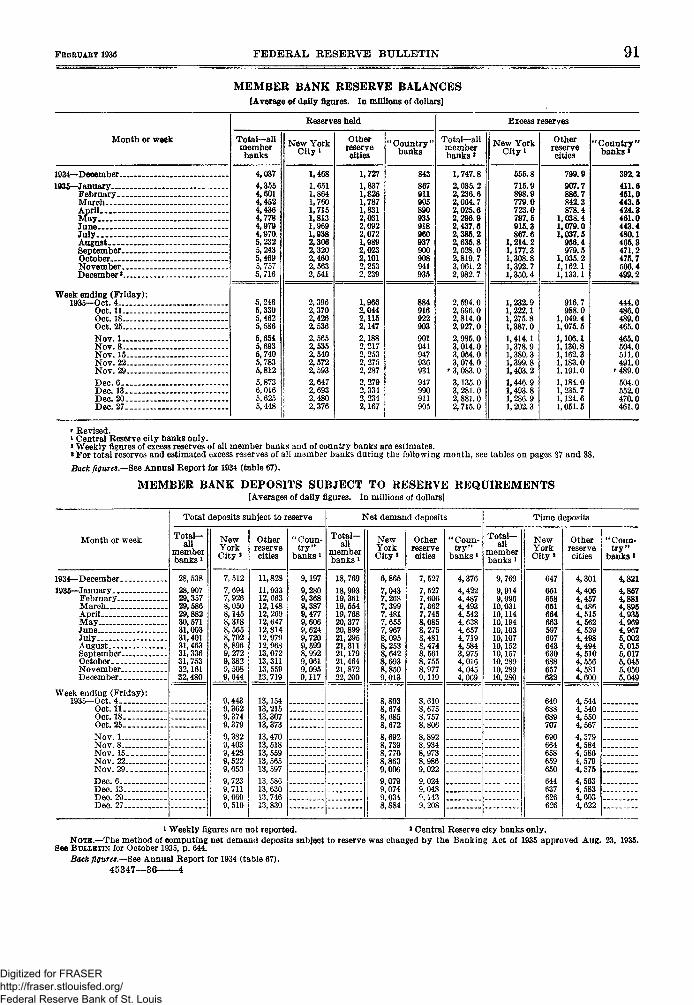
FEBRUARY 1936 FEDERAL RESERVE BULLETIN 91
MEMBER BANK RESERVE BALANCES[Average of daily figures. In millions of dollars]
Month or week
Reserves held
Total—allmemberbanks
New YorkCity*
Otherreservecities
'Country"banks
Excess reserves
Total-allmemberbanks J
New YorkCity i
Otherreservecities
'Country"banks'
1934—December1935—January
FebruaryMarchAprilMayJuneJulyAugustSeptemberOctoberNovemberDecember*
Week ending (Friday)1935—Oct. 4.
Oct. 11Oct. 18Oct. 25Nov. 1Nov. 8Nov. 15Nov. 22Nov. 29Dec. 6_Dec. 13Dec. 20Dec. 27
4,037
4,3554,6014,4524,4364,7784,9794,9705,2325,2435,4695,7575,716
1,4681,6511,8641,7601,7151,8131,9691,9382,3062,3202,4602,5632,541
1,7271,8371,8261,7871,8312,0312,0922,0721,9892,0232,1012,2532,239
843
867911905890935918960937900908941935
5,2465,3305,4625,5865,6545,6935,7405,7835,8125,8736,0165,6255,448
2,3962,3702,4262,5362,5652,5352,5402,5722,5932,6472,6932,4802,376
1,9662,0442,1152,1472,1882,2172, 2532, 2752,2872,2792,3342,2342,167
884916922903901941947936931947990911905
1,747.82,035.22, 236.62,064.72,025.62,296.92,437.82,385.22,635.82, 628.02,819.73,061. 22,982. 7
2, 594. 02,696. 02,814.02,927.02,985. 03,014.03,054.03, 074.0* 3,083. 03,135.03,281.02,881.02,715.0
555.8715.9
779.0723.0797.5915.3867.6
1,214.21,177.31,308.81,392.71,350.4
1,232.91,222.11, 275. 81,387. 01,414.11,378.91,380. 31,399.81,403. 21,446.91,493.81,286. 91,202. 3
799.9907.7886.7842.3878.4
1,038.41,079.01,037.5956.4979.5
1,035.21,162.11,133.1
916.7988.0
1.049.41.075.51,106.11,130.81,162. 31,183.01,191.0
1,184.01, 235. 71.124.61, 051. 5
392.2411.6451.0443.5424.3461.0443.4480.1465.3471.2475.7506.4499.2
444.0486.0489.0465.0465.0504.0511.0491.0
r 489.0504.0552.0470.0461.0
* Revised.* Central Reserve city banks only.* Weekly figures of excess reserves of all member banks and of country banks are estimates.'For total reserves and estimated excess reserves of all member banks during ths following month, see tables on pages 87 and 88.
Back figures.—See Annual Report for 1934 (table 67).
MEMBER BANK DEPOSITS SUBJECT TO RESERVE REQUIREMENTS[Averages of daily figures. In millions of dollars]
Month or week
1934—D ecember1935—January
FebruaryMarchAprilMayJuneJuly _AugustSeptemberOctober _"NTnvflTnfafirDecember _.
Week ending (Friday):1935—Oct. 4
Oct. 11Oct. 18Oct. 25Nov 1Nov. 8 „Nov. 15Nov. 22Nov. 29Dec. 6Dec. 13Dec. 20 . . „Dec 27
Total deposits subject to reserve
Tota l -all
memberbanks l
28, 53828,90729,35729,68629,88230,57131,00331,40131,46331, 33631,75332,16132,480
NewYorkCity *
7,5127,6947,9268,0508,1458,3188,5658,7028,8969,2729,3829,5089,644
9,4439,3629,3749,3799,3829,4039,4289,5229,6569,7239,7119,6609,510
Otherreservecities
11,82811,93312,06312,14812, 26012,64712,81412,97912,96813,07213,31113, 55913, 719
13,15413, 21513,30713,37313,47013,51813,55913,56513, 59713, 58613, 63013, 74613, 830
"Coun-try"
banks*
9,1979,2809,3689,3879,4779,6069,6249,7209,5998,9929,0619,0959,117
Net demand deposits
Tota l -all
memberbanks1
18,76918,99319,36119,55419,76820, 37720,89921, 29521, 31121,17921, 46421,87222, 200
NewYorkCity*
6,8657,0437,2687,3997,4817,6557,9678,0958,2538,6428,6938,8509,013
8,8038,6748,6858,6728,6928,7398,7708,8639,0069,0799,0749,0348,884
Otherreservecities
7,5277,5277,6067,6627,7458,0858,2758,4818,4748,5618,7558,9779,119
8,6108,6758,7578,8068,8928,9348,9738,9869,0229,0249,0489,1439, 208
"Coun-try"
banks l
4,3764,4224,4874,4934,5424,6384, 6574,7194,5843,9754,0164,0454,069
Time deposits
Total -all
memberbanks *
9,7699,9149,996
10,03110,11410,19410,10310,10710,15210,15710, 28910, 28910, 280
NewYorkCity a
647651658651664663597607643630688657632
640688689707690664658659650644637626626
Otherreservecities
4,3014,4064,4574,4864,5154,5624,5394,4984,4944,5104,5564,5814,600
4,5444,5404,5504,5674,5794,5844,5864,5794,5754,5634,5834,6034,622
"Coun-t ry"
banks i
4,8214,8574,8814,8954,9354,9694,9675,0025,0155,0175,0455,0505,049
i Weekly figures are not reported. J Central Reserve city banks only.NOTE.—The method of computing net demand deposits subject to reserve was changed by the Banking Act of 1935 approved Aug. 23, 1935.
See BULLETIN for October 1935, p. 644.
Back figures.—See Annual Report for 1934 (table 67).45347—36 4
Digitized for FRASER http://fraser.stlouisfed.org/ Federal Reserve Bank of St. Louis
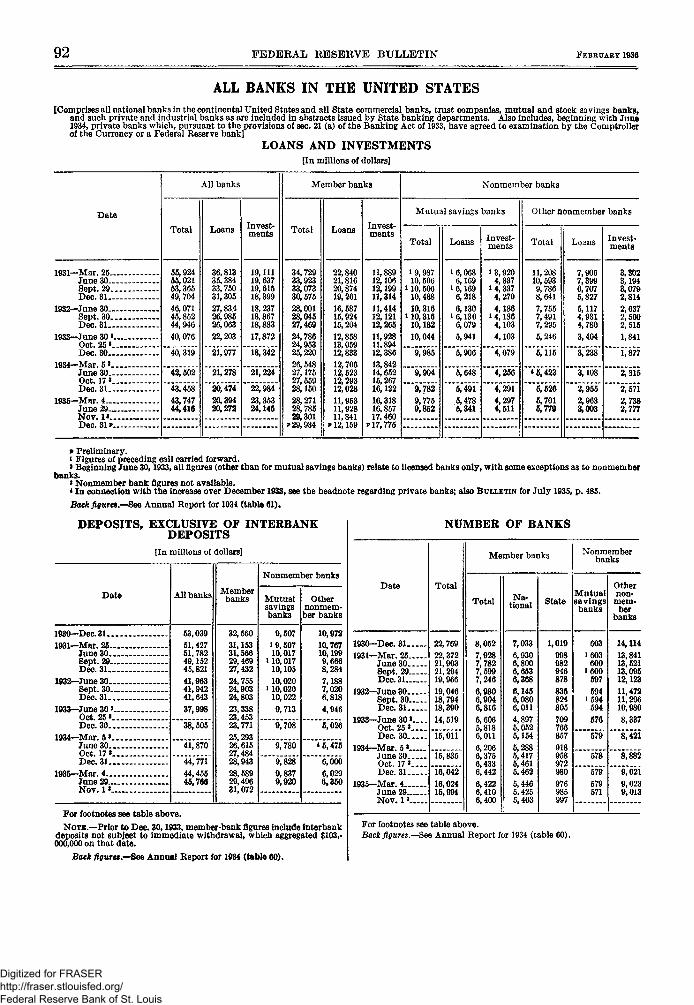
92 FEDERAL RESERVE BULLETIN FEBRUARY 1935
ALL BANKS IN THE UNITED STATES[Comprises all national banks in the continental United States and all State commercial banks, trust companies, mutual and stock savings banks,
and such private and industrial banks as are included in abstracts issued by State banking departments. Also includes, beginning with June1934, private banks which, pursuant to the provisions of sec. 21 (a) of the Banking Act of 1933, have agreed to examination by the Comptrollerof the Currency or a Federal Reserve bank]
LOANS AND INVESTMENTS[In millions of dollars]
Date
1931—Mar. 25June 30 . .Sept 29Dec. 31
1932—June 30Sept. 30Dec. 31
1933—June 30 >Oct. 25»Dec. 30
1934—Mar. 5»June 30Oct. 17 »Dec. 31
1935—Mar. 4June 29Nov. 1*Dec. 31»
All banks
Total
55,92455,02153,36549,70446,07145,85244,94640,076
40,319
42,502
43,45843,74744,416
Loans
36,81335,38433,75031,30527,83.426,98526,06322,203
21,977
21,278
20,47420,39420,272
Invest-ments
19, 11119, 63719,61518,39918,23718,86718,88317,872
18,342
21,224
22,98423,35324,145
Member banks
Total
34,72933,92333,07330,57528,00128,04527,46924,78624,95325,22026, 54827,17527,55928,15028,27128, 78529,301
* 29,934
Loans
22,84021,81620,87419,26116,58715,92415,20412,85813,05912,83312,70612,52312,29312,02811,95311,92811,841
p 12,159
Invest-ments
11,88912,10612,19911,31411,41412,12112,26511,92811,89412,38613,84214,65215,26716,12216,31816,85717,460
v 17,775
Nonmember banks
Mutual savings banks
Total
i 9,98710,506
i 10,50610,48810,316
U0,31610,18210,044
9,985
9,904
9,7829,7759,852
Loans
i 6,0686,169
i 6,1696,2186,130
i 6,1306,0795,941
5,906
5,648
5,4915,4785,341
Invest-ments
» 3,9204,337
i 4,3374,2704,186
i 4,1864,1034,103
4,079
4,256
4,2914,2974,511
Other nonmember banks
Total
11,20810,5939,7868,6417,7557,4917,2955,246
5,115
«5,423
5,5265,7015,779
Loans
7,9067,3996,7075,8275,1174,9314,7803,404
3,238
3,108
2,9552,9633,003
Invest-ments
3,3023,1943,0792,8142,6372,5602,5151,841
1,877
2,315
2,5712,7382,777
v Preliminary.i Figures of preceding call carried forward.» Beginning June 30,1933, all figures (other than for mutual savings banks) relate to licensed banks only, with some exceptions as to nonmember
banks.» Nonmember bank figures not available.* In connection with the increase over December 1933, see the headnote regarding private banks; also BULLETIN for July 1935, p. 485.
Back figures.—See Annual Report for 1934 (table 61).
DEPOSITS, EXCLUSIVE OF INTERBANKDEPOSITS
[In millions of dollars]
Date
1930—Dec. 311931—Mar. 25
June 30. .Sept. 29Dec. 31
1932—June 30Sept. 30Dec. 31
1933—June 30»Oct. 25 * . .Dec. 30
1934—Mar. 5 >June 30Oct. 17*Dec. 31
1935—Mar. 4June 29Nov. 1»
All banks
53,03951,42751,78249,15245,82141,96341,94241,64337,998
38,505
41,870
44,77144,45545,766
Memberbanks
32,56031,15331,56629,46927,43224,75524,90324,80323,33823,45323,77125,29326,61527,48428,94328,58929,49631,072
Nonmember banks
Mutualsavingsbanks
9,507i 9,50710,017
i 10,01710,10510,020
i 10,02010,0229,713
9,708
9,780
9,8289,8379,920
Othernonmem-ber banks
10,97210,76710,1999,6668,2847,1887,0206,8184,946
5,026
<5,475
6,0006,0296,350
For footnotes see table above.
NOTE.—Prior to Dec. 30,1933, member-bank figures include interbankdeposits not subject to immediate withdrawal, which aggregated $103,-000,000 on that date.
Back figure*.—See Annual Report for 1934 (table 60).
NUMBER OF BANES
Date
1930—Dec. 311931—Mar. 25
June 30Sept. 29Dec. 31
1932—June 30Sept. 30Dec. 31
1933—June 30».—Oct. 25 *Dec. 30
1934—Mar 5 *June 30Oct. 17» . .Dec. 31
1935—Mar. 4June 29Nov. 1». .
Total
22,76922,37221,90321,29419,96619,04618,79418,39014,519
15,011
15,835
16,04216,02415,994
Member banks
Total
8,0527,9287,7827,5997,2466,9806,9046,8165,6065,8186,0116 2066,3756,4336,4426,4226,4106,400
Na-tional
7,0336,9306,8006,6536,3686,1456,0806,0114,8975,0525,1545,2885,4175,4615.4625,4465,4255,403
State
1,019998982946878
835824805
709766857
918958972980
976985997
Nonmemberbanks
Mutualsavingsbanks
603
1603600
1600597
5941594
594
576
579
578
579579571
Othernon-
mem-ber
banks
14,11413,84113,52113,09512,12311,47211,29610,9808,337
8,421
8,882
9,0219,0239,013
For footnotes see table above.Back figures.—See Annual Report for 1934 (table 60).
Digitized for FRASER http://fraser.stlouisfed.org/ Federal Reserve Bank of St. Louis
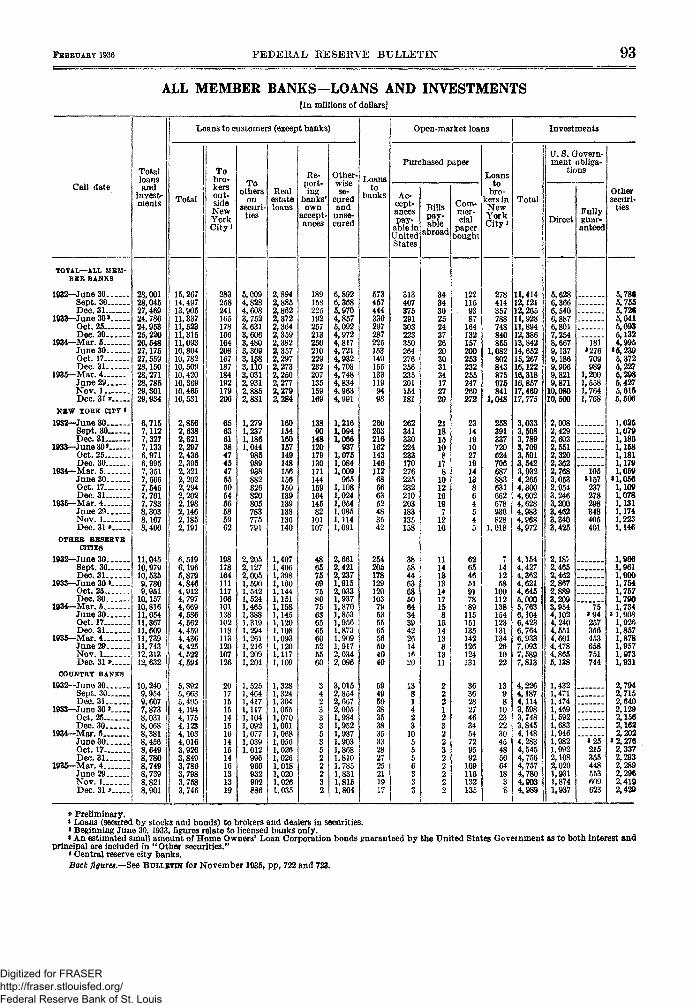
FEBBTJARY 1936 FEDERAL RESERVE BULLETIN 93
ALL MEMBER BANKS-LOANS AND INVESTMENTS[In millions of dollars]
Call date
Total
andinvest-ments
Loans to customers (except banks)
Total
Tobro-kersout-sideNewYorkCityi
Toothers
onsecuri-
ties
Realestateloans
Re-port-ing
banks'own
accept-ances
Other-wisese-
curedand
unse-cured
Loansto
banks
Open-market loans
Purchased paper
Ac-cept^ancespay-able inUnitedStates
313407375291303223350264276256235201154181
262341330224233170276225232210203183135158
385844636850643439422614lfi20
1381423105556333
Billspay-able
abroad
3434302524372620303134172729
2118151081781012161971216
11141313141715815141381311
22212322322222
Com-mer-cial
paperbought
Loansto
bro-kers in
NewYorkCityi
Investments
Total
U. S. Govern-ment obliga-
tions
DirectFullyguar-anteed
Othersecuri-
ties
TOTAL—ALL MEM-BER BANKS
1932—June 30Sept. 30Dec. 31
1933—June 30»Oct. 25Dec. 30
1934—Mar. 5June 30Oct. 17
28,00128,04527,46924,78624,95325,22026,54827,17527,559
Dec. 31 1 28,150- * * - A 28,271
28,78529,30129, 934
1935—Mar. 4June 29Nov. 1Dec. 31 p
NSW YORK CITY «
1932-June 30Sept. 30Dec. 31
1933-June30*Oct. 25Dec. 30
1934-Mar. 5-June 30Oct. 17Dec. 31
1935—Mar. 4June 29Nov. 1Dec. 31 v
OTHER RESERVECITIES
1032—June 30Sept. 30Dec. 31
1933—June 30 *Oct. 25Dec. 30
1934—Mar. 5June 30Oct. 17Dec. 31
1935—Mar. 4June 29Nov. 1Dec. 31 p
COUNTRY BANKS1932—June 30
Sept. 30Dec. 31
1933-June30»Oct. 25Dec. 30
1934—Mar. 5June 30Oct. 17 ,Dec. 31
1935-Mar. 4June 29Nov. 1Dec. 31 p
6,7157,1127,3277,1336,9716,9957,3517,6667,5457,7617,7838,3038,1678,400
11,04510,97910,5359,7809,95110,15710,81611,05411,36711,60911,73911,74312.31312,632
10,2409,9549,6077,8738,0318,0688,3818,4568,6498,7808,7498,7398,8218,901
15,26714,49713,90511,33711,52311,31511,09310,80410,78210,50910,42010, 36910.46510, 531
2,8562,6382,6212,2972,4362,3952,3212,2022,2942,2022,1982,1462,1852,191
6,5196,1965,8794,8464,9124,7974,6694,5864,5624.4594,4364,4254,5224,594
5,8925,6635,4054,1944,1754,1234,1034,0163,9263,8493,7863,7983,7583,746
283258241165178166164208167187184192179206
178164111117106101138102118113120107126
5,0094,8284,6083,7523,6313,6063,4803,3093,1583, llO3,0312,9312,8852,881
1,2791,2371,1861,044985989938882826820805783775791
2,2052,1272,0051,5901,542, 524,465,388,319294261216209
1,204
932902
2,8942,8852,8622,3722,3642,3592,3822,3572,2972,2732,2502,2772,2792,284
160154160157149148156156150139139138136140
1,4071,4061,3981,1601,1441,1511,1581,1451,1201,1081,0931,1201,1171,109
1,3281,3241,3041,0551,0701,0611,0681,0561,0261,0261,0181,0201,0261,035
225192257213250210229232207135159169
1389014812017913017114415916414582101107
6,3685,9704,8575,0924,9724,8174,7214,9324,7084,7484,8344.9634,991
1,2161,0941,066937
1,0751,0841,009
9651,1081,0241,0541,0851,1141,091
2,6612,4212,2371,9152,0331,9371,8701,8531,9561,8731,9091,9172,0342,096
3,0152,8542,6672,005, 984,952,937
,810,785
1,8311,8151,804
57345744433029728722515314915513311994
26020321616214314611268666352483542
2542051781291201037953556556504040
1221159387164132157200253232255247260272
62654651917889115151135142126124131
36362827463454729592109116132135
278414357788748840855
1,082802843875975841
1,048
258391337720624706687883631662678930828
1,018
7141258100112138154123131134261022
11,41412.12112,26511,92811,89412,38613,84214,65215,26716.12216,31816,85717,46017,775
3,0333,5083,7893,7093,5013,5423,9324,2654,3004,6024,6284,9834,9684,972
4,1544,4274,3624,6214,6455,0005,7636,1046,4236,7646,9337,0937,5897,813
4,2264,1874,1143,5983,7483,8454,1484,2834,5454,7564,7574,7804,9034,989
5,6286,3666,5406,8876,8017,2548,6679,1379,1869,9069,8219,871
10,08010,500
2,0082,4292,6032,5512,3202,3622,7683,0532,9543,2463t2003,462
3,425
2,18/2,4652,4622,8672,8893,2093,9544,1024,2404,5514,6014,4784,8655,138
1,4321,4711,4741,4691,5921,6831,9461,9821,9922,1082,0201,9311,8741,937
181»276709989
1,2001,5581,7641,768
105«157237278298348405401
75*94257356453658751744
3 25215355448553609623
5,7865,7555,7265,0415,0935,1324,995
»5,2395,3725,2275,2985,4275,6155,506
1,0251,0791,1861,1681,1811,1791,059
* 1,0561,1001,0781,1311,1741,2231,146
1,9661,9611,9001,7541,7571,7901,734
3 1,9081,9261,8571,8781,9571,9731,931
2,7942,7152,6402,1292,1562,1622,202
3 2,2762,3372,2932,2892,2962,4192,42»
p Preliminary.* Loans (secured by stocks and bonds) to brokers and dealers in securities.»Beginning June 30, 1933, figures relate to licensed banks only.«An estimated small amount of Home Owners' Loan Corporation bonds guaranteed by the United States Government as to both interest and
principal are included in "Other securities."* Central reserve city banks.Back figures.—See BULLETIN for November 1935, pp, 722 and 723.
Digitized for FRASER http://fraser.stlouisfed.org/ Federal Reserve Bank of St. Louis
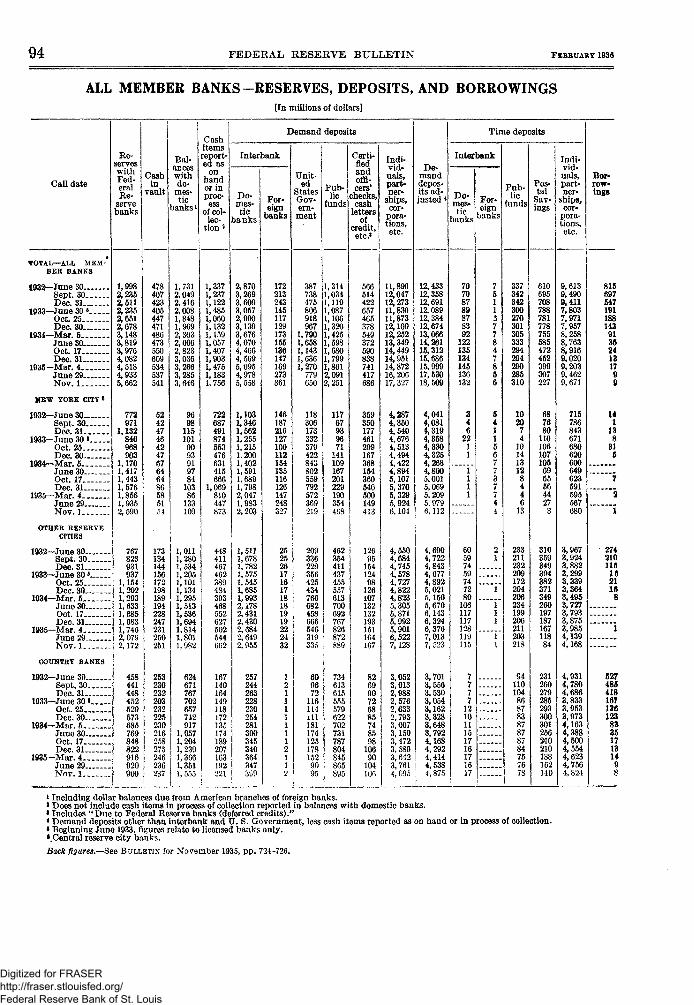
94 FEDERAL RESERVE BULLETIN F E B R U A R Y 1936
ALL MEMBER BANKS-RESERVES, DEPOSITS, AND BORROWINGS[In millions of dollars]
Call date
TOTAL—ALL MEM-BER BANKS
1932—June 30Sept. 30Dec. 31
1933—June 30 »Oct. 25Dec. 30
1934—Mar. 5June 30Oct. 17Dec. 31
1935-Mar . 4June 29Nov. 1
MEW YORK CITY «
1932—June 30Sept. 30Dec. 31
1933—June 30*Oct. 25Dec. 30
1934—Mar. 5June 30Oct. 17Dec. 31 _
1935—Mar. 4June 29Nov. 1
OTHER RESERVECITIES
1932—June 30Sept. 30Dec. 31
1933—June 30«Oct. 25Dec. 30
1934—Mar. 5June 30Oct. 17Dec. 31
1935—Mar. 4June 29-Nov. 1
COUNTRY BANKS
1932—June 30Sept. 30Dec. 31
1933—June 30«Oct. 25Dec. 30.
1934—Mar. 5June 30Oct. 17Dec. 31
1935—Mar. 4June 29Nov. 1
Re-serveswithFed-eralRe-
servebanks
1,9982,2352,5112,2352,6512,6783,1483,8193,9764,0824,5184,9335,662
772971
1,132846968903
1,1701,4171,4431,5761,8561,9352,590
767823931937
1,1541,2021,2931,6331,6851,6831,7462,0792,172
458441448452529573685769848822916920900
Cashin
vault
Bal-anceswithdo-
mes-tic
banksi
Cashitemsreport-ed as
onhandor inproc-ess
of col-lec-
tion 2
Do-mes-tic
banks
478407423405447471486473550609534537541
173134144156172198189194228247231250251
253230232203232225230216258275246236237
1,7312,0492,4162,0081,8481,9692,3032,6662,8233,0363,2663,2853,646
115101909391978410386133109
1,0111,2801,5341,2051,1011,1341,2951,5131,5361,6941,8141,8011,982
624671767702657742917
1,0571,2041,2391,3661,3511,555
1,3371,2371,1221,4851,0601,1321,1591,0571,4071,9031,4751,1831,756
722687491874553476631415666
1,069810447873
448411467462389484393468552627502544662
167140164149118172135174189207163HJ2221
Demand deposits
Interbank
2,8703,2693,6093,0572,9903,1393,6764,0704,4664,5695,0954,9785,558
1,1031,3461,5621,2551,2151,2001,4021, 5911,6891,7982,0471,9832,203
1,5111,6781,7821,5751,5451,6851,9932,1782,4312,4302,6842,6492,955
2572442632282302542813003453403643473G9
For-eign
banks
172213243145117129173155136147169273361
146187216127100112154135116126147248327
Unit-ed
StatesGov-ern-
ment
Pub-lic
funds
387738475806918967
1,7901,6581,1431,6361,270779650
118306173332379422843802559792572369219
209336229356425434766682458666546319335
609672116114ill1811741251781529095
Certifiedandoffi-cers'
checks,cash
lettersof
credit,etc.'
1,3141,0341,1191,0871,1061,3201,4251,5981,6801,7991,8612,0912,251
11767
711411091672012291903544GS
462364411437455557613700
872889
734613615555579622702731787804845865895
566514422657465378549372590838741417
359350177461299167368154360540500149413
1269515412498126107132132193151164167
82699072688574859810690104106
Indi-vid-uals,part-ner-
cor-pora-tions,
etc.
11,89012,04712,27311,83011,87312,10912,25213,34914,44914,95114,87216, 20617,327
4,2874,3504,5404,6764,5134,4944,4224,8945,1075,3705,3295,9246,104
4,5504,6844,7454,5784,7274,8224,8235,3055,8715,9925,9016,5227,128
3,0523,013
De-manddepos-its ad-justed *
2,5762,6332,7933,0073,1503,4723,5893,6423,7614, 095
12, 43312,35812,69112,08912, 38412,67413,06614,26115,31215,68615,99917,53018,509
4,0414,0814,3194,3584,3304,3254,2684,8005,0015,0695,2095,9796,132
4,6904,7224,8434,6774,8925,0215,1505,6706,1436,3246,3767,0137,523
3,7013,5563,5303,0543,1623,3283,6483,7924,1684,2924,4144,5384, 875
Time deposits
Interbank
Do-mes-tic
>anks
70708789878392
122135134145136132
346
2211
1111
60597459747280
106117117128119115
7777
121011151716171617
For-eign3anks
75110
77847856
5411567737744
21
1
111
11
Pub-lic
funds
337342342300270301305333294294290285310
1020
74
101413128446
13
233211232209172204206234199206211203218
94110104
86878387878784757678
Pos-tal
Sav-ings
610695708788781778755585472452399307227
687680
1101061071056965564427
3
31035934939438237134926019718716711884
2312602792852933003012562-10210188162140
Indi-vid-uals,part-ner-
ships,cor-
pora-tions,etc.
9,6139,4909,4117,8037,9717,9578,2588,7638,9169,0209,2039,4629,671
715786843671680620600649623591595567680
3,9673,9243,8823,2993,3393,3643,4953,7273,7933,8753,9854,1394,168
4,9314,7804,6863,8333,9533,9734,1634,3884,5004,5544,6234,7564,824
Bor-row-ings
815697547191188143913524131799
141
13
274210llfi162116
8
527488418167136123833517131498
i Including dollar balances due from American branches of foreign banks.* Does not include cash items in process of collection reported in balances with domestic banks.> Includes "Due to Federal Reserve banks (deferred credits)."4 Demand deposits other than interbank and U. S. Government, less cash items reported as on hand or in process of collection.* Beginning June 1933, figures relate to licensed banks only.•..Central reserve city banks.
Back figures.-—See BULLETIN for November 1935, pp. 724-726.
Digitized for FRASER http://fraser.stlouisfed.org/ Federal Reserve Bank of St. Louis
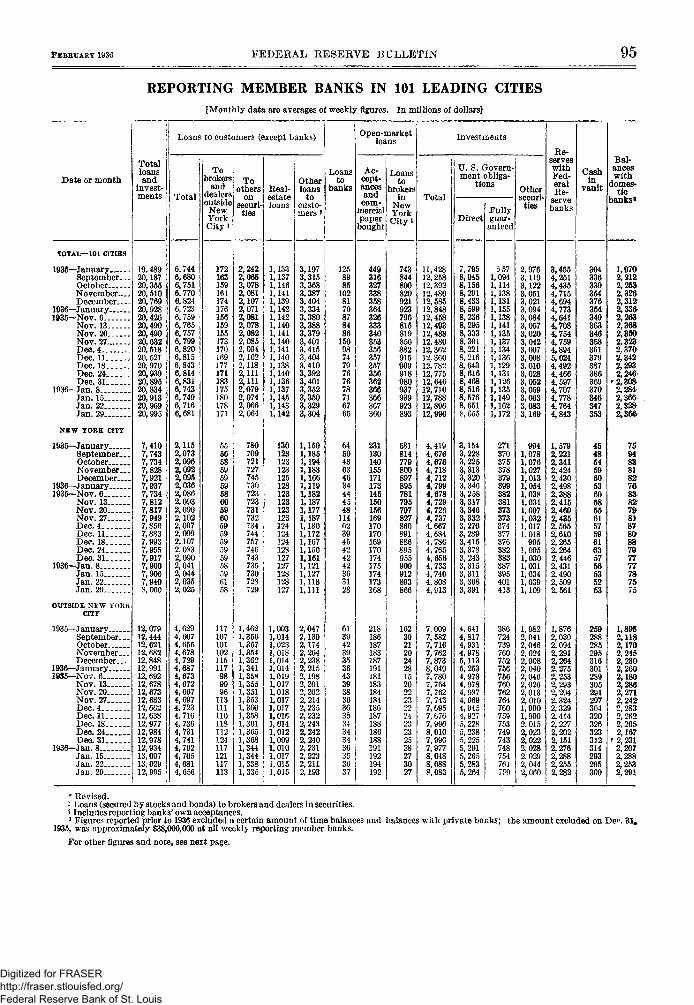
FEBEVARY 1936 FEDERAL RESERVE BULLETIN 95
REPORTING MEMBER BANKS IN 101 LEADING CITIES[Monthly data are averages of weekly figures. In millions of dollars)
Date or month
JOTAL—101 CITIES
1935—-JanuarySeptember. _.OctoberNovember.—.December...
1936—January1935—Nov. 6
Nov. 13Nov. 20Nov. 27Dec. 4.Dec. 11Dec. 18Dec. 24Dec. 31
1936-Jan. 8..Jan. 15Jan. 22Jan. 29
NEW YORK CITY
1935—JanuarySeptember.,.OctoberNovember, _.December...
1936—January1935—Nov. 6
Nov. 13Nov. 20Nov. 27Dec. 4Dec. 11Dec. 18Dec. 24Dec. 31
1936—Jan. 8Jan.15Jan. 22Jan. 29
OUTSIDE NEW YORKCITY
1935—JanuarySeptember. _.OctoberNovemberDecember
1936—January _1935—Nov. 6 _.
Nov. 13Nov. 20Nov. 27Dec. 4Dec. 11Dec. 18Dec. 24Dec. 31
1936—Jan. 8Jan. 15Jan. 22Jan. 29
Totalloansand
invest-ments
19, 48920,18720,35520,51020,76920,92820,42620,49020,49020,63220, 51820, 52120, 97020,93920,89520,83420,91320,96920,995
7,4107,7437,7347,8287,9217,9377,7347,8127,8177,9497,8567,8837,9937,9557,9177,9007,9067,9408,000
12,07912,44412, 62112.68212,84812,99112, 69212, 67812,67312.68312,66212,63812, 97712,98412,97812, 93413,00713,02912, 995
Loans to customers (except banks)
Total
6,7446,6806,7516.7706,8246,7236,7596,7656,7576,7996,8206,8156,8436,8146,8316,7436,7496,7166,681
2,1152t0732,0962,0922,0952,036
Tobrokers
anddealersoutside
NewYorkCity i
2,0932,0902,1022,0972,0992,1072. 0832,0902,0412,0442,0352,025
4,6294,6074,6554,6784,7294,6874,6734,6724,6674,6974, 7234,7164,7364,7314,7414,7024,7054,6814,656
Toothers
onsecuri-
172163159161174176156159155173170169177171183175180178171
55565859595958
117107101102115117989996113111110118112124117121117113
2,2422,0652,0782,0812,1072,0712,0812,0782,0822,0852,0942,1022,1182,1112,1112,0792,0742,0662,064
780709721727745730723723731732734744757746743735730728729
1,4621,3561,3571,3541,3621,3411,3581,3551,3511,3531,3601, 3581,3611,3651,3681,3441,3441,3381,335
Real-estateloans
Otherloans
tocusto-mers 2
Loansto
banks
1,1331,1371,1461,1411,1391,1421,1421,1401,1411,1401,1411,1401,1381,1401,1361,1371,1451,1431,142
130123123123125128123123123123124124124128127127128128127
1,0031,0141,0231,0181,0141,0141,0191,0171,0181,0171,0171,0161,0141,0121,0091,0101,0171,0151,015
3,1973,3153,3683,3873,4043,3343,3803,3883,3793,4013,4153,4043,4103,3923,4013,3523,3503,3293,304
1,1501,1851,1941,1831,1661,1191,1821,1871,1771,1871,1801,1721,1671,1501,1611,1211,1271.1181,131
2,0472,1302,1742,2042,2382,2152,1982,2012,2022,2142,2352,2322,2432,2422,2402,2312,2232,2112,193
andcom-
mercialpaper
bought
Open-marketloans
Ac-cept-
Loansto
brokersin
NewYorkCity i
1258985
1028170878486
1509874 |79 i767678716765
645043634634444548114623945424242363128
449316327338358364326333340353356357357356
367360
231130140155171173145150156169170170169170174175174173168
218186187183187191181183184184186187188186188191192194192
743844800820921923796815819850882915909918980937939923893
581814779800897895781795797827860891886895955909912893866
162302120242815202223222423232528273027
Investments
Total
11,42812, 25812,39212,48012,58512,84812,45812,49312,48812,48012,36212, 36012, 78212,77512,64612,71012,78812,89612,996
4,4194,6764,6764,7184,7124,7994,6784,7294,7264,7374,6674,6844,7864,7654,6564,7334,7404,8084,913
7,0097,5827,7167,7627,8738,0497,7807,7647,7627,7437,6957,6767, 9968,0107,9907,9778,048
8,083
U. S. Govern-ment obliga-
tions
Direct
7,7958,0458,1568,2918,4338,5998,2368,2958,3338,3018,2218,2168,6438,6168,4688,5168,5768,6518,655
3,1543,2283,2253,3133,3203,3463,2583,3173,3463,3323,2763,2893,4153,3783,2433,3153,311
3,391
Fullyguar-anteed
4,6414,8174,9314,9785,1135,2534,9784,9784,9874,9694, 9454,9275, 2285,2385, 2255, 2015,2655,2835,264
6571,0941,1141,1381,1311,1551,1381,1411,1351,1371,1341,1361,1291,1311,1261,1351,149],1621,172
271370375378379399382381373373374377376382383387395401413
i386724739760752756756760762764760759753749743748754761759
Othersecuri-
ties
2,9763,1193,1223,0513,0213,0943,0843,0573,0203,0423,0073,0083,0103,0283,0523,0593,063
3,169
9941,0781,0761,0271,0131,0541,0381,0311,0071,0321,0171.018995
1,0051,0301,0311,0341,0391,109
1,9822,0412,0462,0242,0082,0402,0462,0262,0132,0101,9901,9902,0152,0232,0222,0282, 0292,0442,060
Re-serveswithFed-eralRe-
servebanks
3,4554,2514,4354,7154,6944,7734,6414,7084,7544,7594,8945,0244,4924,4664,5974,7074,7784,7644,843
1,5792,2212,3412,4242,4302,4982,3882,4152,4602,4352,5652,6102,2652,2642,4462,4312,4902,5092,561
1,8762,0302,0942,2912,2642.2752,2532, 2932,2942,3242,3292.4142; 2272,2022,1512,2762,2882,2552,282
Cashin
vault
Bal-anceswith
domes-tic
banks8
304336339354376354349363346358361379387386369370346347
259288285295316301289305291297304320326323312314293295300
1,9702,2122,25a2,3262,3122,3362,2632,3682,3502,3232,3702,3422,2932,246'2,3082,284'2,3662,328
759483818276-83-82?79-8187
sa88797777787575
1,8952,1182,1702,2452,2302,2602,1802,2862,2712,2422,2832,2622,2052,167
'2,2312,2072,2882,2532,291
r Revised.1 Loans (secured by stocks and bonds) to brokers and dealers in securities.2 Includes reporting banks' own acceptances.3 Figures reported prior to 1936 excluded a certain amount of time balances and balances with private banks; the amount excluded on De*.
193.% was approximately $38,000,000 at all weekly reporting member banks.
For other figures and note, see next page.
Digitized for FRASER http://fraser.stlouisfed.org/ Federal Reserve Bank of St. Louis
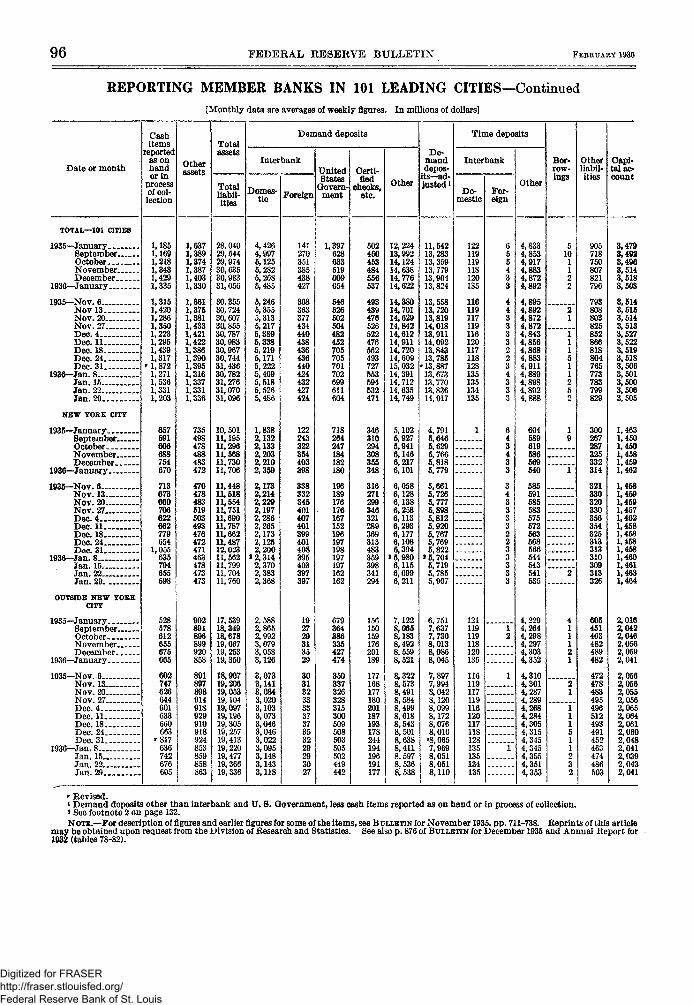
96 FEDERAL RESERVE BULLETIN FEBRUARY 1936
REPORTING MEMBER BANKS IN 101 LEADING CITIES—Continued[Monthly data are averages of weekly figures. In millions of dollars}
Date or month
Cashitems
reportedas onhandor in
processof col-lection
Otherassets
Total
Totalliabil-ities
Demand deposits
Interbank
Domes-tic Foreign
UnitedStates
Govern-ment
Certi-fied
checks,etc.
Other
De-manddepos-
its—ad*Justed i
Time deposits
Interbank
Do-mestic
For-eign
Other
Bor-row-ings
Otherliabil-ities
Capi-tal ac-count
TOTAL—101 CITIES
1935—JanuarySeptemberOctoberNovemberDecember
1936—January
1935-Nov. 6...Nov l3_ .Nov. 20..Nov. 27..Dec. 4 . . .Dec. 1 1 -Dec. 18..Dec. 24..Dec. 31 . .
1936—Jan. 8—.Jan. 15...Jan. 22...Jan. 29. .
NEW YORK CITY
1935—JanuarySeptember-OctoberNovember-December..
1936—January
1935—Nov. 6Nov. 13Nov. 20Nov. 27Dec. 4Dec. 11Dec. 18Dec. 24Dec. 31
1936—Jan. 8Jan. 15Jan. 22Jan. 29
OUTSIDE NEW YORKCITY
1935—JanuarySeptember-OctoberNovember..December..
1936—January
1935-Nov. 6....Nov. 13...Nov. 20...Nov. 27..Dec.4—.Dec. 11. . .Dec. 18...Dec. 24..Dec. 3 1 . .
1936—Jan. 8.....Jan. 15...Jan. 22...Jan. 29.. .
1,1851,1691,2181,3431,4291,335
1,3151,4201,2861,3501,2231,2951,4391,3171, 8721,2711,5361,3311,203
657691606688754670
713673660706622662779654
1,055635794655
528578612655675665
602747626644601633660663
'817636742676605
1,6371,3891,3741,3871,4031,330
1,3611,3751,3811,4331,4211,4221,3861,3901,3951,3161,3371,3311,336
735498478488483472
470478483519503493476472471463478473473
902891896899920858
891897898914918929910918924853859858863
28,04029,54429,97430,635
31,056
30,35530,72430,60730,85530,787
30,96730,74431,43630,78231,27631,07031,096
10,50111,19511,29611,56811,73011,706
11,44811,51811,55411,75111,69011,78711,66211,48712,02311,56211, 79911,70411, 760
17, 53918.34918,67819,06719,25319.350
18,90719,20619,05319,10419,09719,19619,30519,25719,41319, 22019,47719,36619,336
4,4264,9975,1255,2825,2685,485
5,2465,3555,3135,217
5,3385,2195,1715,2225,4095,5185,5265,486
1,8382,1322,1332,2032,2102,359
2,1732,2142,2202,1972,2862,2652,1732,1252,200
» 2,3142,3702,3832,368
2,5882,8652,9923,0793,0583,126
3,0733,1413,0843,0203,1033,0733,0463,0463,0223,0953,1483,1433,118
141270351385438427
363377434440438436436440424432427424
122243
354403
338332345401407401399401408395403397397
1,397628633519609654
546526502504482452705705701702699611604
718264247184182180
196189176176167152196197198197197162162
679364
427474
350337326328315300509508503505502449442
502460453484556537
493439476526522476562493727553594532471
346310294308355348
316271299346321289
359398341294
156150159176201189
177168177180201187193178244194196191177
12, 22413,99214,12414,63814,77614,622
14,38014,70114,62914,84214,61214,91114,72014,60915,03214,39114,71214,63514, 749
5,1026,9275,9416,1466,2176,101
6,0586,1286,1386,2586,1136,2936,1776,1086,394
6,1156,0996,211
7,1228,0658,1838,4928,5598,521
8,3228,5738,4918,584
8,6188,5438,501
8,4118,5978,5368,538
11,54213,28313,35913,77913,90413,824
13,55813,72013,81914,01813,91114,09213,84313,78513,88713,67313,77013,83614,017
4,7915,6465,6295,7665,8185,779
5,6615,7265,777
5,8125,9205,7675,7695,822
>5,7045,7195,7855,907
6,7517,6377,7308,013
8,045
7,8977,9948,0428,1208,0998,1728,0768,016'8,0657,9698,0518,0518,110
122119119118120135
116119117119116120117118128135135134135
121119119118120135
116119117119116120117118128135135134135
4,8334,8534,9174,8834,8724,892
4,8954,8924,8724,8724,8434,8564,8684,8834,911
604589619586669540
585591585583575572563568566544543541535
4,2294,2644,2984,297
4,352
4,3104,3014,2874,2894,2684,2844,3054,3154,3454,3454,3554,3514,353
905718750807821796
793
825852866818804765773783799829
300267287325332314
321330320330356354325313313310309313326
605451463482489482
472478483495496512493491452463474486503
3,4793,4023,4963,5143,5183,503
3,5143,5153,5143,5133,5273,5223,5193,5183,5063,5013,5003.5063,505
1,4631,4501,4501,4581,4591,462
1,4581,4591,4501,4571,4621,4581,4581,4581,4581,4601,4611,4631,464
2,0162,0422,0462,0562,0592,041
2,0562,0562,0552,0562,0652,0642,0612,0602,0482,0412,0392,0432,041
»• Revised.1 Demand deposits other than interbank and U. S. Government, less cash items reported as on hand or in process of collection.2 See footnote 2 on page 132.NOTE.—For description of figures and earlier figures for some of the items, see B ULLETIN for November 1935, pp. 711-738. Reprints of this article
may be obtained upon request from the Division of Research and Statistics. See also p. 876 of BULLETIN for December 1935 and Annual Report for1932 (tables 78-82).
Digitized for FRASER http://fraser.stlouisfed.org/ Federal Reserve Bank of St. Louis
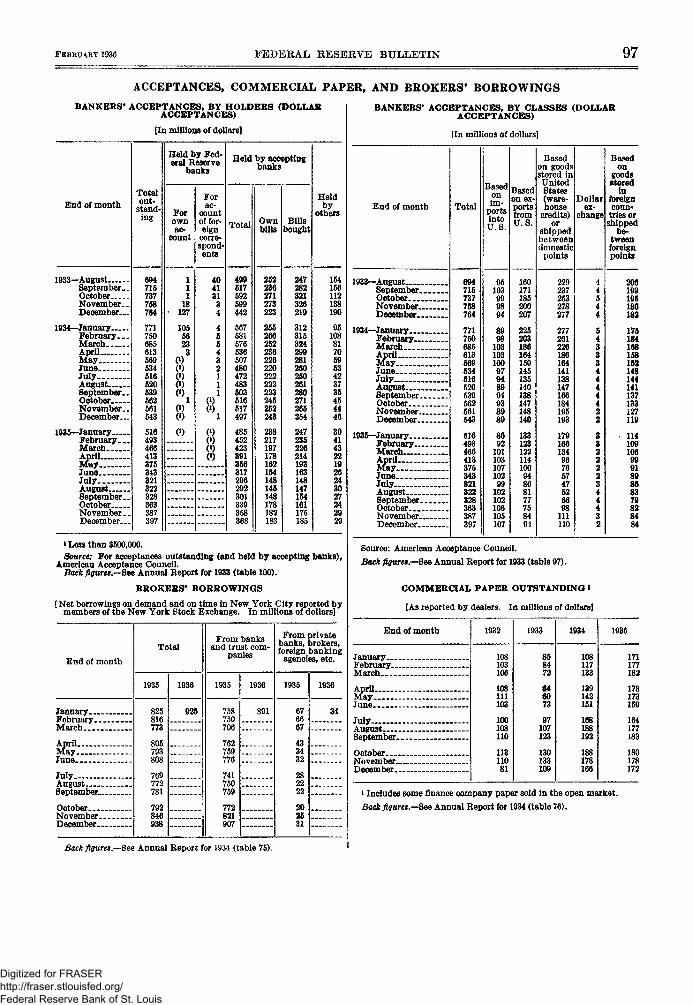
FEBRUARY 1936 FEDERAL RESERVE BULLETIN 97
ACCEPTANCES, COMMERCIAL PAPER, AND BROKERS9 BORROWINGS
BANKERS' ACCEPTANCES, BY HOLDERS (DOLLARACCEPTANCES)
[In millions of dollars]
End of month
1933—AugustSeptember..OctoberNovember. .December
1934—JanuaryFebruary. . .MarchAprilMayJuneJulyAugustSeptember. .OctoberNovember--December
1935—JanuaryFebruaryMarchAprilMayJuneJulyAugustSeptember. .OctoberNovember __December.. .
Totalout-
stand-ing
694715737768764
771750685613569534516520539562561543
516493466413375343321322328363387397
Held by Fed-eral Reserve
banks
Forownac-
count
111
18• 127
10556233
81
0)
Forac-
countof for-eign
corre-spond-ents
40413134
45543211
O ) 1
(*)
Held by acceptingbanks
Total
499517592599442
567581576536507480472483603616517497
485452423391856317296292301339358368
Ownbills
252236271273223
255266252236226220222222223245252243
238217197178162154148145148178182183
Billsbought
247282321326219
312315824299281260250261280271265254
247235226214193163148147154161175185
Heldby
others
154156112138190
9510881705953423735454446
304143221926243027242929
»Less than $500,000.Source: For acceptances outstanding (and held by accepting banks),
American Acceptance Council.Back figures.—See Annual Report for 1933 (table 100).
B R O K E R S ' BORROWINGS
(Net borrowings on demand and on time in New York City reported bymembers of the New York Stock Exchange. In millions of dollars]
End of month
January. _.February..March
AprilMayJune
JulyAugustSeptember.
October. . .November.December-
Total
1935 1936
825816773
805793808
769772781
792846
925
From banksand trust com-
panies
1935 1936
758750706
762759776
741750759
772821907
891
From privatebanks, brokers,foreign banking
agencies, etc.
1935 1936
34
Back figures.—See Annual Report for 1931 (table 75).
BANKERS' ACCEPTANCES, BY CLASSES (DOLLARACCEPTANCES)
[In millions of dollars]
End of month
1933—August- .September..OctoberNovember.December...-
1934—January.. . .February.March. IAprilMayJuneJulyAugust .SeptemberOctoberNovember.. . . .December
1935—January . . . .FebruaryMarch..... . . . . .AprilMay. . .June . . . . .JulyAugustSeptemberOctoberNovember.....December _
Total
694715737758764
771750685613569534616520539562561543
516493466413375343821322328363387397
Basedj m
intoU S
95103999894
8998
10310310097948994938989
8892
10110310710299
102102106105107
Basedon ex-portsfromU.S.
160171185200207
225203186164150145135140138147148140
13312312211410094868177758494
Basedon goodsstored inUnitedStates(ware-house
credits)or
shippedbetweendomesticpoints
229237253278277
111261226186164141138147166184195193
17916613496765747526698
111110
Dollarex-
change
44544
543334444422
832222344432
Basedon
goodsstored
inforeigncoun*
tries orshipped
be-tweenforeignpoints
206199195180182
175184168158152148144141137133127119
• 11410910699918986837fl828484
Source: American Acceptance Council.
Back figures.—See Annual Report for 1933 (table 97).
COMMERCIAL PAPER OUTSTANDING *
[As reported by dealers. In millions of dollars!
End of month
JanuaryFebruary-. .March
April-May . .June . .
JulyAugustSeptember.
OctoberNovemberDecember
1932
108103106
108111103
100108110
11311081
1933
858472
U6073
97107123
130133109
1934
108117133
139142151
168188192
188178166
1935
171177182
173173159
164177183
180178172
1 Includes some finance company paper sold in the open market.
Back figures.—See Annual Report for 1934 (table 76).
Digitized for FRASER http://fraser.stlouisfed.org/ Federal Reserve Bank of St. Louis
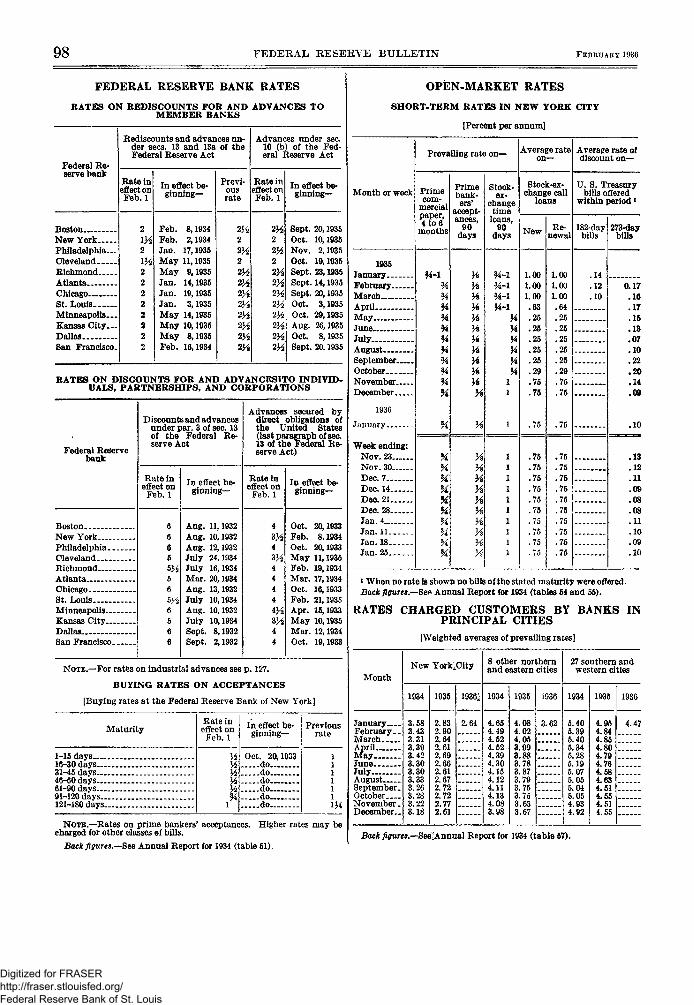
98 FEDERAL KESERVE BULLETIN FEBRUARY 1936
FEDERAL RESERVE BANK RATES
RATES ON REDISCOUNTS FOR AND ADVANCES TOM E M B E R BANES
Federal Re-serve bank
BostonNew YorkPh i l ade lph ia -ClevelandRichmondAtlantaChicagoSt. LouisMinneapolis. ~Kansas C i t y -DallasSan Francisco-
Rediscounts and advances un-der sees. 13 and 13a of theFederal Reserve Act
Rate ineffect onFeb. 1
2IX2VA22222222
In effect be-ginning—
Feb. 8,1934Feb. 2,1934Jan. 17,1935May 11,1935May 9,1935Jan. 14,1935Jan. 19,1935Jan. 3,1935May 14,1935May 10,1935May 8,1935Feb. 16,1934
Previ-ousrate
2M22y2
2VA2HVAVA2M2H2H2H
Advances under sec.10 (b) of the Fed-eral Reserve Act
Rate ineffect onFeb. 1
2H22 ^22M2H2HVA
2V2
2lA%
In effect be-g inn ing-
Sept. 20,1935Oct. 10,1935Nov. 2,1935Oct. 19,1935Sept. 23,1935Sept. 14,1935Sept. 20,1935Oct. 3,1935Oct. 29,1935Aug. 26,1935Oct. 8,1935Sept. 20,1935
RATES ON DISCOUNTS FOR AND ADVANCESSTO INDIVID-UALS, PARTNERSHIPS , AND CORPORATIONS
Federal Reservebank
BostonNew YorkPhiladelphiaClevelandRichmondAtlantaChicagoSt. LouisMinneapolisKansas CityDallasSan Francisco
Discounts and advancesunder par. 3 of sec. 13of the Federal Re-serve Act
Rate ineffect on
Feb. 1
66665H565H6566
In effect be-ginning—
Aug. 11,1932Aug. 10,1932Aug. 12,1932July 24,1934July 16,1934Mar. 20,1934Aug. 13,1932July 10,1934Aug. 10,1932July 10,1934Sept. 8,1932Sept. 2,1932
Advances secured bydirect obligations ofthe United States(last paragraph of sec.13 of the Federal Re-serve Act)
Rate ineffect on
Feb. 1
43M43H4444
4M3H44
In effect be-ginning—
Oct. 20,1933Feb. 8.1934Oct. 20,1933May 11,1935Feb. 19,1934Mar. 17,1934Oct. 16,1933Feb. 21,1935Apr. 15,1933May 10,1935Mar. 12,1934Oct. 19,1933
NOTE.—For rates on industrial advances see p . 127.
BUYING RATES ON ACCEPTANCES
[Buying rates at the Federal Reserve Bank of New York]
Maturity
1-15 days16-30 days31-45 days46-60 days61-90 days91-120 days. . . .121-180 d a y s -
Rate ineffect on
Feb. 1In effect be-
ginning—
Oct. 20,1933dodododododo
Previousrate
NOTE.—Rates on prime bankers' acceptances. Higher rates may becharged for other classes of bills.
Back figures.—Bee Annual Report for 1934 (table 51).
OPEN-MARKET RATES
SHORT-TERM RATES IN NEW YORK CITY
[Percent per annum]
Month or week
Prevailing rate o n - Average rate
Primecom-
mercialpaper,4 to 6
months
1935JanuaryFebruaryMarchAprilMayJuneJulyAugustSeptemberOctoberNovember. . . .December
1936
January
Week ending:Nov. 23Nov. 30Dec. 7Dec. 14Dec. 21Dec. 28Jan .4Jan. 11Jan.18Jan.25
4-1
Primebank-
ers'accept-ances,
90days
H
HHHHXHHH
y%
Stock-ex-
changetime
loans,90
3/4-1H-lH-lH-l
Stock-ex-change call
loans
New Re-newal
1.001.001.00.63.25.25.25.25.25.29.75.75
.75
1.001.001.00.64.25.25.25.25.25.29.75.75
.75
.75
.75
.75
.75
.75
.75
.75
.75
.75
.75
Average rate ofdiscount on—
U. S. Treasurybills offered
within period»
182-daybills
.14
.12
.10
273-daybills
0.17.16.17.15.13.07.10.22.20.14.09
.10
.13
.12
.11
.09
.08
.08
.11
.10
.09
.10
» When no rate is shown no bills of the stated maturity were offered.Back figures—Sen Annual Report for 1934 (tables 54 and 55).
RATES CHARGED CUSTOMERS BY BANKS INPRINCIPAL CITIES
[Weighted averages of prevailing rates]
Month
JanuaryFebruary. _MarchApril . .MayJuneJulyAugustSeptember.OctoberNovember.December..
New York^City
1934
3.583.433.313.393.423.303.303.333.263.283.223.18
1935
2.832.902.642.612.692,662.612.672.722.722.772.61
1936}
2.64
8 other northernand eastern cities
1934
4.654.494.524.524.394.304.154.124.114.134.083.98
1935
4.084.024.053.993.883.783.873.793.753.753.633.67
1936
3.62
27 southern andwestern cities
1934
5.405.395.405.345.285.195.075.055.045.054.934.92
1935
4.954.844.854.804.794.761584.634.514.554.514.55
1936
4.47
" I I "
Back figures.—See;Annual Report for 1934 (table 57).
Digitized for FRASER http://fraser.stlouisfed.org/ Federal Reserve Bank of St. Louis
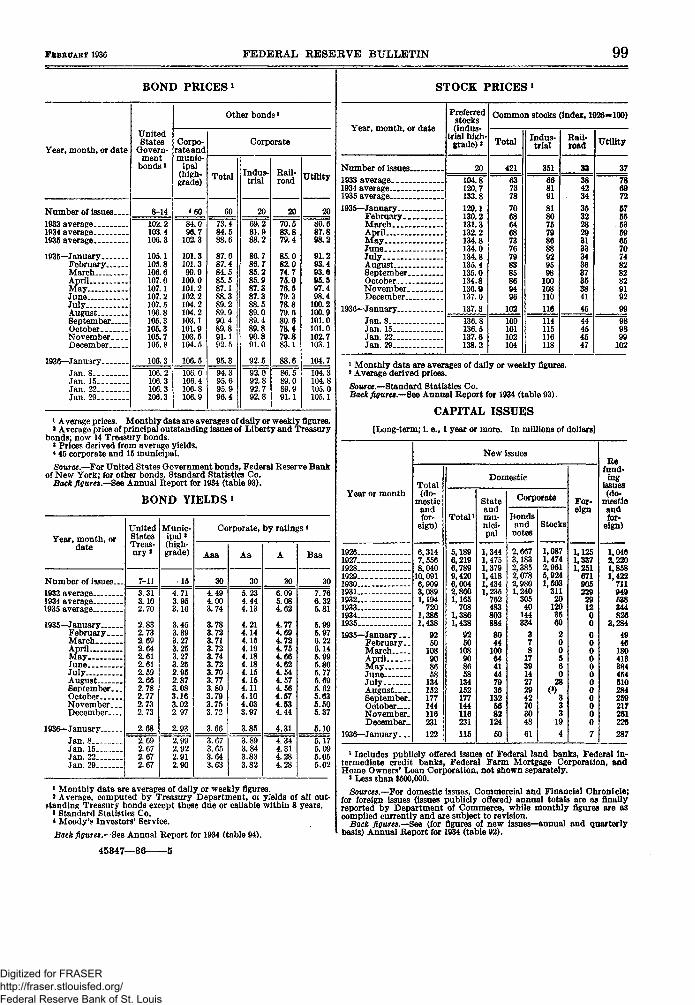
FEBRUARY 1936 FEDERAL RESERVE BULLETIN 99
BOND PRICES1
Year, month, or date
Number of issues1933 average1P34 average1935 average -
1935—JanuaryFebruaryMarch _AprilMayJuneJulyAugustSeptemberOctoberNovemberDecember
1936—JanuaryJan. 8 _.Jan. 15Jan. 22Jan. 29
UnitedStates
Govern-ment
bonds 2
8-14102.2103.4106.3
105.1105.8106.6107.0107.1107.2107.5106.8105. 3105.3105.7105.8
106.3106.2106.3106.3106.3
Other bonds«
Corpo-rate andmunic-
ipal(high-grade)
<60
84.096.7
102.3
101.3101.399.9
100.0101.2102.2104.2104.2103.1101.9103.5104.5
106.5106.0106.4106.8106.9
Corporate
Total
60
73.484.588.6
87.687.484.585.587.188.389.289.990.489.891.192.5
95.394.395.695.996.4
Indus-trial
20
69.281.988.2
86.786.785.285.987.387.388.589.089.489.890.891.0
92.592.092.892.792.8
Rail-road
20
70.583.879.4
85.082.074.775.076.579.378.879.680.678.479.883.1
88.686.589.089.991.1
Utility
20
80.687.898.2
91.293.493.695.697.498.4
100.2100.9101.0101.0102.7103.1
104.7104.3104.8105.0105.1
1 Average prices. Monthly data are averages of daily or weekly figures.» Average price of principal outstanding issues of Liberty and Treasury
bonds; now 14 Treasury bonds.' Prices derived from average yields.* 45 corporate and 15 municipal.Source.—For United States Government bonds, Federal Reserve Bank
of New York; for other bonds, Standard Statistics Co.Back figures.—See Annual Report for 1934 (table 93).
BOND YIELDS *
Year, month, ordate
Numbor of issue3—1933 average1934 average1935 average
1935—JanuaryFebruaryMarchAprilMayJuneJuly.. .AugustSeptember. _.OctoberNovember,. .December
1936—JanuaryJan. 8Jan. 15--Jan. 22,-Jan. 29
UnitedStatesTreas-ury *
7-113.313.102.70
2.832.732.692.642.612.612.592.662.782.772.732.73
2.682.692.672.672.67
Munic-ipal 3(high-grade)
15
4.713.953.16
3.453.393.273.253.273.252.952.873.083.163.022.97
2.932.992.922.912.90
Corporate, by ratings *
Aaa
30
4.494.003.74
3.783.723.713.723.743.723.703.773.803.793.753.72
3.663.673.653.643.63
Aa
30
5.234.444.13
4.214.144.154.194.184.184.154.154.114.104.033.97
3.853.893.843.833.82
A
30
6.095.084.62
4.774.694.724.754.664.624.544.674.564.574.534.44
4.314.344.314.284.28
Baa
30
7.766.325.81
5.995.976.226.145.995.865.775.695.625.635.505.37
5.105.175.095.055.02
1 Monthly data are averages of daily or weekly figures.* Average, computed by Treasury Department, oi yields of all out-
standing Treasury bonds except those due or callable within 8 years.8 Standard Statistics Co.* Moody's Investors' Service.
Back figures.—See Annual Report for 1934 (table 94).
45347—36 5
STOCK PRICES1
Year, month, or date
Preferredstocks(indus-
trial high-grade) »
Number of issues..1933 average1934 average1935 average
1935—JanuaryFebruary. _.MarchAprilMayJuneJulyAugustSeptember..OctoberNovember. _December...
1936—JanuaryJan. 8Jan. 15Jan. 22Jan. 29
20
129.1130.2131.3132.2134.8134.0134.8135.4135.0134.8136.0137.0
137.3
136.8136.5137.6138.2
Common stocks (index, 1926 •» 100)
Total trial' rod mm*
421
—w7378
706864687376798385869496
100101102104
351668191
818075798688929598100108110
116
114115116118
37
~78
72
575553596570748282829192
99
"98
102
1 Monthly data are averages of daily or weekly figures.* Average derived prices.Source.—Standard Statistics Co.
Back figures.—See Annual Report for 1934 (table 93).
CAPITAL ISSUES
[Long-term; i. e., 1 year or more. In millions of dollars]
Year or month
19261927 . -19281929193019311932193319341935
1935—January--.February._MarchAprilMayJuneJulyAugustSeptember-October—-November.December..
1936—January...
New issues
Total(do-
mesticandfor-
eign)
6,3147,5568,040
10,0916,9093,0891,194
7201,3861,438
9250
108908658
134152177144116231
122
Domestic
Total i
5,1896,2196,7899,4206,0042,8601,165
7081,3861,438
9250
108908658
134152177144116231
115
Stateandmu-nici-pal
1,3441,4751,3791,4181,4341,235
762483803884
8044
1006441447936
1325682
124
50
Corporate
Bondsandnotes
2,6673,1832,3852,0782,9801,240
30540
144334
378
173914272942703048
61
Stocks
1,0871,4742,9615,9241,503
31120
1203569
200560
28
( \33
194
For-eign
1,1251,3371,251
671905229291200
000000000000
7
Refund-ing
issues(do-
mesticandfor-
eign)
1,0482,2201,8581,422
711949538344826
3,284
4946
18041338445461028425921726122«
287
1 Includes publicly offered issues of Federal land banks, Federal in-termediate credit banks, Federal Farm Mortgage Corporation, andHome Owners' Loan Corporation, not shown separately.
«Less than $500,000.Sources.—YOT domestic issues, Commercial and Financial Chronicle;
for foreign issues (issues publicly offered) annual totals are as finallyreported by Department of Commerce, while monthly figures are ascompiled currently and are subject to revision.
Back figures.—See (for figures of new issues—annual and quarterlybasis) Annual Report for 1934 (table 92).
Digitized for FRASER http://fraser.stlouisfed.org/ Federal Reserve Bank of St. Louis
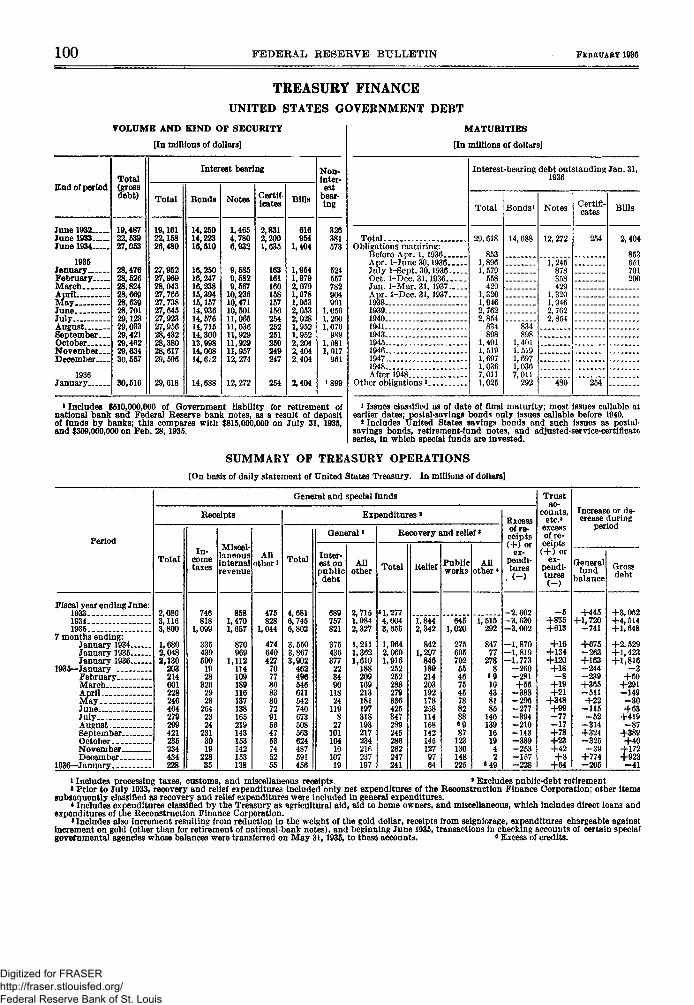
100 FEDERAL RESERVE BULLETIN FEBRUARY 1936
TREASURY FINANCEUNITED STATES GOVERNMENT DEBT
VOLUME AND KIND OF SECURITY
[In millions of dollars]
End of period
June 1932June 1933June 1934
1935JanuaryFebruaryMarch.Apr i l -May. . .June.—July....August.September. __OctoberNovember-December
1936January
Total(grossdebt)
19,48722,53927,053
28,47628,52628,82428,66928,63928,70129,12329,03329,42129,46229,63430,557
30,516
Total
19,16122,15826,480
27,95227,96928,04327,76627, 73827,64527,92327,95628,43228,38028,61729,596
29,618
Interest bearing
Bonds
14,25014,22316,510
16,25016,24716,23815,39415,15714,93614,57614,71514,30013,99814,00814,672
14,688
Notes
1,4654,7806,932
9,6859,5829,567
10,23610,47110,50111,06511,03611,92911,92911,95712,274
12, 272
Certif-icates
2,8312,2001,635
163161160158157156254252251250249247
254
Bills
616954
1,404
1,9541,9792,0791,9781,9532,0532,0281,9521,9522,2042,4042,404
2,404
Non-inter-est
bear-ing
326381573
524557782904901
1,0561,2001,076
9891,0811,017
961
1899
i Includes $510,000,000 of Government liability for retirement ofnational bank and Federal Reserve bank notes, as a result of depositof funds by banks; this compares with $815,000,000 on July 31, 1935,and $309,000,000 on Feb. 28, 1935.
MATURITIES
[In millions of dollars]
TotalObligations maturing:
Before Apr. 1, 1936Apr. 1-June 30,1936July 1-Sept. 30,1936Oct. 1-Dec. 31,1936Jan. 1-Mar. 31,1937Apr. 1-Dec. 31,1937193819391940194119431945194619471948After 1948
Other obligations 2 _..
Interest-bearing debt outstanding Jan. 31,1936
Total
29,618
8531,8961,579
558429
1,3201,9462,7622,854
834898
1,4011,5191,6971,0367,0111,025
Bonds1
14, 688
834898
1,4011,5191,6971,0367,011
292
Notes
12,272
1,245878358429
1, 3201,9462,7622,854
480
Certifi-cates
254
254
Bills
2,404
853651701200
i Issues classified as of date of final maturity; most issues callable atearlier dates; postal-savings bonds only issues callable before 1940.
* Includes United States savings bonds and such issues as postal-savings bonds, retirement-fund notes, and adjusted-service-certificateseries, in which special funds are invested.
SUMMARY OF TREASURY OPERATIONS(On basis of daily statement of United States Treasury. In millions of dollars]
Period
Fiscal year ending June:193319341935 . . .
7 months ending:January 1934January 1935January 1936
1935—JanuaryFebruaryMarch .AprilMayJune __JulyAugustSeptPmberOctober _ .NovemberDecember
1936—January
General and special funds
Receipts
Total
2,0803,1163,800
1,6802,0482,130
203214601228246464279299421235234434228
In-cometaxes
746818
1,099
335439590
1928
3262923
2542324
2313019
22835
Miscel-laneousinternalrevenue
8581,4701,657
870969
1,112114109189116137138165219143153142153138
Allother »
475828
1,044
474640427
70778683867291564753745255
Expenditures >
Total
4,6816,7456,802
3,5503,8673,902
462496546611542740673508563624487591456
General«
Inter-est onpublicdebt
689757821
375436377223490
11824
1198
2710110410
10719
Allother
2,7151,9842,327
1,2111,3621,610
18820916921318119731819321723421fi237197
Recovery and relief •
Total
«1,2774,0043,855
1,9642,0691,916
252252288279336425347289245286262247241
Relief
1,8442,342
8421,297
8461892142031921782581141581421451279764
Publicworks
6451,020
27569579255467545788288• 987
123130148225
Allother *
1,515292
84777
2788
6910438185
146139161942
•49
Excessof re-ceipts(+) or
ex-pendi-tures
. (-)
-2.602- 3 , 630
-3,002
-1 ,870-1,819-1 ,773
-260- 2 8 1+55
-383-296-277-394-210-143-389-253—157-228
Trustac-
counts,etc.*
excessof re-ceipts<+) or
ex-pendi-tures(-)
- 5+835+613
+16+134+120+18- 8
+19+21
+348+99-77- 1 7
+78+23+42+8
+64
Increase or de-crease during
period
Generalfund
balance
+445+1,720
- 7 4 1
+675-263+163-244—239+365-511+22
-115- 5 2
-314+324-325- 3 9
+774-205
Grossdebt
+3,052+4,514+1,648
+2,529+1,423+1,816
- 3+50
+291—149
- 3 0+63
+419-87
+389+40
+172+923
- 4 1
* Includes processing taxes, customs, and miscellaneous receipts • Excludes public-debt retirement» Prior to July 1933, recovery and relief expenditures included only net expenditures of the Reconstruction Finance Corporation; other items
subsequently classified as recovery and relief expenditures were included in general expenditures.*Includes expenditures classified by the Treasury as agricultural aid, aid to home owners, and miscellaneous, which includes direct loans and
expenditures of the Reconstruction Finance Corporation.»Includes also increment resulting from reduction in the weight of the gold dollar, receipts from seigniorage, expenditures chargeable against
increment on gold (other than for retirement of national bank notes), and beginning June 1935, transactions in checking accounts of certain specialgovernmental agencies whose balances were transferred on May 31,1935, to these accounts. ° Excess of credits.
Digitized for FRASER http://fraser.stlouisfed.org/ Federal Reserve Bank of St. Louis
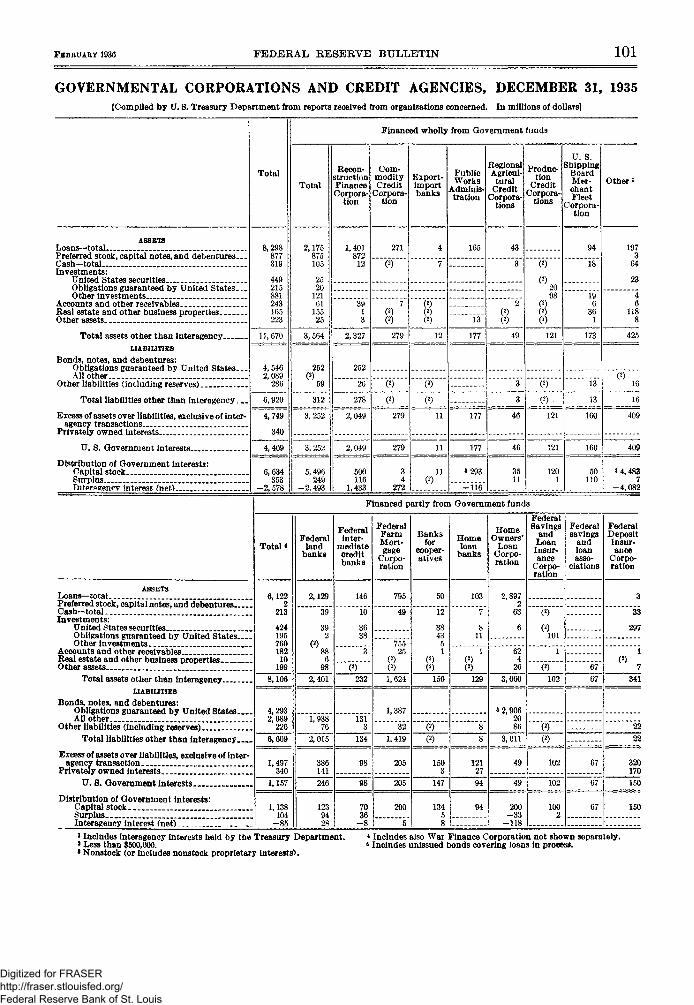
FEBRUARY] FEDERAL RESERVE BULLETIN 101
GOVERNMENTAL CORPORATIONS AND CREDIT AGENCIES, DECEMBER 31, 1935(Compiled by U. 8. Treasury Department from reports received from organizations concerned. In millions of dollars]
ASSETSLoans—total.... _Preferred stock, capital notes,and debentures...Cash—total . .Investments:
United States securities .Obligations guaranteed by United States. . .Other investments
Accounts and other receivablesReal estate and other business propertiesOther assets
Total assets other than InteragencyLIABILITIES
Bonds, notes, and debentures:Obligations guaranteed by United States. . .All other
Other liabilities (including reserves)
Total liabilities other than interageucy...
Excess of assets over liabilities, exclusive of inter-agency transactions..
Privately owned interests
U. S. Government interests
Distribution of Government interests:Capital stock . . . .SurplusIntarflRenov interest (net)
ASSETSLoans—totalPreferred stock, capital notes, and debenturesCash—totalInvestments:
United States securitiesObligations guaranteed by United StatesOther Investments.
Accounts and other receivablesReal estate and other business propertiesOther assets _ _
Total assets other than InteragencyLIABILITIES
Bonds, notes, and debentures:Obligations guaranteed by United StatesAllother
Other liabilities (including reserves)Total liabilities other than interagency-
Excess of assets over liabilities, exclusive of inter-agency transaction
Privately owned interestsU. S. Government interests . - . . . .
Distribution of Government Interests:Capital stock _SurplusInteragency Interest (net) .._ ._
Total
8,298877319
449215881243165223
11, 670
4,5462,089
286
6,920
4,749
340
4,409
6,634353
- 2 , 578
Financed wholly from Government funds
Total
2,175875105
2520
12161
15525
3,564
252
59
312
3,252
3, 252
5, 496249
- 2 , 493
Recon-structionFinanceCorpora-
tion
1,401872
12
3913
2,327
252
26
278
2,049
2,049
500116
1,433
Com-modityCredit
Corpora-tion
271
7
279
(2)
(2)
279
279
34
272
Export-importbanks
4
7
12
(2)
(2)
11
11
11
PublicWorks
Adminis-tration
165
13
177
177
177
3 293
-116
RegionalAgricul-
turalCredit
Corpora-tions
43
3
2
49
3
3
46
46
3511
Produc-tion
CreditCorpora-
tions
98
121
(2)
( 2 ) •
121
121
1201
u. s.Shipping
BoardMer-chantFleet
Corpora-tion
94
18
196
361
173
13
13
160
160
50110
Other i
1973
64
23
46
1188
425
16
16
409
409
3 4, 4837
-4 ,082
Financed partly from Government funds
Total *
6,1222
213
424195760182
10199
8,106
4,2932,089
226
6,609
1,497340
1,157
1,138104
- 8 5
Federalland
banks
2,129
39
392
886
98
2,401
1,93876
2,015
386141
246
1239428
Federalinter-
mediatecreditbanks
146
10
3638
3
232
1313
134
95
98
7036
- 8
FederalFarmMort-gage
Corpo-ration
795
49
75525
1,624
1,387
32
1,419
205
205
200
5
Banksfor
cooper-atives
50
12
3843
51
150
(2)
(2)
1503
147
13458
Homeloan
banks
103
7
811
1
129
8
8
12127
94
94
HomeOwners'
LoanCorpo-ration
2,8972
63
6
624
26
3,060
5 2,9062086
3,011
49
49
200- 3 3
-118
FederalSavings
andLoanInsur-ance
Corpo-ration
101
1
(2)
102
(2)
(2)
102
102
1002
Federalsavings
andloanasso-
ciations
67
67
67
67
67
FederalDepositInsur-ance
Corpo-ration
3
33
297
1
7
341
22
22
320170
150
150
1 Includes Interagency interests held by the Treasury Department.* Less than $500,000.' Nonstock (or Includes nonstock proprietary interests).
* Includes also War Finance Corporation not shown separately.B Includes unissued bonds covering loans in process.
Digitized for FRASER http://fraser.stlouisfed.org/ Federal Reserve Bank of St. Louis
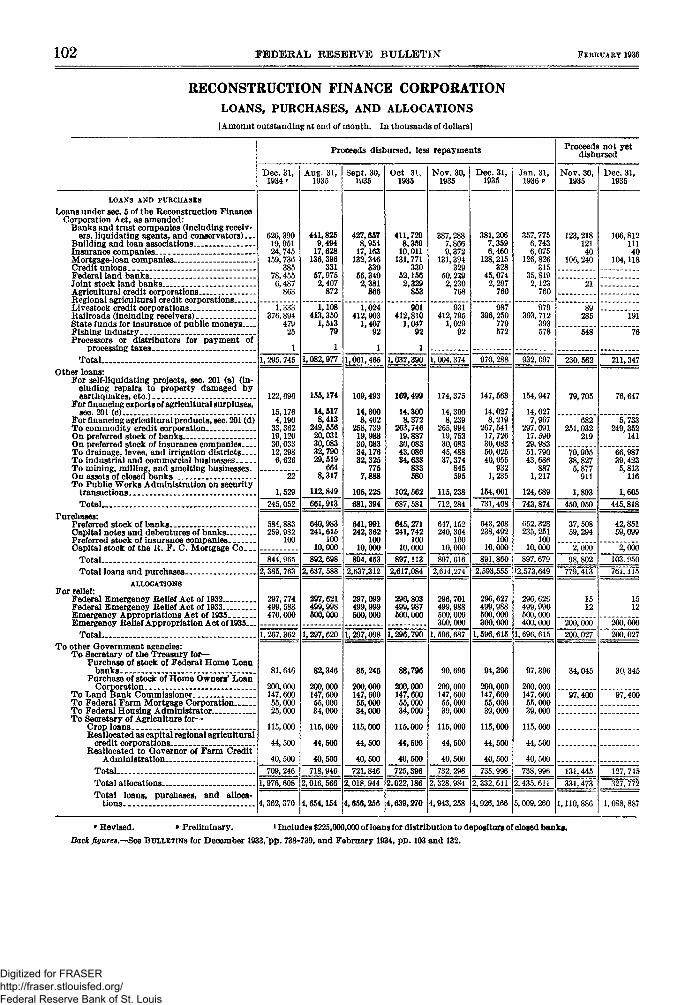
102 FEDERAL RESERVE BULLETIN FEBRUARY 1936
RECONSTRUCTION FINANCE CORPORATIONLOANS, PURCHASES, AND ALLOCATIONS
[Amount outstanding at end of month. In thousands of dollars]
LOANS AND PURCHASES
Loans under sec. 5 of the Reconstruction FinanceCorporation Act, as amended:
Banks and trust companies (including receiv-ers, liquidating agents, and conservators)...
Building and loan associations
Mortg&gA-loan companiesCredit unionsFederal land banksJoint stock land banks _ _Agricultural credit corporations --Regional agricultural credit corporationsLivestock credit corporationsRailroads (including receivers) __State funds for insurance of public moneysFishing industryProcessors or distributors for payment of
processing taxes--Total
Other loans:For self-liquidating projects, sec. 201 (a) (In-
cluding repairs to property damaged byearthquakes, etc.)
For financing exports of agricultural surpluses,sec. 201 (c)
For financing agricultural products, sec. 201 (d)To commodity credit corporationOn preferred stock of banksOn preferred stock of insurance companiesTo drainage, levee, and irrigation districtsTo industrial and commercial businessesTo mining, milling, and smelting businessesOn assets of closed banks .To Public Works Administration on security
transactionsTotal
Purchases:Preferred stock of banks.Capital notes and debentures of banksPreferred stock of insurance companies--Capital stock of the R. F. C. Mortgage Co.—
Total —Total loans and purchases
ALLOCATIONSFor relief:
Federal Emergency Relief Act of 1932Federal Emergency Relief Act of 1933Emergency Appropriations Act of 1935-Emergency Relief Appropriation Act of 1935
Total _To other Government agencies:
To Secretary of the Treasury for—Purchase of stock of Federal Home Loan
banksPurchase of stock of Home Owners' Loan
Corporation .To Land Bank Commissioner _To Federal Farm Mortgage CorporationTo Federal Housing Administrator.To Secretary of Agriculture for—
Crop loansReallocated as capital regional agricultural
credit corporationsReallocated to Governor of Farm Credit
AdministrationTotal —Total allocations.—Total loans, purchases, and alloca-
tions
Proceeds disbursed, less repayments
Dec. 31,1934 r
626,39019,95124,745
159,736385
78,4556,487
863
1,333376,894
47925
1
1,295, 745
122, 696
15,1764,190
33,36219,12030,03312, 2986,626
22
1,529
245,052
584,883259,982
100
844.965
2,385, 763
297, 774499,588470, 000
1,267,362
81, 646
200,000147,60055,00025,000
115,000
44, 500
40,500
709, 246
1,976, 608
4,362, 370
Aug. 31,1935
441,8259,494
17,628136,396
33157,9752,407
872
1,108413,350
1,51379
1
1,082,977
155,174
14,5178,413
249,55620,03130,08332,79029,519
6648,317
112,849
661,913
640,983241,615
10010,000
892, 698
2, 637, 588
297,621499,998500,000
1,297,620
82,346
200,000147,60055,00034,000
115,000
44,500
40,500
718,946
2,016, 566
4, 654,154
Sept. 30,1935
427,6578,954
17,163132,346
33056,3402,381
866
1,024412,903
1,40792
1
1,061, 465
169,493
14,3008,402
258, 73919,98830,08334,17632,325
7757,888
105, 225
681,394
841,991242,362
10010,000
894,453
2,637,312
297,099499,999500,000
1,297,098
85,246
200,000147,60055,00034,000
115,000
44,500
40,500
721,846
2,018,944
4,656,256
Oct 31,1935
411,7298,359
10,011131,771
33052,1562,329
853
901412,810
1,04792
1
1,032,390
169,499
14,3008,372
263,74619,88730,08343,08634,633
833580
102,562
687,581
645,271241,742
10010,000
897,113
2,617,084
296,803499,987500,000
1,296,790
88,796
200,000147,60055,00034,000
115.000
44,500
40,500
725,396
2,022,186
4,639,270
Nov. 30,1935
387, 2887,8669,372
131,394329
50, 2Z92,230
768
931412, 795
1,02992
1,004,374
174,375
14,3008,239
265,99419, 75330,08345,48837,374
845595
115,238
712, 284
647,152240,364
10010, 000
897. 616
2,614,274
296,701499,988500,000300,000
1, 596,687
90, 696
200,000147,60055,00039,000
115,000
44,500
40,500
732, 296
2, 328, 984
4,943,258
Dec. 31,1935
381,2067,3596,460
128,215328
45,0742,297
760
987396,250
779572
970, 288
147,563
14,0278,219
267,54117,72630,08350,02540,055
9321,235
154,001
731,408
643,268238,492
10010,000
891,860
2,593,555
296,627499,988500,000300,000
1,596,615
94,396
200,000147,60055,00039,000
115,000
44,500
40,500
735,996
2, 332, Gil
4,926,166
Jan. 31,1936 P
357,7756,7436,075
126,826315
35, 8192,123
760
979393, 712
393578
932, 097
154, 947
14,0277,967
297, 09117, 59029, 98351, 79043,686
8871,217
124,689
743,874
652,328235, 251
10010,000
897,679
12,573,649
296,626499,990500,000400,000
1, 696, 615
97, 396
200,000147,60055,00039, 000
115, 000
44,500
40, 500
738,996
2,435,611
5, 009, 260
Proceeds not yetdisbursed
Nov. 30,1935
123,21812140
106,240
21
89285
548
230,562
79,705
682251,032
219
70,90538,8275,877
911
1,893
450,050
37,50859, 294
2,000
98, 802
779,413
1512
200,000
200,027
34,045
97,400
131,445
331, 473
1,110,886
Dec. 31r
1935
106,81211140
104,118
191
76
211,347
76,647
5,733249,352
141
66,98739,4235,813
116
1,605
445,818
42,85159,099
2,000
103,950
761,115
1512
200,000
200,027
30,345
97,400
127, 745
327, 772
1, 088, 887
* Revised. * Preliminary. »Includes $225,000,000 of loans for distribution to depositors of closed bank*.
Back figures.—Qee BULLETINS for December 1933,"pp. 738-739, and February 1934, pp. 103 and 132.
Digitized for FRASER http://fraser.stlouisfed.org/ Federal Reserve Bank of St. Louis
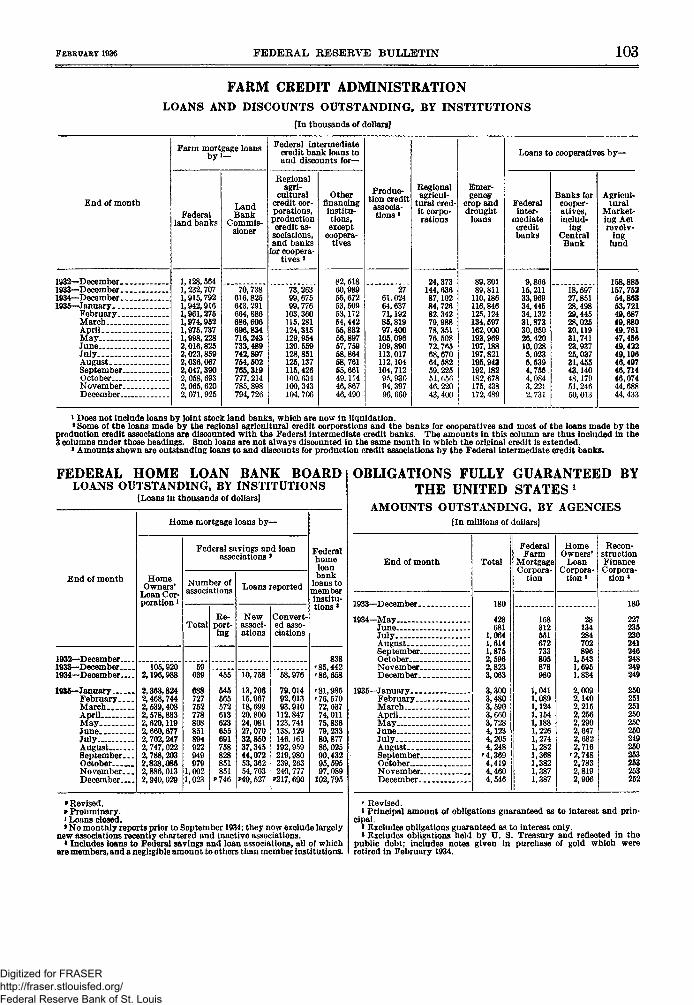
FEBRUARY 1936 FEDERAL RESERVE BULLETIN 103
FARM CREDIT ADMINISTRATIONLOANS AND DISCOUNTS OUTSTANDING, BY INSTITUTIONS
[In thousands of dollars]
End of month
Farm mortgage loansby»—
Federalland banks
LandBank
Commis-sioner
Regionalagri-
culturalcredit cor-porations,productioncredit as-
sociations,and banks
for coopera-tives J
Federal intermediatecredit bank loans toand discounts for—
Otherfinancinginstitu-tions,except
coopera-tives
Produc-tion credit
associa-tions »
Regionalagricul-
tural cred-it corpo-rations
Emer-gency
crop anddrought
loans
Loans to cooperatives by—
Federalinter-
mediatecreditbanks
9,86615,21133,96934,44534,13231,87330,05026,42010,0285,0235,5394,7554,0843, 2212, 731
Banks forcooper-atives,includ-
ingCentralBank
18,69727,85128,49829,44528,02530,11931,74123,93725,03731,45543,14048,17951,24650,013
Agricul-tural
Market-ing Actrevolv-
ingfund
1932—December.1933—December.1934—December.1935—January. _.
February..MarchAprilMayJune .JulyAugustSeptember.OctoberNovember.December.
1,128,5641,232,7071,915,7921,942,9161,961,2751,974,9521,975,7371,998,2282,016,8252,023,8592,036,0672,047,3902,058,6932,065, 6202, 071, 925
70,738616,825643, 291664,886686,606696,834716,243733,489742,897754,602765,319777, 214785,898794,726
73, 26399, 67599, 776103, 360115,281124,315129,954130. 559128,851125,137115,426100.634100, 343104, 706
82, 51860,98955, 67253, 50953,17254,44255,83256,89757, 75958,86458, 76155,66149,11446,86746,490
2761.02464, 63771,19286,81997.400105,096109,890113,017112,104104,7129.\ 93094, 39796, 660
24,373144,63687,10284,72682, 34279,98878, 35176,50872,7R568,67064,58259, 22551,65646,22043, 400
89,30189,811110,186116,846125,124134,597162,000193,969197,188197,821195,943192,182182,678175,438172,489
158,885157,75254,86353,72149.68749,88049,76147,45649,43249,19646,49746,71446,07444.68844, 433
* Does not include loans by joint stock land banks, which are now in liquidation.1 Some of the loans made by the regional agricultural credit corporations and the banks for cooperatives and most of the loans made by the
production credit associations are discounted with the Federal intermediate credit banks. The amounts in this column are thus included in the3 columns under those headings. Such loans are not always discounted in the same month in which the original credit is extended.
> Amounts shown are outstanding loans to and discounts for production credit associations by the Federal intermediate credit banks.
FEDERAL HOME LOAN BANK BOARDLOANS OUTSTANDING, BY INSTITUTIONS
[Loans in thousands of dollars]
End of month
1932—December1933—December1934—December....
I93lh-JanuaryFebruaryMarchAprilMayJuneJulyAugustSeptember...OctoberNovember.. .December
Home mortgage loans b y -
HomeOwners'
Loan Cor-poration 1
105,9202,196,988
2,363,8242,468,7442,539,4082,578,8832,620,1192,660,6772,702,2472,747,0222, 788,2032,838,0662,886,0132,940,029
Federal savings and loanassociations *
Number ofassociations
Total
59639
688727752778808851894922949979
1,0021,023
Re-port-ing
455
545565672613623655691758828851851
*746
Loans reported
Newassoci-ations
10,758
13,70615,96718,69920.80024, 08127, 07032,85037,34544,07253,36254, 703
*49, 527
Convert-ed asso-ciations
58,976
79,01492,01393,910
112,847123,741138,129146, 161192,959219,980239, 263240, 777
*217,690
Federalhomeloanbank
loans tomemberinstitu-tions *
838'85,442'86,658
'81,985'76,57072,63774,01175,83679,23380,87786, 02590,43295,59597,089
102,795
'Revised.9 Preliminary.1 Loans closed.* No monthly reports prior to September 1934; they now exclude largely
new associations recently chartered and inactive associations.* Includes loans to Federal savings and loan associations, all of which
are members, and a negligible amount to others than member institutions.
OBLIGATIONS FULLY GUARANTEED BYTHE UNITED STATES l
AMOUNTS OUTSTANDING, BY AGENCIES[In millions of dollars]
End of month
1933—December.
1934—MayJuneJulyAugustSeptember.October—November.December.
1935—January. . .February..MarchAprilMayJuneJulyAugustSeptember.October.November.December.
Total
180
423681
1,0641,6141,8752,5962,8233,063
3,3003,4803,5903,6603,7284,1234,2054,248
'4,3694,4194,4604,546
FederalFarm
MortgageCorpora-
tion
168312551672733805878980
1,0411,0891,1241,1541,1881,2261,2741,2821,3681,3821,3871,387
HomeOwners'
LoanCorpora-
tion1
Recon-structionFinanceCorpora*
tion1
28134284702896
1,5431,6951,834
2,0092,1402,2152,2562,2902,6472,6822,716
'2,7482,7832,8192,906
180
227235230241246248249249
250251251250250250249250253253253252
* Revised.* Principal amount of obligations guaranteed as to interest and prin-
cipal.' Excludes obligations guaranteed as to interest only.1 Excludes obligations held by U. S. Treasury and reflected in the
public debt; includes notes given in purchase of gold which wereretired in February 1934.
Digitized for FRASER http://fraser.stlouisfed.org/ Federal Reserve Bank of St. Louis
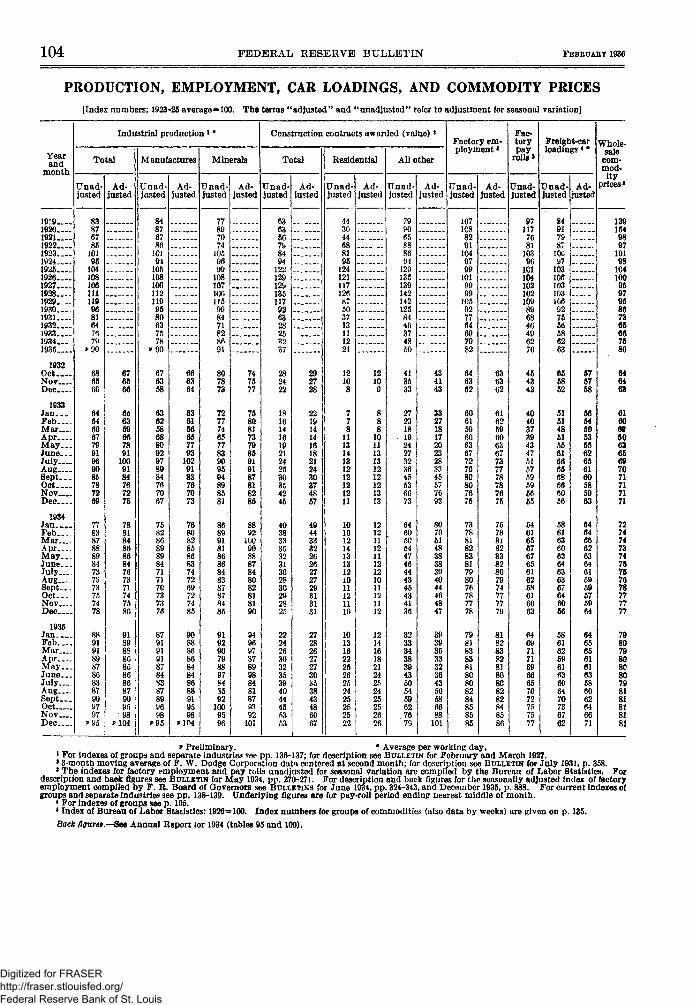
104 FEDERAL RESERVE BULLETIN FEBRUARY 1936
PRODUCTION, EMPLOYMENT, CAR LOADINGS, AND COMMODITY PRICES[Index numbers; 1923-25 average=lOO. The terms "adjusted" and "unadjusted" refer to adjustment for seasonal variation]
Yearand
month
19'919201921 —19221923 .19241925-—19261927 . .19281929193019311932. . .19331S34 „1935
1932OctNovD e c —
1933JanFeb .—Mar-._.AprMayJune...July....AugSept---OetNov....Dec—
1934Jan. . . .Feb....MarAprMay...June...July....AugSept...Oct-_-Nov.__.Dee—-
1935JanFeb....Mar....AprMayJune.. .July....Aug....Sept.-.OctNovDec
Industrial production * •
Total
Unad-justed
83876785
10195
1041081061111199681647fi70
686560
646460677991969086787269
778387888984737373757478
8891918987868387909797
»95
Ad-justed
676566
656359667891
1009184767275
788184868684767371747586
91898886858G8687909598
»104
Manufactures
Unad-justed
848767S6
10194
105108100U 2119
9580637578
p 90
676358
636258688092978984767067
758286898984717170737376
879191918784S387899698
Ad-justed
666364
636156657793
1029183767073
76808285gg83747269727485
9088868684848688919598
Minerals
Unad-justed
77897074
1059699
108107IOC11599847182
91
807873
727774657783909594898581
868991818686848387878485
91929079889784S592
1009596
Ad-justed
747577
758081737985919187818286
8892
100908887848082818190
949697878998848187Q392
101
Construction contracts awarded (value) *
Total
Unad-justed
636356798494
122129129135117926328253237
282422
181614161921242530354245
403833363231302830292825
222426303235394044455353
Ad-lusted
292728
221914141618212430374857
494433322626272729313131
272826272730353843486067
Residential
Unad-justed
443044688195
12412111712687503713111221
12108
778
111314131212121211
101012141313121011121110
101316222526252425252522
Ad-justed
1210
9
888
101113131212121313
121211121112121011121112
121416182124252425252626
All other
Unad-justed
799065S88694
1201351391421421258440374850
413533
272318
> 1 92427323645636673
64605C544746444345434136
323334383943505459627679
Ad-justed
434143
332718172023283345577693
807051483838394044464847
3939353332364350586688
101
Factory em-ployment «
Unad-justed
1071088291
1049799
1019999
105927764697982
646362
606159606367727680807675
737881828381798076787778
798183838180808284858585
Ad-justed
636362
616259606367737778787675
757881828382807974777779
8182838281808C8282848586
Fac-torypay.
rolls1
Unad-justed
97117
7681
10396
1C1104102102109896846496270
454342
404037394347515759595655
546165676765616258616063
646971716966657072757577
Freight-carloadings«*
Unad-justed
84917987
10097
103106103103106927556686263
655852
515148515561666568666056
586163eo636463636764RO56
586162596163606470736762
Ad-justed
575758
565450535562656160585963
648466626364615959575964
646565616163586062646671
Whole-sale
com-mod-ity
prices'
1391549897
10198
1C4100959795867365667580
646463
6160
m906366697071717171
72747473747675767j777777
798079808080798181818181
» Preliminary. * Average per working day.1 For indexes of groups and separate industries see pp. 136-137; for description see BULLETIN for February and March 1927.13 month moving average of F. W. Dodge Corporation data centered at second month; for description see BULLETIN for July 1931, p. 358.1 The indexes for factory employment and pay rolls unadjusted for seasonal variation are compiled by the Bureau of Labor Statistics. Fordescription and back figures see BULLETIN for May 1934, pp. 270-271. For description and back figures for the seasonally adjusted index of factoryemployment compiled by F. R. Board of Governors see BULLETINS for June 1934, pp. 324-343, and December 1935, p. 888. For current indexes ofgroups and separate industries see pp. 138-139. Underlying figures are for pay-roll period ending nearest middle of month.
* For indexes of groups see p. 105.1 Index of Bureau of Labor Statistics: 1926*100. Index numbers for groups of commodities (also data by weeks) are given on p. 135.Bach figure*.—See Annual Report tor 1934 (tables 95 and 100).
Digitized for FRASER http://fraser.stlouisfed.org/ Federal Reserve Bank of St. Louis
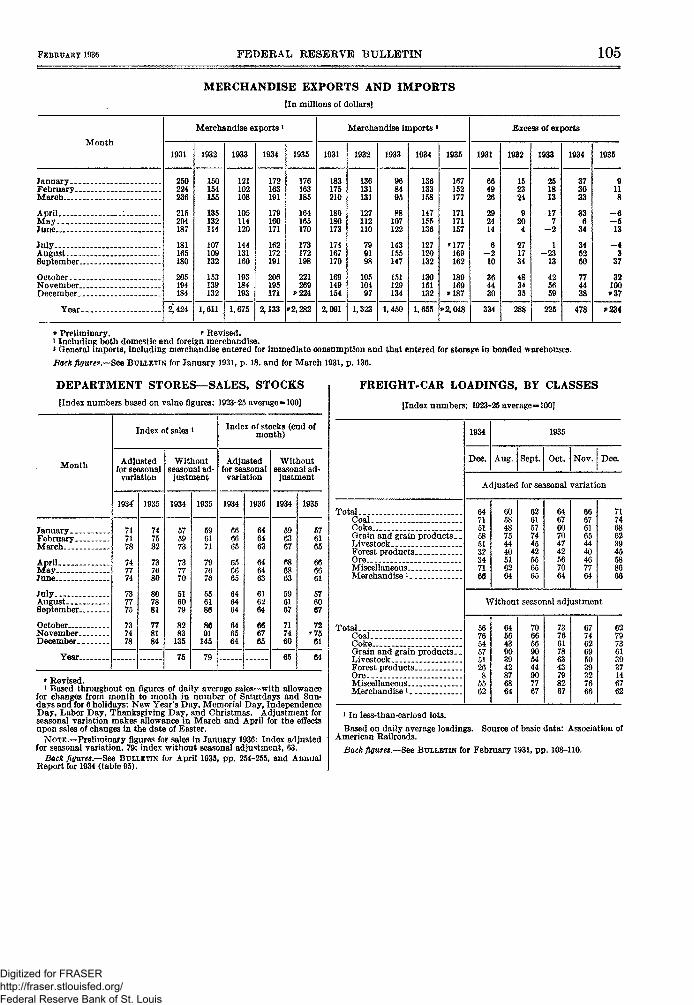
FEBRUARY 1936 FEDERAL RESERVE BULLETIN 105
MERCHANDISE EXPORTS AND IMPORTS[In millions of dollars]
Month
January -_FebruaryMarch
April . : .May _June
JulyAugustSeptember
OctoberNovemberDecember _.
Year
Merchandise exports 1
1931
250224236
215204187
181165180
205194184
2,424
1932
150154155
135132114
107109132
153139132
1,611
1933
121102108
105114120
144131160
193184193
1,675
1934
172163191
179160171
162172191
206195171
2,133
1935
176163185
164165170
173172198
221269
*224
*2,282
Merchandise imports *
1931
183175210
186180173
174167170
169149154
2,091
1932
136131131
127112110
790198
10510497
1,323
1933
968495
88107122
143155147
151129134
1,450
1934
136133158
147155136
127120132
130151132
1,655
1935
167152177
171171157
'177169162
189169
»187
*2,048
Excess of exports
1931
664926
292414
6- 210
364430
334
1932
152324
9204
271734
48
35
288
1933
251813
177
- 2
1- 2 3
13
425659
225
1934
373033
336
34
345260
774438
478
1935
9118
—6- 513
- 43
37
32100
»234
» Preliminary. r Revised.i Including both domestic and foreign merchandise.* General imports, including merchandise entered for immediate consumption and that entered for storage in bonded warehouses.
Back figures.—See BULLETIN for January 1931, p. 18, and for March 1931, p. 136.
DEPARTMENT STORES—SALES, STOCKS[Index numbers based on value figures; 1923-25 average** 100]
Month
January. _February.March
April.May-June.-
JulyAugustSeptember-
OctoberNovember..December..
Year—
Index of sales l
Adjustedfor seasonal
variation
1934' 1935
Withoutseasonal ad-
justment
1934 1935
575973
737770
516079
8283
135
75
91145
79
Index of stocks (end ofmonth)
Adjustedfor seasonal
variation
1934 1935
Withoutseasonal ad-
justment
1934 1935
65
596367
686863
576165
666661
64
* Revised.1 Based throughout on figures of daily average sales—with allowance
for changes from month to month in number of Saturdays and Sun-days and for 6 holidays: New Year's Day, Memorial Day, IndependenceDay, Labor Day, Thanksgiving Day, and Christmas. Adjustment forseasonal variation makes allowance in March and April for the effectsupon sales of changes in the date of Easter.
NOTE.—Preliminary figures for sales in January 1936: Index adjustedfor seasonal variation, 79; index without seasonal adjustment, 63.
Back figures.—See BULLETIN for April 1935, pp. 254-255, and AnnualReport for 1934 (table 95).
FREIGHT-CAR LOADINGS, BY CLASSES
[Index numbers; 1923-25 average*" 100]
TotalCoalCoke .Grain and grain products._LivestockForest products _.OreMiscellaneous.Merchandise »
TotalCoalCoke _Grain and grain products _ _LivestockForest productsOreMiscellaneousMerchandise *
1934
Dec.
1935
Aug. Sept. Oct. Nov. Dec.
Adjusted for seasonal variation
647151585132347166
605848754440516264
626157744542556565
646760704742567064
666761654440467764
717468623945588660
Without seasonal adjustment
567654575126
s5562
645643903942876864
706656905444907767
737661786343798267
677462695039327666
627973613937146762
i In less-than-carload lots.
Based on daily average loadings. Source of basic data: Association ofAmerican Railroads.
Back figures.—See BULLETIN for February 1931, pp. 108-110.
Digitized for FRASER http://fraser.stlouisfed.org/ Federal Reserve Bank of St. Louis
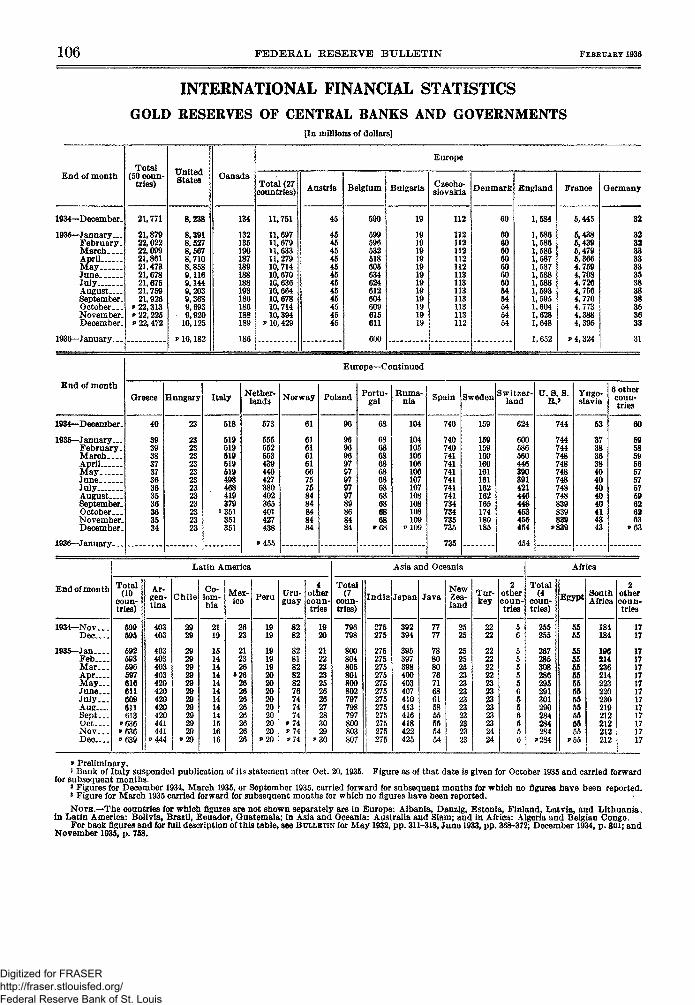
106 FEDERAL RESERVE BULLETIN FEBRUARY 1936
INTERNATIONAL FINANCIAL STATISTICSGOLD RESERVES OF CENTRAL BANES AND GOVERNMENTS
[In millions of dollars]
End of month
1934—December.
1935—January...February.MarchApril...MayJuneJulyAugust—September.October. __November-December.
1936—January.
End of month
1934—December.
1935—January...February.MarchAprilMayJuneJulyAugust....September-October. ._November-December.
1936—January
End of month
1934—Nov...D e c . . .
1935—Jan....Feb. . . .Mar . . .Apr....May...June.. .July. . .AugSept...Oct... .Nov. . .Dec
Total(50 coun-
tries)
21,771
21,87922,02222,09921,86121.47321,67821,67521, 75921,926
P 22,313p 22,225P 22,472
UnitedStates
8,238
8,3918,5278,5678,7108,8589,1169,1449,2039,3689,6939,920
10,125
p 10,182
Canada
134
132135190187189188188193186186188189
186
Total (27countries)
11,751
11,69711,67911,63311,27910,71410,67010,63610, 66410, 67810.71410,394
P 10, 429
Austria
45
454545454545454545454545
Belgium
590
599596532518605634624612604609615611
600
Bulgaria
19
191919191919191919191919
Europe
Czecho-slovakia
112
112112112112112113113113113113113112
Denmark
60
606060606060605454545454
England
1
11;;•
:
:
]
,584
,586,586,586,587,587,588,588,593,595,604,628,648
,652
France
p
5,445
5,4385,4395,4795,3664,7594,7084,7264,7564,7704.7734,3884,395
4,324
Germany
32
323233333335383838353633
31
E urope—C ontinued
Greece I
40
393938373736363536363534
lungary
23
232323232323232323232323
Italy
I
iii
i
518
519519519519519
m168119$79351551551
Nether-lands
573
555552553439440427380402365401427438
P455
Norway
61
616161616675758484848484
Poland
Latin America
Total(10
coun-tries)
vp
V
599595
592593596597616611609611613536636639
Ar-gen-tina
403403
403403403403420420420420420441441
J»444
Chile
2929
2929292929292929292929
.29
Co-lom-bia
2119
151414141414141414151616
Mex-ico
2623
212326
1262626262626262626
Peru
1919
1919192020202020202020
J»20
Uru-guay
8282
828182828276747474
v 74v 74, 7 4
4othercoun-tries
p
1920
212223232526262728302930
96
969696979797979789868484
Total(7
coun-tries)
796798
800804805801800802797798797800803807
Portu-gal
68
6868686868686868636868
"68
India
275275
275275275275275275275275275275275275
Ruma-nia
104
104105106106106107107108108108109
*109
Asia and
Japan
392394
395397398400403407410413416418422425
Spain
-
r40
?40r40*41r4i741741741741734734735735
735
Sweden
Oceania
Java
7777
788080767168615855555454
NewZea-land
2525
252525232323232323232323
159
159159160160161161162162165174180185
Tur-key
2222
222222222323232323232424
Switzer-land
624
60058656044639039142144644S453455454
454
2othercoun-tries
5C
555556556556
U. S. S.
•
i
744
744744748748748748748748539339339
'839
Total(4
coun-tries)
255255
267285308286295291301290284284284
P284
Yugo-slavia
53
373836384040404040414343
6 othercoun-tries
Africa
Egypt
II
i
I
p
55>5
555555555555555555555555
SouthAfrica
184184
196214236214223220230219212212212212
60
5958595657575759626363
*63
2othercoun-tries
1717
171717171717171717171717
p Preliminary.1 Bank of Italy suspended publication of its statement after Oct. 20, 1935. Figure as of that date is given for October 1935 and carried forward
for subsequent months.3 Figures for December 1934, March 1935, or September 1935. carried forward for subsequent months for which no figures have been reported.3 Figure for March 1935 carried forward for subsequent months for which no figures have been reported.
NOTE.—The countries for which figures are not shown separately are in Europe: Albania, Danzig, Estonia, Finland, Latvia, and Lithuania.In Latin America: Bolivia, Brazil, Ecuador, Guatemala; in Asia and Oceania: Australia and Siam; and in Africa: Algeria and Belgian Congo.
For back figures and for full description of this table, see BULLETIN for May 1932, pp. 311-318, June 1933, pp. 368-372; December 1934, p. 801; andNovember 1935, p. 758.
Digitized for FRASER http://fraser.stlouisfed.org/ Federal Reserve Bank of St. Louis
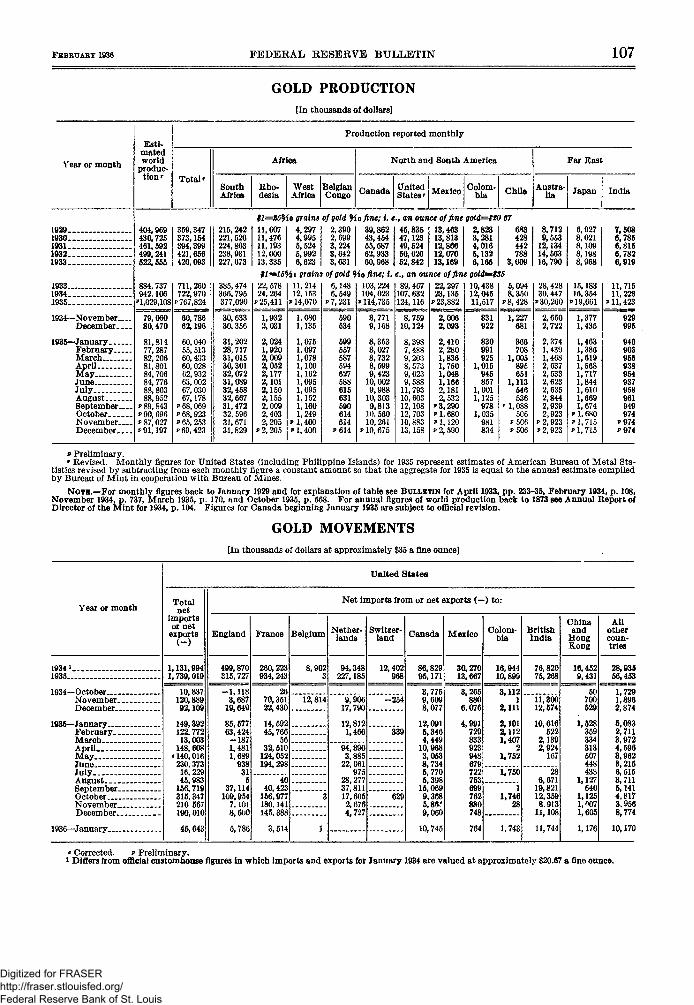
FBBBDAKT 1936 FEDERAL RESERVE BULLETIN 107
GOLD PRODUCTION[In thousands of dollars]
Year or month
Esti-matedworld
produc-tion'
Production reported monthly
Total'
Africa
SouthAfrica
Rho-desia
WestAfrica
BelgianCongo
North and South America
Canada UnitedStates' Mexico
Colom-bia Chile
Far East
Austra-lia Japan India
of gold Ho fine; i. e.t an ounce of fine gold=$20 67
19291930193119321933
193319341935
1934—NovemberDecember
1935—JanuaryFebruaryMarchAprilMayJuneJu ly—AugustSeptemberOctoberNovemberDecember
404,969430,725461,592499,241522,665
359,347373,154394,399421, 656420,093
215, 242221,526224,863238,931227,673
11, 60711,47611,19312,00013,335
4,2974,9955,5245,9926,623
2,3902,6993,2243,6423,631
39,86243,45455,68762,93360,968
45,83547,12349,52450, 62652,842
13,46313,81312,86612,07013,169
2,8233,2814,0165,1326,165
683428442788
3,009
8,7129,553
12,13414, 56316, 790
6,9278,0218,1098,1988,968
7,5086,7866,8186,7826,919
i grains of gold 94 o fine; i. e., an ounce of fine gold=$S5
711,260722,970
v 767,824
60,78662,196
60,04055,51360,43360,02862,93263,00267,03067,178
v 68,069v 68,923* 65,253p69,423
385, 474366, 795377,090
30, 63330,356
31, 20228, 71731,01530,30132,07231,08932,45832,66731,47232, 59631,67131,829
22,57824, 264
p 25,411
1,9322,031
2,0241,9202,0092,0522,1772,1012,1502,1552,0092,4032,205
»2,205
11,21412,153
p 14,070
1
:
:]]
p
L,0801,135
L,075L,0971,0781,106L, 162L,0951,095L, 1621,1601,2491,400
p 1,400
6,1486,549
J>7,231
590~534
599557587594627588615631590614614
J>614
103,224104,023
v 114,735
9,168
8,3538,0278,7328,5999,423
10,0029,988
10,3039,813
10.56010,261
* 10, 675
89,467107,632124,116
8,75910,124
8,3987,4889,2038,5739,6239,588
11,79310,60312,10812, 70310,88313,158
22, 29723,135
p 23,882
2,0062.093
2,4102,2801,8361,7501,0481,1662,1812,532
»3,290»1.680P 1,120v 2,590
10,43812,04511,517
831922
830991
- 9251,015
945857
1,0011,125
9781,035
981834
5,0948.350
*8,428
1,227681
366708
1,005895651
1,113546536
' 1,088506
v 506P 5 0 6
28,42830.447
* 30,260
2,6502,722
2,3741, 4391,4682,6372,5332,6232,6352,8442,9392,923
p 2,923v 2,923
15,18316.354
p19,661
V
V
1,3771,435
L, 4631,386L,619L, 5681,717,844
1,610,669
1,6741,6801,715
P I , 715
946903955938954937958961949974
*974*974
p Preliminary.' Revised. Monthly figures for United States (including Philippine Islands) for 1935 represent estimates of American Bureau of Metal Sta-
tistics revised by subtracting from each monthly figure a constant amount so that the aggregate for 1935 is equal to the annual estimate compiledby Bureau of Mint in cooperation with Bureau of Mines.
NOTE.—For monthly figures back to January 1929 and for explanation of table see BULLETIN for April 1933, pp. 233-35, February 1934, p. 108,November 1934, p. 737, March 1935, p. 170, and October 1935, p. 668. For annual figures of world production back to 1873 see Annual Report ofDirector of the Mint for 1934, p. 104. Figures for Canada beginning January 1935 are subject to official revision.
GOLD MOVEMENTS[In thousands of dollars at approximately $35 a fine ounce]
Year or month
United States
Totalnet
importsor net
exports
Net imports from or net exports (—) to:
England France Belgium Nether-lands
Switzer-land Canada Mexico Colom-
biaBritishIndia
Chinaand
HongKong
Allothercoun-tries
1934 11935 .__..
1934—OctoberNovember. . .December....
1936—JanuaryFebruaryMarch ,AprilMayJuneJuly .AugustSeptember. _.OctoberNovember....December. . .
1936—January
1,131,9941,739,019
499,870315,727
260,223934,243
8,9023
94,348227,185
12,402 86,82995,171
30,27013,667
16,94410,899
76,82075,268
16,4529,431
10,837120,88992,109
149,392122.77213,003
148,608o 140,016
230,37316,22945,983
156,719315,347210 567190,010
45,643
- 1 , 1 1 83,687
19,649
85,57763,424
- 1 8 71,4811,689
93831
537,114
109,9547.1018.600
5,786
2670,35122, 430
14,59245,766
5632,510
124,052194,298
12,814 9,90617,790
- 2 5 4
12,8121,466
4040, 423
156,977180.141145,388
3,514
94,8903,885
22,061975
28,27737,81117,6052,6764,727
629
3,7759,6098,077
12,0915,3464,44910,9683,0538,7345,7705,398
15,0699,3685,86>e
9,060
10,741
3,265880
6,076
4,991729833923948679722753699762880748
764
3,1121
2,111
2,1012,1121,407
21,752
11,30012,574
10,616522
2,1392,924167
1,750
11,746
1,743
286,67119,82112,3598.91311,108
11,744
50700529
1,528359334313507448438
1,127640
1,1251, fX)71,605
1,176
28,93556,453
1,7291,8962,874
5,0832,7113,9724,5963,9623,2156,5153,7115,1414,8173.9568,774
10,170
• Corrected. p Preliminary.* Differs from official customhouse figures in which imports and exports for January 1934 are valued at approximately $20.67 a fine ounce.
Digitized for FRASER http://fraser.stlouisfed.org/ Federal Reserve Bank of St. Louis
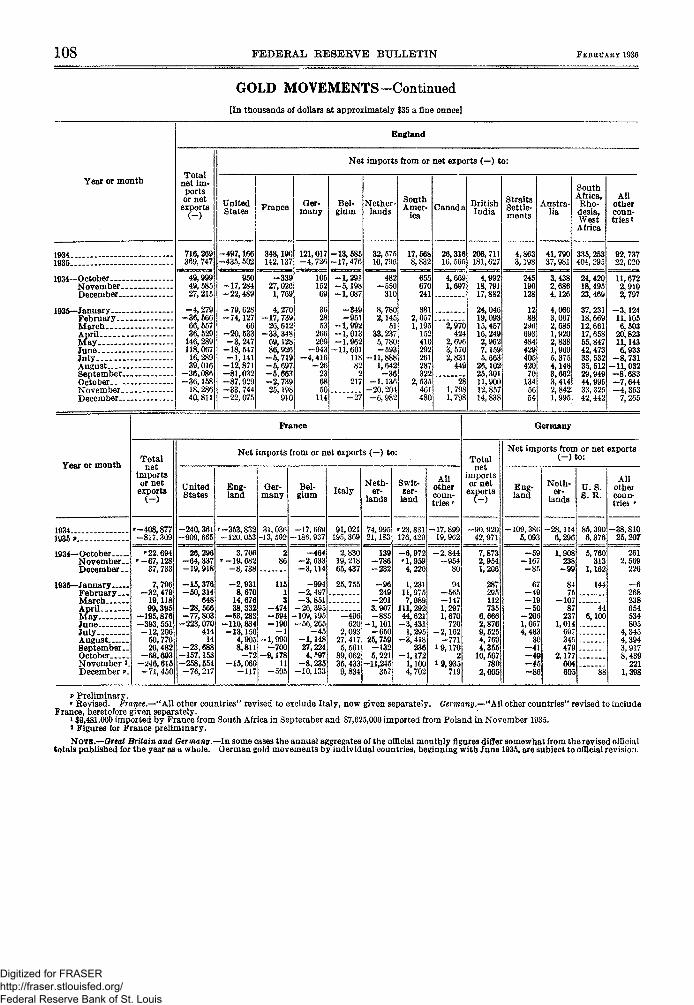
108 FEDERAL RESERVE BULLETIN FEBRUARY 1936
GOLD MOVEMENTS—Continued[In thousands of dollars at approximately $35 a fine ounce]
Year or month
England
Totalnet im-portsor net
exports()
Net imports from or net exports (—) to:
UnitedStates France Ger-
manyBel-
giumNether-
landsSouthAmer-
icaCanada British
IndiaStraitsSettle-ments
Austra-lia
SouthAfrica,Rho-desia,WestAfrica
AHother
utries »
19341935 •1934—October.—.
November.December-.
1935—January—.February..MarchAprilMayJuneJulyAugustSeptember.October....November.December..
716,269369, 747
-497,166-435, 502
49,99949, 58527,215
- 4 , 2 7 9
66, 55736, 529
146, 289118,067
16, 28939, 016
-36 ,086-36 ,158
18,28640,811
348,190142,137
- 3 3 927,026
1,769
4,270- 1 7 , 739
26, 612- 3 3 , 348
69,12886,926
- 5 , 7 1 9- 6 , 697- 5 , 6 6 3- 2 , 73925,198
910
121,017- 4 , 726;
-13, 585-17,476
10515269
362853
266209
- 9 4 3- 4 , 4 1 6
- 2 6236850
114
- 1 , 2 9 1- 5 , 1 9 8- 1 , 0 8 7
- 3 4 9- 9 5 1
- 1 , 9 9 2- 1 , 0 1 3- 1 , 9 6 2
-11,60111882
2217
- 2 7
32, 57510, 796
•--• —
482- 5 5 0
310
8,7802,145
5133, 237
5,780- 5 9 3
-11,8881,642
- 3 6- 1 , 1 3 6
-20 , 201- 6 , 9 8 2
17,5688,832
655670241
2,0571,195
152410292261287322
2,535461480
26,31816, 565
4,1,697
2,970424
3,5702,831
449
281,7981 , 7 "
206,711181,627
4,99218, 79J17,882
24,04619,09315,45716, 2492,9627,1595,663
26,10225,30111,90012,85714,838
4,8633,198
245190128
1288
296693484429405420
701345654
41,79037,981
•••• • l . V . l i U
3,4382,6864,126
4,0663,0672,6851,9202,8381,9695,3754,1483,6623,4142,8421,995
335,253404, 295
24,42018, 49523, 469
37, 23118,66912,66117, 65855,84742,47333, 53235, 51229,94944,99533, 32542, 442
11, 6722,9102,797
- 3 , 1 2 411,1056,503
20,82311,1436,933
- 8 , 7 3 1-11,032- 8 , 6 8 3—7,644- 4 , 353
7,265
Year or month
France
Totalnet
importsor net
exports()
Net imports from or net exports (—) to:
UnitedStates
Eng-land
Ger-many
Bel-gium
Germany
Totalnet
importsor net
exports
Net imports from or net exports(-)to:
Neth-er-
landsU.S.S. R.
Allothercoun-tries r
19341935 v
1934—OctoberNovember..December _-
1935—JanuaryFebruary.—MarchApr i l . . - .MayJuneJulyAugustSeptember-OctoberNovember'.December *>.
-408,877-817,309
-240,361-909, 665
'-353,832-120,053
31,036-13,592
-90. 92042,971
-109, 38(i5,093
-28,1146,296
85,3906,376
-38,81025, 207
'22,694> -67,128
37,733
7,796-32, 47919.11899,395
-195,876-393,551-12,20650,77026,482
-68,693-246,615-71,450
26,296-64,337-19,918
-15,376-50,314
648-28, 566-77,803-223,070
41414
-23,688-157.153-258.554-76, 217
-2,9318,67014,67638,332
-53,283-110,834-13,150
4,9058,811-72
-15,060-117
11513
-474-594-190-1
-1,990-700
-9,17811
-595
7,8732,9541,206
287295112735
6,6662,8769,5254,7694,355
10,567780
2,005
- 1 6 7—85
67- 4 9- 1 9- 5 0
- 2 0 61,05'4,483
30- 4 1- 4 9- 4 5
1,8
8475
- 1 0 787
2371,014
697345479
2,177604605
5,760313
1,162
144
446,100
2612,569
226
238654534805
4,3454,3943,9178,439
2211,398
» Preliminary.* Revised. France.—"All other countries" revised to exclude Italy, now given separately. Germany.—"All other countries" revised to include
France, heretofore given separately.* $9,481,000 imported by France from South Africa in September and $7,625,000 imported from Poland in November 1935.* Figures for France preliminary.
NOTE.—Great Britain and Germany.—In some cases the annual aggregates of the official monthly figures differ somewhat from the revised officialtotals published for the year as a whole. German gold movements by individual countries, beginning with June 1935, are subject to official revision.
Digitized for FRASER http://fraser.stlouisfed.org/ Federal Reserve Bank of St. Louis
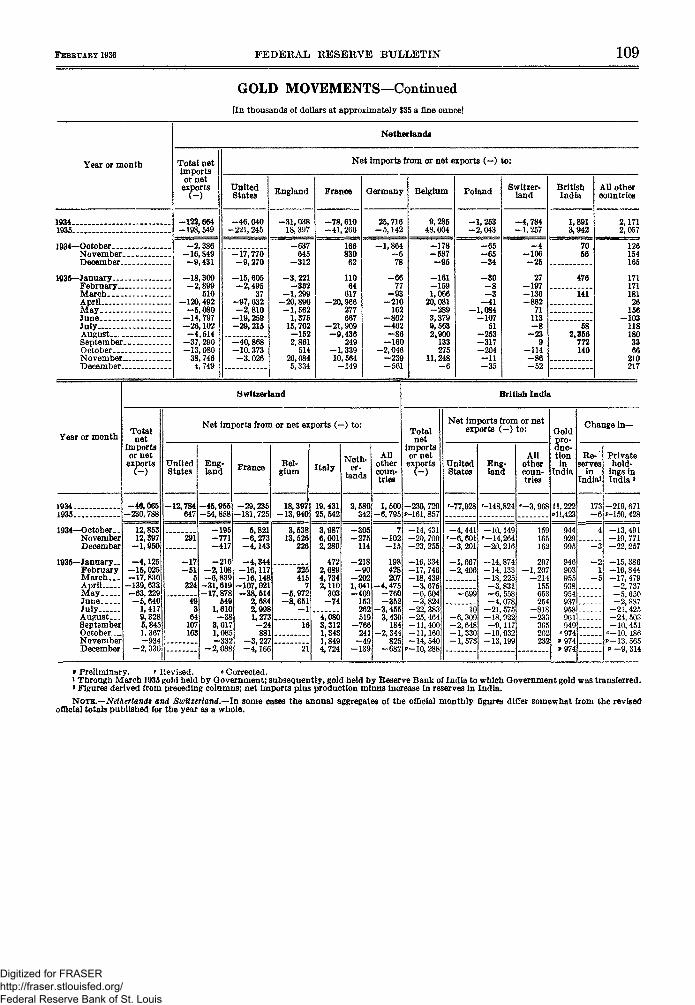
FlBBUAKY 1936 FEDERAL RESERVE BULLETIN 109
GOLD MOVEMENTS—Continued[In thousands of dollars at approximately $35 a fine ounce]
Year or month
Netherlands
Total netimportsor net
exports
Net imports from or net exports (—) to:
UnitedStates England France Germany Belgium Poland Switzer-
landBritishIndia
All othercountries
1934..1935..
-122,664-198, 549
-46,040-221,245
-31,03818, 397
-78,610-41 , 260
25,716-5,142
9,28548,004
- 1 , 253-2, 043
-4,784-1,257
1,8913,942
2,1712,057
1934—OctoberNovember. _December...
1935—JanuaryFebruary—MarchAprilMayJuneJulyAugustSeptember..OctoberNovember...December...
-2 ,386-16,849-9 ,431
-18,300-2,899
510-120,492
-5 ,080-14,797-26,102-4,514
-17,770-9 ,270
-15,605-2,495
37-97,632
- 2 , 810- 1 9 , 259-29,215
-37 , 290-13,080
38,7464,749
-40,868-10,373-3,026
645-312
-3 ,221-352
-1,299-20,890-1 ,562
1,37515, 702
-1522,861
51420,0845,334
166830
11064
617—20,966
277667
-21,909-9 ,436
249-1,33910,564
-149
-1,864- 678
- 6 677
- 9 3-210
162-862-462
- 8 6-160
-2,046-239-561
-178-587- 9 5
-161-1591,066
20,081-2893,3799,5632,900
133275
11,248
- 6 5- 6 5- 3 4
- 3 0- 8- 3
- 4 1-1,084
-10751
-253-317-204—11- 3 5
-4-106
27-197-136
71113-8-23
9-114-86-52
7056
476
141
582,356772140
126154165
17117118126
156-103
1181803366
210217
Year or month
Switzerland
Totalnet
importsor net
exports
Net imports from or net exports (—) to:
UnitedStates
Eng-land France Bel-
gium ItalyNeth-
er-lands
Allothercoun-tries
British India
Totalnet
importsor net
exports()
Net imports from or netexports (~) to:
UnitedStates
Eng-land
Allothercoun-tries
Gold
Sro-uc-
tionin
India
Re- iserves
inIndiaV
Change i n -
Privatehold-
ings inIndia»
1934.1935.
-46,065-230,788
-12,784647
-45,955-54,858
-29,235-181,725
1934—October. .NovemberDecember
1935—January-FebruaryMarch. _.AprilMayJuneJulyAugust...SeptemberOctober _NovemberDecember
12,85312,397
-1,950
-4,125-15,025-17,830-139,633-63,229-5 ,640
1,4179,3285,8451, 367-934
-2 ,330
291
- 1 7- 5 1
324
64107163
-195-771-417
-216-2,108-6,839
-31,619-17,878
5491,610
- 3 83,011,085-332
-2 ,088
5,821-6 ,273-4 ,143
—4,344-16,117-16,148
-107,021-38,514
2,6842,9981,273
- 2 4881
—3,227-4,166
18,397-13,940
• • -
3,53813r 526
226
19,43125, 542
2,580342
1,500-6,795
225415
-5,972-8,65
3,9876,0012,280
472
4,7342,110303-74
4,0803,3121,3431,8494,724
-305-275114
-218-90-2021,041-409153262519
-766241-49
-139
-102-15
198428207
-4,475-760-352
-3,4553,430
184-2, 344
825-682
-230, 720f-161,857
-14,431-20,700-23, 255
-16,334-17,746-18,439-3,675-6,604-3,824-22, 383-25, 464-11,400-11,160-14,540
v-10, 288
•"-77,928 '-148,824 '-3,968 11, 222*11,423
173- 6
-219,671-150, 428
-4 ,441'-6,601- 3 , 201
-2,406
10-6,-2,648-1,330-1,573
-10,149—14,264-20,216
-14,874-14,133-18,225-3,831-6, 558-4,078-21,575-18,922-9,117-10,032-13,199
159165162
207- 1 , 207
- 2 1 4155653254
- 8 1 8- 2 3 3
20223:
944929995
946903955938954937958961949
*974
- 3
- 5
-13,491-19,771-22,257
- 1 5 , 386-16,844-17 , 479
- 2 , 737-5,650-2,887
- 2 1 , 425-24 , 503-10,451
=-10,186v-13,565
- 9 , 314
v Preliminary. »• Revised. «Corrected.i Through March 1935 gold held by Government; subsequently, gold held by Reserve Bank of India to which Government gold was transferred.* Figures derived from preceding columns; net imports plus production minus increase in reserves in India.
NOTE.—Netherlands and Switzerland.—In some cases the annual aggregates of the official monthly figures differ somewhat from the revisedofficial totals published for the year as a whole.
Digitized for FRASER http://fraser.stlouisfed.org/ Federal Reserve Bank of St. Louis
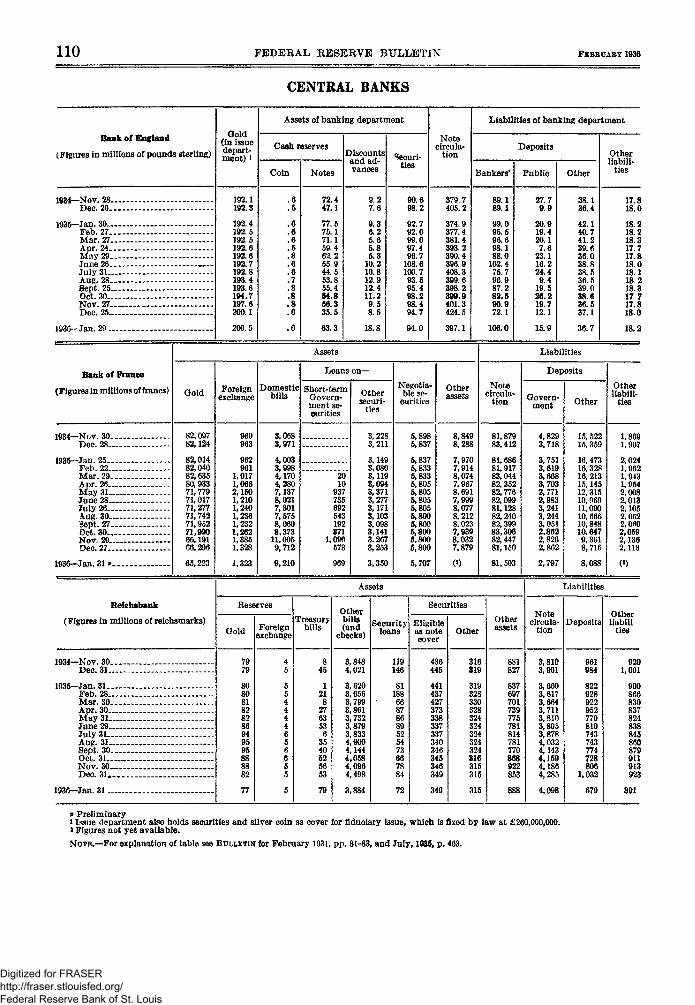
110 FEDERAL RESERVE BULLETIN FEBRUARY 1936
CENTRAL BANES
Bank of England
(Figures in millions of pounds sterling)
Gold(in issuedepart-ment) *
Assets of banking department
Cash reserves
Coin Notes
Discountsand ad-vances
Securi-ties
Notecircula-
tion
Liabilities of banking department
Deposits
Bankers'
89.189.1
99.095.596.698.188.0
102.475.796.987.282.590.972.1
106.0
Public
27.79 9
20.919.420.17.6
23.116.224.49.4
19.526.219.712.1
15.9
Other
38.136.4
42.140.741.239.636.038.838.536.539.038.636.537.1
36.7
Otherliabili-
ties
1934—Nov. 28-Dec. 26..
1935—Jan. 30—Feb. 27..Mar. 27.Apr.24-.May 29..June 26-.July 3 1 -Aug. 28.8ept. 25-Oct. 30-Nov. 27..Dec. 25-
1936—Jan. 29 „
192.1192.3
192.4192.5192.5192.6192.6192.7192.8193.4193.61W.7197.6200.1
200.5
72.447.1
77.575.171.159.462.255.944.553.855.454.856.335.5
9.27.6
9.36.25.65.85.3
10.210.812.912.411.29.58.5
18.8
90.698.2
92.792.099.097.496.7
108.6100.793.595.498.298.494.7
94.0
379.7405.2
374.9377.4381.4393.2390.4396.9408.3399.6398.2399.9401.3424.5
397.1
17.818.0
18.218.218.317.717.818.018.118 218 317 717.818.0
18.2
Bank of France
(Figures in millions of francs)
Assets
Gold Foreignexchange
960963
962961
1,0171,0662,1501,2101,2401,2361,2321,2621,3851,328
1,323
Domesticbills
3,0683,971
4,0033,9984,1704,2807,1378,0217,3017,5758,0608,373
11,0059,712
9,210
Loans o n -
Short-termGovern-ment se-curities
Othersecuri-
ties
Negotia-ble se-
curities
Other
Liabilities
Notecircula-
tion
Deposits
Govern-ment Other
Otherliabili-
ties
1934—Nov. 30..Dec. 2 8 -
1935—Jan. 25...Feb. 22—Mar. 29..Apr. 26...May 3 1 -June 28...July 26—A.ug. 3 0 -Sept. 27..Oct. 30.,.Nov. 29-Dec. 27—
1936—Jan. 31 P.
82.09782,124
82,01482,04082,63580,93371,77971,01771,27771,74271,95271,99066.19166,296
65,223
2010
937735692643192371
1,090573
3,2283,211
3,1493,0803,1193,0943,3713,2773,1713,1033,0983,1413.2673,253
3,350
5,8985,837
5,8375,8335,8335,8055,8055,8055,8055,8005,8005,8005.8005,800
5,707
8,8498,288
7,9707,9148,0747,9678,6917,9998,0778,2128.0237,9398,0327,879
(•)
81,87983, 412
81, 68681,91783,04482, 35282,77682,09981,12882,24082,39983,30682, 44781,150
81,503
4,8293,718
3,7513,6193,6683,7032,7712,9833,2413,2443,0512,8622,8262,862
2,797
15, 52215, 359
16,47316,32816, 21315,14512, 31510,96911,09010, 66610, 84810,6479,3618,716
8,088
1,8691,907
2,0241,9621,9431,9542,0082,0132,1052,0622,0fi02,0592,1362,113
Assets
Reichsbank
(Figures in millions of reichsmarks)
Reserves
Gold Foreignexchange
Treasurybills
Otherbills(and
checks)Security
loans
Securities
Eligibleas notecover
OtherOtherassets
Liabilities
Notecircula-
tionDeposits
Otherliabili
ties
1934—Nov. 30.Dec. 31—
1935-Jan.31.Feb. 28—Mar. 30.Apr. 30May 31June 29July 31—Aug. 31Sept. 30.Oct. 31—Nov. 30Dec. 3 1 . .
1936—Jan. 3 1 . .
3,8484,021
3,6203,6563,7993,8613,7323,8793,8334,0004,1444,0584,0964,498
3,884
119146
8118866878689525473667884
72
436445
441437427373338337337340346345346349
316819
319328330328324324324324324316315315
315
827
837697701739775781814781770868922853
3,8103,901
3,6603,6173,6643,7113,8103,8953,8784,0324,1434,1594,1864,285
4,098
961984
822928922952770819743743774728806
1,032
679
1,001
900866830837824838845860879911913923
891
9 Preliminaryi Issue department also holds securities and silver coin as cover for fiduciary issue, which is fixod by law at £260,000,000.»Figures not yet available.
NOTE.—For explanation of table see BULLETIN for February 1931, pp. 81-83, and July, 1935, p . 463.
Digitized for FRASER http://fraser.stlouisfed.org/ Federal Reserve Bank of St. Louis
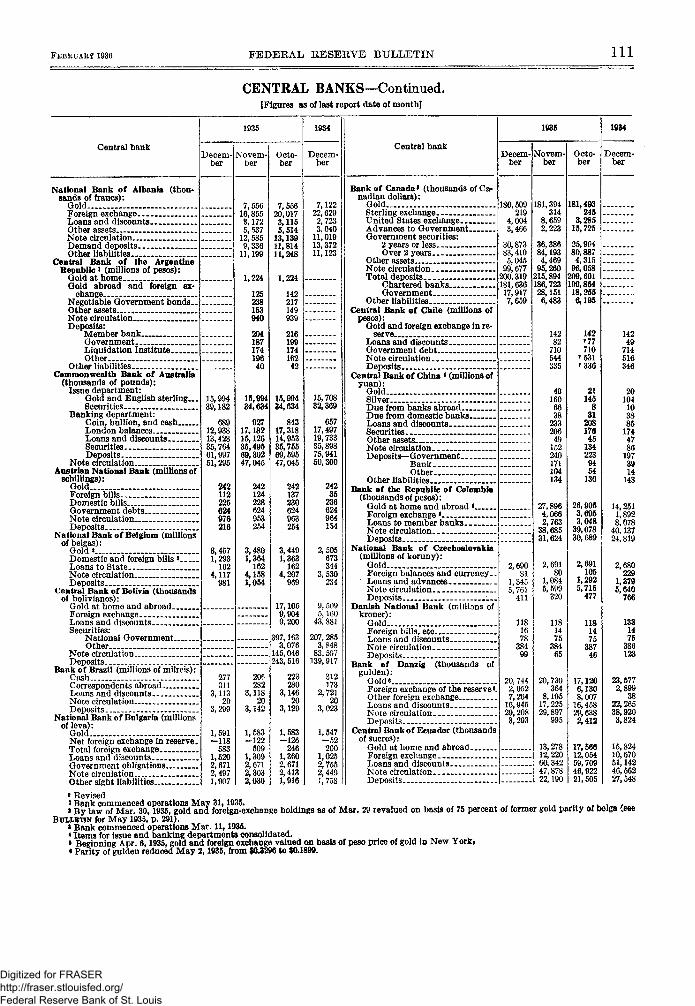
FEBRUARY 1936 FEDERAL RESERVE BULLETIN 111
CENTRAL BANKS—Continued,[Figures as of last report date of month]
Central bankDecem-
ber
1935
berOcto-ber
1934
Decem-ber
Central bank
1935
Decem-ber
Novem-ber
Octo-ber
1934
Decem-ber
National Bank of Albania (thou-sands of francs):
GoldForeign exchangeLoans and discountsOther assetsNote circulationDemand depositsOther liabilities
Central Bank of (he ArgentineRepublicl (millions of pesos):
Gold at homeGold abroad and foreign ex-
changeNegotiable Government bonds—Other assetsNote circulationDeposits:
Member bankGovernmentLiquidation InstituteOther
Other liabilitiesCommonwealth Bank of Australia
(thousands of pounds):Issue department:
Gold and English sterling...Securities
Banking department:Coin, bullion, and cashLondon balancesLoans and discountsSecuritiesDeposits
Note circulation.Austrian National Bank (millions of
schillings):GoldForeign billsDomestic bills..Government debtsNote circulationDeposits __
National Bank of Belgium (millionsof belgas):
Gold*Domestic and foreign bills J
Loans to StateNote circulationDeposits
Central Bank of Bolivia (thousandsof bolivianos):
Gold at home and abroadForeign exchangeLoans and discountsSecurities:
National GovernmentOther
Note circulationDeposits
Bank of Brazil (millions of milreis):CashCorrespondents abroad- ,Loans and discountsNote circulationDeposits
National Bank of Bulgaria (millionsof leva):
Gold -Net foreign exchange in reserve.Total foreign exchangeLoans and discountsGovernment obligationsNote circulation—Other sight liabilities
15,99439,182
12,93813,42835,76461,99751,295
242112225624976216
3,4571,293162
4,117981
277311
3,11320
3, 299
1,591-118583
1,5202,6712,4971,907
7,55616,8553,1725,53712, 5859,33611,199
1,224
125238153940
20418717419640
15,99434,634
92717,18215,12635,49569,30247,045
242124228624953254
7,55620,0173,1155,51413,13911,81411,248
1,224
142217149939
21619917416242
1,364162
4,1581,054
17,1059,9049,200
206282
3,11820
3,142
1,583-122509
1,3092,6712,3032,030
7,12222,6292,7233,04011,01913,37211,123
15,99434,634
84317,31814,95335,75569,59547,045
242137230624963254
3,4491,363162
4,207969
15,70832,369
65717,49719,73335,89875,94150,300
24235236624964154
2,505673344
3,530234
9,5095,160
43, 881
397,1633,076
145,046243, 516
223280
3,14620
3,129
1,583-126246
1,3602,6712,4131,916
207, 2853,84883,597139,917
312173
2,72120
3,023
1,547-52200
1,0252,7552,4491,758
Bank of Canada* (thousands of Ca-nadian dollars):
GoldSterling exchangeUnited States exchangeAdvances to GovernmentGovernment securities:
2 years or less —Over 2 years
Other assetsNote circulationTotal deposits
Chartered banksGovernment
Other liabilitiesCentral Bank of Chile (millions of
180,509219
4,0043,466
30,87383,4105,04599,677200,319181,63617,9177,659
Gold and foreign exchange in re-serve
Loans and discountsGovernment debtNote circulationDeposits
Central Bank of China < (millions ofyuan):
GoldSilverDue from banks abroadDue from domestic banksLoans and discountsSecuritiesOther assetsNote circulationDeposits—Government
BankOther
Other liabilitiesBank of the Republic of Colombia
(thousands of pesos):Gold at home and abroad «Foreign exchange'Loans to member banksNote circulationDeposits
National Bank of Czechoslovakia(millions of koruny):
GoldForeign balances and currency. .Loans and advances ._Note circulationDeposits
Danish National Bank (millions ofkroner):
GoldForeign bills, etcLoans and discountsNote circulationDeposits
Bank of Danzig (thousands ofgulden):
Gold«Foreign exchange of the reserved-Other foreign exchangeLoans and discountsNote circulationDeposits „
Central Bank of Ecuador (thousandsof sucres):
Gold at home and abroadForeign exchangeLoans and discountsNote circulationDeposits
2,69081
1,3455,761
411
1181678
384
20, 7442,0527,26416,94529,2083,293
181, 394314
8,6592,223
84,1934,46995,260215,894186,72328,1516,483
14282710544335
49160
23320649152240171104134
27,8964,0662,76338,68531,624
2,69180
1,0845,599320
118147538465
20,730364
8,10517, 22529,897
995
13,27812, 22060,34247,87822,190
181,493245
3,28515,725
25,90480,8874,31596,058209, 601190,85418,2556,195
142'77710
r 531'336
21145831208176451342239454130
26,905
3,04839,078
2,691105
1,2925,716477
118147538746
17,1206,1308,00716,45829,6382,412
17,56612,05459, 70946, 92221, 505
14249714516346
2010410388517447861973914143
14,2511,8928,07840,13724,819
2,680229
1,3795,640766
1331475386123
23,5772,899
3822,26538,9203,824
15,82410,67051,14246,56227,548
* Revisedi Bank commenced operations May 31,1935. , , , , , , . ,» By law of Mar. 30,1935, gold and foreign-exchange holdings as of Mar. 29 revalued on basis of 75 percent of former gold parity of bolga Ceee
BULLETIN for May 1935, p. 291).• Bank commenced operations Mar. 11,1935.«Items for issue and banking departments consolidated.« Beginning Apr. 6,1935, gold and foreign exchange valued on basis of peso price of gold in New York.«Parity of gulden reduced May 2,1935, from $0.3296 to $0.1899.
Digitized for FRASER http://fraser.stlouisfed.org/ Federal Reserve Bank of St. Louis
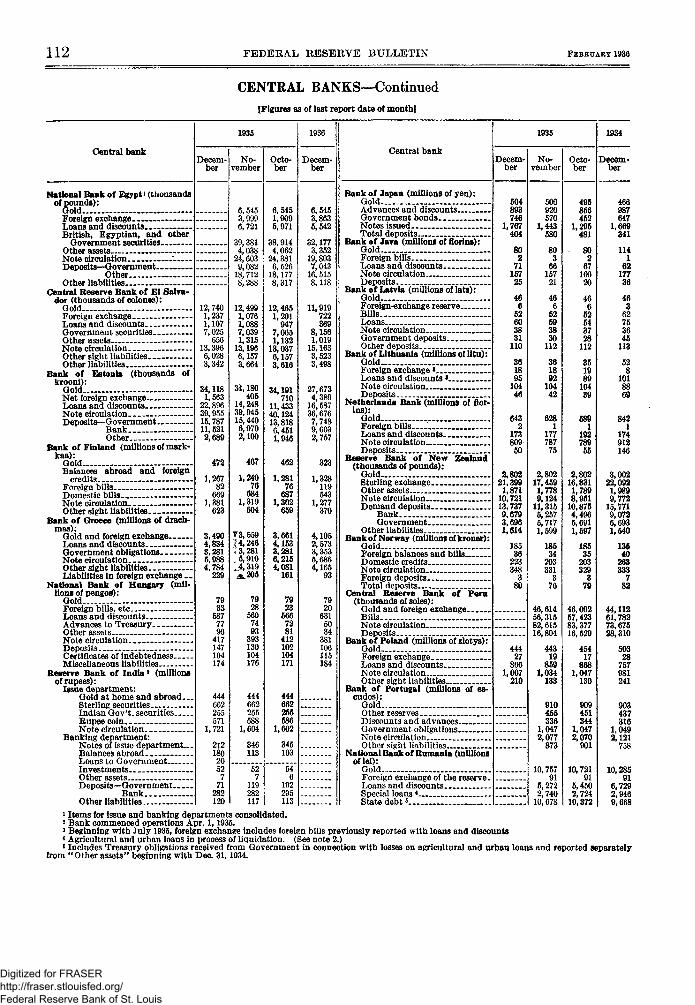
112 FEDERAL RESERVE BULLETIN FEBRUARY 1936
CENTRAL BANKS—Continued[Figures as of last report date of month)
Central bank
1935
Decem-ber
No-vember
Octo-ber
Decem-ber
Central bank
1935
Decem-ber
No-vember
Octo-ber
1934
Decem-ber
National Bank of Egypt * (thousandsof pounds):
Sold—-Foreign exchangeLoans and discountsBritish, Egyptian, and other
Government securitiesOther assetsNote circulation *Deposits—Government
OtherOther liabilities
Central Reserve Bank of El Salva-dor (thousands of colones):
GoldForeign exchange. -Loans and discountsGovernment securitiesOther assetsNote circulationOther sight liabilitiesOther liabilities
Bank of Estonia (thousands ofkrooni):
GoldNet foreign exchangeLoans and discountsNote circulationDeposits—Government
BankOther
Bank of Finland (millions of mark-kaa):
GoldBalances abroad and foreign
creditsForeign billsDomestic bil ls . .Note circulationOther sight liabilities
Bank of Greece (millions of drach-mas):
Gold and foreign exchangeLoans and discountsGovernment obligationsNote circulationOther sight liabilitiesLiabilities in foreign exchange . .
National Bank of Hungary (mil-lions of pengost):
GoldForeign bills, etcLoans and discountsAdvances to TreasuryOther assetsNote circulationDeposits.-,Certificates of indebtednessMiscellaneous liabilities
Reserve Bank of India > (millionsof rupees):
Issue department:Gold at home and abroad_._Sterling securitiesIndian Gov't. securitiesRupee coinNote circulation
Banking department:Notes of issue department—_Balances abroadLoans to GovernmentInvestmentsOther assetsDeposits—Government
BankOther liabilities
12,7401,2371,1077,025656
13,3966,0283,342
34,1181,56322,89639,95515,78711,5212,689
472
1,26782669
1,381623
3,4904,8343,281
4,784
79335877796417147104174
444662255571
1,721
2X21802052771282120
6,5453,9996,721
39,3814,03824,6039,08218,7128,288
12,4991,0761,0887,0391,31513,1966,1573,664
34,180405
14,24839,94515,4406,9792,100
467
1,24076684
1,319604
T3,55914,24613,281.5,91014,319
205
792856074
130104176
444662255588
1,604
346113
527
119282117
6,5451,9095,971
38,9144,06224, 3816,52618,1778,317
12,4651,201947
7,0651,13213,0376,1573,616
34,191710
11,43340,12413,8186,4511,946
1,28176687
1,302
3,6614,1533,2816,2154,081161
79235667281412102104171
444662255586
1,602
345103
546
102295113
6,545
5,542
32,1773,35219,8037,04316, 5158,118
11,919722369
8,1561,01915,1633,5233,498
27,6734,38916,58736,6767,7489,6032,757
323
1,328119543
1,277370
4,1052,5733,3535,6864,165
93
79206315034381106115184
Bank of Japan (millions of yen):Gold._Advances and discounts —Government bonds-Notes issuedTotal deposits
Bank of Java (millions of florins):GoldForeign billsLoans and discountsNote circulationDeposits
Bank of Latvia (millions of lats):Gold. _Foreign-exchange reserveBillsLoansNote circulationGovernment depositsOther deposits
Bank of Lithuania (millions of litu):GoldForeign exchange *Loans and discounts'Note circulationDeposits
Netherlands Bank (millions of flor-ins):
GoldForeign billsLoans and discountsNote circulationDeposits
Reserve Bank of New Zealand(thousands of pounds):
GoldSterling exchangeOther assetsNote circulationDemand deposits
BankGovernment
Other liabilitiesBank of Norway (millions of kroner):
Gold._Foreign balances and bills—Domestic creditsNote circulationForeign depositsTotal deposits—
Central Reserve Bank of Pern(thousands of soles):
Gold and foreign exchangeBillsNote circulation -Deposits
Bank of Poland (millions of zlotys):GoldForeign exchange. _Loans and discountsNote circulationOther sight liabilities
Bank of Portugal (millions of es-cudos):
GoldOther reservesDiscounts and advancesGovernment obligationsNote circulationOther sight liabilities
National Bank of Rumania (millionsof lei):
GoldForeign exchange of the reserve .Loans and discountsSpecial loans *State debt« _
504893746
1,767404
8027115725
46652
31110
189510446
6432
17380950
2,80221,3991,87110,72113,7379,6793,6961,614
18536223348380
44427866
1,007210
500920570
1,443580
36615721
46652593830112
189210442
6281
17778775
2,80217,4591,7789,12411,3156,2576,7171,599
18534203331376
46.61456,31582.61516,804
44319
8591,034133
910455336
1,0472,077873
10,75791
5,2722,74010,678
495856452
1,295481
8026716020
46662543728112
35198910439
119278955
2,80216,8311,7898,95110,8764,4965,6911,597
18535203329379
46,09257,42383,37716,529
45417
8681,047
909451344
1,0472,070
901
10,72191
5,4502,724
10,372
466987647
.,660341
1141
6217736
463
62753645
113
528
101
8421
174912146
3,00222,0921,9899,772
15,7719,0726,6931,640
13640
782
44,11261,78273,67528,310
50328
757981241
437316
1,0492,121
758
10,28591
6,7292,9469,668
1 Items for issue and banking departments consolidated.2 Bank commenced operations Apr. 1,1935.3 Beginning with July 1935, foreign exchange includes foreign bills previously reported with loans and discounts< Agricultural and urban loans in process of liquidation. (See note 2.)8 Includes Treasury obligations received from Government in connection with losses on agricultural and urban loans and reported separately
from "Other assets" beginning with Dec. 31,1934.
Digitized for FRASER http://fraser.stlouisfed.org/ Federal Reserve Bank of St. Louis
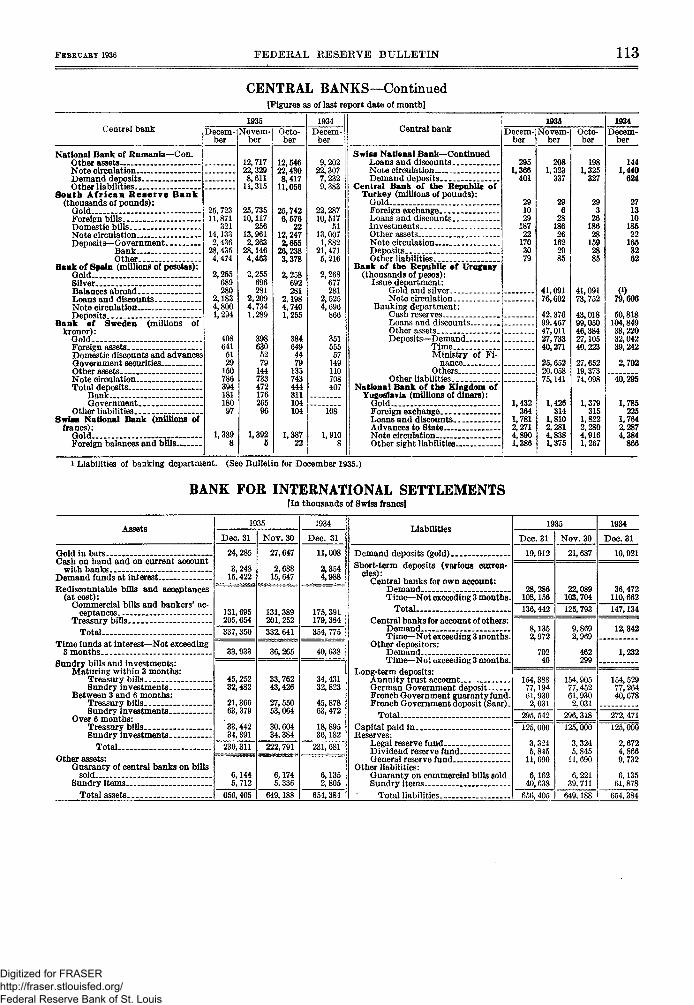
FEBRUARY 1936 FEDERAL RESERVE BULLETIN 113
CENTRAL BANKS—Continued[Figures as of last report date of month]
Central bank Decem- Novem- Octo-ber ber ber
1935 1934Decem-
berCentral bank
1035Decem- Novem- Octo-
ber ber ber
1934Decem-
ber
1441,440
624
271310
18522
1653262
0)79,606
50,818104,84938,22032,04239,242
2,702
National Bank of Rumania—Con.Other assetsNote circulationDemand depositsOther liabilities
South African Reserve Bank(thousands of pounds):
GoldForeign billsDomestic billsNote circulationDeposits—Government
BankOther _._
Bank of Spain (millions of pesetas):GoldSilverBalances abroadLoans and discountsNote circulationDeposits.
Bank of Sweden (millions ofkronor):
GoldForeign assetsDomestic discounts and advancesGovernment securitiesOther assetsNote circulation __Total deposits _
BankGovernment
Other liabilitiesSwiss National Bank (millions of
francs):GoldForeign balances and bills
25,72311,871
32114,1332,436
28,4354,474
2,255689280
2,1834,8001,294
408641
5129
15078639418118097
12,71722,3298,611
11,315
25, 73510,117
25613,9612,263
28,1464,463
2,255696281
2,2094,7341,289
6305279
14473347217626596
1,3925
12,54622,4308,41711,056
25,7426,676
2212,2472,65526,2383,378
2,258692281
2,1984,7401,255
3846494479135743444311104104
1,38722
9,20222,3077,2329,383
22,28710,517
5113,0071,882
21,4715,216
2,268677281
2,5254,696
35155557149110708407
108
1,910
Swiss National Bank—ContinuedLoans and discountsNote circulationDemand deposits
Central Bank of the Republic ofTurkey (millions of pounds):
Gold.Foreign exchangeLoans and discountsInvestmentsOther assetsNote circulationDepositsOther liabilities
Bank of the Republic of Uruguay(thousands of pesos):
Issue department:Gold and silverNote circulation
Banking department:Cash reservesLoans and discountsOther assetsDeposits—Demand
TimeMinistry of Fi-
nance.Others
Other liabilities.National Bank of the Kingdom of
Yugoslavia (millions of dinars):GoldForeign exchangeLoans and discountsAdvances to StateNote circulationOther sight liabilities
2951,366401
291029187221703079
1,432364
1,7812,2714,8901,386
2081,323337
29628186261622985
41,09176,602
42,37699.46747,01127,73340,271
25,65220,05875,141
1,426314
1,8102,2814,8381,375
1,325327
29326186281592885
41,09173,752
43,01899,05046,38427,10540,223
27,65219,37374, 098
1,379315
1,8222,2804,9161,267
40,295
1,785225
1,7642,2874,384
i Liabilities of banking department. (See Bulletin for December 1935.)
BANK FOR INTERNATIONAL SETTLEMENTS[In thousands of Swiss francs}
Assets
Gold in barsCash on hand and on current account
with banksDemand funds at interestRediscountable bills and acceptances
(at cost):Commercial bills and bankers' ac-
ceptancesTreasury bills
TotalTime funds at interest—Not exceeding
3 monthsSundry bills and investments:
Maturing within 3 months:Treasury billsSundry investments
Between 3 and 6 months:Treasury billsSundry investments
Over 6 months:Treasury billsSundry investments
TotalOther assets:
Guaranty of central banks on billssold
Sundry Items —Total assets
1935
Dec. 31
24,285
3,24815,422
131, 695205, 654337, 350
33,933
45,25232,482
21,36663, 379
33,44234, 391
230,311
6,1445,712
656, 405
Nov. 30
27,647
2,68815, 647
131,389201,252332, 641
36,265
33,76243,426
27,55053,064
30, 60434,384
222,791
6,1745,336
649,188
1934
Dec. 31
11,008
2,3544,988
175,391179,384354, 775
40,638
34, 43132,823
45,87863,472
18,89536,182
231, 681
6,1352,805
654,384
Liabilities
Demand deposits (gold)Short-term deposits (various curren-
cies):Central banks for own account:
DemandTime—Not exceeding 3 months-
TotalCentral banks for account of others:
DemandTime—Not exceeding 3 months.
Other depositors:Demand.Time—Not exceeding 3 months.
Long-term deposits:Annuity trust accountGerman Government deposit-French Government guaranty fund-French Government deposit (Saar).
TotalCapital paid InReserves:
Legal reserve fundDividend reserve fundGeneral reserve fund
Other liabilities:Guaranty on commercial bills sold.Sundry items _
Total liabilities... _
1935
Dec. 31
19,912
28, 286108,156136, 442
8,1352,972
70240
154, 38877,19461,9302,031
295, 542125, 000
3,3245,845
11, 690
6,16240,638
656, 405
Nov. 30
21, 687
22,089103,704125, 793
9,8692,969
462299
154,90577, 45261,9302,031
296,318 •125,000
3,3245,845
11,690
6,22139, 711
649,188
1934
Dec. 3110,921
36,472110,662147,134
12,342
1,232
154, 52977,26440,678
272, 471125,000
2,6724,8669,732
6,13561,878
654,384
Digitized for FRASER http://fraser.stlouisfed.org/ Federal Reserve Bank of St. Louis
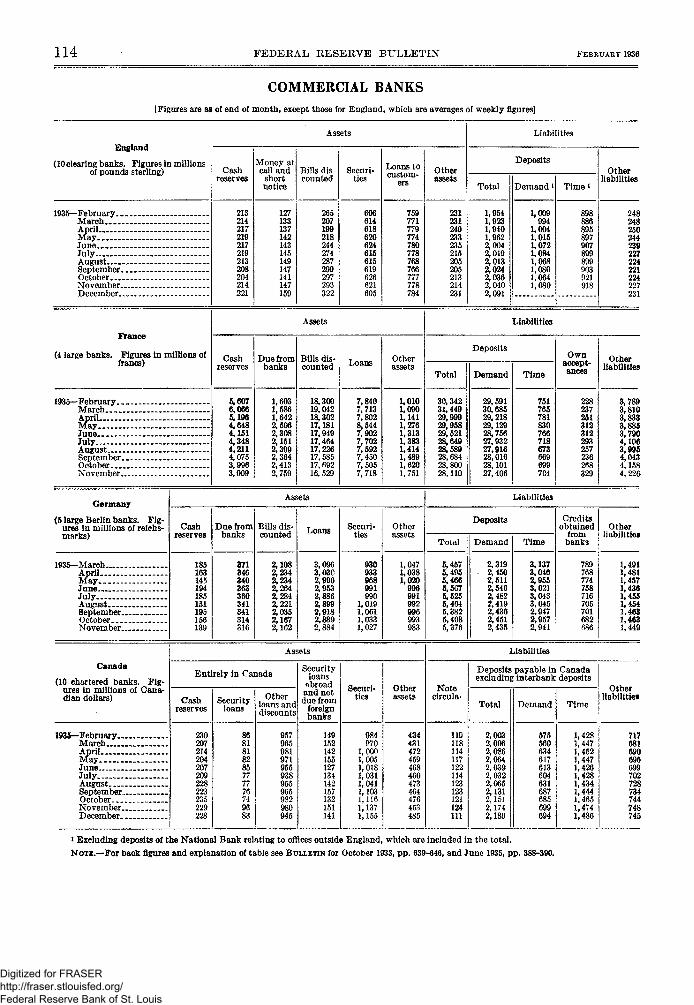
114 FEDERAL RESERVE BULLETIN FEBRUARY 1936
COMMERCIAL BANKS{Figures are as of end of month, except those for England, which are averages of weekly figures]
England
(10 clearing banks. Figures in millionsof pounds sterling)
Assets
Cashreserves
213214217219217219213208204214221
Money atcall and
shortnotice
127133137142143145149147141147159
Bills discounted
265207199218244274287299297293322
Securi-ties
606614618620624615615619626621605
Loans tocustom-
ersOtherassets
Liabilities
Deposits
Total Demand l Time »
Otherliabilities
1935—February-.MarchAprilMayJuneJulyAugustSeptemberOctober.._November.December.
759771779774780778768766777778784
231231240233235215205205213214231
1,9541,9231,9401,9622,0042,0192,0132,0242,0362,0402,091
1,009994
1,0041,0151,0721,0841,0681,0801,0641,080
898886895897907899899903921918
248248250244239227224221224227231
Assets LiabilitiesFrance
(4 large banks. Figures in millions offrancs) Cash
reserves
5,6076,0665,1964,6484,1514,3484,2114,0753,9963,909
Due frombanks
1,6031,5861,6422,5062,3082,1512,3992,3642,4132,759
Bills dis-counted
18,30019,04218,30217,18117,94917,46417.22617,58517, 69216, 529
7,8407,7137,8028,5447,9027,7027,5927,4507,5057,718
DepositsOtherassets
Total Demand Time
Ownaccept-ances
Otherliabilities
1935—February..MarchAprilMayJuneJulyAugustSeptemberOctober...November.
1,0101,0901,1411,2761,3131,3831,4141,4891,6201,751
30,34231,44929,99929,95829,52128,64928,589
28, 80028,110
29,59130,68529,21829,12928,75627,93227,91628,01628,10127,406
751765781830766718673
7G4
228237251312312293257236268329
3,7893,8103,8333,8853,7904,1063,9954,0434,1584,226
Germany
(5 large Berlin banks. Fig-ures in millions of reichs-mnrks)
Assets Liabilities
Cashreserves
185163145194185151195156139
Due frombanks
371346340363360341341314316
Bills dis-counted
2,1082,2342,2342,2642,2842,2212,0352,1672,162
3,0963,0302,9902,9532,8862,8992,9182,8892,884
Securi-ties
930933968991990
1,0191,0611,0331,027
Otherassets
Deposits
Total Demand Time
Creditsobtained Other
from ; liabilitiesbanks :
1935—MarchAprilMayJuneJulyAugustSeptember.October.,.November.
1,0471,0381,020996991992996993983
6,4575,4955,4665,5G75,5255,4645,3825,4085,376
2,3192,4502,5112,5462,4822,4192,4362,4512,435
3,1373,0462,9553,0213,0433,0452.9472,9572,941
768774758716705701682
1,4911,4811,4571,4361,455lf 4541.4631,4631,449
Assets Liabilities
Canada(10 chartered banks. Fig-
ures in millions of Cana-dian dollars)
Entirely in Canada
Cashreserves
Securityloans
Otherloam anddiscounts
Securityloans
abroadand netdue from
foreignbanks
Securi-ties
Otherassets
Notecircula-
119118114117122114123123121124111
Deposits payable In Canadaexcluding interbank deposits
Total
2,0032,0062,0862,0642,0392,0322,0652,1312,1512,1742,180
Demand
575560634617613604631687685699694
Time
1,4281,4471,4521,4471,4261,4281,4341,4441,4651,4741,486
Otherliabilities
1935—FebruaryMarchAprilMayJuneJuly.AugustSeptember-OctoberNovember...December...
230207214204207209228223235229228
957965981971955938955965982980945
149152142155127134142157132151141
984970
1,0001,0051,0181,0311,0411,1031,1161,1371,155
434431472459468460473464476453485
717681690
702728734744748745
* Excluding deposits of the National Bank relating to offices outside England, which are included in the total.NOTE.—For back figures and explanation of table see BULLETIN for October 1933, pp. 639-646, and June 1935, pp. 388-390.
Digitized for FRASER http://fraser.stlouisfed.org/ Federal Reserve Bank of St. Louis
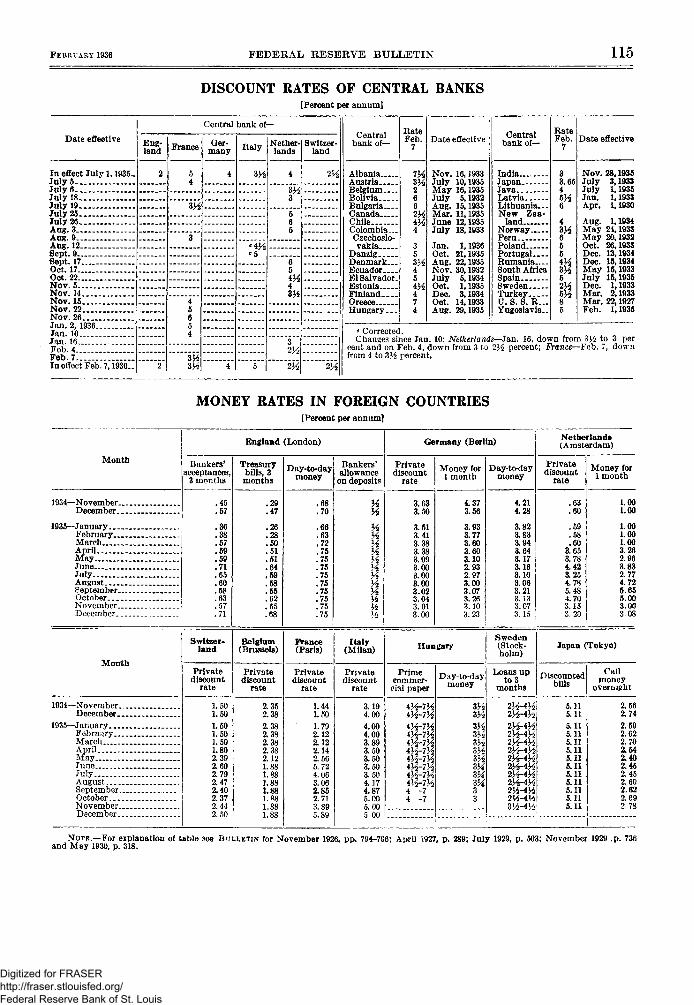
FEBRUARY 1936 FEDERAL RESERVE BULLETIN 115
DISCOUNT RATES OF CENTRAL BANKS[Percent per annum]
Date effective
Central bank of—
Eng-land France Ger-
manyTtfl1_ Nether- Switzer-i t a l y lands land
Centralbank of—
RateFeb.
7Date effective Central
bank of—RateFeb.
7Date effective
In effect July 1,1935-July5July 6July 18July 19July 25July 26Aug. 3Aug. 9.Aug. 12Sept. 9 _.Sept. 17Oct. 17Oct. 22Nov. 5.Nov. 14Nov. 15Nov. 22Nov. 26Jan. 2, 1936Jan. 10Jan. 16Feb. 4Feb. 7In effect Feb. 7,1936-
AlbaniaAustriaBelgiumBoliviaBulgariaCanadaChileColombia—Czechoslo-vakia
DanzigDenmark-EcuadorEl Salvador.EstoniaFinlandGreeceHungary...
Nov. 16,1933July 10,1935May 16,1935July 5,1932Aug. 15,1935Mar. 11,1935June 12,1935July 18,1933
Jan. 1,1936Oct. 21,1935Aug. 22,1935Nov. 30,1932July 5,1934Oct. 1,1935Dec. 3,1934Oct. 14,1933Aug. 29,1935
IndiaJapanJavaLatviaLithuania. ~New Zea-
landNorwayPeruPolandPortugalRumaniaSouth AfricaSpainSwedenTurkeyU. S. S. R—Yugoslavia—
3.654
Nov. 28,1935July 3,1933July 1,1935Jan. 1,1933Apr. 1,1930
Aug.MayMayOct.Dec.Dec.MayJulyDec.Mar.Mar.Feb.
1.193424,193320.193226.193313.193415.193415,193315.19351,19332,1933
22,19271.1935
e Corrected.Changes since Jan. 10: Netherlands—Jan. 16, down from 3 ^ to 3 per
cent and on Feb. 4, down from 3 to 2lA percent; France— Feb. 7, downfrom 4 to ZH percent.
Month
MONEY RATES IN FOREIGN COUNTRIES[Percent per annum]
1934—November.December.
1935—January...February..MarchAprilMayJuneJuly.AugustSeptember.October...November.December.
England (London)
Bankers'acceptances,
3 months
.45
.57
.36
.38
.57
.59
.59
.71
.65
.60
.58
.63
.57
.71
Treasurybills, 3months
Day-to-daymoney
Bankers'allowance
on deposits
Germany (Berlin)
Privatediscount
rate
3.633.50
3.513.413.383.383.093.003.003.003.023.043.013.00
Money for1 month
4.373.56
3.933.773.603.603.102.932.973.003.073.263.103.23
Day-to-daymoney
4.214.28
3.823.833.943.643.173.163.103.063.213.133.073.15
Netherlands(Amsterdam)
Privatediscount
rate
.63
.60
.59
.58
.603.653.784.423.254.785.484.703.153.20
Money for1 month
1.001.00
1.001.001.003.262.963.832.774.725.655.003.003.08
Month
Switzer.land
Belginm(Brussels)
France(Paris)
Italy(Milan)
Hungary'
Privatediscount
rate
Privatediscount
rate
Privatediscount
rate
Privatediscount
rate
Primecommer-cial paper
Day-to-daymoney
Sweden(Stock-holm)
Loans upto 3
months
Japan (Tokyo)
Discountedbills
Callmoney
overnight
1934—November.December .
1935—January...February..MarchAprilMayJuneJulyAugustSeptemberOctober-..November.December.
1.501.501.501.501.501.802.392.602.792.472.402.372.442.50
2.352.382.382.382.382.382.121.881.881.881.881.881.881.88
1.441.501.792.122.122.142.565.724.063.062.852.713.895.89
3.194.004.004.003.893.503.503.503.504.174.875.005.005.00
5.115.115.115.115.115.115.116.115.115.115.115.115.11
2.562.742.592.622.702.542.402.452.452.602.622.692.78
TNOTK.—For explanation of table ;
and May 1930, p. 318.BULLETIN for November 1926, pp. 794-7S6; April 1927, p. 289; July 1929, p. 503; November 1929 ,p. 736
Digitized for FRASER http://fraser.stlouisfed.org/ Federal Reserve Bank of St. Louis
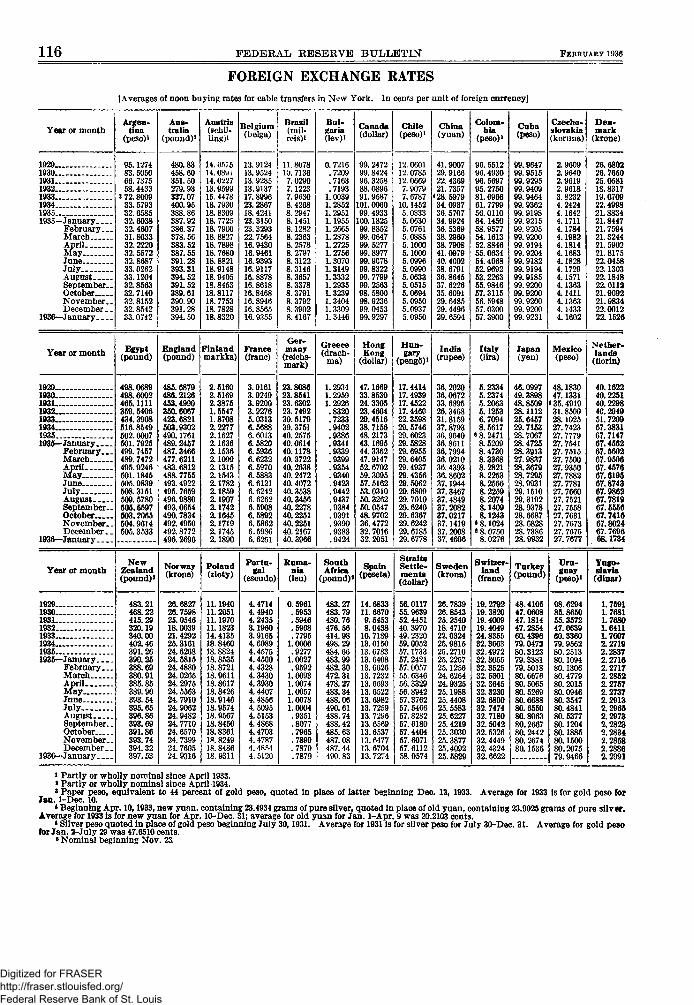
116 FEDERAL RESERVE BULLETIN FEBRUARY 1936
FOREIGN EXCHANGE RATES[Averages of noon buying rates for cable transfers in New York. In cents per unit of foreign currency]
Year or month
1929 .1930193119321933193419351935-January
February. . .MarchAprilMayJuneJulyAugust,.September-OctoberNovember. .December . .
1936—January
Year or month
1929193019311932.193319341935 - .1935—January
February. _ .MarchAprilMayJuneJulyAugustSeptember—OctoberNovember. _December _ _
1936—January
Year or month
19291930193119321933193419351935—January
February . . .MarchAprilMayJuneJulyAugustSeptember. .OctoberNovember. .December _ .
1936—January
Argen-tina
(peso)1
95.127483.505066. 737558. 4433
3 72.800933.579332. 658532. 603832.460731.803332.222032. 557232.868733.026233.120432.856332.714032.815232.854233.0742
Egypt(pound)
498.0689498.6002465.1111359.5406434.3908516. 8549502.6007501.7925499. 7457489.7472495.9246501.1845505.9839508.3151509.5780505.5597503.2065504.9614505.3533
NewZealand(pound)1
483.21468.22415.29320.19340.00402.46391. 26390.25388.69380.91385.85389.90393.54395.65396.86393. 69391.86393.74394.32397.53
Aus-tralia
(pound)s
480.83458.60351.50279.93337.07400.95388.86387.92386.37378. 56383.52387. 55391.28393.31394.52391.52389.61390.90391. 28394.50
England(pound)
485.6879486.2126453.4990350.6067423.6821503.9302490.1761489. 2457487.3466477.6211483.6812488. 7755493.4922495. 7659496.9880493.0654490.7834492.4950492. 8772496.2696
Norway(krone)
26.682726.759825.054618.003921.429225.316124.626824.581524. 488024.026524. 297524. 556324. 791024.906224.948224. 771024.657024. 739924. 760524. 9316
Austria(schil-ling)!
14. 057514.089114.022713.959915. 447818. 793018.830918.772518. 790018.882718. 789818. 768018.882118.914818.940518.845318.811718. 775318. 782818.8320
Finlandmarkka)
2.51602.51692.38751.55471.87082.22772.16272.16362.15362.10992.13152.15432.17822.18592.19072.17422.16452.17192.17452.1890
Poland(zloty)
11.194011.205111.197011.182314.413518.846018.882418.853518.872118.961118.861718.842618.914618.957418.956718.845018.836118.824918. 848618.9311
Belgium(belga)
13.912413.952413.928513.913717.899623.286718.424123.315023. 329322. 756416.943016.946116.939316.911716.887816.861816.846816.894616.856516. 9355
France(franc)
3.91613.92493.92003.92765.03136.56886.60136. 58206.59366.62326.59706.58836. 61216. 62426. 62626.59086.58926.58626.59866.6251
Portu-gal
(escudo)
4.47144.49404.24353.19603.91654. 60894.45754.45004.43284.34304.39304.44074.48564.50954.51534.48684.47034.47874. 48544.5120
Brazil(mil-reis)i
11.80781U. 71367.02907.12237.96308.42688. 29478.14518.12828. 23638. 25788. 27978.31228.31468.36578.33788.37918. 37928.39028.4167
Ger-many
(reichs-inark)
23.808823.854123.630223.749230.517939.375140.257540.061440.117840.372240. 263840. 247240. 407240. 353840.345640. 227840.225140.225140. 216740.3966
Ruma-nia
(leu)
0.5961.5953.5946.5968.7795
1.0006.9277
1.0027.9592
1.00931.00741.00571.00781.0004.9351.8077.7965.7899.7879.7879
Bul-garia(lev)i
0. 7216.7209.7163.7193
:
]]
L. 0039L. 2852L 2951L. 1955L. 2665L 2878L. 2725L. 2756L.3070L. 31491.33321.2935L. 3239L. 3404.3309
L. 3446
Greece(drach-
ma)
1.29341.29591. 2926.8320.7233.9402.9386.9341.9339.9399.9354.9340.9423.9442.9437.9384.9391.9390.9383.9424
SouthAfrica
(pound)1
483.27483.79480.76476. 56414.98498. 29484. 66483.99482.30472.31478.27483.34488.06490.61488. 74488. 42485.63487.08487. 44490.83
Canada(dollar)
99. 247299.842496. 325888. 089691.9587
101.006099. 4933
100.182599. 885299.064799. 527799.897799.907899.832299. 779999. 256398. 580098.923699.045399.9297
HongKong
(dollar)
47.166933.853024.330523.460429.451638.715648. 217343.169544. 336247.914752.670259.309557.516253.031050.326250.054748.970236.477232. 701632.2051
Spain(peseta)
14.683311.66709.54538.0438
10.718913.615013. 678313. 640813. 662613.723213. 669313. 652213. 698213. 725913. 729613. 656913.653713.647713.670413.7274
Chile(peso)1
12.060112.078512. 06697.90797. 6787
10.14525.08335. 06305.07615. 08855.10005.10005.09965.09905.06335.05155.06945.09505.09375.0950
H u n -gary
(pengo)i
17.441417.493917.452217.446022.359829. 574629. 602329. 582829.695529. 640529. 493729.435629.506229. 680929. 701029. 624029.636729. 624229. 618529.6778
StraitsSettle-ments(dollar)
56.011755.963952.445140. 397049. 232059.005257.173357. 242157.005755. 634656.332956. 894257.376257. 546657.828257. 618057.440457.607157. 611258.0574
China(yuan)
41.900729.916622. 436921. 7357
•28.597934.093736. 570734.992436. 536938. 296038. 790841. 097940. 400238. 679136.864537. 622635. 609129. 648529.449629.6594
India(rupee)
36.202036.067233.689526.346831.815937.879336. 964036.861136.799436.021036. 439336.860237.194437.346737. 484937.208237.021737.141937.200837. 4606
Sweden(krona)
26.783926.854325.254018.471022.032425.981525.271025. 226725.125624. 626424.932525.198825. 440825. 558325. 622725. 421925.303025. 387725.409225.5829
Colom-bia
(peso)i
96. 551296. 493096. 569795. 275081. 696661. 779956.011064.145058.957754.161352.884655.063454. 406852.969253.226355.984657.311556. 594857.030057.3900
Italy(lira)
5.23345.23745.20635.12536.70948.5617
8 8.24718. 52098.47308.33688.28218.22538.25668.22598.20748.14098.1243
• 8.10248 8.0750
8.0276
Switzer-land
(franc)
19.279219.382019.400919.404924.835532.366332.497232.305532.352532.530132.364532.323032.680032. 747432.718032.504232.532632. 444932. 432432.6622
Cuba(peso)
99.964799.951599.929599.940999.946499.936299.919899.921599. 920599.920099.919499.920499.918299.919499.918599.920099.920099.920099.920099.9231
Japan(yen)
46.099749.389848.850928.111225.645729.715328.706728.472528.391327.983728.367928.729528.993129.151029.319228.937828.668728. 682828. 738628.9932
Turkey(pound)
48.410547.060847.181447.285460.439679.047280.312379.338179.501880.667680.506580.526980.668880.655080.806380.266780. 244280. 267480.1536
Czecho-slovakia(koruna)
2.96092.96402.96192.96183.82324. 24244.16424.17114.17844.19824.18144.16834.18284.17294.15714.13634.14114.13634.14334.1602
Mexico(peso)
48.183047.1331
«35.491931.850028.102527.742327. 777927.754127. 751527. 750027.935027.788227. 778127. 766027. 752127. 755827.763127. 767327. 767527.7677
Uru-guay
(peso)*
98.629485.865055.357247.063960.336079.956280.251380.109480.130680. 477980.201580.094680.354780. 484180.537780.120480.188580.150080.207579.9466
Den-mark
(krone)
26.680226. 765025.058118.831719.070922.499821.883421.844721.759421.324421. 590221.817522.045822.130322.184822.011321.909221.983422.001222.1526
Nether-lands
(florin)
40.162240.225140.229840.294951.720967.383167.714767.456267.560267.950667.457667.619567.874367.986267.781967.555667.741667.802467.769668.1734
Yugo-slavia(dinar)
1.75911.76811.76801.64111.76072.27192.28372.27162.27172.28522.27572.27372.29132.29652.29732.28232.28342.28582.28862.2991
» Partly or wholly nominal since April 1933.» Partly or wholly nominal since April 1934.* Paper peso, equivalent to 44 percent of gold peso, quoted in place of latter beginning Dec. 13, 1933. Average for 1933 is for gold peso for
Jan. 1-Dec. 10.* Beginning Apr. 10,1933, new yuan, containing 23.4934 grams of pure silver, quoted in place of old yuan, containing 23.9025 grams of pure silver.
Average for 1933 is for new yuan for Apr. 10-Dec. 31; average for old yuan for Jan. 1-Apr. 9 was 20.2103 cents.« Silver peso quoted in place of gold peso beginning July 30,1931. Averape for 1931 is for silver peso for July 30-Dec. 31. Average for gold peso
for Jan. 2-July 29 was 47.6510 cents.*Nominal beginning Nov. 23.
Digitized for FRASER http://fraser.stlouisfed.org/ Federal Reserve Bank of St. Louis
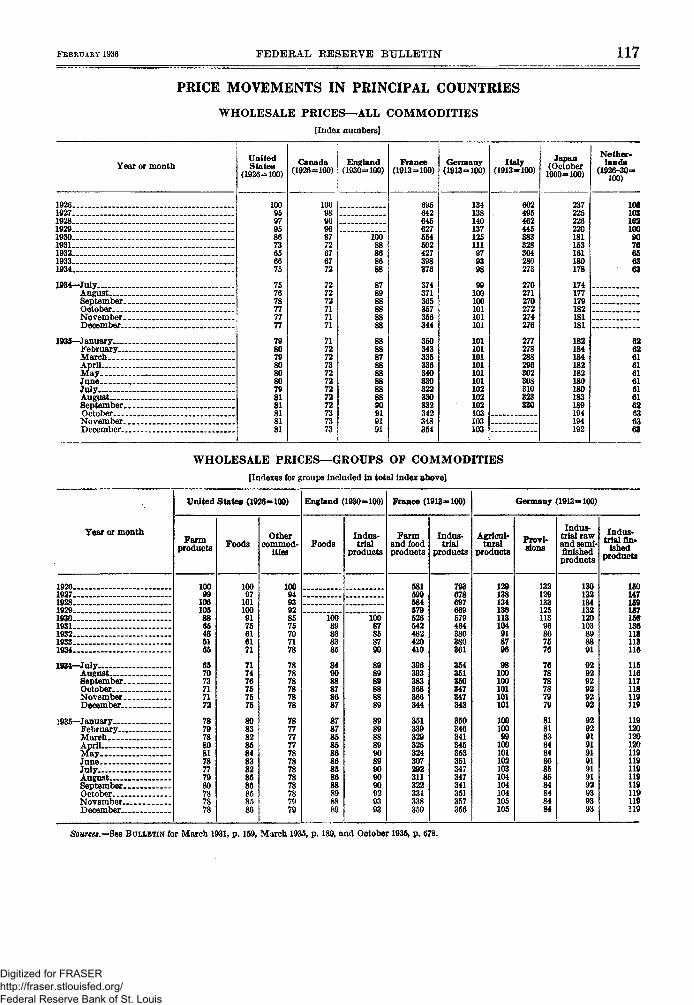
FEBRUARY 1936 FEDERAL RESERVE BULLETIN 117
PRICE MOVEMENTS IN PRINCIPAL COUNTRIES
WHOLESALE PRICES—ALL COMMODITIES[Index numbers]
Year or month
192619271928192919301931193219331934
1934—JulyAugust . —SeptemberOctoberNovember
1935—January.February .MarchAprilMayJune. . . . . . . . .JulyAugust . .September.. . . . .OctoberNovember _ ._December _
UnitedStates
(1926=100)
1009597958673656675
757678
V,77
798079808080798181818181
Canada(1926=100)
1009896968772676772
727272717171
717272737272727272737373
England(1930=100)
10088868688
878988888888
888887888888888890919191
France(1913=100)
695642645627564502427398376
374371365357356344
350343335336340330322330332342348354
Germany(1913=100)
134138140137125111979398
99100100101101101
101101o
oo
c
102102102103103103
Italy(1913=100)
602495462445383328304280273
270271270272274276
277278288296302308310323330
Japan(October
1900=100)
237225226220181153161180178
174177179182181181
182184184182182180180183189194194192
Nether-lands
(1926-30=100)
1061031021009076656363
626261616161616162636363
WHOLESALE PRICES—GROUPS OF COMMODITIES[Indexes for groups included in total index above]
Year or month
19261927Ifl2819291930 „1931193219331934
1934—July ....AugustSeptemberOctober . .NovemberDecember
1935—JanuaryFebruaryMarchAprilMayJuneJuly . .August -September. . . . .OctoberNovember . __December
United States (1926=100)
Farmproducts
10099
1061058865485165
657073717172
787978808178777980787878
Foods
10097
1011009175616171
717476757575
808382858483828586858586
Othercommod-
ities
1009493928575707178787878787878
787777777878787878787979
England (1930=100)
Foods
10089838385849088878687
878785858686858688898889
Indus-trial
products
10087858790
898989888889
898988899089909090929393
France (1913=100)
Farmend foodproducts
581599584579526542482420410
396393383368366344
351339329325324307292311322331338350
Indus*trial
products
793678697669579464380380361
354351350347347343
350346341345353351347347341351357356
Germany (1913=100)
Agricul-tural
products
129138134136113104918796
98100100101101101
10010099
100101102103104104104105105
Provi-sions
13212913312511396867576767878787979
818183848486858584848484
Indus-trial rawand semi-finishedproducts
130132134132120103898891
929292929292
929291919191919192939393
Indus-trial fin-
ishedproducts
ISO147159157150136118113116
115116117118119119
119120120120119119119119119119119119
Sources.—See BULLETIN for March 1931, p. 159, March 1935, p. 180, and October 1935, p. 678.
Digitized for FRASER http://fraser.stlouisfed.org/ Federal Reserve Bank of St. Louis
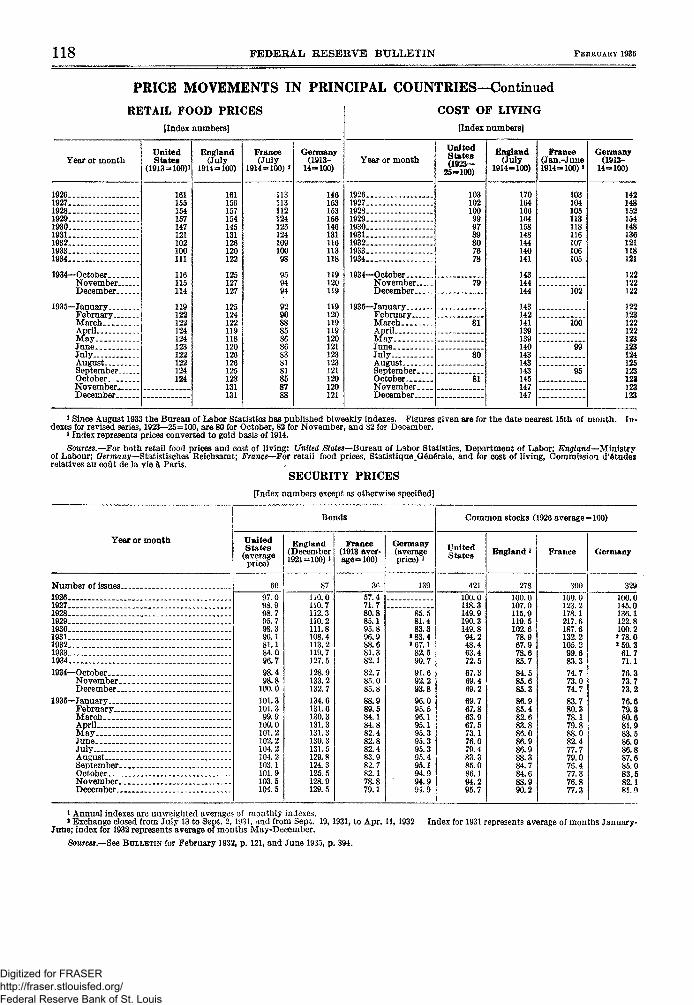
118 FEDEKAL RESERVE BULLETIN FEBRUARY 1936
PRICE MOVEMENTS IN PRINCIPAL COUNTRIES—Continued
RETAIL FOOD PRICES[Index numbers]
Year or month
19261927. .192819291930..1931193219331934
1934—OctoberNovemberDecember
1935—JanuaryFebruaryMarchAprilM a y . . _.JuneJulyAugust.SeptemberOctoberTsJovflTnbQi*.,December
UnitedStates
(1913=100)*
161155154157147121102100111
116115114
119122122124124123122122124124
England(July
1914=100)
161156157154145131126120122
125127127
125124122119118120126126125128131131
France(July
1914 -100) »
11311311212412512410910098
959494
929088858686838181858788
Germany(1913-
14=100)
146153153156146131116113118
119120119
119120119119120121123123121120120121
COST OF LIVING[Index numbers]
Year or month
192619271928192919301931.. -193219331934
1934—OctoberNovemberDecember.. -.
1935—JanuaryFebruaryM a r c h . . . . -AprilMayJuneJulyAugust..SeptemberOctoberNovemberDecember
UnitedStates(1923—
25=100)
103102100999789807678
79
81
80
81
England(July
1914-= 100)
170164166164158148144140141
143144144
143142141139139140143143143145147147
France(Jan.-June1914=100)"
103104105113118116107106105
102
100
99
95
Germany(1913-
14=100)
142148152154148136121118121
122122122
122123122122123123124125123123123123
1 Since August 1933 the Bureau of Labor Statistics has published biweekly indexes. Figures given are for the date nearest 15th of month. In-dexes for revised series, 1923—25=100, are 80 for October, 82 for November, and 82 for December.
3 Index represents prices converted to gold basis of 1914.
Sources.-—For both retail food prices and cost of living: United States—Bureau, of Labor Statistics, Department of Labor; England—Ministryof Labour; Germany—Statistisches Reichsamt; France—For retail food prices, Statistique^Q6n6rale, and for cost of living, Commission d'fitudesrelatives au cout de la vie a Paris.
SECURITY PRICES[Index numbers except as otherwise specified]
Year or month
Number of issues19261927192819291930.-.19311932..1933 _..19341934—October
NovemberDecember
1935—JanuaryFebruaryMarchAprilMayJuneJuly . .August ._ .-SeptemberOctoberNovemberDecember
Bonds
UnitedStates
(averageprice)
60
97.098.998.795.798.396.181.184.096.798.498.8
100.0101.3101.399.9
100.0101.2102.2104.2104.2103.1101.9103.5104.5
England(December1921=100) »
87
110.0110.7112.3110.2111.8108.4113.2119.7127.5128.9133.2132.7134.6131.6130.3131.3131.3130. 3131.5129.8124.3125.5128.9129.5
France(1913 aver-age =100)
36
57.471.780.885.195.896.988.681.382.182.785.085.888.989.584.184.882.482.882.483.982.782.178.879.1
Germany(averageprice) i
139
85.581.483.3
»83.4«67.1
82.590.791.692.293.896.095.596.195.195.395.395.395.495.194.994.994.9
Common stocks (1926 average=
UnitedStates
421
100.0118.3149.9190.3149.894.248.463.472.567.369.469.269.767.863.967.573.176.079.483.385.086.194.295.7
England 1
278
100.0107.0115.9119.5102.678.967.978.685.784.585.685.386.985.482.683.886.086.986 988.384.784.688.990.2
France
300
100. 0123.2178.1217.6187.6132 2105.299 683.374.773.074.783.780.378.179.888.082.477 779.076.477 376.877.3
= 100)
Germany
329
100.0145,0136.1122.8100.2> 78 0»50.3
61 771.176.373.773.276.679.380.681.983.586.086 887.685.083 582 181.9
i Annual indexes are unweighted averages of monthly indexes.* Exchange closed from July 13 to Sept. 2, 1931, and from Sept. 19,1931, to Apr. 11, 1932
June; index for 1932 represents average of months May-December.
Sources.—See BULLETIN for February 1932, p. 121, and June 1935, p. 394.
Index for 1931 represents average of months January-
Digitized for FRASER http://fraser.stlouisfed.org/ Federal Reserve Bank of St. Louis
FEBEUAKY 1936 FEDERAL RESERVE BULLETIN 119
LAW DEPARTMENTClassification of various types of deposits as savings
deposits.The Board has recently ruled upon a number
of questions relating to the classification ofdeposits as savings deposits within the defini-tion contained in section 1 (e) of Kegulation Q.
The first question was whether accounts inthe following names may be classified as savingsdeposits: "Richard Roe by John Doe"; "JohnDoe and Richard Roe"; "John Doe, Trustee";"John Doe, Attorney"; "John Doe, Executor orAdministrator of Richard Roe's Estate"; "JohnDoe, Trustee, Equity Cause No. —"; "JohnDoe, Committee for (Insane)"; " ,Trustee"; " , Executor"; " , Re-ceiver"; " , Guardian"; " , Ad-ministrator"; and " , Agent."
In answer to this question the Board statedthat, assuming that such deposits comply withall of the other requirements of the definitionof savings deposits contained in section 1 (e) ofRegulation Q, such deposits would be savingsdeposits if the beneficial interest therein w ereheld by one or more individuals or by a cor-poration, association or other organizationoperated primarily for religious, philanthropic,charitable, educational, fraternal, or othersimilar purposes and not operated for profit,and that it is the duty of a member bank toascertain the facts with regard to the benefici-aries of such accounts and to classify as savingsdeposits only the accounts in which the benefi-cial interest is held by one or more individuals orby an organization of the type described above.
The second question was whether deposits ofthe following organizations may be classifiedas savings deposits: Mutual fire and life in-surance companies, Federal credit unions, andnational trade associations, such as the UnitedStates Chamber of Commerce and NationalLime Association. The Board expressed theopinion that deposits of these organizationsmay not be considered as savings deposits be-cause such organizations are not operatedprimarily for religious, philanthropic, charita-ble, educational, fraternal, or other similarpurposes.
In answer to the question whether depositsof social clubs may be classified as savings de-posits, the Board stated, that the term "socialclubs" is so general that it is impossible to makea ruling applicable to all such clubs. However,the Board stated that small social clubs, such
as college fraternities and sororities, may beconsidered as organizations operated primarilyfor fraternal purposes and not operated forprofit and, accordingly, deposits of such organi-zations may be classified as savings deposits ifthey meet the other requirements of thedefinition. 4
The Board also stated that an account in thename of a parent as trustee or agent for a childmay be classified as a savings deposit if it meetsthe other requirements contained in section1 (e) of Regulation Q.
Another question presented was whetherdeposits of "publications of nonprofit organiza-tions" may be classified as savings deposits.The Board stated that, if such nonprofit or-ganizations are operated primarily for religious,philanthropic, charitable, educational, frater-nal, or other similar purposes, and if the publi-cations of such organizations are issued only asan incident to the fulfillment of their purposesand not for profit, deposits of such publicationsmay be classified as savings deposits, if suchdeposits meet the other requirements of thedefinition.
The Board expressed the opinion that for-eign government accounts and the accountsof their embassies or legations, and quasi-goyernment accounts, such as deposits ofPhilippine funds and Shipping Board funds,may not be classified as savings deposits be-cause such organizations are not operatedprimarily for the purposes stated in section1 (e) of Regulation Q. The Board said that itwas unable to express an opinion at the timewith regard to a deposit of the Pan-AmericanUnion since it did not have before it necessaryinformation relating to such organization.
A question was also presented as to thepenalties, if any, under Regulation Q. TheBoard stated that no specific penalties areprovided for violations of such regulation, butattention was invited to the provisions of lawrelating to forfeiture of the charters of na-tional banks and forfeiture of membership inthe Federal Reserve System of State memberbanks and, in addition to such provisions, tosection 30 of the Banking Act of 1933 whichprovides that the Board may remove directorsand officers of member banks for continuedviolations of law or for continued unsafe orunsound practices in conducting the businessof such banks.
Digitized for FRASER http://fraser.stlouisfed.org/ Federal Reserve Bank of St. Louis
120 FEDERAL RESERVE BULLETIN FEBRUABY 1936
Deposits of credit unions and citrus growers associa-tions not classified as savings deposits.The Board has recently been requested to
rule upon the question whether deposits ofcredit unions or of citrus growers associationsmay be classified as savings deposits withinthe definition contained in section 1 (e) ofRegulation Q.
The letter of inquiry stated that credit unionsare formed, usually within an industry or busi-ness, primarily for the purpose of affordingtheir members a place where they can borrowmoney in small amounts at a reasonable rateof interest and that citrus growers associationsusually own a packing house and pick andpack the fruit from the crops of their membersfor a charge fixed at the beginning of the season.
The Board stated that, without regard tothe question whether credit unions or citrusgrowers associations are operated for profit,it w as of the opinion that such organizationsare not operated primarily for religious, phil-anthropic, charitable, educational, fraternal,or other similar purposes, and, therefore,deposits maintained by them may not be clas-sified as savings deposits within the definitioncontained in section 1 (e) of Regulation Q.
Classification as savings deposit of funds of an indi-vidual used in his business.In response to an inquiry, the Board recently
ruled that a deposit in a member bank consist-ing of funds of an individual used in his business,as for example, the funds bf John Smith doingbusiness as Smith & Co., may be classified as asavings deposit within the definition containedin section 1 (e) of Regulation Q.
The Board stated that, prior to the issuanceof the regulation, careful thought was given tothis question and it was decided that it wouldbe impracticable to attempt to distinguishbetween funds of an individual which are usedin his business and other funds of the individual.I t was thought, however, that a distinctioncould properly be made between funds of anindividual and funds of a partnership in whichhe is a partner. Accordingly, footnote 4 ofRegulation Q provides that a deposit of a part-nership operated for profit may not be classifiedas a savings depos t.
Christmas Club accounts not within classification ofsavings deposits.
The Board has recently had occasion to ruleupon the question whether a Christmas Clubaccount could be classified as a savings de-posit within the meaning of section 1 (e) ofRegulation Q.
The first paragraph of section l(e) statesthat "the term 'savings deposit' means a de-posit, evidenced by a passbook, * * *."The last paragraph of such section reads asfollows:
Every withdrawal made upon presentation of a pass-book shall be entered in the passbook at the time of thewithdrawal, and every other withdraw^al, shall beentered in the passbook as soon as practicable afterthe withdrawal is made.
In view of the above provisions, the Boardexpressed the opinion that the term "passbook"as used in such definition means an accountbook in which deposits and withdrawals areentered.
In the case presented, it appeared that theChristmas Club book used in connection withthe account was a book containing couponswhich are stamped "Paid" at the time thedeposits are made and are torn out by the bankand retained for its records as evidence of eachof the 50 weekly deposits or "payments" madeby the depositor. The book also contained astub for each coupon which is stamped to showthat a deposit has been made, such stub beingretained by the depositor. It appeared, how-ever, that such book contained no provisionfor entries of withdrawals and, accordingly, theBoard expressed the view that it was not a"passbook" within the meaning of such termas used in section 1 (e) of Regulation Q.
The Board stated that, since the ChristmasClub book did not constitute a "passbook"within the meaning of such section, the depositwas not a savings deposit even though it mighthave some of the other characteristics of a sav-ings deposit. The Board also stated that, asindicated in footnote 2 of Regulation Q, such aChristmas Club account might constitute a timedeposit, open account, if it met the other re-quirements of the definition contained in sec-tion 1 (d) of such regulation.
Digitized for FRASER http://fraser.stlouisfed.org/ Federal Reserve Bank of St. Louis
FEBRUAKY 1936 FEDERAL RESERVE BULLETIN 121
Appointment as executive officer of member bank ofperson indebted to such bank.
The Board has recently had occasion to ruleupon the question whether it would be a viola-tion of section 22 (g) of the Federal ReserveAct for a person to be appointed as an executiveofficer of a national bank while he is indebtedto such bank upon a note executed by him ata time when he was not an executive officerthereof. The Board observed that the appli-cable provision of section 22(g) provides that:—
No executive officer of any member bank shall borrowfrom or otherwise become indebted to any member bankof which he is an executive officer, and no member bankshall make any loan or extend credit in any other man-ner to any of its own executive officers * * *.
and stated that such provision refers to an ex-ecutive officer of a member bank who is an ex-ecutive officer thereof at the time he borrowsfrom or otherwise becomes indebted to themember bank.
The Board expressed the opinion that whena loan is made in good faith by a member bankto an individual who is not at that time an ex-ecutive officer thereof and the loan is not madein contemplation of his becoming an executiveofficer of the bank, there is nothing in the stat-ute which would prohibit such person from be-coming an executive officer of the bank. Itwas observed, however, that there may be cir-cumstances in a particular case which would in-volve an attempted evasion of the provision oflaw, in which case the above ruling would notbe applicable. Since it did not appear fromthe facts presented that the loan in questionwas made with a view to evading the provisionof law in question, the Board held that the elec-tion of such person as an executive officer ofthe national bank would not constitute a viola-tion of the provisions of section 22 (g) of theFederal Reserve Act.
Granting of overdrafts or carrying of cash items forexecutive officers of member banks.
The Board was recently requested to con-strue the applicable provisions of section 22 (g)of the Federal Reserve Act and Regulation Owith regard to a situation where a memberbank holds a cash item in the form of a checkwhich, if put through the books of the bank,would cause an overdraft in the account of anexecutive officer thereof in an amount not inexcess of 30 days' advance pay, or not in excessof the salary which has accrued to the execu-tive officer. The question was also asked as towhether it would be a violation of section 22 (g)
or the Board's Regulation O if an actual over-draft had been created in the executive officer'saccount, or if the executive officer in questionhad substituted his personal note for theamount of the overdraft. It did not appearthat the granting of the overdraft to or thecarrying of the cash item for the executiveofficer had been previously approved by amajority of the entire board of directors of thebank, thereby bringing the transaction withinthe $2,500 exemption as provided in section3 (a) (1) of the Board's Regulation O, or that theexecutive officer had been advanced any sal-ary, accrued or unaccrued, as such.
In section 1 (c)(l) of the Board's RegulationO, the terms "loan", "loaning", "extension ofcredit", and "extend credit" are defined to in-clude "any advance by means of an overdraft,cash item, or otherwise;" and, under the secondclause of the unnumbered paragraph of section1 (c) it is provided that such terms do not in-clude—the acquisition by a bank of any check deposited in ordelivered to the bank in the usual course of businessunless it results in the granting of an overdraft to or thecarrying of a cash item for an executive officer.
On the other hand, it is provided in such sub-section that advances of unearned salary orother unearned compensation for periods not inexcess of 30 days and advances against accruedsalary or other accrued compensation are notincluded within the definition of such terms.
On the basis of the above facts, the Boardexpressed the opinion that if the bank carries acash item in the form of a check which, if putthrough the books of the bank, would cause anoverdraft in the account of the executiveofficer, the carrying of such cash item or thegranting of such overdraft, as the case may be,would be a loan or extension of credit as definedin the Board's Regulation O. Likewise thesubstitution of the personal note of the execu-tive officer for the amount of the cash item oroverdraft would be a loan or extension of creditas defined in such regulation. The fact thatthe executive officer is entitled to compensationwhich has been earned or accrued or mayobtain an advance of unearned salary for aperiod not in excess of 30 days, the amount ofwhich would be equal to or in excess of the cashitem, overdraft, or personal note, would not besufficient to remove the transaction from theclassification of a loan or extension of credit.In other words, the existence of an offset,under the circumstances described above,would not render legitimate a loan or extensionof credit which is prohibited.
Digitized for FRASER http://fraser.stlouisfed.org/ Federal Reserve Bank of St. Louis
122 FEDERAL RESERVE BULLETIN FEBRUARY 1936
Amendment No. 7 of Regulation T—Effective February1, 1936.
Subsections (a), (b), and (c) of section 3 ofKegulation T are hereby amended to read asfollows:
(a) General rule.—No creditor shall make any initialextension of credit to any customer on any registeredsecurity (other than an exempted security) for thepurpose of purchasing or carrying any security, in anamount which causes the total credit extended on suchregistered security to exceed the maximum loan value ofsuch registered security. Except as specifically pro-vided elsewhere in this regulation, the maximum loanvalue of a registered security (other than an exemptedsecurity) shall be the maximum loan value which theBoard of Governors of the Federal Reserve Systemshall prescribe as of general application under thisregulation from time to time in supplements to thisregulation, which will be issued in advance of the dateupon which such maximum loan value becomeseffective.
(b) Extension of credit to other members, brokers,and dealers.—In a special account recorded separately,any creditor may extend credit on any registeredsecurity to any other member, broker or dealer in anamount not greater than the maximum loan value ofsuch security, which (except in the case of an exemptedsecurity) shall be such special maximum loan value asthe Board of Governors of the Federal Reserve Systemshall prescribe for the purposes of this subsection (b)from time to time in supplements to this regulation,which will be issued in advance of the date on whichsuch maximum loan value becomes effective: Provided,That (1) such other member, broker, or dealer issubject to the provisions of this regulation or has placesof business only in foreign countries, (2) such creditis extended or maintained solely for the purpose ofenabling such member, broker, or dealer to carryaccounts for his customers other than his partners, and(3) any credit extended or maintained by such creditorto or for such other member, broker, or dealer for thepurpose of purchasing or carrying securities for hisown account or for the account of his firm or any of hispartners shall not be included in such special accountand shall be subject to the other provisions of thissection.
(c) Extension of credit to distributors, syndicates,etc.—In a special account recorded separately, anycreditor may extend credit on any registered securityto the persons and for the purposes specified below inan amount not greater than the maximum loan valueof such security, which (except in the case of an ex-empted security) shall be such special maximum loanvalue as the Board of Governors of the Federal ReserveSystem shall prescribe for the purposes of this sub-section (c) from time to time in supplements to thisregulation, which will be issued in advance of the dateupon which such maximum loan value becomes effec-tive: Provided, That such credit is extended:
(1) To any dealer, for the purpose of financing thedistribution of an issue of securities at wholesale orretail; or
(2) To any group, joint account or syndicate, for thepurpose of underwriting or distributing an issue ofsecurities.
Supplement to Regulation T—Effective February 1,1936.
MAXIMUM LOAN VALUES OF REGISTERED SECURI-TIES (OTHER THAN EXEMPTED SECURITIES)FOR PURPOSES OF REGULATION T
Pursuant to the provisions of section 7 of theSecurities Exchange Act of 1934 and section 3of its Regulation T, as amended, the Board ofGovernors of the Federal Reserve System here-by prescribes the following maximum loanvalues of registered securities (other thanexempted securities) for the purposes of Regula-tion T:
(1) General rule.—Except as provided in para-graphs (2) and (3) of tnis supplement, the maximumloan value of a registered security (other than anexempted security) shall be whichever is the higher of:
(A) 45 percent of the current market value ofthe security; or
(B) 100 percent of the lowest market value ofthe security computed at the lowest market pricetherefor during the period of 36 calendar monthsimmediately prior to the first day of the currentmonth, but not more than 75 percent of the cur-rent market value: Provided, That until July 1,1936, for the purpose of this regulation, the lowestprice at which a security has sold on or after July 1,.1933, but prior to the first day of the currentmonth, shall be considered as the lowest marketprice of such security during the preceding 36calendar months; And provided, That the lowestmarket price which could be used under the pro-visions of this regulation during any calendarmonth may be used during the first *7 calendardays of the succeeding calendar month.
(2) Extension of credit to other members, brokers,and dealers.—The maximum loan value of a registeredsecurity (other than an exempted security) in a specialaccount with another member, broker or dealer, whichspecial account complies with subsection (b) of section 3of Regulation T, as amended, shall be 80 percent of thecurrent market value of the security.
(3) Extension of credit to distributors, syndicates,,etc.—The maximum loan value of a registered security(other than an exempted security) in a special accountwith a distributor, syndicate, etc., which special accountcomplies with subsection (c) of section 3 of RegulationT, as amended, shall be 80 percent of the cuirentmarket value of the securitv.
Interpretation of provision in section 6 of RegulationT regarding the 7-day period.
Ruling No. 48 interpreting Regulation T.—In reply to an inquiry regarding the provisionsof section 6 of Regulation T, as amended May10, 1935, the Board of Governors of the FederalReserve System rules that the 7-day periodreferred to in that section, which deals with
Digitized for FRASER http://fraser.stlouisfed.org/ Federal Reserve Bank of St. Louis
FEBRUARY 1936 FEDERAL RESERVE BULLETIN 123
"cash transactions'', ends at midnight of theseventh day following the date on which theperiod commences to run.
Discounts for individuals, partnerships, and corpora-tions.
The authority granted by the Board to allFederal Reserve banks in its circular of July26, 1932, to discount eligible notes, drafts, andbills of exchange for individuals, partnerships,and corporations subject to the provisions oflaw, the Board's regulations, and that circularhas been extended from time to time and hasrecently been again extended by the Boardfor an additional 6-months' period ending atthe close of business on July 31, 1936. Thelaw on this subject, which is contained in thethird paragraph of section 13 of the FederalReserve Act, was amended by the BankingAct of 1935 so that it is no longer necessarythat paper discounted for individuals, partner-ships, and corporations under this authoritybe both indorsed and secured and it is nownecessary only that such paper be eitherindorsed or secured to the satisfaction of theFederal Reserve bank. Accordingly, in orderto conform to the law, the provisions of theBoard's circular on this subject have beenamended in certain respects, effective February1, 1936, and the circular in its revised form isset forth below:
BOARD OF GOVERNORSOF THE FEDERAL RESERVE SYSTEM,
WASHINGTON, February 1, 1936.
DISCOUNTS FOR INDIVIDUALS, PARTNERSHIPS, ANDCORPORATIONS
To all Federal Reserve banks:The third paragraph of section 13 of the Federal
Reserve Act, as amended by the acts of July 21, 1932,and August 23, 1935, provides as follows:
"In unusual and exigent circumstances, the Board ofGovernors of the Federal Reserve System, by theaffirmative vote of not less than five members, mayauthorize any Federal reserve bank, during such pe-riods as the said board may determine, at rates estab-lished in accordance with the provisions of section 14,subdivision (d), of this Act, to discount for any indi-vidual, partnership, or corporation, notes, drafts, andbills of exchange of the kinds and maturities madeeligible for discount for member banks under other pro-visions of this Act when such notes, drafts, and billsof exchange are indorsed or otherwise secured to thesatisfaction of the Federal reserve bank: Provided, Thatbefore discounting any such note, draft, or bill of ex-change for an individual or a partnership or corporationthe Federal reserve bank shall obtain evidence that suchindividual, partnership, or corporation is unable tosecure adequate credit accommodations from other
banking institutions. All such discounts for individ-uals, partnerships, or corporations shall be subject tosuch limitations, restrictions, and regulations as theBoard of Governors of the Federal Reserve Systemmay prescribe/7
In view of the fact that the power conferred by thisprovision can be exercised only in "unusual and exigentcircumstances", the Board of Governors of the FederalReserve System has not prescribed any formal regula-tions governing the exercise of this power; but therequirements of the law and the procedure which theBoard will expect to be followed are outlined below forthe information of the Federal Reserve banks and anyindividuals, partnerships, or corporations that maycontemplate applying to them for discounts.
1. LEGAL REQUIREMENTS
Ifc will be observed that, by the express terms of thelaw:
(a) The power conferred upon the Board of Gover-nors of the Federal Reserve System to authorizeFederal Reserve banks to discount eligible paper forindividuals, partnerships, or corporations may beexercised only:
(1) In unusual and exigent circumstances,(2) By the affirmative vote of not less than
five members of the Board of Governors, and(3) For such periods as the Board of Gover-
nors may determine.(6) When so authorized, a Federal Reserve bank
may discount for individuals, partnerships, or cor-porations only notes, drafts, and bills of exchange ofthe kinds and maturities made eligible for discountfor member banks, under other provisions (sees. 13,13a, and 24) of the Federal Reserve Act. (Such papermust, therefore, comply with the applicable require-ments of the regulations of the Board of Governors ofthe Federal Reserve System.)
(c) Paper discounted for individuals, partnerships,or corporations must be either (1) indorsed or (2)otherwise secured to the satisfaction of the FederalReserve bank.
(d) Before discounting paper for any individual,partnership, or corporation, a Federal Reserve bankmust obtain evidence that such individual, partner-ship, or corporation is unable to secure adequatecredit accommodations from other banking institu-tions.
(e) Such discounts may be made only at rates estab-lished by the Federal Reserve banks, subject to reviewand determination by the Board of Governors of theFederal Reserve System.
(/) All discounts for individuals, partnerships, orcorporations are subject to such limitations, restric-tions, and regulations as the Board of Governors of theFederal Reserve System may prescribe.
2. AUTHORIZATION BY THE BOARD OF GOVERNORS
The Board of Governors of the Federal ReserveSystem, pursuant to the power conferred upon it bythe amendment hereinbefore quoted, hereby authorizesall Federal Reserve banks, for a period ending at theclose of business on July 31, 1936, to discount eligiblenotes, drafts, and bills of exchange for individuals,partnerships, and corporations, subject to the provi-sions of the law, the Board's regulations, and thiscircular.
Digitized for FRASER http://fraser.stlouisfed.org/ Federal Reserve Bank of St. Louis
124 FEDERAL RESERVE BULLETIN FEBRUARY 1936
3. FOR WHOM PAPER MAY BE DISCOUNTED
A Federal Reserve bank may discount for individuals,partnerships, or corporations notes, drafts, or bills ofexchange, which are the obligations of such individuals,partnerships, or corporations or which are the obliga-tions of other parties actually owned by such individ-uals, partnerships, or corporations.
Within the meaning of this circular, the term"corporations" does not include banks.
4. APPLICATIONS FOR DISCOUNT
Each application of an individual, partnership, orcorporation for the discount of eligible paper by theFederal Reserve bank must be addressed to the FederalReserve bank of the district in which the principalplace of business of the applicant is located, must bemade in writing on a form furnished for that purposeby the Federal Reserve bank, and must contain, or beaccompanied by, the following:
(a) A statement of the circumstances giving riseto the application and of the purposes for which theproceeds of the discount are to be used;
(b) Evidence sufficient to satisfy the Federal Reservebank as to (1) the legal eligibility of the paper offeredfor discount under the provisions of the FederalReserve Act and the regulations of the Board ofGovernors of the Federal Reserve System and (2) itsacceptability from a credit standpoint;
(c) A statement of the efforts made by the applicantto obtain adequate credit accommodations from otherbanking institutions, including the names and addressesof all other banking institutions to which applicationsfor such credit accommodations were made, the datesupon which such applications were made, whether suchapplications were definitely refused and the reasons,,if any, given for such refusal;
(d) A list showing each bank with which the appli-cant has had banking relations, either as a depositoror as a borrower, during the preceding year, with theapproximate date upon which such banking relationscommenced and, if such banking relations have beenterminated, the approximate date of their termination;
(e) Complete credit data regarding the financialcondition of the principal obligors and indorsers, ifany, on the paper offered for discount;
(/) A list and description of any collateral or othersecurity offered by the applicant;
(g) A waiver by the applicant of demand, notice,and protest as to applicant's obligation on all paperdiscounted by the Federal Reserve bank or held bythe Federal Reserve bank as security; and
(h) An agreement by the applicant, in form satisfac-tory to the Federal Reserve bank, (1) to furnish addi-tional credit information to the Federal Reserve bank,when requested, (2) to submit to audits, credit investi-gations or examinations by representatives of theFederal Reserve bank at the expense of the applicant,whenever requested by the Federal Reserve bank,
and (3) to furnish additional security whenever re-quested to do so by the Federal Reserve bank.
5. GRANT OR REFUSAL OF APPLICATION
Before discounting notes, drafts, or bills of exchangefor any individual, partnership, or corporation, theFederal Reserve bank shall ascertain to its satisfactionby such means as it may deem appropriate:
(a) That the financial condition and credit standing ofthe applicant justify the granting of such creditaccommodations;
(b) That the paper offered for discount is acceptablefrom a credit standpoint and eligible from a legalstandpoint;
(c) That the indorsement or the security offered isadequate to protect the Federal Reserve bank againstloss;
(d) That there is a reasonable need for such creditaccommodations; and
(e) That the applicant is unable to obtain adequatecredit accommodations from other banking institu-tions.
A special effort should be made to determine whetherthe banking institution with which the applicant ordi-narily transacts his banking business or any otherbanking institution to which the applicant ordinarilywould have access is willing to grant such creditaccommodations.
A Federal Reserve bank should not discount suchpaper unless it appears that the proceeds of such dis-counts will be used to finance current business opera-tions and not for speculative purposes, for permanentor fixed investments, or for any other capital purposes.Except with the permission of the Board of Governorsof the Federal Reserve System, no such paper shouldbe discounted if it appears that the proceeds will beused for the purpose of paying off existing indebtednessto other banking institutions.
In discounting paper for individuals, partnerships, orcorporations, a Federal Reserve bank should not makeany commitment to renew or extend such paper or togrant further or additional discounts.
6. LIMITATIONS
Except with the permission of the Board of Governorsof the Federal Reserve System, no Federal Reservebank shall discount for any one individual, partnershipor corporation paper amounting in the aggregate tomore than 1 percent of the paid-in capital stock andsurplus of such Federal Reserve bank.
7. ADDITIONAL REQUIREMENTS
Any Federal Reserve bank may prescribe such addi-tional requirements and procedure respecting discountshereunder as it may deem necessary or advisable; pro-vided that such requirements and procedure are con-sistent with the provisions of the law, the Board'sregulations and the terms of this circular.
CHESTER MORRILL, Secretary.
Digitized for FRASER http://fraser.stlouisfed.org/ Federal Reserve Bank of St. Louis
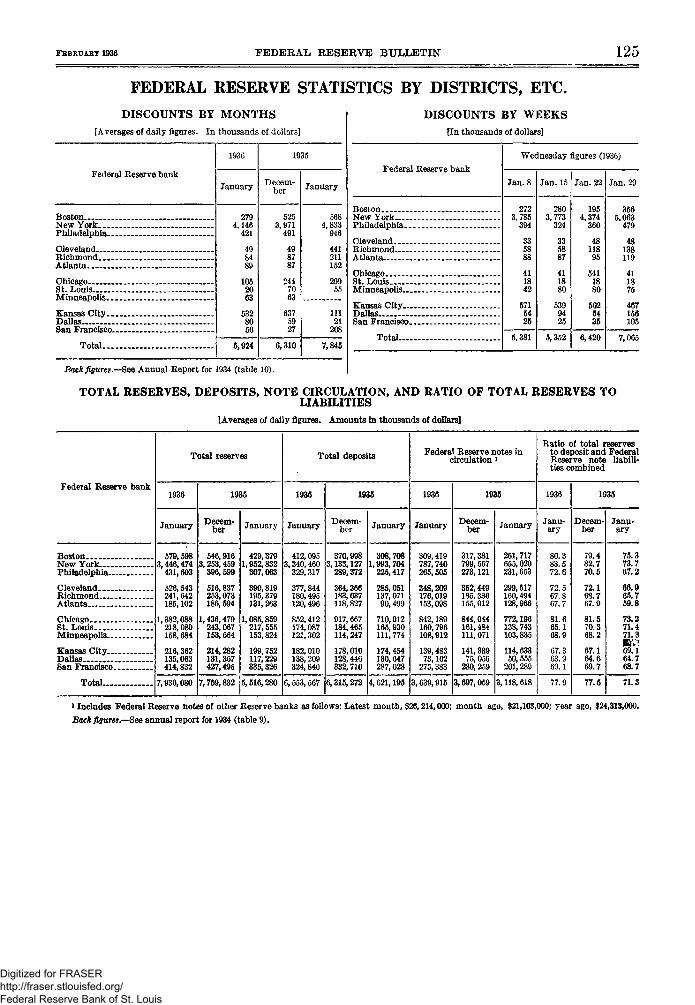
FEBRUABY 1936 FEDERAL RESERVE BULLETIN 125
FEDERAL RESERVE STATISTICS BY DISTRICTS, ETC.
DISCOUNTS BY MONTHS[Averages of daily figures. In thousands of dollars]
Federal Reserve bank
Boston -New York . - .Philadelphia
Cleveland.. . . . _ . _RichmondAtlanta —
ChicagoSt. Louis. .Minneapolis
Kansas CityDallasSan Francisco
Total
1936
January
2794 146
421
498489
1052063
5328056
5,924
1935
Decem-ber
5253 971
491
498787
2447063
6375927
6,310
January
5684 833
946
441211152
29955
11121
208
7,845
DISCOUNTS BY WEEKS[In thousands of dollars]
Federal Reserve bank
BostonNew York—.Philadelphia.
Cleveland.,.Richmond-Atlanta
ChicagoSt. LouisMinneapolis
Kansas City. . .DallasSan Francisco.
T o t a l -
Wednesday figures (1936)
Jan .8 Jan.15 Jan.22 Jan.29
2723,785
394
3358
411842
5715425
5,381
2803,773
324
335887
411880
5399425
5,352
1954,374
360
11895
54118
5025435
6,420
3565,063
479
48138119
411875
467156105
7,065
Back figures.—See Annual Report for 1934 (table 10).
TOTAL RESERVES, DEPOSITS, NOTE CIRCULATION, AND RATIO OF TOTAL RESERVES TOLIABILITIES
[Averages of daily figures. Amounts in thousands of dollars]
Federal Reserve bank
Total reserves
1936
January
1935
Decem-ber January
Total deposits
January
1035
Decem-ber January
Federal Reserve notes incirculation i
1936
January
1935
Decem-ber January
Ratio of total reservesto deposit and FederalReserve note liabili-ties combined
1936
Janu-ary
1935
Decem-ber
Janu-ary
BostonNew York.. . .Philadelphia..
Cleveland..Richmond-Atlanta
ChicagoSt. LouisMinneapolis..
Kansas CityDallasSan Francisco.
Total.—
579,5983,446,474431,603
526,543241,642185,102
1,382,088218,089158,684
216,362135,063414,832
546,9163,253,459
516,837253,073186,594
1,436,479243,067153,664
214,282131,367427,495
429,3791,952,832307,063
390,819195,379131,263
1,085,859217,555153,824
199, 752117,229
412,0953,340,460329,317
377,844180.495120.496
852,412174,087121,302
182,010138,209324,840
370,9983,133,127289,372
364,366183,037118,827
917,667184,465114,247
178,010128,446332,710
308,7081,993,704225,417
285,051137,07190,499
710,912165,930111, 774
174,454130,647287,028
309,419787,740265,505
348,209176,019153,098
842,189160,796108,912
139, 48373,162
275,383
317,381799,557273,121
352,449185, 386155,912
844,044161,484111, 071
141,33975, 056
280,259
261,717655,020231,653
299,517160,494128,966
772,196138, 743103,835
114,63350,555
201,289
80.383.572.6
72.567.867.7
81.665.168.9
67.363.969.1
79.482.770.5
72.168.767.9
81.570.368.2
67.164.669.7
75.373.767.2
66.965.759.8
73.271.471.3
69.164.768.7
7,936,080 7,759,832 5,516,280 6,553,567 6,315,272 4,621,195 3,639,915 3,697,059 3,118,618 77.9 77.5 71.3
i Includes Federal Reserve notes of other Reserve banks as follows: Latest month, $26,214,000; month ago, $21,103,000; 3rear ago, $24,313,000.
Back figure?.—See annual report for 1934 (table 9).
Digitized for FRASER http://fraser.stlouisfed.org/ Federal Reserve Bank of St. Louis
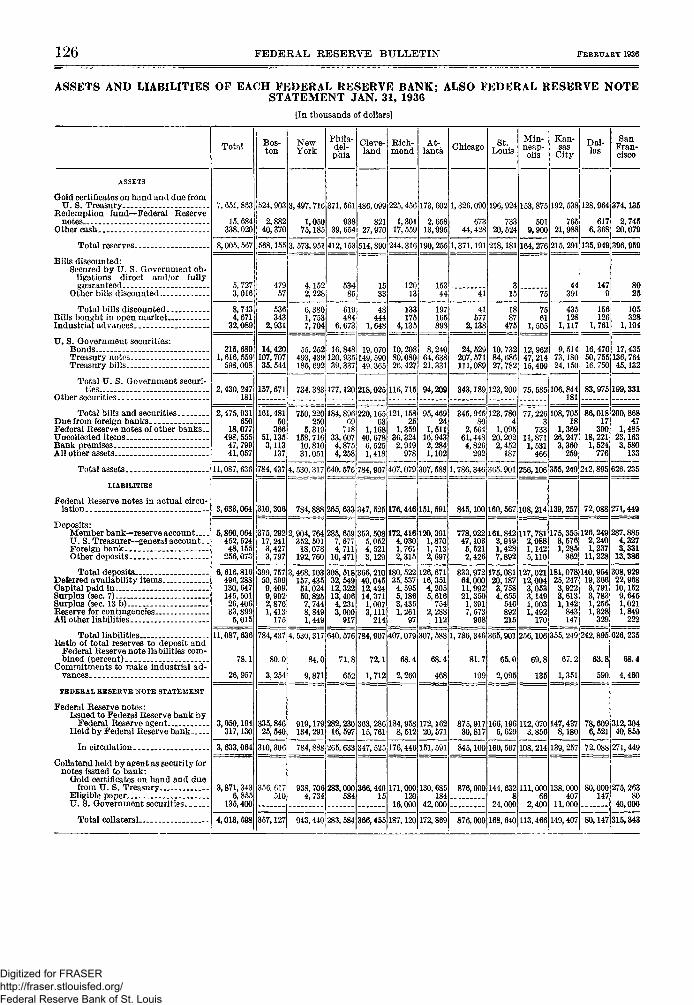
126 FEDERAL RESERVE BULLETIN FEBRUARY 1936
ASSETS AND LIABILITIES OF EACH FEDERAL RESERVE BANK; ALSO FEDERAL RESERVE NOTESTATEMENT JAN. 31, 1936
[In thousands of dollars]
TotalBos-ton
NewYork
Phila-del-phia
Cleve-land
Rich-mond
At-lanta Chicago St.
LouisMin-neap-olis
Kan-sas
CityDal- San
Fran-cisco
ASSETS
Gold certificates on hand and due fromU. S. Treasury
Redemption fund—Federal Reservenotes—-
Other cash
Total reserves
Bills discounted:Secured by U. S. Government ob-
ligations direct and/or fullyguaranteed -.
Other bills discounted
Total bills discountedBills bought in open marketIndustrial advances
U. S. Government securities:BondsTreasury notesTreasury bills
Total U. S. Government securi-ties
Other securities
Total bills and securitiesDue from foreign banksFederal Reserve notes of other banks..Uncollected itemsBank premisesAll other assets
Total assets _
LIABILITIES
Federal Reserve notes in actual circu-lation _
Deposits:Member bank—reserve accountU. S. Treasurer—general account..Foreign bankOther deposits
Total deposits --Deferred availability itemsCapital paid in _Surplus (sec. 7).Surplus (sec. 13 b)Reserve for contingenciesAll other liabilities
Total liabilitiesRatio of total reserves to deposit and
Federal Reserve note liabilities com-bined (percent)
Commitments to make industrial ad-vances _ _
FEDERAL RESERVE NOTE STATEMENT
Federal Reserve notes:Issued to Federal Reserve bank by
Federal Reserve agent.Held by Federal Reserve bank
In circulation _
Collateral held by agent as security fornotes issued to bank:
Gold certificates on hand and duefrom U. S. Treasury _.
Eligible paperU. S. Government securities
Total collateral
7, 651, 863
15, 684338,020
524,903 3,497,716 371, 561 486,099 225, 456 173, 602 1, 326,090 196,924 153,875192, 538 128,964 374,135
2,88240,370
1,05075,185
93839,654
82127,970
1,30117,559
2,65813,995
67344,428
73320, 524
5019,900
76521,988
6176,368
2,74520,079
8,005, 567 568,155 3, 573, 951 412,153 514,890 244,316 190,255 1,371,191 218,181164,276 215, 291135,949 396f 959
5,7273,016
47957
8,7434,67132,089
536343
2,931
4,1522, 228j
6,3801,7537,704
53485
215,6801, 616, 559598,008
2,430, 247181
14,420107,70735, 544
157,671
55,252493,439 120,185,692
734,383
2,475,931650
18,077498,55547, 79941,057
161,48150366
51,1353,113137
750,220 184,896 220,165 121,158250 69 63 25
5,319 718 1,168 1,359158,716 33,607 40,678 36,32410,810 4,875 6,525 2,91931,051 4,258 1,418 978
11,087, 636 784,437 4, 530, 317 640, 576 784,907 407,079 307,588
3,633,064 310,306 784,888 265,633 347, 525 176,446 151,591
5,860,064452, 52448,155256,073
6, 616,816
130, 647145, 50126,40633,8995,015
399, 757 3, 468, 103 308, 518 366,21050,599 157,435 32,549 40,0459,409 51,024 12,322 12,4249,902 50,825 13,406 14,3712,876 7,744 4,231 1,0071,413 8,849 3,000 3,111175 1,449 917 214
11,087,636
78.1
26, 957
3,950,194317,130
80.0
3,254
335,84625,540
84.0
9,871
3,633,064 310,306
3,871, 3436,855
135,400
356, 61510
619484
6,673
1533
48444
1,648
12013
15344
133175
4,135
197165
41
41577
2,138
1887
475
75
7561
1,505
44391
ul435128
1,117
156126
1, 761
16,848"1,93539,337
19,070149, 59049, 365
10,208SO, 08026,427
8,24064,63821, 331
24, 529207, 571in, r""
10, 73284,68627,782
12,96247, 21415,409
9,51473,18024,150
16,47050,75116,750
177,120 218,025 116,715 94,209 343,189 123,200 75, 585 106,844181
83,975 199,331
95,46924
1,51116, 9432,2841,102
345,945 123,780 86,018 200,868
1,48523,1633,580
133
1, 786, 346J365, 901 256,106 355,249 242,895 626, 235
2,56461,4484,826292
41,095
20, 2022,452187
77,226 108,7053
73311,8711, 531466
181,
26, 2473,360259
375, 292 2,904,764 285,659 353, 508 172,416 120,39117,241 352,501 7,677 5,052 4,030 1,8703,427 18,078 4,711 4,521 1,761 1,7133,797 192,760 10,471 3,129 2,315 2,697
180,522 126,67135,5374,5955,1863,4351,261
97
784,437 4, 530,317 640,576 784,907 407,079 307, 588 1,786, 346 365,901 256,106 355, 249 242,895 626,235
71.8
652
72.1
1,712
68.4
2,260
919,179 282,230 363, 286 184,958 172,16216, 597 15, 761 8,512 20,571134, 291
784,888 265,633 347, 525 176,446 151, 591
938,706 283,000 366,4404,734 584 15
171,000 130120
16,000
4,013,598 357,127 943, 440 283, 584 366,455 187,120
845,100 160,567 108,214 139,257
778,922 161,842 117,78147,1035,5212,426
16, 3514,2055,616754
2,288112
833,972 175,08164,00011,99221,3501, 3917,573
68.4
468
81.7
109
30,817
1,685184
42,000
172, 869
72,088 271,449
3,9191,4287,892
175,355 128,249 287,8854 3 2 7
1,1425,110
3,5761,285
2,2401,237
11,228
20,1873,7584,655546892215
127,02112,0043,0533,1491,0031,492170
181,078 140,954 308,92925,2473,9223,6131,142843147
19,3663,7913,7831,2561,328329
65.0
2,095
69.8
135
67.2
1,351
63.8
590
875,917 166,196 112,070 147,4378,1805,629 3,856 6,521
845,100 160, 567 108, 214 139, 257
876,000 144, 632 111, 000 138,000
24,00066
2,400407
11,000147
876,000 168, 640 113,466149,407
8025
105328
1,104
17,435136, 76445,132
4 3 2 7
3,33113,386
22,96810,1529,6451,0211,849222
8.4
78,609 312,30440,855
72,088 271,449
80,000 275,26380
40,000
80,147 315,343
Digitized for FRASER http://fraser.stlouisfed.org/ Federal Reserve Bank of St. Louis
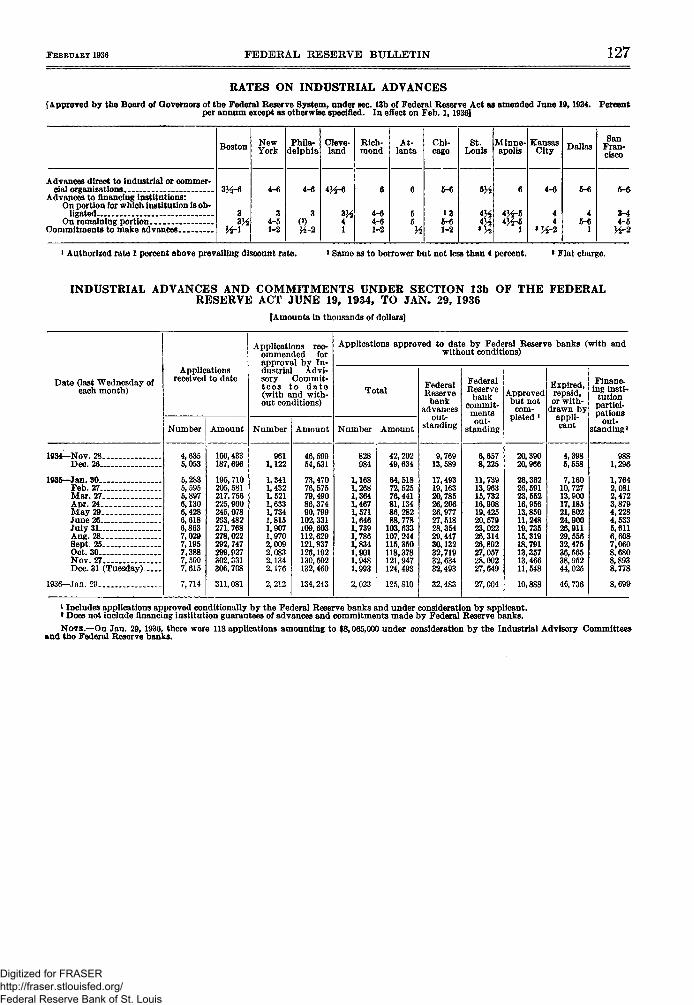
FEBRUARY 1936 FEDEKAL KESERVE BULLETIN 127
RATES ON INDUSTRIAL ADVANCES[Approved by the Board of Governors of the Federal Reserve System, under sec. 13b of Federal Reserve Act as amended June 10,1934. Percent
per annum except as otherwise specified. In effect on Feb. 1,1936]
Advances direct to industrial or commer-cial organizations
Advances to financing institutions:On portion for which institution is ob-
ligatedOn remaining portion
Commitments to make advances
Boston NewYork
Phila-delphia
4-6
34-51-2
4-6
3(*)fc2
Cleve-land
4H-6
Rich-mond
4-64-61-2
At-lanta
Chi-cago
5-6
13
1-2
St.Louis
Minne-apolis
KansasCity
4-6
Dallas
5-6
45-6
1
SanFran-cisco
5-6
3-44-5
* Authorized rate 1 percent above prevailing discount rate. 1 Same as to borrower but not less than 4 percent. • Flat charge.
INDUSTRIAL ADVANCES AND COMMITMENTS UNDER SECTION 13b OF THE FEDERALRESERVE ACT JUNE 19, 1934, TO JAN. 29, 1936
[Amounts in thousands of dollars]
Date (last Wednesday ofeach month)
Applicationsreceived to date
| Number Amount
Applications rec-ommended forapproval by In-dustrial Advi-sory Commit-tees to da t e(with and with-out conditions)
Number Amount
Applications approved to date by Federal Reserve banks (with andwithout conditions)
Total
Number Amount
FederalReserve
bankadvances
out-standing
FederalReserve
bankcommit-mentsout-
standing
Approvedbut not
com-pleted i
Expired,repaid,or with-
drawn byappli-cant
Financ-ing insti-
tutionpartici-pations
out-standing*
1934—Nov. 28.. .Deo. 26
1035—Jan. 30Feb. 27Mar. 27Apr. 24May 29June 26July 31Aug. 28Sept 25Oct. 30Nov. 27Dec. 31 (Tuesday)
1936—Jan. 29 _._.
4,6355,053
5,2835,5956,8976,1306,4286,6186,8637,0297,1957,3887,5007,615
7,714
166,433187,696
195,710205,581217,756225,900245,078263,482271, 768278,022292, 747299,927302,331306,708
311,081
9611,122
1,3411,4321,5211,6331,7341,8151,9071,9702,0092,0832,1342,176
2,212
46,59954,531
73,47076,57579,49086,37490,799102,331iO9,603112,629121,837126,192130,502132,460
134,243
828
1,1681,2681,3641,4671,5711,6461,7391,7861,8341,9011,9481,993
2,023
42,20249, 634
64,51872, 52576,44181,13486,28288,778103,633107,244115,350118,378121,947124,493
125,810
9,76913,589
17,49319,16320,78526,20626,97727,51828,35429,44730,13232,71932,63432,493
32,483
6,6578,225
11,73913,96315,73216,90819,42520,57923,02226,31426,89227,05728,00227,649
27,004
20,39020,966
26,36226,59123,55216,95613,85011,24819,73515,31918,79113,35713,46611,548
10,888
4,3985,558
7,16010,72713,90017,18521,80224,90026,91129,55632,47536,56538,95244,025
46,736
1,296
1,7642,0812,4723,8794,2284,5335,6116,6087,0608,6808,8938,778
i Includes applications approved conditionally by the Federal Reserve banks and under consideration by applicant.* Does not include financing institution guarantees of advances and commitments made by Federal Reserve banks.
NOTE.—On Jan. 29, 1936, there were 118 applications amounting to $8,065,000 under consideration by the Industrial Advisory Committeesand the Federal Reserve banks.
Digitized for FRASER http://fraser.stlouisfed.org/ Federal Reserve Bank of St. Louis
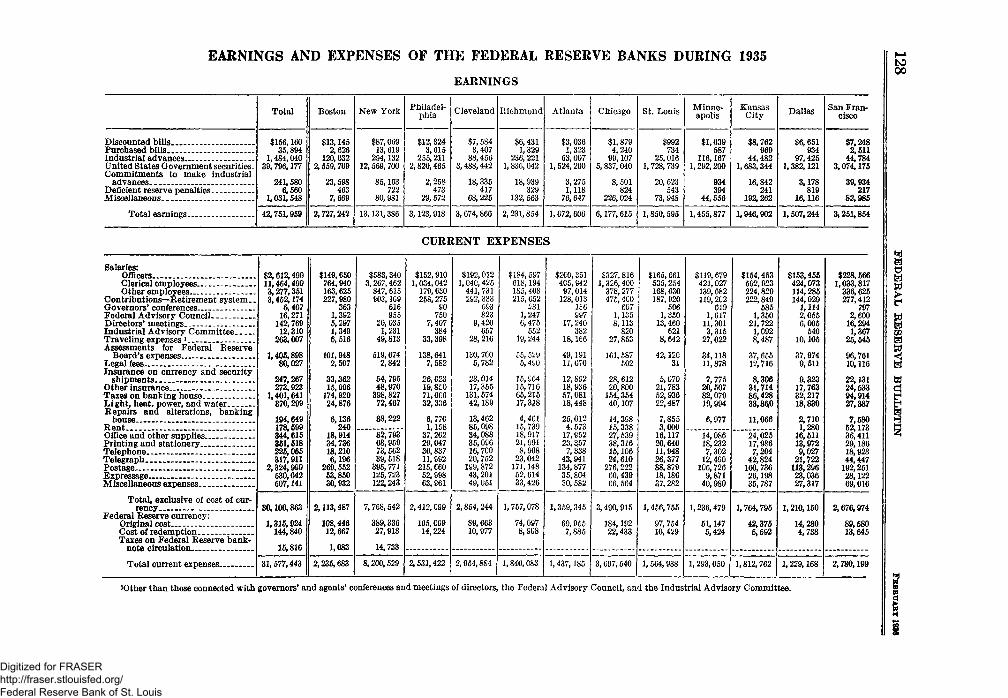
EARNINGS AND EXPENSES OF THE FEDERAL RESERVE BANKS DURING 1935
EARNINGS
Discounted billsPurchased billsIndustrial advancesUnited States Government securities.Commitments to make industrial
advances -_ .Deficient reserve penaltiesMiscellaneous
Total earnings - - . _ _.
Total
$156,16035,894
1,484,04039,796,177
241,5806,560
1,031,548
42,751,959
Boston
$13,1452,626
120,0322,559,709
23,598463
7,669
2,727,242
New York
$87,06913, 619
294,13212,569, 700
85,163722
80, 981
13,131, 386
Philadel-phia
$12,3243,615
255,2112,820,465
2,258473
29, 572
3,123,918
Cleveland
$7,5843,407
88,4563,488,442
18,335417
68,225
3, 674,866
Richmond
$6,4311,329
236,2211,836,042
18, 939329
132, 563
2,231,854
Atlanta
$3,0361,323
63,0071,524, 200
3,2751,118
76, 647
1, 672, 606
Chicago
$1,8794,240
99,1075, 837, 040
8,501824
226,024
6,177,615
St. Louis
$992734
25,0161, 728, 739
20, 623543
73,948
1,850,595
Minne-apolis
$1,039587
116,1671,292, 200
934394
44,556
1,455,877
KansasCity
$8,762969
44,4821,683,344
16,842241
192,262
1,946,902
Dallas
$6,651934
97,4251,382,121
3,178819
16,116
1,507,244
San Fran-cisco
$7,2482,511
44,7843,074,175
39,934217
82,985
3> 251,854
to
CURRENT EXPENSES
Salaries:OfficersClerical employeesOther employees
Contributions-—Retirement system..Governors' conferencesFederal Advisory CouncilDirectors' meetingsIndustrial Advisory CommitteeTraveling expenses »Assessments for Federal Reserve
Board's expensesLegal fees _Insurance on currency and security
shipments _Other insurance _Taxes on banking houseLight, heat, power, and waterRepairs and alterations, banking
houseRent _ _Office and other supplies.._Printing and stationeryTelephone _Telegraph _ _PostageExpressageM iscellaneous expenses
Total, exclusive of cost of cur-rency
Federal Reserve currency:Original costCost of redemptionTaxes on Federal Reserve bank-
note circulation _
Total current expenses..
$2,612,49011,464,4993,277,3513,452,174
6,40716,271
142,76912,310
263,007
1,405,89880,027
247,267273,923
1,401,641370,299
194,649178,699344,615351,518225,065317,911
2,324,990530,042607,141
30,100,863
1,315,924144,840
15,816
31,577,443
$149,650764,940163,625227,980
3631,3925,2971,3496,516
101,9482,507
33,36215,986
174,92024,876
6,136240
18,91434,73618,2106,196
269,55253,85030,932
2,113,487
108,44612,667
1,083
2,235,683
$583,3403,267,462
847, 615803,109
616955
20,0351,231
49,813
519,6742,842
54,79548,970
72,467
88,222
82,79368,95973,56239, 518
395,771125,723122,243
7, 768,542
389,33627,918
14,733
8,200,529
$152,9101,034,042179, 630258,275
90750
7,407384
33,398
138,6417,582
26,02319, 8£071,01632,336
6, 77C1,158
37,26229,04730,83711,992
215,66052,89863,861
2,412,099
105,08914,224
2,531,422
$192,0121,040,425441,731282, 323
683823
9,420657
28,216
ISO, 7005,782
23,01417,355131,57442,189
13,46285,09834,08835,08616,70020,752189,87243,20149,051
2,854,244
89, 66310, 977
2,954,884
$184, 597618,194185, 408215,652
2311,2476,475552
19, 244
55,5295,480
15, £6415,71665,21517,3^8
4,46115, 73918, 91721,8918,80823,042171,14852, 61433,426
1,757,078
74,0978,808
1,840, CS3
$2C0,3514G5,84297,014128, 013
1£6897
17, 240382
18,1C6
49,19111,070
12,89218, 93657,08118,448
25,0124,57317,85223,3,577,33843,941134,87735,8C430, 582
1,359,345
69,9557,885
1,437,185
$327,8161,326,400378,277475,4C0
CC71,1358,113820
27,853
161, 587502
28,61220,800154,35440,107
14,38815,33827, 53938,31615,10624,610276,22260,43966, 564
3,480,915
184,18222,433
3, 697, 540
$165,661535,254168,630187,920
5C61,35013,460
6218,642
42,12031
5,07021,78352,93622,487
7,8553,00016,11720,64011,94826,37788,87918,18637,282
1,456,755
97,75410,429
1, 564, 938
$119,679421,027139,682119,2C2
6191,61711,3013,31527,022
34,11811, 878
7,77520,50782,07919,994
6,977
14,08618,2327,30212,480
106, 7269,87140,980
1,236,479
51,1475,424
1, 293,050
$154,453592,923224,829222,849
5851,350
21, 7221,0928,487
37,65512,716
8,30631,71486,42833,860
11,066
24,02517,9867,204
42,824160,73626,19835,787
1,764,795
42,3755,592
1,812,762
$153,455424,073114,285144,0291,1142,0556,005540
10,105
37,9749,511
9,32317,76332,21718,830
2,7101,28016,51113,9729,02721,722113,29623,03627,317
1,210,150
14,2804,738
1,229,168
1,033,817336,625277,412
7972,60016,2941,367
25,545
96,76110,116
22,13124,53394,91427,387
7,58052,17336,41129,18618,92344,447192,25128,12269,016
2,676,974
89,58013,645
2,780,199
g
wd
'Other than those connected with governors' and agents' conferences and meetings of directors, the Federal Advisory Council, and the Industrial Advisory Committee.
Digitized for FRASER http://fraser.stlouisfed.org/ Federal Reserve Bank of St. Louis
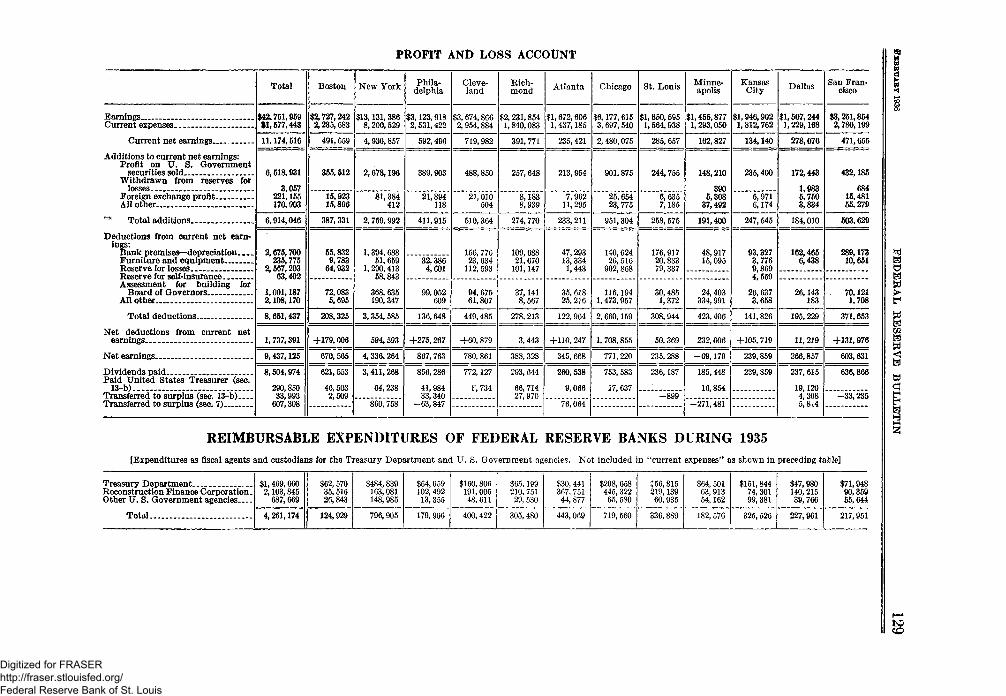
PROFIT AND LOSS ACCOUNT
EarningsCurrent expenses
Current net earnings
Additions to current net earnings:Profit on U. S. Government
securities soldWithdrawn from reserves for
lossesForeign exchange profitAllother
^ Total additions
Deductions from current net earn-ings:
Bank pi emises—depreciationFurniture and equipmentReserve for lossesReserve for self-insuranceAssessment for building for
Board of GovernorsAllother _
Total deductions.-
Net deductions from current netearnings _
Net earnings
Dividends paidPaid United States Treasurer (sec.
13-b)Transferred to surplus (sec. 13-b)Transferred to surplus (sec. 7)
Total
$42,751,95931,577,443
11.174,516
6,518,931
3 057221,155170,903
6,914,046
2,675,700235,775
2,567,20363,402
1,001,1872,108,170
8,651,437
1,737,391
9,437,125
8,504,974
290,85033,993
607,308
Boston
$2,727,2422,235,683
491,559
355,512
15,92315,896
387,331
55,8329,783
64,932
72,0835,695
208,325
+179,006
670, 565
621, 553
46, 5032,509
New York
$13,131,3868,200,529
4,930,857
2,678,196
81,384412
2,759,992
1,394,68851, 659
1,290,41358,843
368,635190,347
3,354, 585
594, 593
4,336,264
3,411,268
64,238
860,758
Phila-delphia
$3,123,9182,531,422
592, 496
389,903
21,894118
411,915
32,3864,601
99,052609
136,648
+275, 267
867, 763
856, 286
41,98433,340
-63,847
Cleve-land
$3, 674,8662, 954,884
719,982
488,850
21, 010504
510,364
156, 77623, 634
112, 593
94,67561,807
449, 485
+60,879
780,861
772,127
8,734
Rich-mond
$2,231,8541,840,083
391, 771
257, 648
8,1838,939
274,770
109, 68821, 670
101,147
37,1418,567
278, 213
3,443
388, 328
293, 644
66,71427, 970
Atlanta
$1,672,6061,437,185
235,421
213,954
7,96211, 295
233, 211
47,29313, 3341,443
35, 61825, 276
122,964
+110, 247
345, 668
260, 538
9,066
76,064
Chicago
$6,177,6153, 697, 540
2, 480,075
901,875
25, 65423, 775
951,304
140,62426, 516
902,868
116,1941,473,957
2, 660,159
1, 708,855
771,220
753, 583
17, 637
St. Louis
$1,860,5951,564,938
285,657
244,755
6,6357,185
258,575
176,91720, 83379, 337
30, 4851,372
308,944
50, 369
235,288
236,187
—899
Minne-apolis
$1,455,8771,293,050
162.827
148,210
3905,308
37,492
191,400
48,91715,095
24,403334,991
423,406
232,006
-69,179
185,448
16,854
-271,481
KansasCity
$1,946,9021,812,762
134,140
235,400
5,9716,174
247,545
93,3273,7769,8694,559
26,6373,658
141,826
+105, 719
239,859
239,859
Dallas
$1,507,2441,229,168
278,076
172,443
1,9835,7503,834
184,010
162,4656,438
26,143183
195, 229
11, 219
266,857
237, 615
19,1204,3085,8t4
San Fran-cisco
$3,251,8542,780,199
471,655
432,185
68415,48155,279
503,629
289,17310,651
. 70,1211,708
371,653
+131,976
603,631
636,866
-33,235
REIMBURSABLE EXPENDITURES OF FEDERAL RESERVE BANKS DURING 1935[Expenditures as fiscal agents and custodians for the Treasury Department and U. S. Government agencies. Not included in "current expenses" as shown in preceding table]
Treasury DepartmentReconstruction Finance Corporation.Other U. S. Government agencies
Total
$1,469,6602,103,845
687,669
4,261,174
$62, 57035,51620,843
124,929
$484,839163,081148,985
796,905
$64,059102, 492
13, 355
179,906
$160, 806191,00548,611
400,422
$65.199210. 75129, 530
305, 480
$30, 441367, 751
44, 877
443,069
$208,658445, 322
65, 580
719, 560
C56,815219,13960,935
336.889
$64, 50163,91354,162
182, 576
$151, 84474, 30199,381
325, 526
$47,980140, 21539, 766
227,961
$71,94890,35955,644
217,951
i-
Digitized for FRASER http://fraser.stlouisfed.org/ Federal Reserve Bank of St. Louis
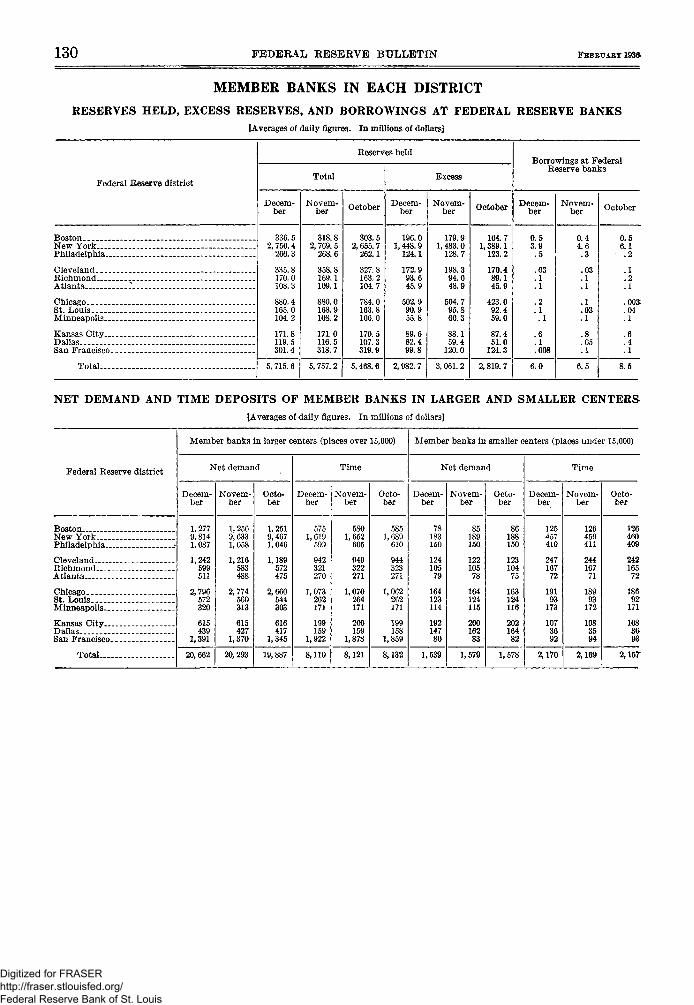
130 FEDERAL RESERVE BULLETIN FEBRUARY 1936
MEMBER BANKS IN EACH DISTRICT
RESERVES HELD, EXCESS RESERVES, AND BORROWINGS AT FEDERAL RESERVE BANKS[Averages of daily figures. In millions of dollars]
Federal Reserve district
BostonNew York _ __ _ .Philadelphia
ClevelandRichmondAtlanta -- _. T_ _ _
Chicago .St LouisMinneapolis - -_ -
Kansas CityDallasSan Francisco...
Total
Reserves held
Total
Decem-ber
336.52, 756. 4
266.3
335.8170.0108.3
880.4165.0104.2
171.8119.5301.4
5, 715. 6
Novem-ber
318.82, 769. 5
268.6
358.8169.1109.1
880.0168.9108.2
171 0116.5318.7
5, 757. 2
October
303.52,655. 7
262.1
327.8163.2104.7
784.0163.8106.0
170.5107.3319.9
5, 468. 6
Excess
Decem-ber
196.01,448.9
124.1
172.993.645.9
502.990.955.8
89.662.499.8
2,982. 7
Novem-ber
179.91,483.0
128.7
198.394.048.9
504.795.860.3
88.159.4
120.0
3, 061. 2
October
164.71,389.1
123.2
170.489.145.9
423.092.459.0
87.451.0
124.3
2,819. 7
Borrowings at FederalReserve banks
Decem-ber
0.53.9.5
.03
. l
.1
.2
.1.1
.6
.1
.008
6.0
Novem-ber
0.44.6.3
.03
. l
.1
.1
.03
.1
.8
.05
.1
6.5
October
0.56.1.2
.1
.2
.1
.003:
.04
.1
.6
.4
.1
8.5
NET DEMAND AND TIME DEPOSITS OF MEMBER BANKS IN LARGER AND SMALLER CENTERS[Averages of daily figures. In millions of dollars]
Federal Reserve district
BostonNew YorkPhiladelphia J
ClevelandRichmondAtlanta
ChicagoSt. LouisMinneapolis.
Kansas CityDallasSan Francisco
Total
Member banks in larger centers (places over 15,000)
Net demand
Decem-ber
1,2779,8141,087
1,242599511
2,796572320
615439
1,391
20, 662
Novem-ber
1,2569,6331,058
1,216583488
2,774560313
615427
1,370
20,293
Octo-ber
1,2519,4671,046
1,189572475
2,660544303
616417
1,345
19,887
Time
Decem-ber
5751, 619
599
942321270
1,073262171
199159
1,922
8,110
Novem-ber
5801,652
605
049322271
1,070264171
200159
1,878
8,121
Octo-ber
5851,689
610
944323271
1,062262171
199158
1,859
8,132
Member banks in smaller centers (places under 15,000)
Net demand
Decem-ber
78183150
12410579
164123114
19214780
1,539
Novem-ber
85189150
12210578
164124115
20016283
1,579
Octo-ber
86188150
12310475
163124116
20216482
1,578
Time
Decem-ber
125457410
24716772
19193
173
1073692
2,170
Novem-ber
126459411
24416771
18993
172
1083594
2,169
Octo-ber
126460409
24216572
18692
171
1083693
2,157
Digitized for FRASER http://fraser.stlouisfed.org/ Federal Reserve Bank of St. Louis
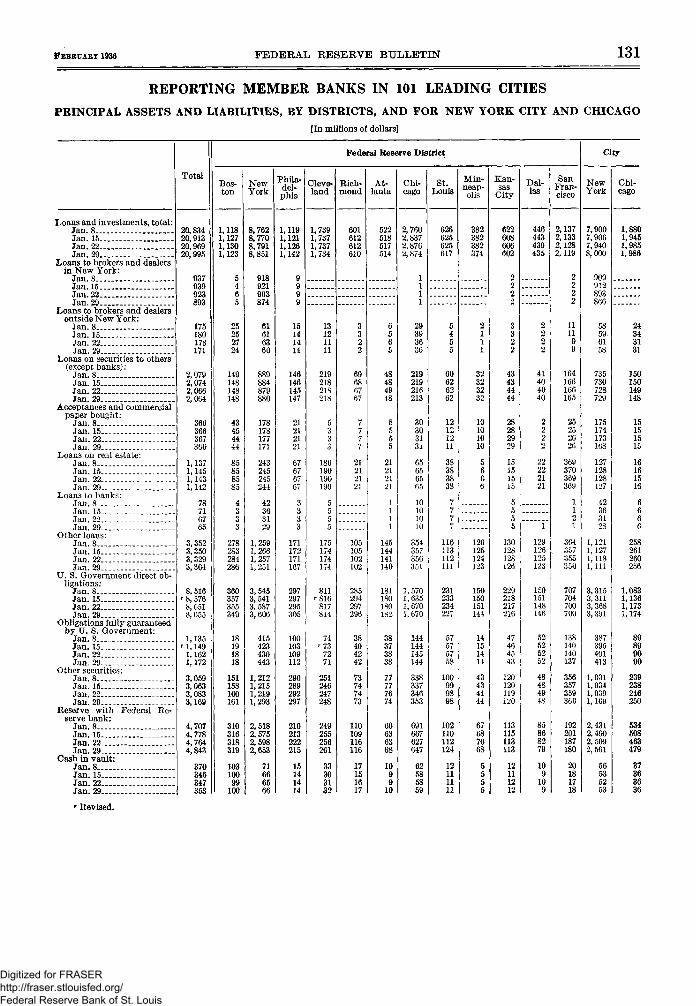
FEBRUARY 1936 FEDERAL RESERVE BULLETIN 131
REPORTING MEMBER BANKS IN 101 LEADING CITIES
PRINCIPAL ASSETS AND LIABILITIES, BY DISTRICTS, AND FOR NEW YORK CITY AND CHICAGO[In millions of dollars]
Loans and investments, total:Jan 8Jan. 15Jan 22Jan. 29
Loans to brokers and dealersin New York:
Jan 8Jan 15Jan 22Jan 29
Loans to brokers and dealersoutside New York:
Jan. 8Jan. 15Jan. 22Jan. 29
Loans on securities to others(except banks):
Jan.8Jan. 15Jan. 22Jan. 29
Acceptances and commercialpaper bought:
Jan. 8 _Jan.15Jan. 22Jan. 29
Loans on real estate:Jan. 8Jan. 15Jan. 22Jan 29
Loans to banks:Jan 8Jan 15Jan 22Jan 29
Other loans:Jan. 8 . .Jan. 15Jan. 22Jan. 29__
U. S. Government direct ob-ligations:
Jan. 8_ __Jan.15 - .Jan. 22Jan. 29- . .
Obligations fully guaranteedby U. S. Government:
Jan. 8Jan. 15Jan. 22.Jan. 29
Other securities:Jan. 8Jan 15Jan. 22Jan. 29
Reserve with Federal Re-serve bank:
Jan. 8._Jan. 15Jan. 22Jan. 29
Cash in vault:Jan. 8Jan.15Jan. 22Jan. 29
Total
20,83420,91320,96920,995
937939923893
175180178171
2,0792,0742,0G62,064
366366367360
1,1371,1451,1431,142
78716765
3,3523,3503,3293,304
8,516r 8,576
8,6518,655
1,135r 1,149
1,1621,172
3,0593,0633,0833,169
4,7074,7784,7644,843
370346347353
Federal Reserve District
Bos-ton
1,1181,1271,1301,123
5465
25252724
149148148148
43454444
85858585
4333
278283284286
360357355349
18191818
151158160161
310316318319
10310099
100
NewYork
8,7628,7708,7918,851
918921903874
61616360
889884879880
178178177171
243245245241
42363129
1,2591,2661,2571,251
3,5453,5413,5873,606
415423430443
1,2121,2151,2191,293
2,5182,5752,5982,653
71666566
Phila-del-phia
1,1191,1211,1261,142
9999
15141414
146146145147
21212121
67676767
3333
171172171167
297297295305
100103109112
290289292297
210213222215
15141414
Cleve-land
1,7391,7371,7371,734
13121111
219218218218
5333
186190190190
5555
175174174174
811••816
817814
74' 7 3
7271
251246247248
249255256261
33303132
Rich-mond
601612612610
3322
69686767
7777
21212121
105105102102
285294297296
38404242
73747473
110109116116
17151617
At-lanta
522518517514
6565
48484948
5555
21212121
1111
145144141140
181180180182
38373838
77777674
60636368
1099
10
Chi-cago
2,7602,8372,8762,874
1111
29393636
219219216213
30303131
65656565
10101010
354357356351
1,5701,6351,6701,070
144144145144
338337346353
691667627647
62585859
St.Louis
626625625617
5455
60626262
12121211
38383838
777
116113112111
231233234227
57575758
100999898
102110112124
12111111
Min-neap-olis
382382382374
2111
32323232
10101010
5666
126125124123
150150151144
14151414
43434444
67687068
5555
Kan-sas
City
622608606602
2222
3322
43434444
28282929
15151515
5555
130128128126
229218217216
47464543
120120119120
113115113113
12111212
Dal-las
446443439435
2222
41404040
2222
22222121
I
129126125123
150151148146
52525252
48484948
85868279
109
109
SanFran-cisco
2,1372,1332,1282,119
2222
111199
164166166165
25252626
369370369369
1121
364357355350
707704700700
138140140137
356357359360
192201187180
20181718
City
NewYork
7,9007,9067,9408,000
909912893866
58596158
735730728729
175174173168
127128128127
42363128
1,1211,1271,1181,111
3,3153, 3113, 3683, 391
387395401413
1,0311,0341,0391,109
2,4312,4902,5092,561
56535253
Chi-cago
1,8801,9451,9851,986
24343131
150150149148
15151515
16161516
6666
258261260256
1,0831,1361,1731,174
89899C90
239238246250
534508463479
37363636
r Revised.
Digitized for FRASER http://fraser.stlouisfed.org/ Federal Reserve Bank of St. Louis
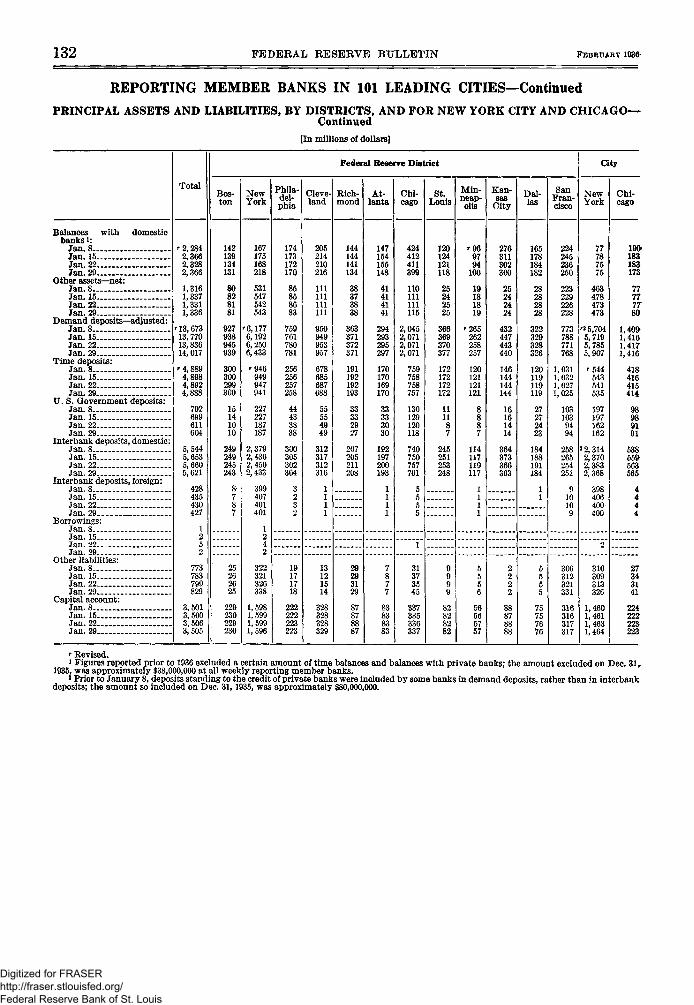
132 FEDERAL RESERVE BULLETIN FEBRUARY 1936
REPORTING MEMBER BANKS IN 101 LEADING CITIES—Continued
PRINCIPAL ASSETS AND LIABILITIES, BY DISTRICTS, AND FOR NEW YORK CITY AND CHICAGO—Continued
[In millions of dollars]
Balances with domesticbanks i:
Jan.8Jan. 15Jan. 22Jan. 29
Other assets—net:Jan. 8Jan. 15Jan. 22Jan. 29
Demand deposits—adjusted:Jan. 8Jan 15Jan. 22Jan. 29
Time deposits:Jan. 8 .Jan. 15 _Jan. 22 _Jan. 29
U. S. Government deposits:Jan. 8Jan. 15Jan. 22Jan. 29
Interbank deposits, domestic:Jan. 8Jan. 15Jan. 22Jan. 29
Interbank deposits, foreign:Jan. 8Jan. 15Jan. 22Jan. 29
Borrowings:Jan. 8Jan. 15 _Jan. 22Jan 29
Other liabilities:Jan. 8Jan.15Jan. 22Jan 29
Capital account:Jan. 8Jan. 15Jan. 22Jan. 29
Total
' 2 , 2842,3662,3282,366
1,3161,3371,3311,336
'13,67313,77013,83614,017
' 4, 8894,8984,8924,888
702699611604
5,5445,6535,6605,621
428435430427
1252
773783799829
3,5013,5003,5063,505
Federal Reserve District
Bos-ton
142139134131
80828181
927938945939
300300299300
15141010
249249245243
8-787
25262625
229230229230
NewYork
167175168218
531547542543
'6,1776,1926,2506,433
'946949947941
227227187187
2,3792,4362,4502, 433
399407401401
1242
322321326338
1,5981,5991,5991,596
Phila-del-phia
174173172170
85858683
759761780781
256256257258
44433838
300305302304
3232
19171718
222222223223
Cleve-land
205214210216
111111111111
950949953957
678685687688
55554949
312317312316
1111
13121514
328328328329
Rich-mond
144144141134
38373838
363371372371
191192192193
33332927
207205211208
29293129
87878887
At-lanta
147154155148
41414141
294293295297
170170169170
33333030
192197200193
1111
7877
83838383
Chi-cago
424412411399
110111111115
2,0452,0712,0712,071
759758758757
130129120118
740750757761
5555
1
31373545
337335336337
St.Louis
120124121118
25242525
366369370377
172172172172
11118
245251253248
9999
82828282
Min-neap-olis
' 9 69794
100
19181819
' 2 6 5262258257
120121121121
8887
114117119117
1111
5556
56565757
Kan-sas
City
276311302300
25242424
432447443440
146144144144
16161414
364373366363
2222
88878888
Dal-las
165178184182
28282828
322329328326
120119119119
27272423
184188191184
11
5555
75757676
SanFran-cisco
224245236250
223229226228
773788771768
1,0311,0321,0271,025
1031039494
258265254251
910109
306312321331
316316317317
City
NewYork
77787575
463478473473
'2 5,7045,7195,7855,907
' 5 4 4543541535
197197162162
2 2,3142,3702,3832,368
398406400400
2
310309313326
1,4601,4611 4631,464
Chi-cago
190-183183173
77777780
1,409-1,4161,4171,416
416415414
9&989191
538559-563565
4444
27343141
224222
223
' Revised.i Figures reported prior to 1936 excluded a certain amount of time balances and balances with private banks; the amount excluded on Dec. 31,.
1935, was approximately $38,000,000 at all weekly reporting member banks.« Prior to January 8, deposits standing to the credit of private banks were included by some banks in demand deposits, rather than in interbank
deposits; the amount so included on Dec. 31,1935, was approximately $80,000,000.
Digitized for FRASER http://fraser.stlouisfed.org/ Federal Reserve Bank of St. Louis
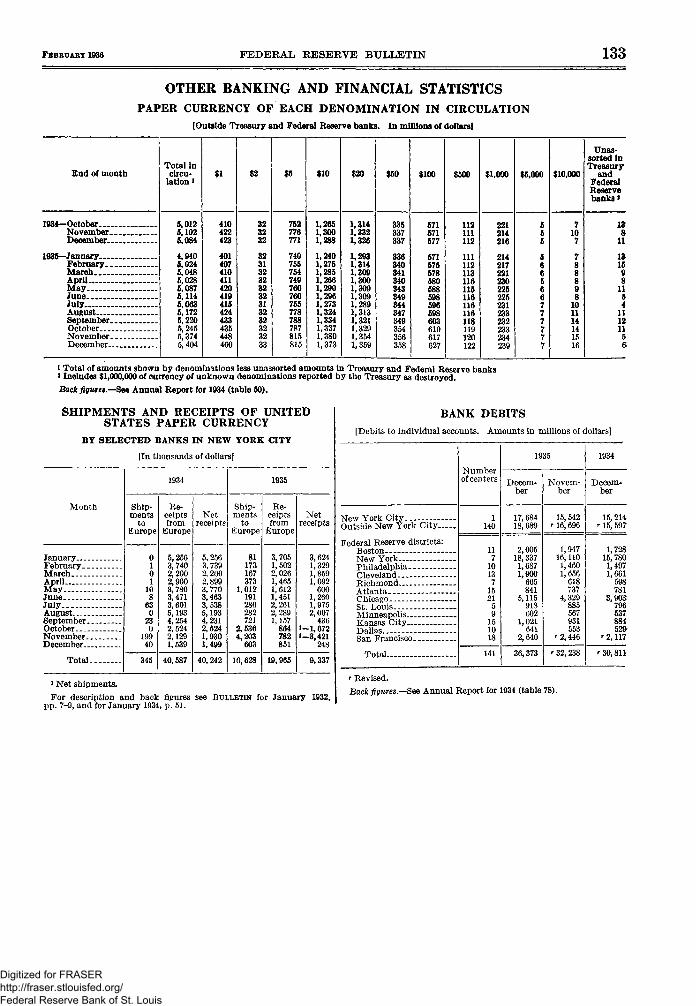
FEBRUARY 1936 FEDERAL RESERVE BULLETIN 133
OTHER BANKING AND FINANCIAL STATISTICSPAPER CURRENCY OF EACH DENOMINATION IN CIRCULATION
[Outside Treasury and Federal Reserve banks. In millions of dollars]
End of monthTotal in
circu-lation i
$1 $2 $10 $20 $50 $100 $500 $1,000 $5,000 $10,000
Unas-sorted inTreasury*
andFederalReservebanks *
W34—October-November.December.
1935—January...February..MarchAprilMayJuneJulyAugustSeptember.October...November.December.
5,0125,1025,084
4,9405,0245,0485,0285,0875,1145,0635,1725,2205,2455,3745,404
410422423
401407410411420419415424433435448460
752776771
740755754749760760755778788787815815
1,2651,3001,288
1,2401,2751,2851,2661,2901,2961,2731,3241,3341,3371,3801,373
1,3141,3321,326
1,2931,3141,3091,3001,3091,3091,2891,3131,3211,3291,3541,359
335337337
340341340343349344347349354356358
571571577
571575578580588598596598603610617627
112111112
111112113116115116116116118119120122
221214216
214217221230225225231233232233234239
13g
11
131598
1154
1112115&
i Total of amounts shown by denominations less unassorted amounts in Treasury and Federal Reserve banks* Includes $1,000,000 of currency of unknown denominations reported by the Treasury as destroyed.Back figures—Sea Annual Report for 1934 (table 50).
SHIPMENTS AND RECEIPTS OF UNITEDSTATES PAPER CURRENCY
BY SELECTED BANES IN NEW YORK CITY
[In thousands of dollars]
Month
JanuaryFebruary..MarchAprilMayJuneJulyAugustSeptember.OctoberNovember.December-
Total
1934
Ship-ments
toEurope
0101
108
630
230
19940
345
Re-ceiptsfrom
Europe
5,2563,7402,2002,9003,7803,4713,6015,1934,2542,5242,1291,539
40,587
Netreceipts
5,2563. 7392,2002,8993,7703,4633,5385,1934,2312,5241,9301,499
40,242
1935
Ship-ments
toEurope
81173167373
1,012191286282721
2,5364,203
603
10,628
Re-ceiptsfrom
Europe
3,7051,5022,0261,4651,6121,4512,2612,2891,157
804782851
19,965
Netreceipts
3,6241,3291,8591,092600
1,2601,9752,007436
»~1,6721-3,421
248
9,337
* Net shipments.
For description and back figures see BULLETIN for January 1932.pp. 7-9, and for January 1934, p. 51.
BANK DEBITS[Debits to individual accounts. Amounts in millions of dollars]
New York City
Outside New York City-
Federal Reserve districts:BostonNew YorkPhiladelphia--ClevelandRichmondAtlantaChicagoSt. Louis. , .Minneapolis.Kansas CityDallas •San Francisco
Total
Numberof centers
1140
1935
Decem-ber
17,684
2,00518,3371,6871,900
665841
5,115918602
1,021641
2,640
36,373
Novem-ber
15,542' 16, 696
1,94716,1101,4601,656
618737
4,329885567931553
' 2,446
r 32,238
' Revised.
Back figures—See Annual Report for 1934 (table 78).
1934
Decem-ber
15,214•• 15,597
1,72815,7801,4971,661
598781
3,903796537884529-
' 2,117
r 30, 811
Digitized for FRASER http://fraser.stlouisfed.org/ Federal Reserve Bank of St. Louis
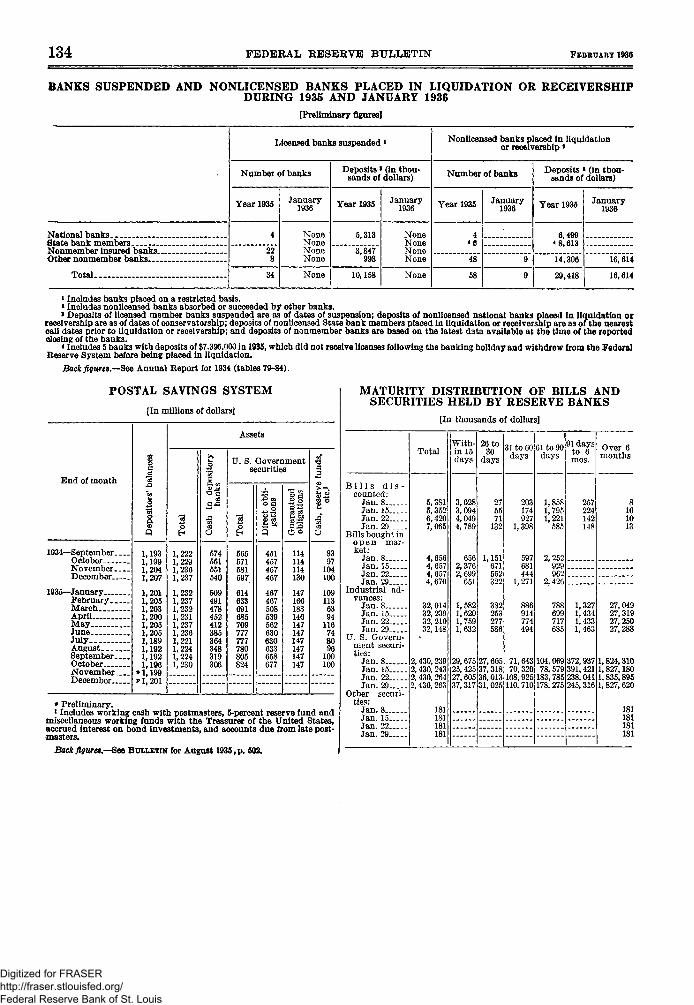
134 FEDERAL RESERVE BULLETIN FEBRUARY 1936
BANES SUSPENDED AND NONLICENSED BANES PLACED IN LIQUIDATION OR RECEIVERSHIPDURING 1935 AND JANUARY 1936
[Preliminary figures]
National banksState bank members - . -Nonmember insured banksOther noniriernber bftpfrs.
Total -
Licensed banks suspended i
Number of banks
Year 1935
4
228
34
January1936
NoneNoneNoneNone
None
Deposits * (in thou-sands of dollars)
Year 1935
5,313
3,847998
10,158
January1936
NoneNoneNoneNone
None
Nonlicensed banks placed in liquidationor receivership»
Number of banks
Year 1935
4<e
48
58
January1936
9
9
Deposits * (in thou-sands of dollars)
Year 1935
6,499« 8,613
14,306
29,418
January1936
16,614
16,614
1 Includes banks placed on a restricted basis.1 Includes nonlicensed banks absorbed or succeeded by other banks.» Deposits of licensed member banks suspended are as of dates of suspension; deposits of nonlicensed national banks placed in liquidation or
receivership are as of dates of conservator3hip; deposits of nonlicensed State bank members placed in liquidation or receivership are as of the nearestcall dates prior to liquidation or receivership; and deposits of nonmember banks are based on the latest data available at the time of the reportedclosing of the banks.
* Includes 5 banks with deposits of $7,395,000 in 1935, which did not receive licenses following the banking holiday and withdrew from the FederalReserve System before being placed in liquidation.
Back figures.—See Annual Report for 1934 (tables 79-84).
POSTAL SAVINGS SYSTEM
[In millions of dollars]
End of month
1934—SeptemberOctoberNovemberDecember
1935—JanuaryFebruaryMarchApril _MayJuneJuly____AugustSeptemberOctoberNovemberDecember
1,1931,1991,2041,207
1,2011,2051,2031,2001,2051,2051,1891,1921,1921,196
»1,1991,201
Assets
1,2221,2291,2361,237
1,2321,2371,2321,2311,2371,2361,2211,2241,2241,230
574561551540
509491478452412385364348319306
U. S. Governmentsecurities
565571581597
614
685709777777780805824
451457467467
467467508539562630630633658677
114114114130
147166183146147147147147147147
8397104100
1091136394116748096100100
v Preliminary.* Includes working cash with postmasters, 5-percent reserve fund and
miscellaneous working funds with the Treasurer of the United States,accrued interest on bond investments, and accounts due from late post-masters.
Back figuret.See BULLETIN for August 1935,p. 50&
MATURITY DISTRIBUTION OF BILLS ANDSECURITIES HELD BY RESERVE BANKS
[In thousands of dollars]
B i l l s d i s -
counted:Jan. 8Jan.15Jan. 22Jan. 29
Bills bought ino p e n mar-ket:
Jan. 8Jan.15Jan.22Jan. 29__~__
Industrial ad-vances:
Jan. 8Jan. 15Jan. 22Jan. 29
U. S. Govern-ment securi-ties:
Jan. 8Jan.15Jan. 22Jan. 29
Other securi-ties:
Jan. 8Jan. 15-_Jan. 22Jan. 29.11-
Total
5,3815,3526,4207,065
4,6564,6574,6574,670
32,01432, 23932, 21032,148
2,430, 2392,430, 2432, 430, 2642, 430,263
181181181181
With-in 15days
3,0283,0944,0494,789
6562,3762,699
651
1,5821,6201,7591,632
29,67525, 42527,60537, 317
26 to30
days
275571
132
1,151671552322
382253277586
27,60537,31836,01331, 025
31 to 60days
203174927
1,398
597681444
1, 271
886914774494
71, 64370,320
108,925110, 710
61 to 90days
1,8581,7951,221
585
2,252929962
2,426
788699717685
104,06978, 579
183, 785178,275
91 daysto 6mos.
257224142148
1,3271,4341,4331,463
372,937391,421238,041245, 316
Over 6months
8101013
27,04927,31927,25027,288
1,824,3101,827,1801,835,8951, 827,620
181181181181
Digitized for FRASER http://fraser.stlouisfed.org/ Federal Reserve Bank of St. Louis
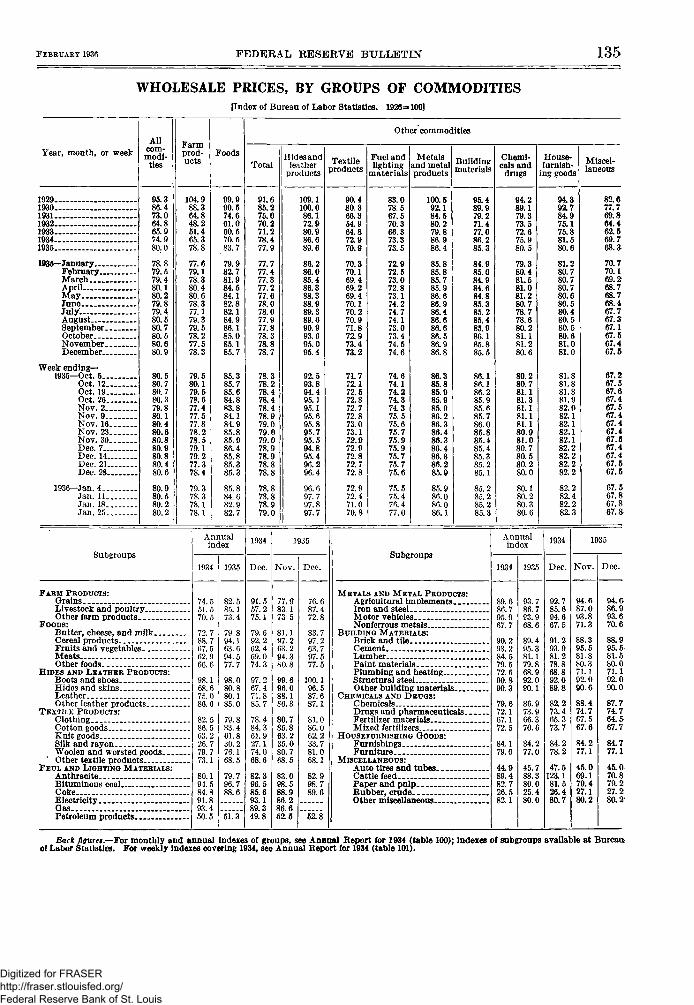
FEBRUARY 1936 FEDERAL RESERVE BULLETIN 135
WHOLESALE PRICES, BY GROUPS OF COMMODITIES[Index of Bureau of Labor Statistics. 1926=100]
Year, month, or weekAH
com-modi-
Farmprod-ucts
Foods
Other commodities
Total
91.685.275.070.271.278.477.9
77.777.477.377.277.678.078.077.977.878.378.878.7
78.378.278.478.478.478.979.079.079.078.978.978.878.8
78.878.878.979.0
Hides andleather
products
109.1100.086.172.980.986.689.6
86.286.085.486.388.388.989.389.690.993.695.095.4
92.593.894.495.195.195.695.895.795.594.895.496.296.4
96.697.797.897.7
Textileproducts
90.480.366.354.964.872.970.9
70.370.169.469.269.470.170.270.971.872.973.473.2
71.772.172.572.872.772.873.073.172.972.972.872.772.8
72.972.471.070.8
Fuel andlighting
materials
83.078.567.570.366.373.373.5
72.972.673.072.873.174.274.774.173.073.474.574.6
74.674.174.274.374.375.575.675.775.975.975.775.775.6
75.575.47fi.477.0
Metalsand metalproducts
100.592.184.580.279.886.986.4
85.885.885.785.986.686.986.486.686.686.586.986.8
86.385.885.985.985.986.286.386.486.386.486.386.285.9
85.986.086.086.1
Buildingmaterials
95.489.979.271.477.086.285.3
84.985.084.984.684.885.385.285.485.986.185.885.5
86.186.186.285.985.685.786.085.885.485.485.385.285.1
85.285.285.285.3
Chemi-cals anddrags
94.289.179.373.572.675.980.5
79.380.481.581.081.280.778.778.680.281.181.280.6
80.280.781.181.381.181.181.180.981.080.780.580.280.0
80.180.280.380.6
House-furnish-
ing goods
94.392.784.975.175.881.580.6
81.280.780.780.780.680.580.480.580.580.681.081.0
81.881.881.881.982.082.182.182.182.182.282.282.282.2
82.282.482.282.3
Miscel-laneous
1929193019311932193319341935
1035—JanuaryFebruaryMarchAprilMayJuneJuly . .AugustSeptember.OctoberNovember.December. _
Week ending—1935—Oct. 5 -
Oct. 12.Oct. 19.Oct. 26.Nov. 2.Nov. 9.Nov. 16Nov. 23Nov. 30Dec. 7__Dec. 14.Dec. 21.Dec. 28.
1936—Jan. 4 . .Jan. 11.Jan .18 .Jan. 25.
95.386.473.064.865.974.980.0
78.879.579.480.180.279.879.480.580.780.580.680.9
80.580.780.780.379.880.180.480.680.880.980.880.480.6
80.580.280.2
104.988.364.848.251.465.378.8
77.679.178.380.480.678.377.179.379.578.277.578.3
79.580.179.578.677.477.577.878.278.579.179.277.378.4
79.378.378.178.1
90.574.661.060.570.583.7
79.982.781.984.584.182.882.184.986.185.085.185.7
85.385.785.684.883.884.184.985.885.986.485.885.385.3
85.884.682.982.7
82.677.769.864.462.569.7
70.770.169.268.768.768.467.767.367.167.567.467.5
67.267.567.667.467.567.467.467.467.567.467.467.567.5
67.567.867.867.8
Subgroups
Annualindex
1934
1934 1935 Dec.
J935
Nov. Dec,
Subgroups
Annualindex
1934 1935
1934
Dec.
1935
Nov. Dec.
FARM PRODUCTS:Grains _Livestock and poultryOther farm products-.
FOODS:Butter, cheese, and milkCereal productsFruits and vegetablesMeats _Other foods
HIDES AND LEATHER PRODUCTS:Boots and shoes _Hides and skinsLeatherOther leather products
TEXTILE PRODUCTS:ClothingCotton goodsKnit goods...Silk and rayonWoolen and worsted goodsOther textile products
FEUL AND LIGHTING MATERIALS:AnthraciteBituminous coalCokeElectricityGasPetroleum products
74.551.570.5
72.788.767.562.966.6
98.168.675.086.6
82.586.563.226.779.773.1
80.194.584.891.893.450.5
82.585.173.4
94.163. 694.577.7
98.080.880.185.0
79.883.461.830.276.168.5
79.796.7
51.3
91.557.275.1
79.692.262.469.074.3
97.267.471.885.7
78.484.361.927.174.068.6
82.396.585.693.189.349.8
77.983.173 5
81.197.263.294.380.8
99.696.088.186.3
80.785.863.235.080.768.5
83098.588.986.286.652.5
76.687.472.8
83.797.263.797.577.5
100.196.587.687.1
81.086.062.233.781.068.1
82.998.789.6
52.8
METALS AND METAL PRODUCTS:Agricultural implementsIron and steel.Motor vehiclesNonferrous metals
BUILDING MATERIALS:Brick and tileCementLumberPaint materialsPlumbing and heatingStructural steelOther building materials
CHEMICALS AND DRUGS:Chemicals _Drugs and Pharmaceuticals.Fertilizer materialsMixed fertilizers
HOUSEFURNISHING GOODS:FurnishingsFurniture
MISCELLANEOUS:Auto tires and tubesCattle feedPaper and pulp _.Rubber, crudeOther miscellaneous
86.795.967.7
90.293.284.579.572.690.890.3
79.672.167.172.5
84.179.0
44.989.482.726.582.1
93.786.763.968.6
89.495.381.179.868.992.090.1
86.973.966.370.6
84.277.0
45.788.380.025.480.0
92.785.694.667.5
91.293.981.278.868.892.089.8
82.273.465.373.7
84.278.2
47.5123.181.526.480.7
94.687.093.871.3
88.395.581.880.371.192.090.6
88.474.767.567.6
84.277.1
45.069.179.427.180.2
93.670.6
95.581.580.071.192.090.0
87.774.764.567.7
84.777.1
45.070.879.227.280.2
Back figures.—For monthly and annual indexes of groups, see Annual Report for 1934 (table 100); indexes of subgroups available at Bureauof Labor Statistics. For weekly indexes covering 1934, see Annual Report for 1934 (table 101).
Digitized for FRASER http://fraser.stlouisfed.org/ Federal Reserve Bank of St. Louis
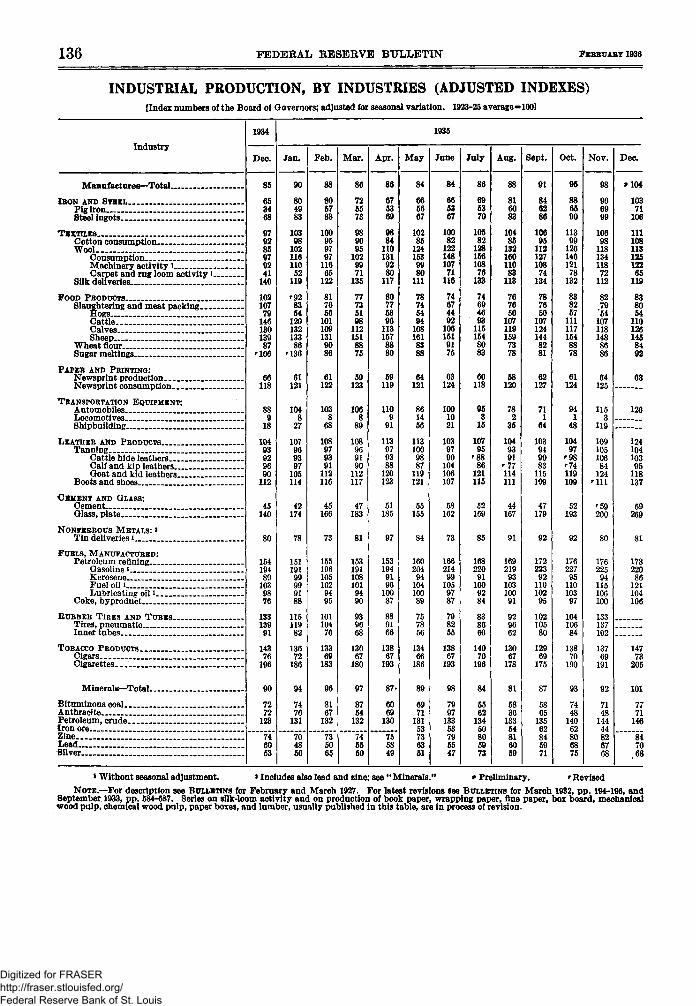
136 FEDEKAL RESEBVE BULLETIN FEBRUARY 1936
INDUSTRIAL PRODUCTION, BY INDUSTRIES (ADJUSTED INDEXES)[Index numbers of the Board of Governors; adjusted for seasonal variation. 1923-25 average -1001
Industry
Manufactures—Total
IRON AND STEELPig iron . . _ . ._Steel ingots...
TEXTILESCotton consumption . .Wool
ConsumptionMachinery activity1 . . .Carpet and rug loom activity l
Silk deliveries *.
FOOD PRODUCTS..Slaughtering and meat packing —
HogsCattle. . . . . . .CalvesSheep
Wheat flourSugar meltings . . .
PAPER AND PRINTING:Newsprint productionNewsprint consumption
TRANSPORTATION EQUIPMENT:Automobiles . .LocomotivesShipbuilding
LEATHER AND PRODUCTSTanning .
Cattle hide leathersCalf and kip leathersGoat and kid leathers
Boots and shoes
CEMENT AND GLASS:Cement . . . . . .Glass, plate.
NONFERROUS METALS: *Tin deliveries i
FUELS, MANUFACTURED:Petroleum refining- . .
Gasoline l .KeroseneFuel oil iLubricating oil 1
Coke, byproduct
RUBBER TIRES AND TUBESTires, pneumaticInner tubes ._ _
TOBACCO PRODUCTS..CigarsCigarettes- '
Minerals—Total
Bituminous coalAnthracite . . .Petroleum, crudeIron oreZincLeadSilver
1934
Dec.
85
653468
979285979241
140
102107
7914613013987
'106
66118
889
18
10493929690
112
45140
80
15419489
1039876
13313991
14376
196
90
7272
123
746053
1935
Jan.
90
804983
10398
102116110
52119
'928354
12013213386
'136
61121
1048
27
107969397
105114
42174
78
15119199999188
11511982
13672
186
94
7476
131
704850
Feb.
88
805783
100959797
11665
122
817656
1011091319086
61122
1038
68
108979391
112116
45166
73
1551961051029495
101104
76
13369
183
96
8167
132
735065
Mar.
86
725573
989095
1029971
135
77735198
1121518875
59123
1068
89
108969190
112117
47183
81
1531911081019490
939668
13067
180
97
8754
132
745550
Apr.
86
675369
9884
1101319280
117
80775896
1131578880
59119
1109
91
113979388
120123
51185
97
1531949196
10087
889166
13867
193
87-
6069
130
755849
May
84
665667
10285
1241539980
111
78745494
1081618388
64121
861456
1131009887
119121
55155
84
160204
9410410089
757856
13466
186
89
6971
13153736351
June
84
665367
10082
122148107
71116
74674492
1061519175
63124
1001021
1039790
104106107
58162
73
16621499
1059787
798255
13867
193
98
7997
13353795547
July
86
695370
10582
128156108
76133
74694693
1151548083
60118
953
15
10795
'8886
121115
52169
85
16822091
1009284
838660
14070
196
84
5562
13450805973
Aug.
88
816083
10485
132160110
83113
767650
107119159
7378
58120
782
35
1049391
'77114111
44167
91
16921993
10310091
929662
13067
178
81
5836
13354816059
Sept.
91
840286
10695
112127108
74134
787650
1071241448281
62127
711
64
103949083
115109
47179
92
172223
9211010295
10210580
12969
175
87
5865
13562845971
Oct.
95
886590
11399
126146121
78132
838257
1111171548878
61124
941
48
10497
'98'74119109
52193
92
176227
9511010397
10410684
13870
190
93
7448
14062806875
Nov.
98
966999
10698
118134118
72112
8279
'541071181488686
64125
1153
119
10910510684
124r U l
'59200
80
176225
94115106100
133137102
13769
191
92
7148
14444826768
Dec.
»104
10371
106
11110811312512265
119
838054
1101261458492
63
126
12410410395
118137
59269
81
173220
86121104106
14773
205
101
7771
146
8470
.68
* Without seasonal adjustment. i Includes also lead and zinc; see "Minerals." Preliminary. 'RevisedNOTE.—For description see BULLETINS for February and March 1927. For latest revisions see BULLETINS for March 1932, pp. 194-196, and
September 1933, pp. 584-587. Series on silk-loom activity and on production of book paper, wrapping paper, fine paper, box board, mechanicalwood pulp, chemical wood pulp, paper boxes, and lumber, usually published in this table, are in process of revision.
Digitized for FRASER http://fraser.stlouisfed.org/ Federal Reserve Bank of St. Louis
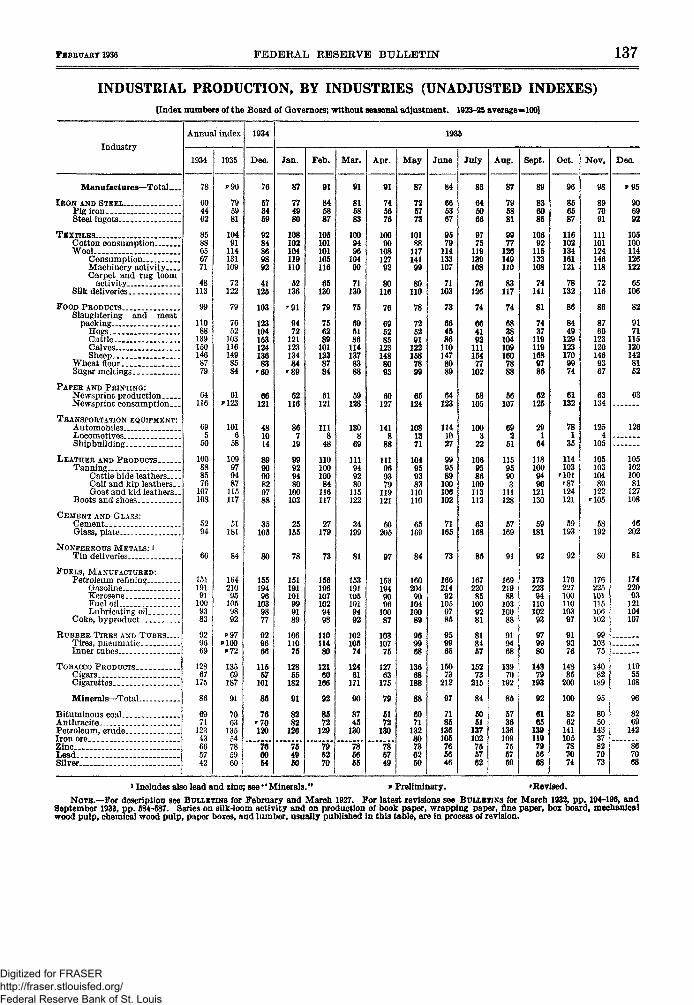
FEBRUARY 1936 FEDERAL KESERVE BULLETIN 137
INDUSTRIAL PRODUCTION, BY INDUSTRIES (UNADJUSTED INDEXES)[Index numbers of the Board of Governors; without seasonal adjustment. 1923-25 average-100]
Industry
Manufactures—Total_._
IEON AND STEEL.Pig ironSteel ingots
TEXTILESCotton consumptionWool
ConsumptionMachinery activityCarpet and rug loom
activity ._Silk deliveries
FOOD PRODUCTSSlaughtering and meat
packingHogsCattleCalvesSheep
Wheat flourSugar meltings >. >. . . .
PAPER AND PRINTING:Newsprint productionNewsprint consumption
TRANSPORTATION EQUIPMENT:AutomobilesLocomotivesShinbuildin0"
LEATHER AND PRODUCTSTanning
Cattle hide leathersCalf and kip leathers..Goat and kid leathers__
Boots and shoes
CEMENT AND GLASS:Cement .Glass, plate...
NONFERROUS METALS: [
Tin deliveries
FUELS, MANUFACTURED:Petroleum refining
Gasoline..KeroseneFuel oil.. _Lubricating oil
Coke, byproduct
RUBBER TIRES AND T U B E S . . . .Tires, pneumaticInner tubes
TOBACCO PRODUCTSCigars „ . _Cigarettes
Minerals—Total
Bituminous coalAnthracitePetroleum, crudeIron oreZincLeadSilver.. ._
Annual index
1934
78
604462
8588656771
48113
99
11088
1391501468779
64116
695
50
100888576
107108
5294
66
15119191
1009383
929669
12867
175
86
6971
12343665742
1935
795981
10491
114131109
72122
79
7652
1031161498584
61*»123
1016
58
109979487
115117
51181
84
16421095
1059892
13569
187
91
7063135
54785960
1934
Dec,
76
573459
9284869892
41125
103
12310415312413683
' 6 0
66121
481014
899090829788
35105
80
15519496
1039877
929666
11557
161
85
76'70120
706054
1935
Jan.
87
774980
108102104119110
52136
r91
9472
12112313484
'89
62116
867
19
99929480
100103
25155
78
151191101999189
10611075
12855
182
91
8282
126
754950
Feb.
91
845887
105101101105116
65130
79
756289
1011238784
61121
111g
48
11010010084
116117
27179
73
1561961071029498
11011480
12160
166
92
8572
129
795270
Mar.
91
SI5883
1009496
10499
71130
75
695186
1141378388
59128
130g
69
111949280
115122
34199
81
1531911051019492
10210574
12461
171
90
8745
130
785655
Apr .
01
745676
10090
10812792
80116
76
695285
1231488093
60127
141g
88
111969379
119121
50205
97
1531949096
10087
10310776
12763
175
79
5172
130
785749
May
87
725773
10188
11714199
80110
78
725291
122158
7899
65124
1081371
104959383
110110
65169
84
16020490
10410089
969968
13668
188
88
6071
13280736260
June
84
665387
9579
114133107
71103
73
664586
1101478089
64123
1141027
999589
100106102
71165
73
166214
921059785
959965
15073
212
97
7185
136105765646
July
83
645066
9775
119139108
76126
74
664192
111154
77102
58105
1003
22
1069586
100113113
63168
85
167220
851009281
818457
15273
215
84
5051
137102755762
Aug.
87
795881
9977
126149110
83117
74
6838
104109160
7888
56107
692
51
11595903
111128
57169
91
169219
8810310088
919468
13970
192
85
5736
136109756759
Sept.
89
836085
10692
115133108
74141
81
7437
1191191689786
62125
291
64
1181009496
121130
59181
92
17322394
11010293
979980
14379
193
92
6165
139119795668
Oct.
96
856587
116102134161121
78132
86
8449
1291231709974
61132
781
35
114103
'101'87124121
59193
92
17622710011010397
919376
14885
200
100
8262
141105787074
Nov.
98
897091
111101124146118
72116
86
8760
1231201469367
63134
1254
105
10510310480
122'105
58192
80
176225101115106102
99103
75
14082
189
95
8050
14337827073
Dec.
906992
105100114126122
65106
82
9171
1151201428152
63
126
10510210081
127108
46202
81
17422093
121104107
11955
168
96
8269
142
867068
i Includes also lead and zinc; see "Minerals." 9 Preliminary. 'Revised.NOTB.—For description see BULLETINS for February and March 1927. For latest revisions see BULLETINS for March 1932, pp. 194-196, and
September 1933, pp. 584-537. Series on silk-loom activity and on production of book paper, wrapping paper, fine paper, box board, mechanicalwood pulp, chemical wood pulp, paper boxes, and lumber, usually published in this table, are in process of revision.
Digitized for FRASER http://fraser.stlouisfed.org/ Federal Reserve Bank of St. Louis
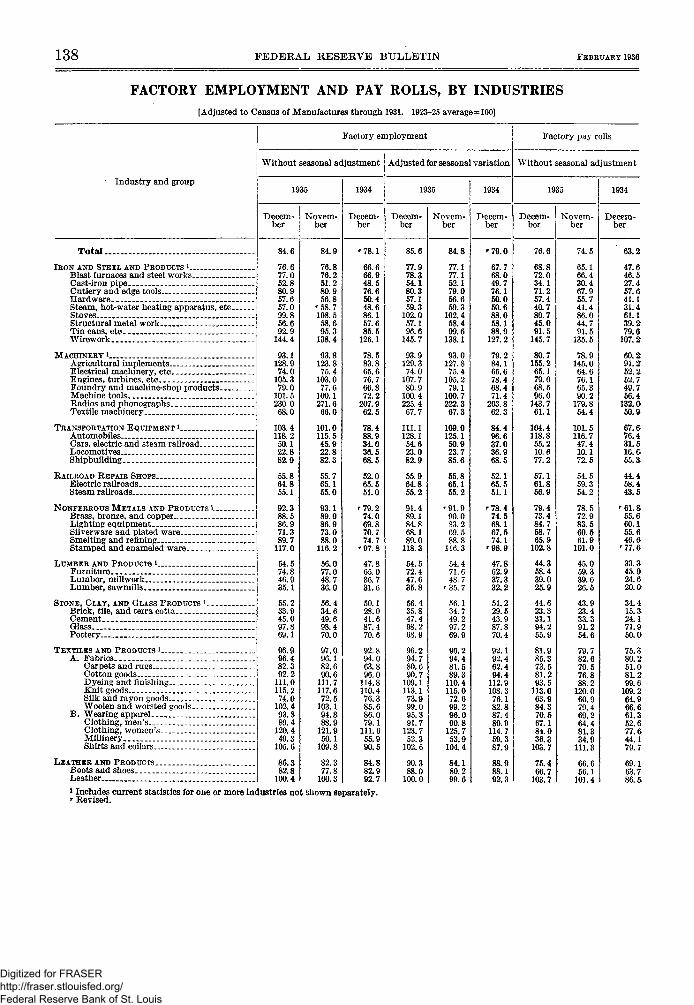
138 FEDERAL RESERVE BULLETIN FEBRUARY 1936
FACTORY EMPLOYMENT AND PAY ROLLS, BY INDUSTRIES[Adjusted to Census of Manufactures through 1931. 1923-25 average=100]
Industry and group
Factory employment
Without seasonal adjustment
1935
Decem-ber
Novem-ber
1934
Decem-ber
Adjusted for seasonal variation
1935
Decem-ber
Novem-ber
1934
Decem-ber
Factory pay rolls
Without seasonal adjustment
1935
Decem- I Novem-ber ber
1934
Decem-ber
Total.IRON AND STEEL AND PRODUCTS l
Blast furnaces and steel works. _Cast-iron pipe ___ ._.Cutlery and edge tools _HardwareSteam, hot-water heating apparatus, etcStovesStructural metal work.Tin cans, etc__Wirework _
MACHINERYIAgricultural implementsElectrical machinery, etc _—Engines, turbines, etcFoundry and machine-shop products-Machine toolsRadios and phonographsTextile machinery _
TRANSPORTATION EQUIPMENT 1Automobiles _Cars, electric and steam railroad..LocomotivesShipbuilding _
RAILROAD REPAIR SHOPS..Electric railroadsSteam railroads
NONFERROUS METALS AND PRODUCTS »..Brass, bronze, and copperLighting equipmentSilverware and plated ware.Smelting and refiningStamped and enameled ware
LUMBER AND PRODUCTS »_.FurnitureLumber, mill workLumber, sawmills
STONE, CLAY, AND GLASS PRODUCTS I .Brick, tile, and terra cotta__CementGlass..Pottery.
TEXTILES AND PRODUCTS 1A. Fabrics
Carpets and rugsCotton goods __Dyeing and finishingKnit goods __ _.Silk and rayon goodsWoolen and worsted goods.
B. Wearing apparelClothing, men's.__Clothing, women's...Millinery _.Shirts and collars
LEATHER AND PRODUCTS.Boots and shoesLeather
84.6
76.677.052.880.957.657.099.856.692.9
144.4
93.1128.974.0
105.379.0
101. 5230.068.0
103.4118.250.122.882.9
55.864.855.1
92.388.586.971.389.7
117.0
54.574.846.935.1
55.233.945.097.869.1
96.996.482.392.2
111.0115.274.0
102.493.889.4
120.449.3
105.6
86.382.8
100.4
84.9
76.876.251.280.956.8
'58.7108.558.695.3
138.4
93.8123.875.4
103.077.6
100.1271.666.0
101.0115.545.922.882.3
55.765.155.0
93.189.086.973.088.0
116.2
56.077.048.736.0
56.434.649.698.470.0
97.096.182.690.6
111.7117.672.5
103.194.888.9
121.950.1
109.8
82.377.8
100.3
'78.1
66.666.948.576.650.448.686.157.685.5
126.1
78.583.865.676.766.872.2
207.962.5
78.488.934.036.568.5
52.065.551.0
'79.274.069.870.774.7
'97.8
47.865.036.731.6
50.128.041.687.470.6
92.894.063.896.0
114.8110.476.385.686.079.1
111.655.990.5
84.882.992.7
85.6
77.978.354.180.357.159.3
102.057.196.6
145.7
93.9129.374.0
107.780.9
100.4225.467.7
111.1128.154.623.082.9
55.964.855.2
91.489.184.868.189.0
118.3
54.572.447.635.8
56.435.847.498.268.9
96.294.780.690.7
109.1113.173.999.095.391.7
123.752.3
102.6
90.388.0
100.0
84.8
77.177.152.179.056.659.3
102.458.499.6
138.1
93.0127.875.4
105.279.1
100.7222.367.3
109.0125.150.923.785.6
55.865.155.2
'91.990.083.269.588.8
116.3
54.471.648.7
'35.7
56.134.749.297.269.9
96.294.481.589.3
110.4115.072.699.296.090.8
125.753.9
104.4
84.180.299.6
'79.0
67.768.049.776.150.050.688.058.188.9
127.2
79.284.165.678.468.471.4
203.862.3
84.496.637.036.968.5
52.165.551.1
'78.474.568.167.574.1
47.862.937.332.2
51.229.543.987.870.4
92.192.462.494.4
112.9108.376.182.887.480.9
114.759.387.9
88.988.192.3
76.6
68.872.034.171.257.440.780.745.091.5
145.7
80.7155.265.179.068.596.0
143.761.1
104.4118.855.210.677.2
57.161.856.9
79.473.484.758.765.9
102.8
44.368.439.025.9
44.623.331.194.255.9
81.985.373.581.293.5
113.063.984.370.567.184.036.3
103.7
75.466.7
103.7
74.5
65.166.430.467.955.741.486.044.791.5
135.5
78.9145.064.676.165.390.2
179.854.4
101.5116.747.410.172.5
54.559.354.2
78.572.983.560.561.9
101.0
45.059.339.626.5
43.923.433.391.254.6
79.782.670.576.888.2
120.060.979.469.264.481.334.9
111.3
66.656.1
101.4
63.2
47.646.527.457.641.131.461.139.279.6
107.2
60.291.252.252.749.756.4
132.050.9
67. G76.431.516.655. a
44.458.443.5
' 6 1 . 855.660.155.646. &
'77.6
33.345.924.620.0
34.415. a24.171.950.0
75.380.251.081.299.6
109.264.966.661.352.677.644.179.7
69.163.786.5
1 Includes current statistics for one or more industries not shown separately.r Revised.
Digitized for FRASER http://fraser.stlouisfed.org/ Federal Reserve Bank of St. Louis
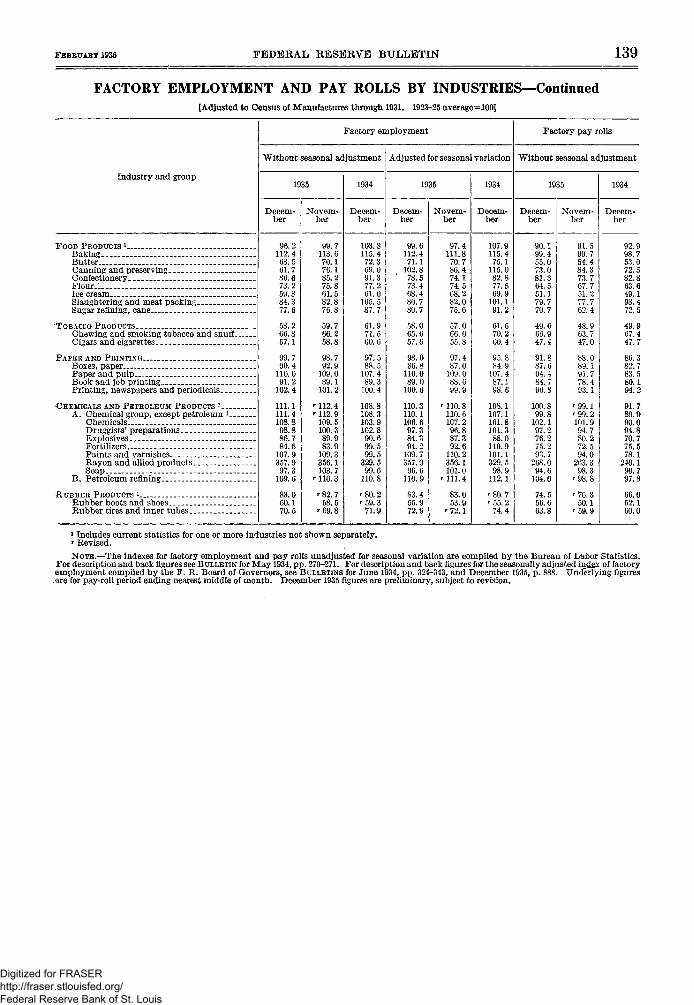
FlBBUAB? 1936 FEDERAL RESERVE BULLETIN 139
FACTORY EMPLOYMENT AND PAY ROLLS BY INDUSTRIES—Continued[Adjusted to Census of Manufactures through 1931. 1923-25 average=100]
Industry and group
FOOD PRODUCTS 1 . _ . . _ _BakingButter . . .Canning and preservingConfectionery _Flour %
Ice cream.. _ __ .Slaughtering and meat packing _.Sugar refining, cane
TOBACCO PRODUCTSChewing and smoking tobacco and snuffCigars and cigarettes _ . _
PAPER AND PRINTING. . .Boxes, paperPaper and pulpBook and job printing ._Printing, newspapers and periodicals
CHEMICALS AND PETROLEUM PRODUCTS 1
A. Chemical group, except petroleum *ChemicalsDruggists' preparationsExplosives _ _ _ __FertilizersPaints and varnishesRayon and allied productsSoap
B. Petroleum refining
R U B B E R PRODUCTS l
Rubber boots and shoesRubber tires and inner tubes
Factory employment
Without seasonal adjustment
1935
Decem-ber
96.2112.468.561.786.673.259.884.377.6
58.266.857.1
99.790.4
110.091.2
102.4
111.1111.4108.898.886.784.5
107.9357.9
97.3109.6
83.060.170.5
Novem-ber
99.7113.670.176.185.275.861.582.876.8
59.766.258.8
98.792.9
109.089.1
101.2
' 112.4' 112. 9
109.5100.389.983.9
109.3356.1103.7
' 110.3
'82.758.5
'69.8
1934
Decem-ber
103.8115.472.369.091.377.261.0
105.587.7
61.971.560.6
97.588.5
107.489.3
100.4
108.8108.3103.9102.890. 699.599.5
329.599.6
110.8
'80.2'59.3
71.9
Adjusted for seasonal variation
1935
Decem-ber
99.6112.471.1
102.8' 78.5
73.468.480.780.7
58.065.657.0
98.086.8
110.089.0
100.6
110.3110.1106. 697.384.394.2
109.7357.9
96.6110.9
83.455.972.9
Novem-ber
97.4111.8
70.786.474.174.568.282.075.6
57.066.055.8
97.487 0
109.088.699.9
' 110.8110. 6107.296.887.392.6
110.2356.1101.0
'111.4
83.053.9
'72.1
1934
Decem-ber
107.9115.4
75.1115.082.877.569.9
101.191.2
61.670.260.4
95.884 9
107.487.198.6
108.1107.1101.8101.388.0
110.9101.1329. 5
98.9112.1
'80 7'55.2
74.4
Factory pay rolls
Without seasonal adjustment
1935
Decem-ber
90.199.455.073.081.364.551.179.770.7
49. 666.947.4
91.887.694.484.796.8
100.899.8
102.197.276.275.293.7
268.094.6
104.0
74.556.663.8
Novem-ber
91.599 754.484.373.767.751.277.762.4
48.963.747.0
88.089 191.778.493.1
'99.1'99.2101.994.780. 272.594.0
263.398.3
'98.8
' 70.350.1
'59.9
1934
Decem-ber
92.998 753.072.582.863.649.198.472.5
49.967.447.7
86.382 783.580.194.2
91.789.990.094.870.775.578.1
240.190.797.8
66.052.160.0
1 Includes current statistics for one or more industries not shown separately.' Revised.
NOTE.—The indexes for factory employment and pay rolls unadjusted for seasonal variation are compiled by the Bureau of Labor Statistics.For description and back figures see BULLETIN for May 1934, pp. 270-271. For description and back figures for the seasonally adjusted indjsx of factoryemployment compiled by the F. R. Board of Governors, see BULLETINS for June 1934, pp. 324-343, and December 1935, p. 888. Underlying figuresare for pay-roll period ending nearest middle of month. December 1935 figures are preliminary, subject to revision.
Digitized for FRASER http://fraser.stlouisfed.org/ Federal Reserve Bank of St. Louis
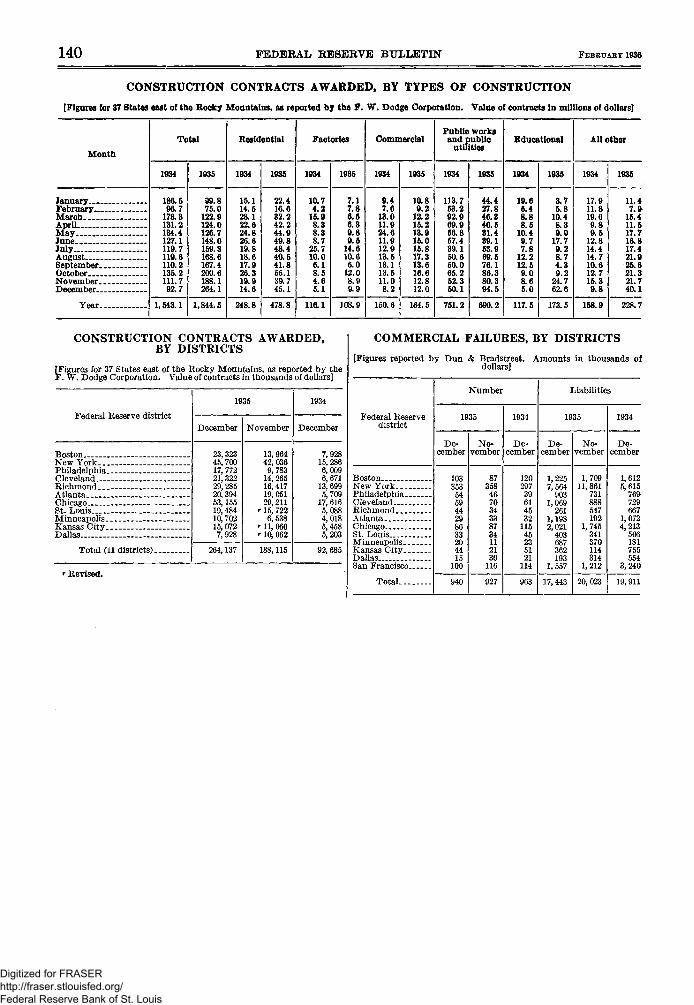
140 FEDERAL RESERVE BULLETIN FEBRUARY 1935
CONSTRUCTION CONTRACTS AWARDED, BY TYPES OF CONSTRUCTION
[Figures for 37 States east of the Rocky Mountains, as reported by the F. W. Dodge Corporation. Value of contracts in millions of dollars]
Month
January.....February. - -March .AprilMayJunoJulyAugustSeptemberOctoberNovember
Year
Total
1934
186.596.7
178.3131.2134.4127.1119.7119.6110.2135.2111.792.7
1,543.1
1935
99.875.0
122.9124.0126.7148.0159.3168.6167.4200.6188.1264.1
1,844.5
Residential
1934
15.114.528.122.624.826.619.818.617.926.319.914.6
248.8
1935
22.416.632.242.244.949.848.440.541.855.139.745.1
478.8
Factories
1934
10.74.2
15.98.38.38.7
25.710.06.18.54.65.1
116.1
1935
7.17.86.56.39.89.5
14.610.66.0
12.08.99.9
108.9
Commercial
1934
9.47.6
13.011.924.611.912.913.513.113.511.08.2
150.6
1935
10.89.2
12.215.213.916.015.817.313.616.612.812.0
164.5
Public worksand public
utilities
1934
113.763.292.969.956.857.439.150.650.065.252.350.1
751.2
1935
44.427.846.340.531.439.163.969.576.186.380.394.5
690.2
Educational
1934
19.65.48.88.5
10.49.77.8
12.212.59.08.65.0
117.5
1935
3.75.8
10.48.39.0
17.79.28.74.39.2
24.762.6
173.5
All other
1934
17.911.819.69.89.5
12.814.414.710.612.715.39.8
158.9
1935
11.47.9
15.411.517.716.817.421.925.621.321.740.1
228.7
CONSTRUCTION CONTRACTS AWARDED,BY DISTRICTS
[Figures for 37 States east of the Rocky Mountains, as reported by theF. \V. Dodge Corporation. Value of contracts in thousands of dollars]
Federal Reserve district
BostonNew York.PhiladelphiaClevelandRichmondAtlanta -Chicago _St. Louis__MinneapolisKansas CityDallas _
Total (11 districts)
' Revised.
1935
December November
23, 32345,70017, 77221, 32229, 28520, 39453,15519,48410, 70215, 0727,928
264,137
13, 96442, 0369,783
14,26516,41719, 05129, 211
' 15, 7226,538
' 11, 066r 10, 062
188,115
1934
December
7,92815,2866,0096,67113, 6995,70917, 6165,0884,0185,4585,203
92, 685
COMMERCIAL FAILURES, BY DISTRICTS
[Figures reported by Dun & Bradstreet. Amounts in thousands ofdollars]
Federal Reservedistrict
BostonNew YorkPhiladelphiaCleveland . .RichmondAtlanta _ _ __ChicagoSt. LouisMinneapolisKansas CityDallas . __ _San Francisco
Total
Number
1935
De-cember
103353545944298633204415
100
940
No-vember
87358467034338734112130
116
927
1934
De-cember
12029739614532
11545235121
114
963
Liabilities
1935
De-cember
1 2257,564
9031,069
2611,1982,021
403687362193
1,557
17,443
No-vember
1,70911,861
731888547192
1,745341370114314
1,212
20, 023
1934
De-cember
1,6125,615
769729667
1,0724,213
506181755554
3,240
19,911
Digitized for FRASER http://fraser.stlouisfed.org/ Federal Reserve Bank of St. Louis
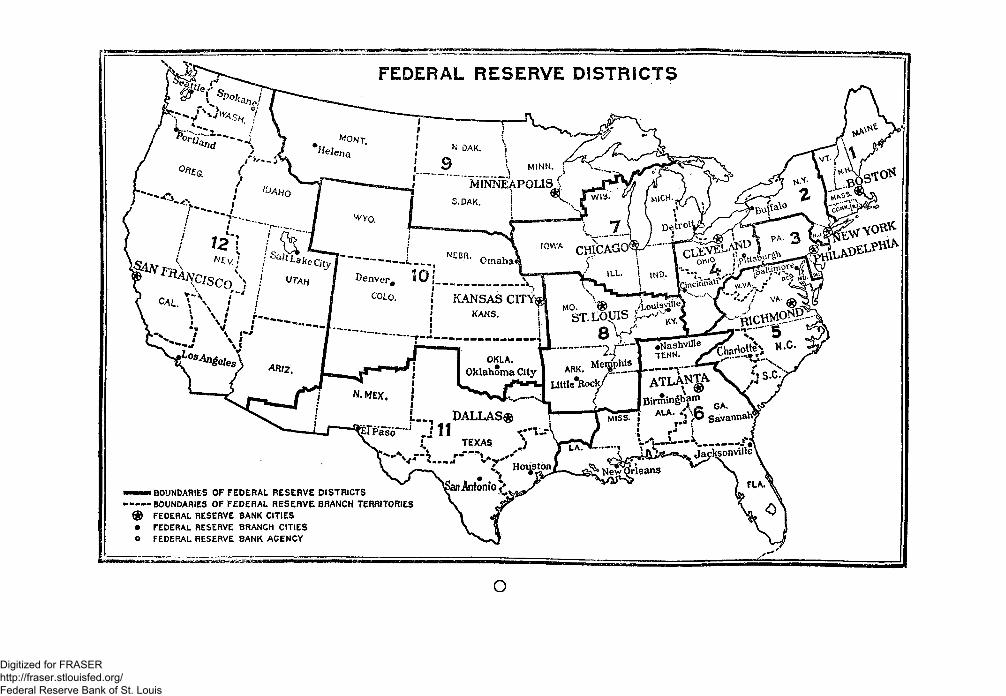
FEDERAL RESERVE DISTRICTS
"MINNEAPOLISJ
— BOUNDARIES OF FEDERAL RESERVE DISTRICTS-—BOUNDARIES OF FEDERAL RESERVE. BRANCH TERRITORIES
FEDERAL RESERVE BANK CITIES• FEDERAL RESERVE BRANCH CITIESO FEDERAL RESERVE BANK AGENCY
O
Digitized for FRASER http://fraser.stlouisfed.org/ Federal Reserve Bank of St. Louis