federal reserve
TRANSCRIPT

RENAULT GROUP
Goldman Sachs – Annual Global Automotive Conference

DECEMBER 2015 2INVESTOR RELATIONSRENAULT PRESENTATION
Information contained within this document may contain forward looking statements. Although
the Company considers that such information and statements are based on reasonable
assumptions taken on the date of this report, due to their nature, they can be risky and uncertain
(as described in the Renault documentation registered within the French financial markets
regulation authorities) and can lead to a difference between the exact figures and those given or
deduced from said information and statements.
Renault does not undertake to provide updates or revisions, should any new statements and
information be available, should any new specific events occur or for any other reason. Renault
makes no representation, declaration or warranty as regards the accuracy, sufficiency,
adequacy, effectiveness and genuineness of any statements and information contained in this
report.
Further information on Renault can be found on Renault’s website (www.group.renault.com),
in the section Finance / Regulated Information.
DISCLAIMER

DECEMBER 2015 3INVESTOR RELATIONSRENAULT PRESENTATION
2015 OUTLOOK
� The European car market should grow 8% this year, with a French market up 5%. Our main emerging markets should remain adverse and volatile in the fourth quarter.
� Within this context, Renault confirms its guidance:
-increase registrations and Group revenues (at constant exchange rates),
-improve Group operating profit and that of the Automotive division,
-achieve positive Automotive operational free cash flow.

DECEMBER 2015 4INVESTOR RELATIONSRENAULT PRESENTATION
KEY TAKE-AWAYS FROM Q3 RESULTS
� RECOVERY IN EUROPE GAINS TRACTION
� EMERGING MARKETS AND CURRENCIES STILL ADVERSE & VOLATILE
� SUCCESS OF OUR NEW PRODUCTS WITH POSITIVE MIX IMPACT
� STILL STRONG CONTRIBUTION OF SALES TO PARTNERS
� FY GUIDANCE CONFIRMED

DECEMBER 2015 5INVESTOR RELATIONSRENAULT PRESENTATION
RISKS & OPPORTUNITIES FOR THE SECOND HALF
� REGULATORY COST PRESSURE
� EMERGING MARKETS
� SUPPLY CHAIN
� NEW PRODUCTS
� EUROPEAN MARKET MOMENTUM

DECEMBER 2015 6INVESTOR RELATIONSRENAULT PRESENTATION
YTD 2015 COMMERCIAL UPDATE
01

DECEMBER 2015 7INVESTOR RELATIONSRENAULT PRESENTATION
613
318
88 75102
30
621
339
87 72 9727
Q3'14 Q3'15 Q3'14 Q3'15 Q3'14 Q3'15 Q3'14 Q3'15 Q3'14 Q3'15 Q3'14 Q3'15
RENAULT GROUP UNIT REGISTRATIONS Q3 2015 VS Q3 2014
GLOBAL
+1.2%
EUROPE
+6.5%
AMERICAS
-5.3%
ASIA-PACIFIC
-11.2%
AFRICA-ME-INDIA
-4.8%
EURASIA
-1.2%
K units
(PC+LCV)
WORLD MARKET SHARE: 3.01% (+0.04 pts)
-0.2% TIV +9.8% -13.9% -6.6% -12.5% -2.3%
GROUP

DECEMBER 2015 8INVESTOR RELATIONSRENAULT PRESENTATION
1,979
1,094
265 225308
87
1,998
1,188
246 223 26180
09'14 09'15 09'14 09'15 09'14 09'15 09'14 09'15 09'14 09'15 09'14 09'15
RENAULT GROUP UNIT REGISTRATIONS SEPT 2015 (YTD) VS SEPT 2014 (YTD)
GLOBAL
+0.9%
EUROPE
+8.5%
AMERICAS
-15.3%
ASIA-PACIFIC
-7.5%
AFRICA-ME-INDIA
-1.0%
EURASIA
-7.2%
K units
(PC+LCV) WORLD MARKET SHARE: 3.12% (=)
+0.7% TIV +9.0% -18.4% -0.6% -11.1% -0.5%
GROUP

DECEMBER 2015 9INVESTOR RELATIONSRENAULT PRESENTATION
FRANCE01
BRAZIL02
03
ITALY
TURKEY04
SOUTH KOREA
05
06
07
08
09
SPAIN
10
24.4%
4.7%
7.4%
17.1%
GERMANY
8.1%
12.9%
ARGENTINA 14.6%
4.5%
RUSSIA 7.4%
M/S
(PC+LCV)
EUROPE KEEPS PUSHING SALES MOMENTUM – Q3 2015
-1.4 pts
+0.5 pts
+2.6 pts
-1.0 pts
VS.
Q3 2014
UK 4.3%
+1.1 pts
-0.2 pts
-0.5 pts
+0.3 pts
-1.0 pts
+0.2 pts
REGIONAL SALES BREAKDOWN
36% 42%48%
55% 52%48%
Q3 2010 Q3 2011 Q3 2012 Q3 2013 Q3 2014 Q3 2015
42% 48% 52% 48% 45%55%
58% 52% 45% 48% 52% 55%
INTERNATIONALEUROPE

DECEMBER 2015 10INVESTOR RELATIONSRENAULT PRESENTATION
EUROPE REGION – GROUP ORDER BOOK PC+LCV
sept.-07 sept.-08 sept.-09 sept.-10 sept.-11 sept.-12 sep t.-13 sept.-14 sept.-15

DECEMBER 2015 11INVESTOR RELATIONSRENAULT PRESENTATION
Q3 2015 REVENUES
02

DECEMBER 2015 12INVESTOR RELATIONSRENAULT PRESENTATION
RENAULT GROUP REVENUES BY DIVISION IN Q3 2015
In million euros Q3 2015 Change (%)Q3 2014
Automotive
Sales Financing
TOTAL
8,802
534
9,336
+10.2%
-2.2%
+9.4%
7,984
546
8,530

DECEMBER 2015 13INVESTOR RELATIONSRENAULT PRESENTATION
RENAULT GROUP REVENUES BY DIVISION 2015 9 months
In million euros
2015YTD
Change(%)
2014YTD
Automotive
Sales Financing
TOTAL
29,867
1,666
31,533
+11.8%
+2.4%
+11.2%
26,723
1,627
28,350

DECEMBER 2015 14INVESTOR RELATIONSRENAULT PRESENTATION
AUTOMOTIVE REVENUE VARIANCE ANALYSIS
7,984
8,802
-173
+45 -45+184
+178
+413+216
Currency
Volume
Geographicmix
Product mix
Price
Sales to partners Others
+10.2%
-2.2 pts+0.6 pts -0.6 pts +2.3 pts +2.3 pts +5.2 pts +2.6 pts
In million euros CHANGE Q3 2015 / Q3 2014 : +€818m
Q3 2014 Q3 2015

DECEMBER 2015 15INVESTOR RELATIONSRENAULT PRESENTATION
AUTOMOTIVE REVENUE VARIANCE ANALYSIS
26,723
29,867
+52
+660 -91+329
+486+1,525
+183
Currency
Volume
Geographicmix
Product mix
Price
Sales to partners Others
+11.8%
+0.2 pts+2.5 pts -0.3 pts +1.2 pts +1.8 pts +5.7 pts +0.7 pts
In million euros CHANGE 2015 / 2014 : +€3,144m
Q3 2014YTD
Q3 2015YTD

DECEMBER 2015 16INVESTOR RELATIONSRENAULT PRESENTATION
DISTRIBUTION STOCK
NEW VEHICLE DISTRIBUTION STOCK (IN K UNITS)
503 488 527 495 493 459 515 510 503
243
100
255
158253
106
251177
260260
388
272337
240
353
264
333
243
SEP'13 DEC'13 MAR'14 JUN'14 SEP'14 DEC'14 MAR'15 JUN'15 SEP '15
GROUP
INDEPENDENTDEALERS
TOTAL
Number of days of sales
(previous period)
75 7663 62 74 57 74 64 75

DECEMBER 2015 17INVESTOR RELATIONSRENAULT PRESENTATION
RCI BANQUE PERFORMANCE
Q3 2015 Change (%)Q3 2014
Revenues (in € m)
Average loans outstanding
(in € bn)
New contracts (in thousand units)
New financing(in € bn)
534
28.8
348
3.8
546
25.6
302
3.2
-2.2%
+12.8%
+15.2%
+21.9%

DECEMBER 2015 18INVESTOR RELATIONSRENAULT PRESENTATION
RCI BANQUE PERFORMANCE YTD
Q3 2015YTD
Change(%)
Q3 2014YTD
Revenues (in € m)
Average loans outstanding
(in € bn)
New contracts (in thousand units)
New financing(in € bn)
1,666
27.9
1,034
11.6
1,627
25.1
902
9.2
+2.4%
+10.9%
+14.7%
+26.7%

DECEMBER 2015 19INVESTOR RELATIONSRENAULT PRESENTATION
H1 2015 FINANCIAL RESULTS
03

DECEMBER 2015 20INVESTOR RELATIONSRENAULT PRESENTATION
H1 2014 H1 2015 CHANGE
Global registrations (units) 1,365,988 1,376,356 +0.8%
Group revenues 19,820 22,197 +12.0%
of which: Automotive 18,739 21,065 +12.4%
Sales financing 1,081 1,132 +4.7%
Q1 Q2
+13.7% +10.8%
H1 2015 GROUP REVENUES
(million euros)

DECEMBER 2015 21INVESTOR RELATIONSRENAULT PRESENTATION
AUTOMOTIVE REVENUES VARIANCE ANALYSIS
18,739
21,065
+615 -46
+145+308
+1,112
+225
-33
Currency
Volume
Geographic
mix
Product mix
Sales to
partners
Others
+12.4%
+3.3pts -0.2pts +0.8pts +1.6pts +1.2pts -0.2pts
Price
+5.9pts
CHANGE H1 2015 / H1 2014: +€2,326m
H1 2014 H1 2015
(million euros)

DECEMBER 2015 22INVESTOR RELATIONSRENAULT PRESENTATION
729
1,069
+236 -17
+28
-283 +263
+1
+112
GROUP OPERATING MARGIN VARIANCE ANALYSIS
Currency
Volume &
partners
Mix / Net Enrichment
G&A
RCI &
Other
activities
COST REDUCTION
+€219m
H1 2014 H1 2015(million euros)
CHANGE H1 2015 / H1 2014: +€340m
Monozukuri
Raw materials
GROWTH
+€264m

DECEMBER 2015 23INVESTOR RELATIONSRENAULT PRESENTATION
DISTRIBUTION STOCK
NEW VEHICLE DISTRIBUTION STOCK (IN K UNITS)
445 481 507 503 488 527 495 493 459 515 510
131
241140
243
100
255
158
253
106
251177
314240
367
260
388
272337
240
353264
333
DEC'12 MAR'13 JUN'13 SEP'13 DEC'13 MAR'14 JUN'14 SEP'14 DEC '14 MAR'15 JUN'15
GROUP
INDEPENDENTDEALERS
TOTAL
Number of days of sales
(previous period)
65 6772 75 7663 62 74 57 74 64

DECEMBER 2015 24INVESTOR RELATIONSRENAULT PRESENTATION
-369
+267
-591
-118
AUTOMOTIVE NET CASH POSITION
Operational
free cash flow
Cash flow
+1,727
Change
in WCR
Dividends
paid
Net tangible
& intangible
investments
- 1,453 Net cash
decrease
Dividends
received
from
listed co.
-123
Leased
Vehicles
-431
Capitalized
R&D
Financial
investments
& others
-899
Net capex
DEC. 31, 2014: €2,104m
JUNE 30, 2015: €1,567m
-95
-537
(million euros)

DECEMBER 2015 25INVESTOR RELATIONSRENAULT PRESENTATION
H1 2014 H1 2015 CHANGE
Revenues 19,820 22,197 +12.0%
Operating margin +729 +1,069 +340
in % of revenues +3.7% +4.8% +1.1 pts
Other operating income & expenses -265 -116 +149
EBIT +464 +953 +489
Net financial income & expenses -124 -161 -37
Associated companies +725 +912 +187
Current & deferred taxes -264 -235 +29
Net income +801 +1,469 +668
(million euros)
H1 2015 FINANCIAL RESULTS

DECEMBER 2015 26INVESTOR RELATIONSRENAULT PRESENTATION
OPERATING MARGIN BY ACTIVITY
H1 2014 H1 2015 CHANGE
AUTOMOTIVE +348 +656 +308
% Automotive revenues +1.9% +3.1% +1.3 pts
SALES FINANCING +381 +413 +32
GROUP OPERATING MARGIN +729 +1,069 +340
% Group revenues +3.7% +4.8% +1.1 pts
(million euros)

DECEMBER 2015 27INVESTOR RELATIONSRENAULT PRESENTATION
RCI BANQUE
in % of average loans outstandingH1 2014 H1 2015
New financings (€bn) 6.0 7.7
Average performing loans outstanding (€bn) 24.8 27.6
Net banking income* 5.14% 4.93%
Cost of risk* (customer & dealer) -0.47% -0.31%
Operating expenses* -1.58% -1.54%
Pretax income* 2.92% 3.08%
(* in percentage of average performing loans outstanding)
DECEMBER 2015 28INVESTOR RELATIONSRENAULT PRESENTATION
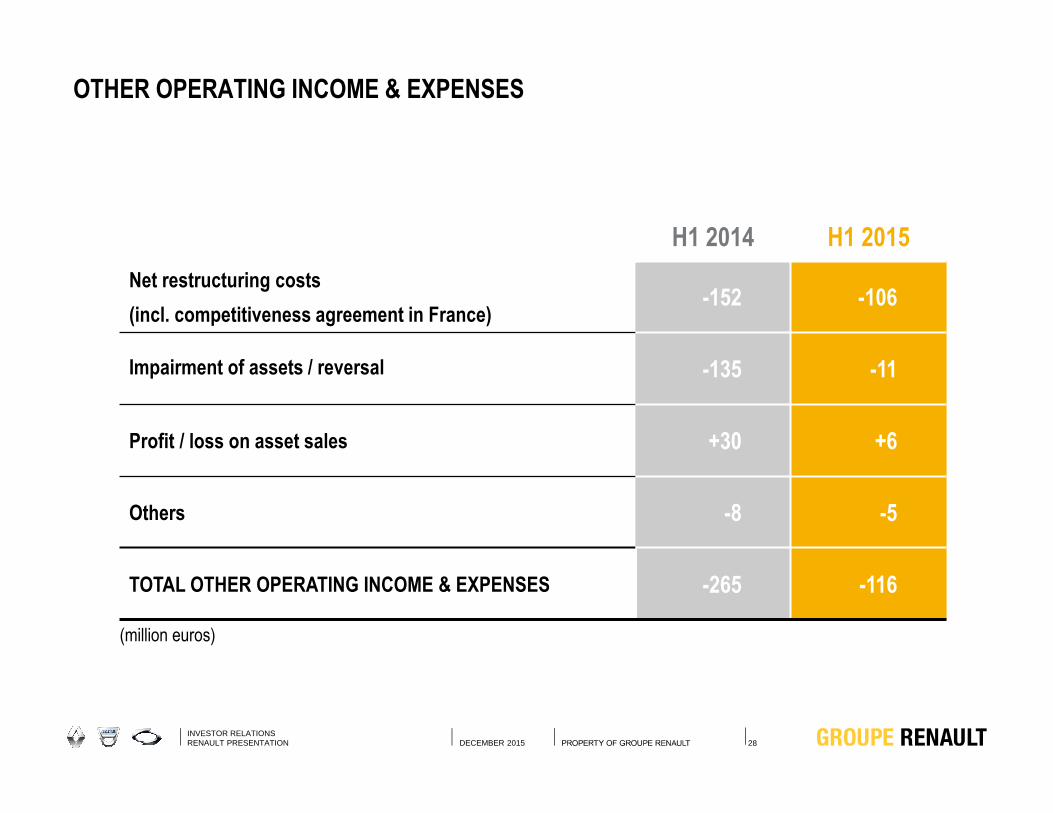
OTHER OPERATING INCOME & EXPENSES
H1 2014 H1 2015
Net restructuring costs
(incl. competitiveness agreement in France)-152 -106
Impairment of assets / reversal -135 -11
Profit / loss on asset sales +30 +6
Others -8 -5
TOTAL OTHER OPERATING INCOME & EXPENSES -265 -116
(million euros)

DECEMBER 2015 29INVESTOR RELATIONSRENAULT PRESENTATION
ASSOCIATED COMPANIES
H1 2014 H1 2015 CHANGE
Nissan +789 +979 +190
AVTOVAZ (1) -55 -70 -15
Others -9 +3 +12
TOTAL ASSOCIATED COMPANIES +725 +912 +187
(1) AVTOVAZ is consolidated with a 3-month time lag
Q1 Q2
494 485
(million euros)

DECEMBER 2015 30INVESTOR RELATIONSRENAULT PRESENTATION
LIQUIDITY RESERVES
Cash = €11.6bn
Available credit lines = €3.2bn
TOTAL = €14.8bn
LIQUIDITY RESERVES
Cash = €10.2bn
Available credit lines = € 3.3bn
TOTAL = €13.5bn
AUTOMOTIVE DIVISION LIQUIDITY
DECEMBER 2014 JUNE 2015

DECEMBER 2015 31INVESTOR RELATIONSRENAULT PRESENTATION
RCI LIQUIDITY*
LIQUIDITY RESERVES
Cash = €0.1bn
HQLA = €0.9bn
ECB eligible = €1.9bn
Available credit lines = €4.0bn
TOTAL = €6.9bn
LIQUIDITY RESERVES
Cash = €0.1bn
HQLA = €0.8bn
ECB eligible = €1.8bn
Available credit lines = €4.1bn
TOTAL = €6.8bn
DECEMBER 2014 JUNE 2015
*Central funding perimeter

DECEMBER 2015 32INVESTOR RELATIONSRENAULT PRESENTATION
RCI BANQUE RETAIL DEPOSIT ACTIVITY
Dec. 2014 June 2015
DEPOSITS 6.5 7.0
o/w GERMANY 4.4 5.1
o/w FRANCE 1.8 1.4
o/w AUSTRIA 0.4 0.5
o/w UNITED KINGDOM N/A 0.04
• 2016 TARGET: 30% OF RCI BANQUE OUTSTANDINGS
(billion euros)

DECEMBER 2015 33INVESTOR RELATIONSRENAULT PRESENTATION
DRIVE THE CHANGE
How to get to our targets
03

DECEMBER 2015 34INVESTOR RELATIONSRENAULT PRESENTATION
Kadjar
2015
RENEWING OUR RANGE
OUR MAIN REVENUES OPPORTUNITIES
New Espace C-hatchD-sedan C-MPV
Pick-up 1TPick-up 0,5T
D-crossoverCaptur
2015
2015
2015
2015
New Twingo
A-entry
2014
2014
LCV international roll out
Full cross-over line up for all our markets
A-entry vehicles for emerging countries
New Twingo for Europe
C & D complete renewal

DECEMBER 2015 35INVESTOR RELATIONSRENAULT PRESENTATION
A NEW STEP TOWARDS OUR MID-TERM PLAN TARGETS
RENAULT ESPACE

DECEMBER 2015 36INVESTOR RELATIONSRENAULT PRESENTATION
A NEW STEP TOWARDS OUR MID-TERM PLAN TARGETS
RENAULT KADJAR
KADJAR

DECEMBER 2015 37INVESTOR RELATIONSRENAULT PRESENTATION
A NEW STEP TOWARDS OUR MID-TERM PLAN TARGETS
RENAULT KWID
KADJAR

DECEMBER 2015 38INVESTOR RELATIONSRENAULT PRESENTATION
A NEW STEP TOWARDS OUR MID-TERM PLAN TARGETS
RENAULT OROCH

DECEMBER 2015 39INVESTOR RELATIONSRENAULT PRESENTATION
A NEW STEP TOWARDS OUR MID-TERM PLAN TARGETS
RENAULT TALISMAN
KADJAR

DECEMBER 2015 40INVESTOR RELATIONSRENAULT PRESENTATION
A NEW STEP TOWARDS OUR MID-TERM PLAN TARGETS
RENAULT TALISMAN ESTATE

DECEMBER 2015 41INVESTOR RELATIONSRENAULT PRESENTATION
A NEW STEP TOWARDS OUR MID-TERM PLAN TARGETS
RENAULT ALASKAN REVEAL

DECEMBER 2015 42INVESTOR RELATIONSRENAULT PRESENTATION
A NEW STEP TOWARDS OUR MID-TERM PLAN TARGETS
RENAULT MEGANE REVEAL

DECEMBER 2015 43INVESTOR RELATIONSRENAULT PRESENTATION
65%33%
Millions units per platforms > 2016
CM
F C
-D
CM
F B
Source : VAG,Hyundai,Toyota : IHS / R&N : Alliance plan
2013 > 2016
SHARED PLATFORMS MODULAR APPROACH
80% of future launches 2/3 of value of upcoming vehicles
from standardized modules
0
1
2
3
4
5
CMF C
-D
CMF B
DEVELOPING OUR SCALE AND COMPETITIVENESS

DECEMBER 2015 44INVESTOR RELATIONSRENAULT PRESENTATION
SOURCING OPTIMIZATION INDUSTRIAL CAPACITIES
Local integration rate*> 80 % in 4 major countries
Utilization rate in Europe > 100%
2011 > 2016
Renault for Renault
Renault for Partners
Renault capacity (2 shifts/day)
Alliance for Renault
>2016
2013
2010
China
Russia
India
Brazil
(*) including powertrain group
Production
5%
17%
REDUCING COST OF VEHICULES

DECEMBER 2015 45INVESTOR RELATIONSRENAULT PRESENTATION
2009 2010 2011 2012 2013 2014 2016e
Renault Nissan
> €4.3bn
ALLIANCE SYNERGIES
€3.8bn*
(*) estimated
ACCELERATING ALLIANCE SYNERGIES
4 KEY-FUNCTIONS CONVERGENCE
PURCHASING UPSTREAM ENGINEERING
HUMANRESOURCES
MANUFACTURING& LOGISTICS

DECEMBER 2015 46INVESTOR RELATIONSRENAULT PRESENTATION
CAPEX AND R&D CAPPED at 9%
2008 2009 2010 2011 2012 2013 20142015
H1
2015-
2016e
NET CAPEX 5.6 % 4.4 % 2.5 % 3.1% 4.3 % 3.8 % 3.4% 3.6%
NET R&D 5.5 % 4.5 % 4.0 % 3.8% 3.8 % 3.7 % 4.0% 4.4%
TOTAL 11.1 % 8.9 % 6.5 % 7.0% 8.1% 7.5% 7.4% 8.0% < 9%
% OF GROUP REVENUES
ALLIANCE BENEFITS TO RENAULT: R&D AND CAPEX

INVESTOR RELATIONSRENAULT PRESENTATION DECEMBER 2015 47
A LEADER IN CO2 EMISSION REDUCTION

DECEMBER 2015 48INVESTOR RELATIONSRENAULT PRESENTATION
PREPARING FOR THE FUTURE
EOLAB

DECEMBER 2015 49INVESTOR RELATIONSRENAULT PRESENTATION
OPERATING MARGIN IMPROVEMENT
3.0 %
> 5 %
VolumeCostreduction
Enrichment Net
Raw material
ProvisionFOREX
FY2013 > FY2016

DECEMBER 2015 50INVESTOR RELATIONSRENAULT PRESENTATION
2015 H1: A ROBUST MILESTONE FOR OUR MID-TERM PLAN
MARGIN IMPROVEMENT
1,9%
3,0%
3,9%
4,8%
0,1%
1,3%
2,2%
3,1%
2012 restated 2013 2014 2015 H1
GROUP OPERATING MARGIN
AUTOMOTIVE OPERATING MARGIN
> 5% in 2017*
* target

INVESTOR RELATIONSRENAULT PRESENTATION DECEMBER 2015 51
DIVIDEND POLICY
0,00
0,30
1,16
1,72 1,721,90
2009 2010 2011 2012 2013 2014
DIVIDENDS PAID IN € PER SHARES
� First phase of the plan, dividend paid based on dividends received from shareholdings in listed companies, with a one-year time lag.
� The purpose of that policy was to raise the profile of the dividend while achieving the debt reduction target.
� For the second phase of the plan, pay-out policy independent of the dividends received on holdings in listed companies.
� Aim of this policy : offer returns at least equivalent to the average of European automakers .
� The dividend will be paid on May 15 (or the following working day).

DECEMBER 2015 52INVESTOR RELATIONSRENAULT PRESENTATION
NEW FRONTIERS: CHINA
2013 2014 2015 2016 2017 2018 2019
Industrial projectSignature New plant � 150,000 veh./year
C crossover
D crossover
Vehicle in study
WITH OUR PARTNERS
2nd step

DECEMBER 2015 53INVESTOR RELATIONSRENAULT PRESENTATION
PREPARING FOR THE FUTURE
WUHAN PLANT

DECEMBER 2015 54INVESTOR RELATIONSRENAULT PRESENTATION
FY 2014 FINANCIAL RESULTS
03

DECEMBER 2015 55INVESTOR RELATIONSRENAULT PRESENTATION
AUTOMOTIVE REVENUES VARIANCE ANALYSIS
38,775 38,874
-1,150
-327 +64-33
+311
+1,248
-14
Currency
Volume
Geographic
mix
Mix
Sales to
partners
Others
+0.3%
-3.0pts -0.8pts +0.2pts -0.1pts +3.2pts 0.0pts
Price
+0.8pts
CHANGE 2014 vs 2013: +€99m
FY 2013 FY 2014
(million euros)

DECEMBER 2015 56INVESTOR RELATIONSRENAULT PRESENTATION
OPERATING PROFIT BY ACTIVITY
FY 2013 FY 2014 CHANGE
AUTOMOTIVE 495 858 +363
% Automotive revenues 1.3% 2.2% +0.9pts
SALES FINANCING 747 751 +4
GROUP OPERATING PROFIT 1,242 1,609 +367
% Group revenues 3.0% 3.9% +0.9pts
(million euros)

DECEMBER 2015 57INVESTOR RELATIONSRENAULT PRESENTATION
1,2421,609
+778
+66+134
-226+121
-35-471
GROUP OPERATING PROFIT VARIANCE ANALYSIS
Currency
Volume &
partners
Mix / Net Enrichment
G&A
RCI Banque
&
other activities
COST REDUCTION
€844m
FY 2013 FY 2014
CHANGE 2014 vs 2013: +€367m
Monozukuri
Raw materials
GROWTH
€86m
(million euros)

DECEMBER 2015 58INVESTOR RELATIONSRENAULT PRESENTATION
CONTINUING COST REDUCTION
COST REDUCTION CONTRIBUTION TO OPERATING PROFIT IMPROVEMENT
+ 430
-107
+ 397
+ 58+ 66
Purchasing Warranty Manufacturing& Logistic
R&D G&A
+€844mvs 2013

DECEMBER 2015 59INVESTOR RELATIONSRENAULT PRESENTATION
OTHER OPERATING INCOME & EXPENSES
FY 2013 FY 2014
Net restructuring costs
(incl. competitiveness agreement in France)-423 -305
Impairment of assets / reversal -488 -153
RCI Banque (mainly change in regulation) - -50
Profit / loss on asset sales +153 +7
Others -518 -3
Total other operating income & expenses -1,276 -504
(million euros)

DECEMBER 2015 60INVESTOR RELATIONSRENAULT PRESENTATION
ASSOCIATED COMPANIES
FY 2013 FY 2014 CHANGE
Nissan 1,498 1,559 +61
AVTOVAZ (1) -34 -182 -148
Others -20 -15 +5
Total associated companies 1,444 1,362 -82
(1) AVTOVAZ is consolidated with a 3-month time lag . Adjustments have been made to take into account significant transactions and accounting entries that occurred between September 30, 2014 and December 31, 2014.
(million euros)

DECEMBER 2015 61INVESTOR RELATIONSRENAULT PRESENTATION
FY 2014 FINANCIAL RESULTS
FY 2013 FY 2014 CHANGE
Revenues 40,932 41,055 +0.3%
Operating profit 1,242 1,609 +367
in % of revenues 3.0% 3.9% +0.9pts
Other operating income & expenses -1,276 -504 +772
EBIT -34 1,105 +1,139
Net financial income & expenses -282 -333 -51
Associated companies 1,444 1,362 -82
Current & deferred taxes -433 -136 +297
Net income 695 1,998 +1,303
(million euros)

DECEMBER 2015 62INVESTOR RELATIONSRENAULT PRESENTATION
3,138
1,083
343
+596
+463 -542
-661
AUTOMOTIVE NET CASH POSITION
Operational free
cash flow
Cash flow
Changein WCR
Dividendspaid
Net tangible& intangible
investments
-2,651
Net changeIn cash
Dividends receivedfrom
listed co.
Capitalized
R&D
-845 Financial investments & others
Net capex
-1,571
DEC 31, 2013 : €1,761m
DEC 31, 2014 : €2,104m
(million euros)
LeasedVehicles -235

DECEMBER 2015 63INVESTOR RELATIONSRENAULT PRESENTATION
LIQUIDITY RESERVES
Cash = €10.7bn
Available credit lines = €3.4bn
TOTAL = €14.1bn
LIQUIDITY RESERVES
Cash = €11.6bn
Available credit lines = €3.2bn
TOTAL = €14.8bn
AUTOMOTIVE DIVISION LIQUIDITY
DECEMBER 2013 DECEMBER 2014

DECEMBER 2015 64INVESTOR RELATIONSRENAULT PRESENTATION
FUNDING & LIQUIDITY PROFILE
� RSA total funding : 7.6 billions €In million euros at December 31, 2014
Bonds, Banks & assimilated (in millions euros *)
� Liquidity reserve: - Available back-up lines : 3.2 billions €- Cash & cash equivalents: 11.6 billions €
Automobile Division
* fx rates as of 12/31/14

DECEMBER 2015 65INVESTOR RELATIONSRENAULT PRESENTATION
RCI BANQUE
(in percentage of average loans outstanding)
2013 2014
New financings (€bn) 11.4 12.6
Average loans outstanding (€bn) 24.2 25.4
Net banking income* 5.04% 4.98%
Cost of risk (customer & dealer) -0.42% -0.43%
Operating expenses* -1.56% -1.58%
Pretax income* 3.07% 2.95%
Operating profit (€m) 747 751
* Excluding non recurring items

DECEMBER 2015 66INVESTOR RELATIONSRENAULT PRESENTATION
End 2013 End 2014
DEPOSITS 4,33 6,53
o/w GERMANY 3,05 4,38
o/w FRANCE 1,28 1,78
o/w AUSTRIA - 0,37
RCI BANQUE RETAIL DEPOSIT ACTIVITY
• 2016 TARGET: 30% OF RCI BANQUE OUTSTANDINGS
(billion euros)

DECEMBER 2015 67INVESTOR RELATIONSRENAULT PRESENTATION
04RENAULT IN BRIEF

INVESTOR RELATIONSRENAULT PRESENTATION DECEMBER 2015 68
RENAULT – IN BRIEF
� Renault was founded in 1898 and is listed on the Paris NYSE Euronext since 1995
� Renault created an Alliance with Nissan in 1999
� Renault has strategic cooperation with Daimler
� Market capitalization of €17.9bn as of Dec 2014 (€21.9bn as of Aug 2015)
� Renault employs 117,395 employees worldwide
� 2,712,432 vehicles sold worldwide in 2014
� The Renault brand is ranked # 3 in Europe
� The company is a bond issuer via two entities:
Renault, rated BBB- by S&P (stable outlook)/BBB-(stable outlook) by Fitch / Ba1 (positive outlook) by Moody’s
RCI Banque, its financing arm, rated Baa1 (stable outlook) by Moody’s / BBB (negative outlook) by S&P
OWNERSHIP OF CAPITAL AT END 2014
Treasury stock 2
0.86%Employees
2,97%
Nissan 1
15.00%
French State15.01%
Public63.05%
1 Nissan does not exercise the voting rights attached to these shares2 Shares acquired for the purposes of stock option programs. These shares have
no voting rights attached3 A strategic cooperation between the Renault-Nissan Alliance and Daimler AG was
announced in April 2010;
Total share capital €1,127mm
Total number of shares 295,722,284
Daimler 3
3.10%
Source: Renault SA

INVESTOR RELATIONSRENAULT PRESENTATION DECEMBER 2015 69
GROUP STRUCTURE
RCIBANQUE
RENAULTSAMSUNGMOTORS
AvtoVAZ
OTHER COMPANIESindustrial, commercial,
refinancing and cash management concerns
RENAULT S.A.S.
DACIA
NISSAN MOTOR
RENAULT SA
100 %
43.4 %
99.4 %
1.55 %
100 % 80.1 %37,25%
DAIMLER AG
Renault GroupAlliance and Cooperation

INVESTOR RELATIONSRENAULT PRESENTATION DECEMBER 2015 70
A MAJOR ALLIANCE IN THE AUTOMOTIVE LANDSCAPE
52 5254
56 56 56 57
6163
6568
6563
71
75
7982
85
51
1996
1997
1998
1999
2000
2001
2002
2003
2004
2005
2006
2007
2008
2009
2010
2011
2012
2013
2014
10,1 9,9 9,98,5
7,7
6,35,3
4,6 4,4
2,9 2,7
0,0
1,0
2,0
3,0
4,0
5,0
6,0
7,0
8,0
9,0
10,0
11,0
TOYOTA
VW-Porsche
GM-Wulinng
ALLIANCE
HYUNDAI
FORD
NISSAN
FIAT-CHYSLER
HONDA
PSA
RENAULT
RenaultNissanAvotvaz
8,470 million units sold in 2014
TIV (PC+LCV) IN MILLION UNITS
MAIN CARS SALES IN 2014 (PC+LCV) IN MILLION UNITS
448 5%
5 310 63%
2 712 32%

INVESTOR RELATIONSRENAULT PRESENTATION DECEMBER 2015 71
62%12%
11%
11%4%
Sales by Region
Europe
Americas
Africa - ME
-India
Eurasia
Asia-Pacific
RENAULT SALES IN H1 2015
76%
21%
3%
Sales by brand
Renault
Dacia
RSM
4%
27%
40%
14%
3%
12%
Sales by segment
A B
MO C
D/E LCV
MAIN CARS SALES IN H1 2015 (PC+LCV) IN KUNITS
237
171 168 147 145 12876 54 47
0
100
200
300
400
500
CLIO - B
seg
SANDERO - M
O
DUSTER - M
O
MEGANE/SCENIC - C
SEG
LOGAN - M
O
CAPTUR - B
SEG
KANGOO - L
CV
TWINGO - A
SEG
MASTER - L
CV

INVESTOR RELATIONSRENAULT PRESENTATION DECEMBER 2015 72
HEADCOUNT EVOLUTION
74 73 71 70 70 68 63 60 55 54 55 50 49 46
2624 24
22 20 2018 17 20
3531 31 28 33 35 43 45
44 49 5356 56 51
28 2423 26 24
0
20
40
60
80
100
120
140
2001 2002 2003 2004 2005 2006 2007 2008 2009 2010 2011 2012 2013 2014
France EUROPE Outside Europe
129 130 129121 123
128
Headcount excluding early retirement schemes
137
128 125 127 127117
124 122

INVESTOR RELATIONSRENAULT PRESENTATION DECEMBER 2015 73
INTERNATIONAL SALES EXPANSION
11%
17% 17% 17%19%
23%27%
30%
35%37%
34%37%
43%
50% 50%
46%
1999 2000 2001 2002 2003 2004 2005 2006 2007 2008 2009 2010 2011 2012 2013 2014
% OF UNIT SALES OUTSIDE EUROPE

INVESTOR RELATIONSRENAULT PRESENTATION DECEMBER 2015 74
ENTRY PROGRAM SALES EVOLUTION –OVER 1M UNITS IN 2014
23145
248367
510 535687
814954
1 084 1 142
2004 2005 2006 2007 2008 2009 2010 2011 2012 2013 2014
IN K UNITS

INVESTOR RELATIONSRENAULT PRESENTATION DECEMBER 2015 75
M0 PLATFORM : THE RIGHT TOOL FOR INTERNATIONAL EXPANSION
% OF INTERNATIONAL SALES UPON M0 PLATFORM
63%
37%
MO Others

INVESTOR RELATIONSRENAULT PRESENTATION DECEMBER 2015 76
ENTRY PROGRAM RECIPE FOR SUCCESS
� Two different business models:
� Dacia Brand in Europe and Euromed(45% of the sales)
� Renault Brand for International development (55% of the sales)
� The “right” level of vehicle content
� Adjusted for the different markets
� High carry-over to minimize investment
� Seven bodies on the same platform
� Localization
NEW LOGAN
DUSTER

INVESTOR RELATIONSRENAULT PRESENTATION DECEMBER 2015 77
RENAULT RANGE

INVESTOR RELATIONSRENAULT PRESENTATION DECEMBER 2015 78
RENAULT RANGE

INVESTOR RELATIONSRENAULT PRESENTATION DECEMBER 2015 79
DACIA & RSM RANGE

INVESTOR RELATIONSRENAULT PRESENTATION DECEMBER 2015 80
P&L STATEMENT SINCE 2000
* with Renault VI
PUBLISHED
2000* 2001 2002 2003 2004 2005 2006 2007 2008 2009 2010 2011 2012 2013 2014in K units
Registration 2 289 2 409 2 404 2 389 2 489 2 533 2 433 2 484 2 382 2 309 2 626 2 722 2 550 2 628 2 712production 2 348 2 375 2 344 2 385 2 472 2 516 2 385 2 659 2 421 2 199 2 599 2 637 2 725 2 520 2 574
in€ m
Revenues 40 175 36 351 36 336 37 525 40 715 41 338 41 528 40 682 37 791 33 712 38 971 42 628 41 270 40 932 41 055o/w Automotive 31 486 33 841 34 456 35 535 38 645 39 458 39 605 38 679 35 757 31 951 37 172 40 679 39 156 38 775 38 874
o/w sales financing 1 656 1 828 1 880 1 990 2 070 1 880 1 923 2 003 2 034 1 761 1 799 1 949 2 114 2 157 2 181Cost of goods and services sold -30 214 -28 240 -28 17 8 -29 273 -31 162 -32 137 -32 499 -31 408 -29 659 -26 978 -30 620 -33 848 -33 017 -33 611 -33 310
o/w Research and development expenses -2 048 -1 935 -1 143 -1 243 -1 383 -2 034 -1 963 -1 850 -1 858 -1 795 -1 834 -2 017 -1 915 -1 812 -1 721o/w SG&A -4 838 -4 538 -4 363 -4 452 -4 581 -4 918 -5 018 -4 949 -4 770 -4 382 -4 605 -4 751 -4 534 -4 267 -4 415
Operating margin 2 022 473 1 483 1 402 2 418 1 323 1 063 1 354 212 -396 1 099 1 091 729 1 242 1 609o/w Automotive 1 574 216 1 189 1 035 1 974 858 571 882 -275 -902 396 330 -25 495 858
o/w sales financing 253 252 294 367 444 465 492 472 487 506 703 761 754 747 751Other operating income and expenses -319 231 -266 -168 -270 191 -186 -116 -329 -559 -464 153 -607 -1 276 -504Operating income 1 703 704 1 217 1 234 2 148 1 514 877 1 23 8 -117 -955 635 1 244 122 -34 1 105Financial expense -69 -64 -91 -71 -348 -327 61 76 441 -404 -37 6 -121 -266 -282 -333Capital gain on sale of shares in Volvo AB 2 000 924Share in net income of companies accounted for by the equity method
89 380 1 331 1 860 2 020 2 597 2 260 1 675 437 -1 561 1 289 1 524 1 504 1 444 1 362
o/w Nissan 56 497 1 335 1 705 1 767 2 275 1 871 1 288 345 -902 1 084 1 332 1 234 1 498 1 559o/w Volvo -26 71 175 240 308 384 352 226 -301 214 136 80
o/w AvtoVAZ -370 -21 49 186 -34 -182Current and deferred taxes -649 -67 -447 -510 -634 -331 -255 -255 -162 -148 -58 -508 -549 -433 -136Group net income 1 074 953 2 010 2 513 3 186 3 453 2 943 2 734 599 -3 068 3 490 2 139 1 735 695 1 998Renault net income 1 080 1 051 1 956 2 480 3 119 3 367 2 869 2 669 571 -3 125 3 420 2 092 1 772 586 1 890EPS 4,5 4,4 7,5 9,3 11,7 13,2 11,2 10,3 2,2 -12,1 12,7 7,7 6,5 2,2 6,9Number of shares 239 798 239 998 259 560 265 960 265 960 255 177 256 994 258 621 256 532 257 514 269 292 272 381 272 256 272 290 273 049
workforce 166 114 140 417 132 351 130 740 130 573 126 584 128 893 130 179 129 069 121 422 122 615 128 322 127 086 121 807 117 395
BEFORE IFRS IFRS

INVESTOR RELATIONSRENAULT PRESENTATION DECEMBER 2015 81
CASH FLOW STATEMENT
PUBLISHED
IFRSin € m 2000* 2001 2002 2003 2004 2005 2006 2007 2008 2009 2010 2011 2012 2013 2014AUTO EBIT 1 467 458 928 858 1 710 1 058 303 767 -608 -1 457 -78 478 -615 -770 389Depreciation & amortization 1 817 1 683 1 938 2 117 2 133 2 658 2 817 2 815 2 892 3 124 3 045 2 820 3 299 3 164 2 702AUTOMOTIVE EBITDA 3 284 2 141 2 866 2 975 3 843 3 716 3 120 3 582 2 284 1 667 2 967 3 298 2 684 2 394 3 091
Cash flow 3 027 1 290 2 919 2 806 3 798 3 589 3 288 3 616 2 373 1 386 3 074 2 910 2 577 2 914 3 138Change in WC -1 657 1 751 322 239 401 -533 -346 -26 -2 704 2 923 395 627 922 790 596Capex and R&D cost -2 289 -2 546 -2 968 -2 533 -2 823 -2 879 -3 585 -3 565 -3 385 -2 054 -1 644 -2 212 -2 674 -2 543 -2 416
CAPEX -2 253 -2 497 -2 284 -1 927 -2 035 -2 046 -2 494 -2 278 -2 260 -1 465 -978 -1 325 -1 910 -1 811 -1 571CAPITALIZED R&D -36 -49 -684 -606 -788 -833 -1 091 -1 287 -1 125 -589 -666 -887 -764 -732 -845
Others 135 -248 -155 -241 -228 -334 -235OPERATIONAL FCF -919 495 273 512 1 376 177 -508 25 -3 716 2 007 1 670 1 084 597 827 1 083
Dividends received from Nissan 99 183 267 345 383 431 456 418 0 88 274 427 406 432Dividends received from Volvo 0 77 77 208 120 158 477 258 81 0 38 47Dividends received from Daimler 22 27 27 32Dividends received from others excl; RCI 7 6 13 13 3 12 0 0 1 6FCF -912 600 533 856 1 929 693 94 961 -3 028 2 088 1 758 1 419 1 077 1 260 1 547
DIVIDEND PAID 183 219 258 316 383 493 684 883 1 054 0 0 88 -402 -537 -542
BEFORE IFRS

INVESTOR RELATIONSRENAULT PRESENTATION DECEMBER 2015 82
-919
495273
512
1377
177
-508
25
-3716
20071670
1084
597827
1083738
-1256
-49
273
845 710
-162
51
-1012 -916
1275
457
-325
37487
-4000
-2000
0
2000
2000 2001 2002 2003 2004 2005 2006 2007 2008 2009 2010 2011 2012 2013 2014
Operational Free Cash Flow Operational Free Cash Flow excluding WCR evolution
(million euros)
A STRONGER FCF MANAGEMENT

INVESTOR RELATIONSRENAULT PRESENTATION DECEMBER 2015 83
8,29,7 10,1
11,813,6
15,9
19,721,2 22,1
19,416,5
22,824,6 24,6
23,224,9
-2,7
-4,8-3,9
-2,5 -1,7
-1,6
-2,3 -2,4 -2,1
-7,9-5,9
-1,4-0,3
1,5 1,8 2,1
1999 2000 2001 2002 2003 2004 2005 2006 2007 2008 2009 2010 2011 2012 2013 2014
Shareholders' equity
Automotive Net cash
AUTOMOTIVE DIVISION FULLY DELEVRAGED
(billion euros)
FormerGAAPs
IFRSGAAPs

INVESTOR RELATIONSRENAULT PRESENTATION DECEMBER 2015 84
RENAULT INVESTORS RELATION CONTACT
Thierry Huon
Investor Relations Director
+33 1 76 84 53 09
Nicolas Chaillan
Investor Relations
+33 1 76 83 05 13
Clémentine de Quatrebarbes
Investor Relations
+33 1 76 84 60 89
Investor relations internet site: http://group.renault.com/finance