fed funds futures (kuttner krueger)
TRANSCRIPT
THE Fpo Fuxns FurunpsRanr AS A PnEnrcroR oF
FEosRAr RgsERVE Porrcv
JOEL T. KRUEGERKENNETH N. KUTTNER
INTRODUCTION
Monetary policy's effects on the economy are pervasive, and the Federalfunds rate plays a central role in the Federal Reserve's implementation ofits policy. Changes in the Federal funds rate rapidly affect other moneymarket interest rates, and changing expectations of future policy can sig-nificantly influence stock and bond prices. As demonstrated by Bernankeand Blinder (1992), changes in the Federal funds rate also have signifi-cant effects on real economic activity. I It is not surprising, therefore, thatthe Fed funds futures market has received increasing attention as a gauge
of expected Federal Reserve policy actions.2' How well does the Fed funds futures market anticipate changes in
the Federal funds rate? This article addresses that question by evaluatingthe futures market's one- and two-month-ahead forecasts of the fundsrate. Specifically, it assesses the efficiency of the Fed funds futures marketby testing the market's forecasts for the properties implied by rational
lThe Federal funds rate is also an ingredient in more sophisticated measures of monetarypolicyasdescribcd in Bernanke and Mihov (1995) and Strongin (1995). Those measures also incorporate thevolume of nonborrowed and total reserves.2See, for example, McGee (1995).The authors thank Charlie Evans, David Marshall, Jim Moser, and two anonymous referees for theircomments and suggestions. The opinions expressed here are the authors'own, and they do not reflectthe official positions of PPM America or the Federal Reserve System. Address correspondence to:Kenneth Kuttner,6l9 Uris Hall, Columbia University, NewYork, NY 10027.
Joel T. Krueger is a Co-Director of Fixed lncome Quantitatiue Research at PPMAmerica.
Kenneth N. I{uttner is a Visiting Assistant Professor at Columbia Business School.
The Journal of Futures Markets, Vol. 16, No. 8, 865-879 (1996)
O 1996 by John Wiley & Sons, lnc. ccc 027 0 -7 31 4/96/08086s- 1 5
866 Krueger and Kuttner
expectations. Over the 1989-1994 period, the futures-based forecastsgenerally satisfy this criterion: incorporating additional data available toinvestors when the contracts are priced yields only marginal improve-ments over the futures-only forecasts. Of the indicators considered, onlythe change in the inflation rate and the spread between three-monthcommercial paper and the Fed funds rates are statistically significant inwithin-sample tests of rationality at the 0.05 level. These indicators do
not tangibly improve out-of-sample forecasts, however.
THE FED FUNDS FUTURES MARKET
Fed funds futures contracts are designed to hedge against (or speculateon) changes in the overnight effective Fed funds rate, which is the interestrate prevailing in the interbank market for overnight reserves. The Chi-cago Board of Trade (CBT) offers contracts on the Fed funds rate at avariety of maturities.3 The most popular of these are the one- and two-month contracts, and the "spot month" contract based on the remainderof the current month's rate.4 They are marked to market on each tradingday, and final cash settlement occurs on the first business day followingthe last day of the contract month.5
The settlement price for the contract is based on the relevant month'saverage effective overnight Fed funds rate as reported by the Federal Re-
serve Bank of New York. The average includes weekends and holidays,whose rates are carried over from the rate prevailing on the most recentbusiness day.6 The pre-tax profits for an investor long in Fed funds con-tracts purchased on date r for delivery in month s, rd, is proportional tothe difference between the futures rate,/f , and the average of the month'sFed funds rate, rt,
- fsJt
3The CBT nou,rcfers to Fed funds lutures as Thirty-Day Interest Rate futures.aThe price of the spot month contract is a rveightcd average of the prer.ious overnight Fed fundsrates for the month and thc tcrm rate for the remainder ol the month. For example, the Januarysettlement price applied to a futures contract purchased on January 1 I rvould be I 0/3 I X thc average
overnight Fed funds rate for previous l0 days + 2ll3l x the term Fed funds rate fbr the 21 days
remaining in the contract month.5For all but the spot month contract, the CBT limits pricc fluctuations to 150 basis points daily. Thelimit is expandcd to 225 basis points rvhen the limit is reached on three consecutive trading days.
Further details on the market's operation can be found in "Thirty-Day Interest Ratc Futures forShort-Term Interest Ratc N{anagcment," Kuprianov (1993), and Carlson, Nlclntire, and Thomson(ree5).64. uniform 30-day month is used in calculating the tick size.
I
7ti #u'
Fed Funds Fate 867
(l)?
I3
where M is the number of calendar days in the month. Arbitrage by risk-neutral investors implies no predictable profit opportunities, or Er(z{) :0, which in turn implies that the futures rate is equal to the average ofexpected future realized rates on Fed funds,
fi_ E;(#:,,) :o
where E, represents the mathematical expectation conditional on infor-mation available to investors at time t.7
A number of previous studies have analyzed the T-bill futures mar-ket, including: Rendleman (1979);Hedge and McDonald (1986); Pateland Zeckhauser (1990); Cole, Impson, and Reichenstein (1991); andHafer, Hein, and MacDonald (1992). These studies found that futuresrates generally f.ield accurate predictions of future spot T-bill rates atmost horizons, and rarely fail to satisfi' properties of rational forecasts.The only prominent exception to this pattern is Howard (1982), whofound that simple time-series models dominate futures-based forecastsat short horizons.
Two features distinguishing the Fed funds futures market from theLIBOR, T-bill, and Eurodollar markets are its short history and its rela-tively small size. T-bill futures have been traded since 1976, while theFed funds futures market has edsted only since October, 1988. The vol-ume of Fed funds contracts traded in 1992 was only one-fourth that ofT-bill futures, and one-third that of LIBOR contracrs.8 In light of themarket's relatively short track record, the efficiency of the Fed funds mar-ket is an open question.
ARE FED FUNDS FUTURES FORECASTSRAIIONAL?
This section examines forecasts of the Fed funds rate based on the one-and two-month-ahead Fed funds futures contracts. Specifically, it reportstests of the unbiasedness and rationality properties implied by eq. (l).The forecasts are unbiased if the futures rate is, on average, equal to the
TBecause the futures price anticipates thc realized Fed funds rate instead of the Fed's target rate,technical factors affccting the Opcn N'larket Desk's ability to hit the target rate may, in principle,alfect the futures rate. In practice, the discrepancy between the target and the realized rates largelydisappears in monthly averages, however. Carlson, Nlclntire, and Thomson (1995) found that themean absolute deviation bets,een the eflcctive and target rates is no more than slv basis points.sThe Fed funds futures market has grorvn rapidly since 1994. By the third quarter of 1995, thevolume of contracts traded and open interest have both reached levels comparable to those of the T-bill futures markct.

868 Krueger and Kuttner
realized spot rate. The rationality property says that the Fed funds futuresrate should incorporate all available information useful for predicting the
funds rate. This implies that no variable available in month t should be
able to predict the futures market's errorin forecasting the month t * I
funds rate. The out-of-sample forecasting performance of the futures-based forecasts is also examined, and compared to the performance ofalternative forecasts.
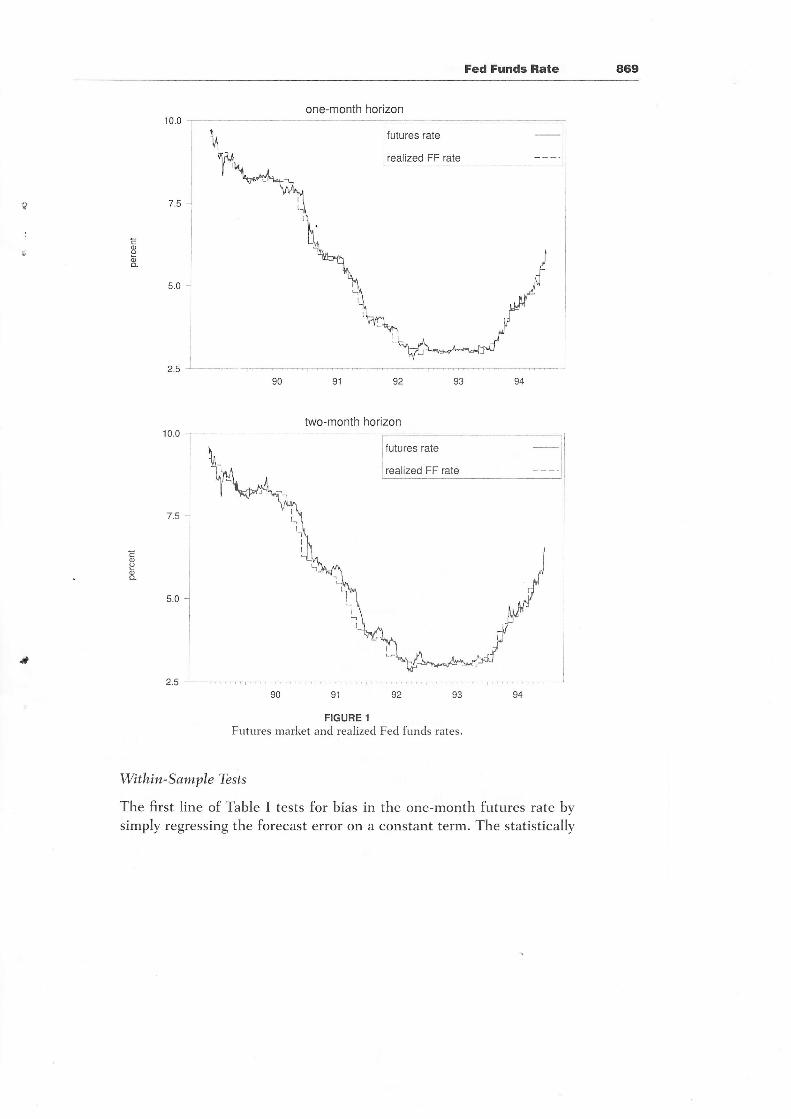
Figure I plots the data used in the analysis: the monthly average ofthe effective overnight Fed funds rate and the corresponding Fed fundsfutures rate for the period from May 17, 1989, through December 7,
1994. ln general, the implied funds rate is very close to the spot rate,especially close to the settlement date. The one-month-ahead contract,as expected) seems to track the actual rate very closely, while the forecasterror associated with the two-month-ahead contract appears somewhatlarger. Overall, little bias is apparent in either of the two futures rates.
Only from 1990 to mid-1992, when Federal Reserve policy led to a sharpdecline in the Fed funds rate, is there a persistent discrepancy. Duringthis period, the futures rate consistently overforecast the spot rate, sug-
gesting that the decline in the funds rate was to some extent unantici-pated by market participants.
Evidence from Monthly Data
Using data at a monthly frequency, the unbiasedness and rationalityprop-erties are easily tested by regressing the spread between the futures rateand the realized spot rate on a constant and a variety of economic indi-cators investors might plausibly have used to predict the Fed funds rate.For the k-month-ahead futures rate, the regressions are of the form:
j'r-o - lt+r, : a + 0(L)xr-t * ut+k (2)
where F1*pis the average funds rate prevailing in month t + k, ^r'djt*kis the average futures rate for the month t + k contract, priced in montht.e The forecast error is ur*7r. Candidate indicators, xr, are included in theregression by way of the lag pollmomial, 0(L).ln cases where the t-datedindicator is not known at time t, , is set to one to introduce an additionallag; in other cases, I is zero.lo Unbiasedness implies a : O, and rationalitythat 0(L) : g.
eRegressions of this form impose a unit coefficient orji*1. Tests not reported in the article confirmthat the restriction is easily satisfied, paralleling Patel and Zeckhauser's (1990) findings for T-billfutures rates.loNIost economic data, such as inflation and employrnent, are reported with a one-month lag, so a
fair test of rationality would use lagged values of those variables.
Fed Funds Rate 869
one-month horizon
coo8.
t
I
two-month horizon
Futures market ".lillfit"lu Fed funds rates.
Within-Sample Tbsts
The first line of Table I tests for bias in the one-month futures rate bysimply regressing the forecast error on a constant term. The statistically

470 Krueger and Kuttner
TABLE I
Monthly Tests of Unbiasedness and Rationality: One-Month Horizon
lndicatorEstimerted
Constant
Significance Letel
Constant Indicator(s) R2
Nonelnflation change (1-2)Nonborrowed reserves growth (1-2)Total reserves growth ('1-2)Base growth (1-2)M 1 growth (1-2)M2 growth (1-2)3-month paper-FF spread1-year note-FF spread30-year-FF spreadFunds rate changeUnemployment rate change (1-2)Payroll employment growth (1-2)Ul claims change (1-2)lndustrial production growth (1-2)lP growth (1-2) & inflation change (1 2)Empl. growth (1)& inflation change (.1-2)
b.t5.94.73.8tq.
4.59.4435.94.450
- 15.78.4556.45.87.6
0.000.000.070.140.680.170.000.040.010.200.020.350.000.010.010.010.00
0.050.590.310.800.840.250.020.780.540.090.170.250.580.870.200.05
0.061
- 0.0150.001
-o.o24- 0.026
0.0130.066
- 0.01 40.0090.0290.o240.012
- 0.014
-o.o270.0310.073
Notes: The table reports the results from estimating eq. (2). The spread between the average one-month-ahead futuresrate and the average Fed funds rate in that month is regressed on a constant and the rndicator (or indicators) listed.Numbers in parentheses are the lags of the indicator included; where none is given, the current month s indicator is used.The results use the 66 monthly observations f rom June, 1 989 through November, 1994. lnterest rate data are in basis points.
significant estimated constant term shows that the one-month futuresrate exhibits a premium of just over six basis points.
To test the rationality hypothesis, the futures-based forecast errorsare regressed on a variety of economic indicators falling into four cate-gories: inflation, employment and output, reserves and money, and inter-est rates and interest rate spreads. All of the variables except those basedon interest rates are lagged one month to account for their delayed avail-ability. The lag lengths selected are those yielding the best within-samplefit. The table reports the joint significance level of the indicators includedin eq. (2).
At the one-month horizon, statistically significant 0(L) coefficientsare scarce. The change in the CPI inflation rate, shown on the secondIine of the table, is one of the few indicators displaying a systematic re-Iationship to the futures-based forecast error that is significant at the 0.05Ievel. The only other indicator with a significant within-sample relation-ship is the current month's spread between the interest rates on three-month commercial paper rate and overnight Fed funds. Because the ex-
pectations hypothesis of the term structure implies a relationship
Fed Funds Rate 471
TABLE II
Monthly Tests of Unbiasedness and Rationality: Two-Month Horizon
InclicatorEstiruatedConstant
Significance Leuel
Constant lndicator(s) R2
Nonelnflation change (1-2)Nonborrowed reserves growth (1-2)Total reserves growth ( 1-2)Base growth (1-2)Ml growth (1 2)M2 growth (.1-2)
3-month paper-FF spreadI -year note-FF spread3O-year-FF spreadFunds rate changeUnemployment rate change (1-2)Payroll employment growth (1-2)Ul claims change (1-2)Industrial production growth (1-2)lP growth (1-2) & inflation change (1-2)Empl. growth (1) & inflation change (1-2)
12.1
12.010.78.79.69.0
17.810.312.4'10.1
9.2
-27.318.913.0lJ.512.817.0
0.000.000.010.030.310.090.000.000.000.060.0.1
0.290.000.000.000.000.00
0.1B0.56U.JJ0.940.740.210.120.720.630.010.100.01o.420.56o.410.02
o,o22
- 0.0 13
0.004
-0 030
-0.0220,0180 0230,014
-o.0120.0750.0400.126
- 0.0040.0130.0010.1 09
Notes:Thetablereportstheresultsfromestimatingeq (2).Thespreadbelweentheaveragetwo-month-aheadiuturesrateand the average Fed tunds rate in that month is regressed on a constant and the indicator (or indicators) listed. The resultsuse the 65 monthly observations from June .1989 through November, 1994. See also notes to Table L
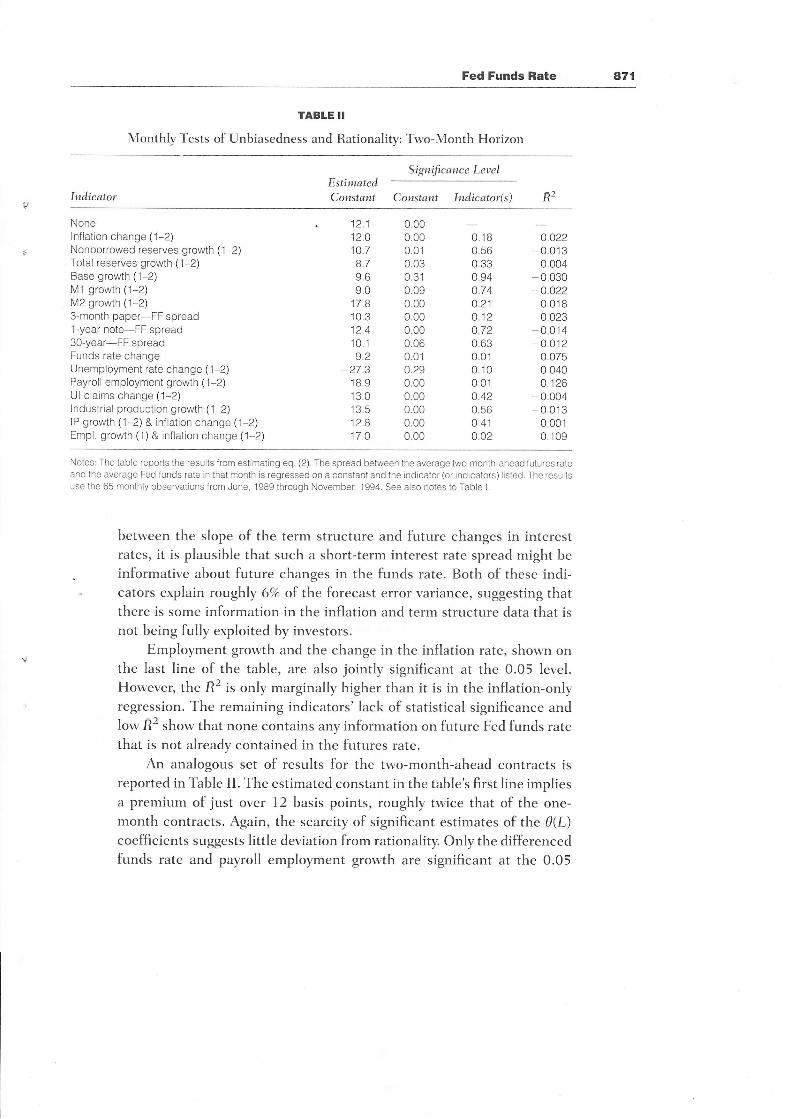
betu,een the slope of the term structure and future changes in interestrates, it is plausible that such a short-term interest rate spread might beinformative about future changes in the funds rate. Both of these indi-cators explain roughly 6o/o of the forecast error variance, suggesting thatthere is some information in the inflation and term structure data that isnot being fully exploited by investors.
Employment growth and the change in the inflation rate, shown onthe last line of the table, are also jointly significant at the 0.05 level.However, the E2 is only marginally higher than it is in the inflation-onlyregression. The remaining indicators' lack of statistical significance andlow R2 show that none contains any information on future Fed funds ratethat is not already contained in the futures rate.
An analogous set of results for the two-month-ahead contracts isreported in Table II. The estimated constant in the table's first line impliesa premium of just over l2 basis points, roughly twice that of the one-month contracts. Again, the scarcity of significant estimates of the 9(L)coefficients suggests little deviation from rationality. Only the differencedfunds rate and payroll emplo;rment growth are significant at the 0.05
472 Krueger and Kuttner
, TABLE III
Monthly Out-of-Sample Forecast Errors
Indicator
One-Month-Ahead Ttpo-Month-Ahead
RMSE Signif. Le'tel RMSE Signif. Leuel
Futures rate onlyFutures rate + constant
No changeDifferentiated inf lation3-month paper-FF spreadEmployment growthEmpl. growth & infl. changeChristiano-Eichenbaum-Evans
17.716.1
25.415.417.71 6..1
20.9
0.38
0.030.260.990.360.270.39
42.227.527.O
26.426.530.2
0.42
0,000.400.34o.21o.240.91
30.527.7
Notes: The models are initialized on the period from June, 1989, through December, 1990, and estimated recursivelyandevalualed from January, 1991 onward. The lags of the indicators are the same as those used in Tables I and ll. TheChristiano-Eichenbaum-Evans specification is defined in the text. The significance levels reported are {or the test that themodel's RMSE is equal to that ot the futures-only forecasl. See also notes to Table L
level, and these indicators account for less than 8 and l3Vo, respectively,
of the within-sample forecast error variance.
Out - of- S ample Fore c asts
The scattered deviations from rationality reported in Tables I and II maybe merely the result of spurious within-sample fitting. (After all, even
under the null hypothesis that all of the 9(L) coefficients equal zero, atest at the 0.05 level would reject the null hypothesis one out of twentytimes.) This section presents results based on out-of-sample forecasts ofthe Fed funds rate. Not only does this represent a much more stringenttest for deviations from rationality, but it also yields a measure of thequantitative significance of those deviations.I I
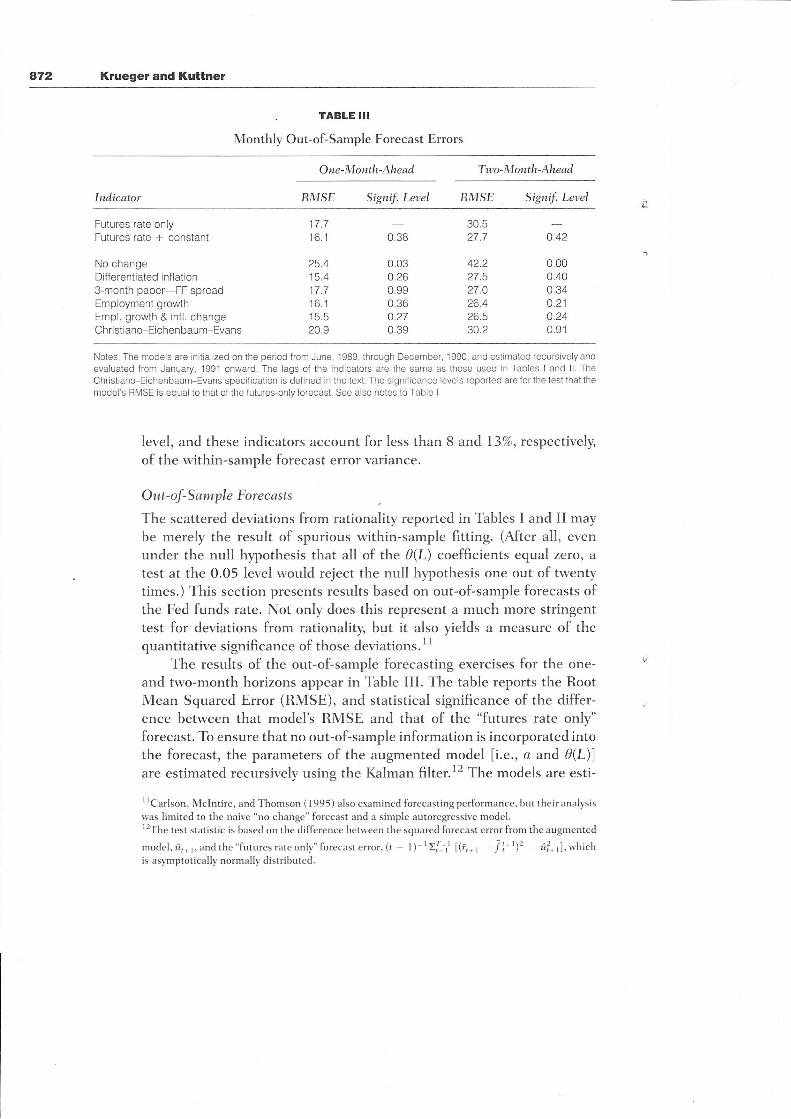
The results of the out-of-sample forecasting exercises for the one-and two-month horizons appear in Table III. The table reports the RootMean Squared Error (RMSE), and statistical significance of the differ-ence between that model's RMSE and that of the "futures rate only"forecast. To ensure that no out-of-sample information is incorporated intothe forecast, the parameters of the augmented model [i.e., a and 0(L)]are estimated recursively using the Kalman filter. l2 The models are esti-
I ICarlson, Mclntire, and Thomson ( 1995) also examined forecasting performance, but their analysiswas limited to the naive "no change" forecast and a simple autoregressive model.l2The test statistic is based on the difference betu'een the squared forecast error from the augmented
model,ri,, l,andthe"futuresrateonly"forecasterror,(i- l)-rtL-,' [(ri-, - ji-tl' - ri-l],whichis asymptotically normally distributed.
Fed Funds Rate a73
mated on the June, 1989 through December, 1990 subsample, and eval-
uated over the January l99l through Novemb er, 1994 period.
Comparing the first and second lines shows that subtracting a (re-
cursively estimated) constant from the futures rate improves forecasting
performance slightly, reducing the RMSE by 1.6 and 2.8 basis points at
the one- and two-month horizons. The futures-rate-based forecasts are
significantly more accurate than the "no change" forecast, with a differ-
ence of over 9 and l4 basis points at the one- and two-month horizons.
The out-of-sample results corroborate the within-sample rationality
tests, and show that the quantitative significance of the deviations re-
ported earlier is quite small. The fourth line of the table shows that aug-
menting the model with the change in the inflation rate reduces the
RMSE by only 0.7 and 0.2 basis points (relative to the "futures * con-
stant" forecast) at the one- and two-month herizons. Neither differs sig-
nificantly from the "futures only" RMSE. Employment growth helps to
reduce the RMSE marginally at both horizons, but slightly more at two
months. The three-month paper to Fed funds spread, which is statistically
significant in sample at the one-month horizon, fails to improve the out-
of-sample RMSE at that horizon; it does marginally improve the two-
month-ahead forecasts, however.
As a final comparison, the table rePorts the RMSEs from forecasts
based on a Vector Autoregression (VAR) similar to the one developed by
Christiano, Eichenbaum, and Evans (CEE) (1994). Their specifrcation,
which was designed to assess the economy's response to unforecastable
changes in the Fed funds rate, models monetary policy as a function oflagged employment, inflation, nonborrowed reserves, and total reserves'
as well as lagged values of the funds rate itself. Over this relatively short
sample, very short lag lengths gave the best out-of-sample performance;
the specification used here includes four lags of the funds rate, three lags
of the change in inflation, and only one lag each on employment growth,
nonborrowed reserves growth, and total reseryes growth.13 Unlike the
other forecasts evaluated in Table III, the CEE model does not incorpo-
rate futures rate data.
Although it does noticeably better than the "no change" forecast, the
CEE model's RMSE statistics are four to five basis points higher than the
futures-only forecast's. The CEE model's relative performance improves
somewhat at the longer two-month horizons, however. At two months, its
l3lncluding the change in scnsitive materials prices, as suggested by Christiano et al', actually in-
creases the model's out-of-sample lorecast RN{SE. Consequently, it is excluded from these regres-
sions.
874 Krueger and Kuttner
RMSE is only 2.5 basis points larger than that from the constant-adjustedfutures-based forecast.
The CEE model's relative improvement at the two-month horizonsuggests that the macroeconomic fundamentals on which it is based are
very informative for gauging the longer-term direction of the funds rate.Presumably, this reflects the Federal Reserve's systematic response to thekinds of variables included'in the CEE specification. The futures rates'better performance at the shorter one-month horizon can be explained
by the market's incorporation of information on the likely timing of fundsrate changes, such as the dates of the Federal Open Market Committee(FOMC) meetings.
Overall, the results demonstrate that month-to-month changes inthe Federal funds rate over the 1989-1994 period contain a significantpredictable element, which is reflected in the Fed funds futures rate. Thefutures rate significantly outperforms the "no change" forecast, althoughthe relatively modest improvement in RMSE suggests that many of theFed's actions surprised the financial markets. The predictable changes inthe funds rate are, however, rationally forecast by the futures market, and
the inclusion of other sources of information yields only trivial improve-ments over the futures-based forecast.
Evidence from Daily Data
The results presented above all utilize monthly average data, ignoring any
information contained in daily Fed funds futures rates. In principle, it ispossible to construct more powerful tests of the rationality hlpothesis by
exploiting the availability of daily data. The tests use a daily version of eq.
(2),
f; -1,:o.+0(L)xr4+ul
where s indexes the month, and l, the day. For k-month-ahead contracts,t € s - h. As in the monthly regressions, the x are lagged I additionaldays to account for the timing of the data releases.
Using daily data introduces two complications. One is that the var-iable being forecast is an average of daily rates. This overlap in the forecastperiods introduces moving-average serial correlation in the forecast er-rors, which distorts the estimated standard errors if left uncorrected. Fol-lowing Hansen and Hodrick (1980), the results use an estimate of the
(3)
Fed Funds Rate 475
TABLE IV
Daily Tests of Unbiasedness and Rationality: One-Month Horizon
IndicatorEstimatedConstant
Significance Level
Constant Indicator(s) R2
NoneNonborrowed reserves growth (5)Total reserves growth (5)Base growth (5)
M 1 growth (5)
M2 growth (5,1015,20)3-month paper-FF spread1-year note-FF spread30-year-FF spreadDifferenced funds rateUl Claims, weekly (10,15,20,25)Ul Claims, 4-week average ( 10)
5.94.94.84.44.58.64.95.63.95.8EO
AO
0.000.040.060.400.220.000.040.040.370.010.010.01
0.30o.320.760.62u.zt0.040.580.500.230.39o.20
0.1 050.0120.0000.0030.0310.0450.0040.0070.0000 0020.025
Notes: The lable reports the results from estimating eq. (3). The spread between the one-monlh-ahead jutures rate and theaverage Fed funds rate in that month is regressed on a constant and the indicator listed. Numbers in parentheses are thelags (in days) of the indicator included. Where none is gjven, the current day's indicator is used. The results use the 1381
daily observations from May 17, 1989, through October 31, 1994. Standard errori are correcled for heteroskedasticityandMA(22) serial correlalion as described in the text. lnterest rate data are in basis points.
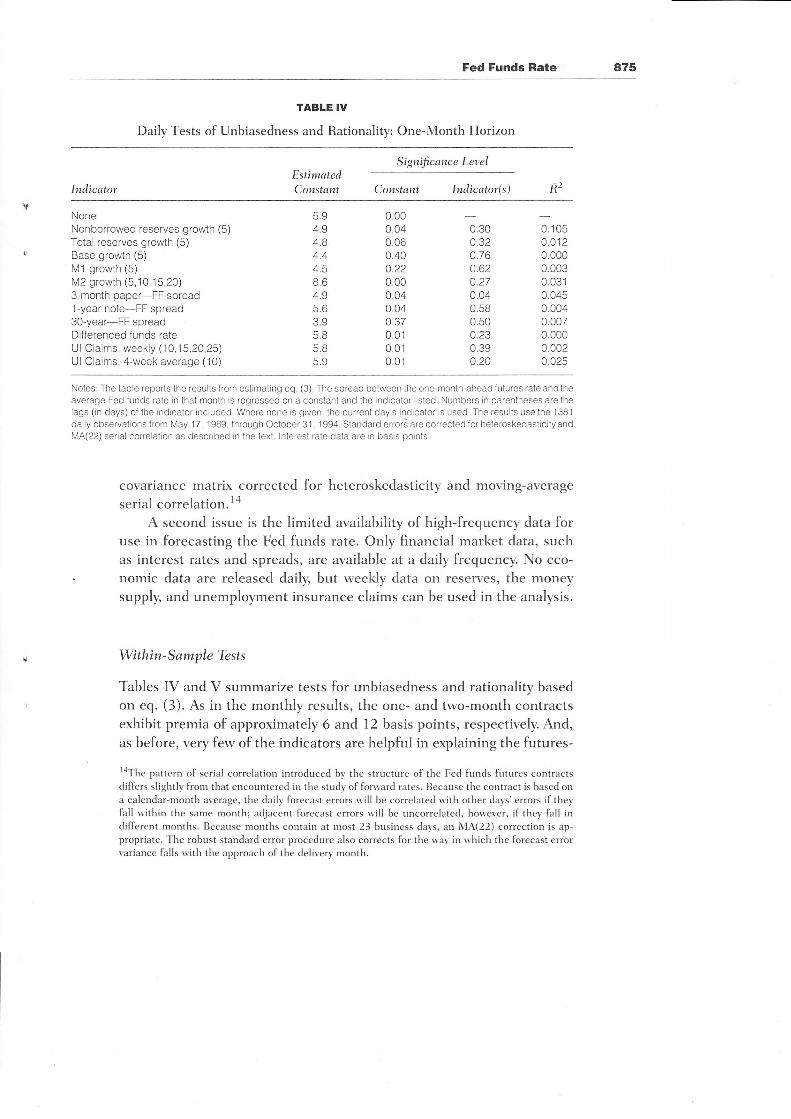
covariance matrix corrected for heteroskedasticity and moving-averageserial correlation.la
A second issue is the limited availability of high-frequency data foruse in forecasting the Fed funds rate. Only financial market data, suchas interest rates and spreads, are available at a daily frequency. No eco-
nomic data are released daily, but weekly data on reseryes, the moneysupply, and unemplo)rynent insurance claims can be used in the analysis.
Within-Sarnple Tbsts
Tables IV and V summarize tests for unbiasedness and rationality basedon eq. (3). As in the monthly results, the one- and two-month contractsexhibit premia of approximately 6 ar'd L2 basis points, respectively. And,as before, very few of the indicators are helpful in explaining the futures-
laThe pattern of serial correlation introduced by the structure of the Fed funds futures contractsdiffers slightly from that encountered in the study of forward rates. Because the contract is based ona calendar-month average, the daily forecast errors will be correlated u'ith other days' errors if theyfall within the same month; adjacent forecast errors will be uncorrelated, however, if they fall indifferent months. Because months contain at most 23 business days, an MA(22) correction is ap-propriate. The robust standard error procedure also corrects for the way in which the forecast errorvariance falls with the approach of the delivery month.

876 Krueger and Kuttner
TABLE V
Daily Tests of Unbiasedness and Rationality: Two-Month Horizon
IndicatorEstimatedConstant
Significance Lewl
Constant I ndicator(s) R2
NoneNonborrowed reserves growth (5)Total reserves growth (5)Base growth (5)
M1 growth (5)M2 growth (5 10 15,20)3-month paper-FF spread1-year note-FF spread3O-year-FF spreadDifferenced funds rateUl Claims, weekly (10,15,20,25)Ul Claims, 4-week average (10)
1'1.9
10.1
9.714.810.2t/.J10811.99.4
11.611.811.9
0.000.010.040.140.120.000.010.010.21.0.000.000.00
0.210. 13
0.720.630.040.1 30.980.610.040.960.44
0.0140.0180.0010.0020 0530.025
- 0.0010.0040.001
- 0.00.1
0.011
Notes: The table reports the results lrom estimating eq. (3). The spread between the two-month-ahead futures rate and theaverage Fed funds rate in that monlh is regressed on a conslanl and the indicator listed. The results use the 1361 dailyobservations from May 17, 1989 through September 30, 1994. See also notes to Table lV.
based forecast errors, supporting the rationality hypothesis. In the case
of the one-month-ahead forecasts, only the three-month paper to Fedfunds interest rate spread is significant at the 0.05 level; for the two-month-ahead forecasts, M2 and the differenced funds rate are significant.
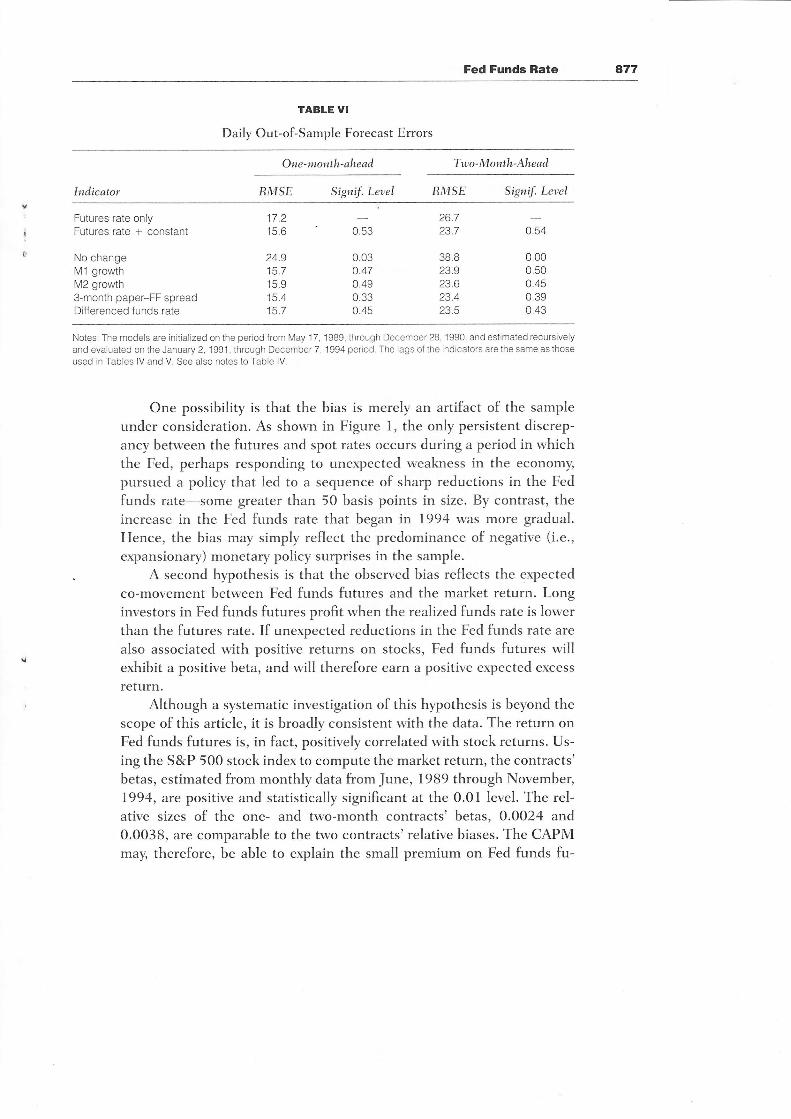
O ut - of - S ample F ore c asts
As shown in Table VI, additional information yields very little-if any-improvement in out-of-sample forecasts of the Funds rate. At the one-month horizon, including the three-month to Fed funds spread reducesthe RMSE by a mere 0.2 basis points; the other indicators make theforecasts worse. For two-month contracts, M2 and the differenced Fedfunds rate also yield slight improvements.
Explaining the Bias in the Fed FundsFutures Rate
Although the Fed funds futures rate passes the rationality tests, it failsthe tests of unbiasedness; in the 1989 to 1994 sample, the one-monthfutures rate exceeds the spot rate by six basis points, and the two-monthrate by 12. What might explain this bias?
Fed Funds Rate 477
TABLE VI
Daily Out-of-Sample Forecast Errors
lndicator
One-month-ahead
RMSE Signif. Lelel
Tuo-Month-Ahead
RMSE Signif. Leuel
Futures rate onlyFutures rate + constant
No changeM1 growthM2 growth3-month paper-FF spreadDifferenced funds rate
tt.z15.6
24.915.7t( o
15.415.7
E'
0.03o.470.490.330.45
26.723.7
38,B23923.623.4235
0.54
0.000.500.45nao0.43
Notes: The models are initialized on the period from May 17, 1989, through December 28, 1990, and estimated recursively
and evaluated on the January 2, 1991, through December 7, 1994 period. The lags of the indicators are the same as thoseused in Tables lV and V. See also notes to Table lV.
One possibility is that the bias is merely an artifact of the sampleunder consideration. As shown in Figure l, the only persistent discrep-
ancv between the futures and spot rates occurs during a period in whichthe Fed, perhaps responding to unexpected weakness in the economy,
pursued a policy that led to a sequence of sharp reductions in the Fed
funds rate-some greater than 50 basis points in size. By contrast, theincrease in the Fed funds rate that began in 1994 was more gradual.Hence, the bias may simply reflect the predominance of negative (i.e.,
expansionary) monetary policy surprises in the sample.A second hypothesis is that the observed bias reflects the expected
co-movement between Fed funds futures and the market return. Longinvestors in Fed funds futures profit when the realized funds rate is lowerthan the futures rate. If unexpected reductions in the Fed funds rate are
also associated with positive returns on stocks, Fed funds futures willexhibit a positive beta, and will therefore earn a positive expected excess
return.Although a systematic investigation of this hlpothesis is beyond the
scope of this article, it is broadly consistent with the data. The return onFed funds futures is, in fact, positively correlated with stock returns. Us-ing the S&P 500 stock index to compute the market return) the contracts'betas, estimated from monthly data from June, 1989 through November,1994, are positive and statistically significant at the 0.01 level. The rel-ative sizes of the one- and two-month contracts' betas, 0.0024 and0.0038, are comparable to the two contracts'relative biases. The CAPMmay, therefore, be able to explain the small premium on Fed funds fu-
878 Krueger and Kuttner
tures. In addition, the positive correlation between unanticipated reduc-tions in the Fed funds rate and stock market returns suggests an inter-esting avenue for future research.
CONCLUSIONS
This article analyzes the Fed funds futures rates' ability to forecast thefunds rate, and by extensirin, short-run movements in monetary policy.Three aspects of their performance are examined: first, whether the fu-tures rate is an unbiased predictor of the Fed funds rate; second, whetherthe forecast errors satisfy the rationality property implied by the efficientmarkets hypothesis; and third, the extent to which incorporating infor-mation other than the futures rate improves out-of-sample forecastingperformance.
The study's main conclusion is that although Fed funds futures rateexhibits a small premium, the market efficiently incorporates virtually allpublicly available quantitative information that can help forecast changesin the Funds rate. Although a few of the indicators examined are statis-tically significant in within-sample rationality tests, these indicators yieldonly marginal improvements in the accuracy of out-of-sample forecasts.
One important implication is that, to a large extent, month-to-monthchanges in the Federal funds rate are predictable, and the Fed fundsfutures market is very good at anticipating these changes. Traders, inves-tors, or economists interested in predicting near-term Fed actions wouldbe hard pressed to improve on the Fed funds futures rate. The futuresrate could also be used by members of the FOMC to gauge the financialmarket's expectations of its actions. (How the FOMC should use thisinformation is another question altogether.) A second implication is thatchanges in the Fed funds rate are often unanticipated, even by the futuresmarket. Economists interested in the response of financial markets andthe economy to monetary policy "shocks" should find the Fed funds fu-tures rate a simple but effective way to identifii those surprises.
BIBLIOGRAPITY
Bernanke, B. s., and Blindea A. s. (1992): "The Federal Funds Rate and theChannels of Monetary Transmissio n," American E c onomic Reuiew, 8 2 : 9 0 I -92t.
Bernanke, B. S., and Mihov, I. (1995): "Measuring Monetary policy,,'NBERWorking Paper #5 145, Cambridge: National Bureau of Economic Research.
Carlson, J. B., Mclntire, J. M., and Thomson, J. B. (1995): "Federal Funds Fu-tures as an Indicator of Future Monetary Policy: A Primer," Federal ReserveBank of Cleveland Economic Reuiew,3l:20-30.
I
fo
Fed Funds Rate 479
$
vi
Christiano, L. J., Eichenbaum, M., and Evans, C. L. (1994): "Identification andthe Effects of Monetary Policy Shocks," Working Paper #94-2, Federal Re-serve Bank of Chicago.
Cole, C. S., Impson, M., and Reichenstein, W. ( l99l ): "Do Treasury Bill FuturesRates Satisfy Rational Expectation Properties?" The Journal of Futur€s Mar-kets, ll:591-6O2.
Hafer, R.W., Hein, S. E., and MacDonald, S. Scott (1986): "Market and SurveyForecasts of the Three-Month Treasury-Bill Rate," Journal of Business,65:123-138.
Hansen, L. P., and Hodrick, R. J. (1980): "Forward Exchange Rates as OptimalPredictors of Future Spot Rates: An Econometric Analysis." Journal of Po-litical E conorny, 88:829-853.
Hedge, S. P., and McDonald, B. (1986): "On the Informational Role of TreasuryBill Futures," Tke Journal of Futures Markets, 6:629-643.
Howard, C. T. (1982): "Are T-Bill Futures Good Forecasters of Interest Rates?"The Journal of Futures Markets, l:305-3 t 5.
Kuprianov, A. (1993): "Money Market Futures," in Instruments of the MoneyMarket, Cook and LaRoche (ed.), Richmond: Federal Reserve Bank ofRichmond.
McGee, S. (1995, Jan. 30): "Futures Market Has Factored in Interest-Rate In-crease," WalI Street Journal, 7 6:Cl .
Patel, J., and Zeckhauser, R. (1990): "Treasury Bill Futures as Unbiased Predic-tors: New Evidence and Relation to Expected Inflation," Reuiew of FuturesMarkets, 8:352-369.
Rendleman, R. J., J.. and Carabini, C. E. (1979): "The Efficiency of the TreasuryBill Futures Market," Journal of Finance, 34:895-914.
Strongin, S. H. (1995): "The Identification of Monetary Policy Disturbances:Explaining the Liquidity Puzzle," Journal of Monetary Economics, 35 463-497.
"Thirty-Day Interest Rate Futures for Short-Term Interest Rate Management,"(1992): Chicago Board of Trade.