featured insight heatingwithoutglobalwarming_final
DESCRIPTION
TRANSCRIPT
2014
Secure Sustainable Together
FEATURED INSIGHT
HEATING WITHOUT GLOBAL WARMING
Market Developments and Policy Considerations for Renewable Heat
Anselm eisentrAut And AdAm Brown

2014
This paper reflects the views of the IEA Secretariat but does not necessarily reflect the views or policies of the IEA’s individual member countries. The paper does not constitute advice on any specific issue or situation. The IEA makes no representation or
warranty, express or implied, in respect of the paper’s content (including its completeness or accuracy) and shall not be responsible for any use of, or reliance on, the paper. Comments are welcome, directed to [email protected].
Secure Sustainable Together
HEATING WITHOUT GLOBAL WARMING
Market Developments and Policy Considerations for Renewable Heat
Anselm eisentrAut And AdAm Brown

INTERNATIONAL ENERGY AGENCY
The International Energy Agency (IEA), an autonomous agency, was established in November 1974. Its primary mandate was – and is – two-fold: to promote energy security amongst its member
countries through collective response to physical disruptions in oil supply, and provide authoritative research and analysis on ways to ensure reliable, affordable and clean energy for its 28 member countries and beyond. The IEA carries out a comprehensive programme of energy co-operation among its member countries, each of which is obliged to hold oil stocks equivalent to 90 days of its net imports. The Agency’s aims include the following objectives:
n Secure member countries’ access to reliable and ample supplies of all forms of energy; in particular, through maintaining effective emergency response capabilities in case of oil supply disruptions.
n Promote sustainable energy policies that spur economic growth and environmental protection in a global context – particularly in terms of reducing greenhouse-gas emissions that contribute to climate change.
n Improve transparency of international markets through collection and analysis of energy data.
n Support global collaboration on energy technology to secure future energy supplies and mitigate their environmental impact, including through improved energy
efficiency and development and deployment of low-carbon technologies.
n Find solutions to global energy challenges through engagement and dialogue with non-member countries, industry, international
organisations and other stakeholders.IEA member countries:
Australia Austria
Belgium Canada
Czech RepublicDenmark
Finland France
GermanyGreece
HungaryIreland
ItalyJapan
Korea (Republic of)LuxembourgNetherlandsNew Zealand NorwayPolandPortugalSlovak RepublicSpainSwedenSwitzerland
TurkeyUnited Kingdom
United States
The European Commission also participates in
the work of the IEA.
© OECD/IEA, 2014International Energy Agency
9 rue de la Fédération 75739 Paris Cedex 15, France
www.iea.org
Secure Sustainable Together
Please note that this publication is subject to specific restrictions that limit its use and distribution.
The terms and conditions are available online at http://www.iea.org/termsandconditionsuseandcopyright/
© OECD/IEA 2014 Heating without Global Warming Market Developments and Policy Considerations for Renewable Heat
Page | 3
Table of contents Acknowledgements ................................................................................................................... 7
Executive summary ................................................................................................................... 8
Introduction ............................................................................................................................ 11
The role of heat in today’s energy system................................................................................ 12
Definitions ............................................................................................................................... 12
Limitations ....................................................................................................................... 14
World FEH today ...................................................................................................................... 15
FEH in buildings ................................................................................................................ 15
FEH in industry ................................................................................................................. 16
Renewable energy use for heat in buildings and industry .............................................. 19
Renewable energy use for heat in buildings .................................................................... 20
Renewable energy use for heat in industry ..................................................................... 21
Bioenergy use for heat ............................................................................................................ 22
Biomass resources ................................................................................................................... 22
Bioenergy heating technologies .............................................................................................. 23
Biomass use for cooking .................................................................................................. 23
Modern solid biomass heating systems ........................................................................... 24
Biogas systems ................................................................................................................. 26
Liquid biofuels .................................................................................................................. 26
Bioenergy use for heat in buildings ......................................................................................... 26
Biogas ............................................................................................................................... 29
Bioenergy use for heat in industry .......................................................................................... 30
Bioenergy use for heat: Conclusions ....................................................................................... 31
Bioenergy technology development and RD&D needs ................................................... 32
Solar thermal energy ............................................................................................................... 33
Solar radiation ......................................................................................................................... 33
Solar thermal heat technologies ............................................................................................. 33
Non‐concentrating solar technologies ............................................................................. 34
Concentrating solar technologies .................................................................................... 36
Solar thermal energy use for heat in buildings ....................................................................... 37
Solar thermal energy use for heat in industry ......................................................................... 39
Solar thermal energy use for heat: Conclusions ...................................................................... 39
Solar thermal technology development and RD&D needs .............................................. 41
Geothermal energy ................................................................................................................. 42
Geothermal energy sources .................................................................................................... 42
Geothermal heat technologies ................................................................................................ 42
Direct use ......................................................................................................................... 42
Enhanced or engineered geothermal systems ................................................................ 43
Heating without Global Warming © OECD/IEA 2014
Market Developments and Policy Considerations for Renewable Heat
Page | 4
Geothermal energy use for heat in buildings .......................................................................... 44
Geothermal energy use for heat in industry ........................................................................... 45
Geothermal energy use for heat: Conclusions ........................................................................ 45
Geothermal technology development and RD&D needs ................................................ 46
Other enabling technologies .................................................................................................... 47
Heat pumps ............................................................................................................................. 47
Renewable electricity for heating and cooling purposes ........................................................ 49
District heating ........................................................................................................................ 50
Final energy use of commercial heat ............................................................................... 51
Heat and cold storage .............................................................................................................. 53
Sensible storage ............................................................................................................... 54
Latent heat storage .......................................................................................................... 54
Sorption heat storage ...................................................................................................... 54
Thermochemical heat storage ......................................................................................... 54
Renewable cooling technologies ............................................................................................. 55
Direct cooling systems ..................................................................................................... 55
Indirect cooling systems .................................................................................................. 55
Sorption cooling systems ................................................................................................. 55
Cooling in buildings and industry ............................................................................................ 56
District cooling ................................................................................................................. 56
Integration of heating and cooling in smart energy systems .................................................. 58
Policies for renewable heat ..................................................................................................... 59
What’s different about heat? .................................................................................................. 59
Why should renewable heat be encouraged? ......................................................................... 60
Energy security, and reduced fuel use and costs ............................................................. 60
Reducing emissions .......................................................................................................... 60
Economic benefits ............................................................................................................ 60
Energy access ................................................................................................................... 61
Policy development ................................................................................................................. 62
Economic competitiveness .............................................................................................. 63
Investor risks .................................................................................................................... 64
Institutional barriers and other issues ............................................................................. 65
Sectoral differences ......................................................................................................... 67
Policy implementation ............................................................................................................. 67
Policy best practice .................................................................................................................. 68
Outlook on the future role of renewable heating and cooling .................................................. 69
Medium‐term outlook ............................................................................................................. 69
Regional outlook .............................................................................................................. 70
Long‐term scenarios for renewable heating and cooling ........................................................ 71
Buildings sector projections: Overview ........................................................................... 71
Industry sector projections: Overview ............................................................................. 72
© OECD/IEA 2014 Heating without Global Warming Market Developments and Policy Considerations for Renewable Heat
Page | 5
Cooling demand ............................................................................................................... 73
Renewable energy use for heating and cooling in industry and buildings in the 2DS ..... 73
The role of renewable heat in an integrated energy system........................................... 76
Conclusions and policy recommendations ............................................................................... 79
Recommendations ................................................................................................................... 81
Acronyms, abbreviations and units of measure ....................................................................... 82
References .............................................................................................................................. 84
List of figures
Figure 1 • Schematic overview of energy flows from total primary energy supply (TPES) to total FEH, 2011 ......................................................................................................... 13
Figure 2 • World total FEH in the buildings sector, 2000‐11 ........................................................ 16 Figure 3 • Heat requirements by temperature range in different industry sectors ..................... 17 Figure 4 • Global FEH in industry by fuel, 2000‐11 ....................................................................... 17 Figure 5 • Global energy use for heat in industry by sector and fuel type, 2011 ......................... 18 Figure 6 • Global FEH in industry by fuel type in different regions, 2011 .................................... 18 Figure 7 • Overview of different renewable energy sources, and main technologies
to convert them into direct heat, and heat and power ............................................... 19 Figure 8 • The current state of market development of renewable energy heating
and cooling technologies ............................................................................................. 20 Figure 9 • World final renewable energy use for heat in the buildings sector, 2000‐11 .............. 21 Figure 10 • World final renewable energy use for heat in the industry sector, 2000‐11 ............... 21 Figure 11 • Advanced biomass cookstove (left) and household biogas system (right) .................. 24 Figure 12 • Solid biomass heat production costs compared to electricity
and natural gas‐based heating, 2010 ........................................................................... 25 Figure 13 • Final bioenergy use for heat in the buildings sector by region, 2000‐11 ..................... 27 Figure 14 • Share of bioenergy in energy use for space and water heating, 2010 ......................... 27 Figure 15 • Development of annual sales of wood pellet boilers and price of premium pellets
in Austria, 2000‐12 ....................................................................................................... 28 Figure 16 • Final biogas use for heat in the buildings sector by region, 2000‐11 .......................... 29 Figure 17 • Global final bioenergy use for heat in industry by sub‐sector in different regions, 2011 .. 30 Figure 18 • Solar collectors and working temperatures for different applications ........................ 34 Figure 19 • Solar hot water system with flat plate collectors on a rooftop in Jerusalem,
Israel (left), and 2 MWth solar thermal system using evacuated tubes to provide district heat in Wels, Austria (right) ............................................................................. 35
Figure 20 • Solar heat production costs compared with electricity and natural gas‐based heating in different regions ....................................................................................................... 36
Figure 21 • Scheffler dishes associated in pairs in a cooking system at Hyderabad (India) ........... 37 Figure 22 • Final solar thermal energy use for heat in the buildings sector by region, 2000‐11 ... 38 Figure 23 • Total installed solar thermal capacity in EU27 and relative collector production costs,
1995‐2020 .................................................................................................................... 40 Figure 24 • Geothermal heat production costs compared with electricity and
natural gas‐based heating ............................................................................................ 43 Figure 25 • Schematic of an EGS ..................................................................................................... 43 Figure 26 • Final geothermal energy use for heat in the buildings sector by region, 2000‐11 ...... 44 Figure 27 • Schematic of a heat pump cycle ................................................................................... 48
Heating without Global Warming © OECD/IEA 2014
Market Developments and Policy Considerations for Renewable Heat
Page | 6
Figure 28 • Representative efficiencies of air‐ and ground‐source heat pump installations in selected countries .................................................................................................... 48
Figure 29 • Share of electricity in energy use for space and water heating in selected regions, 2010 .. 50 Figure 30 • Share of commercial heat in total FEH in the buildings sector (left) and share of
renewable energy used for commercial heat in the top ten OECD member countries (right), 2011 ................................................................................... 51
Figure 31 • Share of commercial heat in total final heat consumption in the buildings sector (left) and share of renewable energy used for commercial heat (right) in the top ten non‐OECD countries, 2011 ........................................................................................... 52
Figure 32 • Large‐scale solar thermal heating and cooling plants in Europe ................................. 53 Figure 33 • Space cooling energy consumption as a share of total energy use in buildings, 2010 ... 57 Figure 34 • Installed district cooling capacity in different countries 2007, 2009 and 2011 ........... 57 Figure 35 • Overview of countries with policies related to renewable heat in place as of 2013 ... 67 Figure 36 • Global final renewable energy use for heat (excluding traditional biomass use), 2011‐18 ... 70 Figure 37 • Global renewable energy use for heat (excluding traditional biomass use)
in different regions, 2011‐18 ........................................................................................ 70 Figure 38 • World FEC in buildings in the 2DS, 2015‐50 ................................................................. 72 Figure 39 • World FEC in industry in the 2DS, 2015‐50 .................................................................. 72 Figure 40 • World final energy use for cooling in selected world regions in the 2DS, 2010‐50 ..... 73 Figure 41 • World final bioenergy use for heat in industry and buildings in the 2DS, 2015‐50 ..... 74 Figure 42 • World final solar thermal energy use for heat in industry and buildings
in the 2DS, 2015‐50 ...................................................................................................... 75 Figure 43 • World final geothermal energy use for heat in the 2DS, 2015‐50 ............................... 75 Figure 44 • Share of different fuels in FEC in buildings (left) and industry (right), 2050 ................ 76 Figure 45 • Schematic of the energy system as an intelligent energy network ............................. 77 Figure 46 • Fuel mix and CO2 intensity of district energy networks in the 2DS ............................. 77 Figure 47 • Comparison of renewable heat costs in the buildings sector compared with
natural gas and electricity‐based heating .................................................................... 79
List of boxes
Box 1 • Traditional use of biomass ................................................................................................. 23 Box 2 • Biomass as a renewable source of high‐temperature heat in industry ............................. 25 Box 3 • The growth of the Austrian wood pellet market ................................................................ 28 Box 4 • Charcoal in the Brazilian iron industry ............................................................................... 30 Box 5 • Solar thermal district heating: A Danish success story ...................................................... 53 Box 6 • Biomass pellets in China ..................................................................................................... 61

© OECD/IEA 2014 Heating without Global Warming Market Developments and Policy Considerations for Renewable Heat
Page | 7
Acknowledgements This publication was prepared by the International Energy Agency (IEA) Renewable Energy Division. Anselm Eisentraut was the project co‐ordinator and lead author of the study. Adam Brown co‐authored the paper and provided valuable guidance during the process. Yasmina Abdelilah made an invaluable contribution by compiling IEA statistical data and drafting the methodological section of this report.
Paolo Frankl, head of the Renewable Energy Division, offered important guidance and input. Several other IEA colleagues also provided valuable contributions, including John Dulac, Araceli Fernandes, Marc LaFrance, Simone Landolina, Luis Munuera, Cedric Philibert, and Uwe Remme.
The authors would also like to thank Kristine Douaud, who skilfully edited the document, as well as the IEA publication unit, in particular Muriel Custodio, Rebecca Gaghen, Angela Gosmann, Bertrand Sadin, Therese Walsh and Robert Youngblood.
This study has benefitted from a wide range of comments and other valuable input received from a number of external reviewers:
Thore Sixten Berntsson (IEA IETS), Bärbel Epp (Solrico), Zuzana Dobrotkova (IRENA), Uli Jakob (Green Chiller – Association for Sorption Cooling), Krzysztof Laskowski (Euroheat & Power), Kristian Petrick (IEA RETD), Robin Wiltshire (IEA DHC), Werner Weiss (AEE INTEC/IEA SHC).
For more information on this publication, please contact:
Anselm Eisentraut, IEA Energy Analyst E‐mail: [email protected]
Heating without Global Warming © OECD/IEA 2014
Market Developments and Policy Considerations for Renewable Heat
Page | 8
Executive summary
Why promote renewable heat?
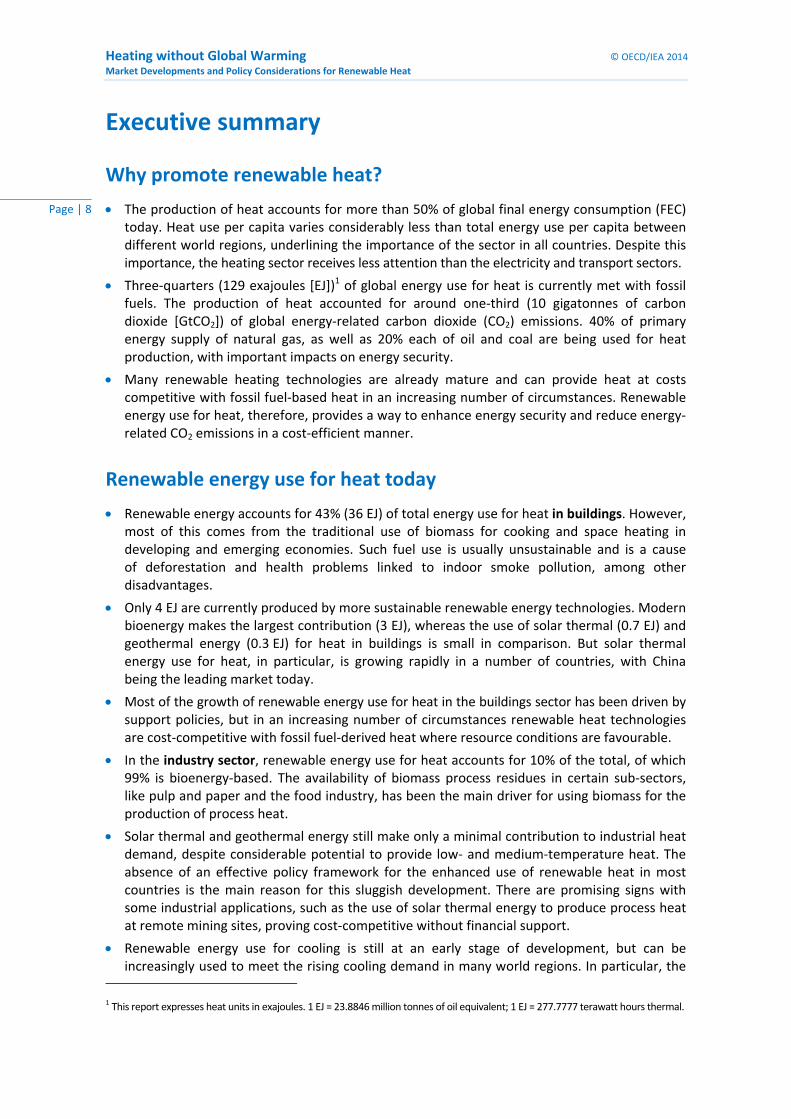
The production of heat accounts for more than 50% of global final energy consumption (FEC) today. Heat use per capita varies considerably less than total energy use per capita between different world regions, underlining the importance of the sector in all countries. Despite this importance, the heating sector receives less attention than the electricity and transport sectors.
Three‐quarters (129 exajoules [EJ])1 of global energy use for heat is currently met with fossil fuels. The production of heat accounted for around one‐third (10 gigatonnes of carbon dioxide [GtCO2]) of global energy‐related carbon dioxide (CO2) emissions. 40% of primary energy supply of natural gas, as well as 20% each of oil and coal are being used for heat production, with important impacts on energy security.
Many renewable heating technologies are already mature and can provide heat at costs competitive with fossil fuel‐based heat in an increasing number of circumstances. Renewable energy use for heat, therefore, provides a way to enhance energy security and reduce energy‐related CO2 emissions in a cost‐efficient manner.
Renewable energy use for heat today
Renewable energy accounts for 43% (36 EJ) of total energy use for heat in buildings. However, most of this comes from the traditional use of biomass for cooking and space heating in developing and emerging economies. Such fuel use is usually unsustainable and is a cause of deforestation and health problems linked to indoor smoke pollution, among other disadvantages.
Only 4 EJ are currently produced by more sustainable renewable energy technologies. Modern bioenergy makes the largest contribution (3 EJ), whereas the use of solar thermal (0.7 EJ) and geothermal energy (0.3 EJ) for heat in buildings is small in comparison. But solar thermal energy use for heat, in particular, is growing rapidly in a number of countries, with China being the leading market today.
Most of the growth of renewable energy use for heat in the buildings sector has been driven by support policies, but in an increasing number of circumstances renewable heat technologies are cost‐competitive with fossil fuel‐derived heat where resource conditions are favourable.
In the industry sector, renewable energy use for heat accounts for 10% of the total, of which 99% is bioenergy‐based. The availability of biomass process residues in certain sub‐sectors, like pulp and paper and the food industry, has been the main driver for using biomass for the production of process heat.
Solar thermal and geothermal energy still make only a minimal contribution to industrial heat demand, despite considerable potential to provide low‐ and medium‐temperature heat. The absence of an effective policy framework for the enhanced use of renewable heat in most countries is the main reason for this sluggish development. There are promising signs with some industrial applications, such as the use of solar thermal energy to produce process heat at remote mining sites, proving cost‐competitive without financial support.
Renewable energy use for cooling is still at an early stage of development, but can be increasingly used to meet the rising cooling demand in many world regions. In particular, the
1 This report expresses heat units in exajoules. 1 EJ = 23.8846 million tonnes of oil equivalent; 1 EJ = 277.7777 terawatt hours thermal.
© OECD/IEA 2014 Heating without Global Warming Market Developments and Policy Considerations for Renewable Heat
Page | 9
use of solar thermal heat for cooling has the potential to reduce electricity loads for air conditioning during hot summer months, but further system development and cost reductions are needed to enhance market penetration.
Policy measures
Renewable energy use for heat continues to grow slowly, but its current contribution in buildings and industry is still small, with the exception of traditional biomass use, compared with that of fossil fuels. Only about 40 countries worldwide have adopted renewable heat policies to date, compared to more than 100 that have policies for renewable electricity in place. The policy situation is very patchy, and neighbouring countries with similar resources have different approaches.
Given the important role that renewable energy use for heat and cooling can play in achieving strategic energy policy goals, such as energy security, emissions reductions and energy access, more attention needs to be given to the heating and cooling sector and renewable energy use for these purposes in particular.
Renewable energy use for heat should be included in low‐carbon energy strategies, but plans need to be based on a detailed local appraisal of both potentials and barriers. The focus should be on the technologies best able to make a cost‐effective contribution, and a sector‐specific approach should be taken.
A supportive policy framework which addresses the economic and institutional barriers is needed to help the technologies into the marketplace. Measures targeting specific barriers are likely to be more cost‐effective than financial support measures on their own.
One principal aim of policy must be to encourage cost reductions and a competitive supply chain for renewable heating technologies. More effort is needed to understand the differences between system costs in different markets and to see which policies are most effective in stimulating the cost‐competitive use of renewable energy for heat.
In the buildings sector, renewable heat programmes need to be carefully co‐ordinated with energy efficiency measures to develop a whole‐system approach which can be embodied in building codes and regulations, once the technologies are established and cost‐competitive.
To enhance the use of renewable heat, in industrial applications in particular, more research, development and demonstration (RD&D) is needed to commercialise renewable heat technologies and replace fossil fuels in low‐ and medium‐ as well as high‐temperature processes.
Future prospects and development needs
In the longer term, the role of heat production in a low‐carbon energy supply system may differ radically from that of today. Improved insulation will reduce building heating needs and process improvements will reduce industrial heat requirements. Electricity, heat and transport systems will need to be better integrated to deliver cost‐efficient, low‐carbon energy solutions.
In addition to renewable heat sources for direct use, a range of technologies, including efficient heat pumps, the use of waste heat from co‐generation and industry, or the use of renewable electricity for heating, also have significant potential to contribute to global energy use for heat in buildings and industry. Opportunities for renewable heat in such a system will differ from those of today, particularly with more emphasis on industrial heating applications which are difficult to decarbonise in other ways.

Heating without Global Warming © OECD/IEA 2014
Market Developments and Policy Considerations for Renewable Heat
Page | 10
Measures designed to help the technologies into the market need to be complemented by RD&D on selected technologies that will be important in this low‐carbon future, including:
large‐scale biomass torrefaction plants for production of bio‐coal suitable to replace coke and coal in high‐temperature industrial applications
solar thermal heating for medium‐temperature heat for industrial applications, including storage to match heat availability with industrial demand
enhanced geothermal systems with co‐generation units, which would significantly enlarge the potential for geothermal electricity and heat production
heat‐driven renewable cooling technologies and systems for buildings and industry, including cold storage
large‐scale thermal storage systems for cold and heat storage over extended periods.
© OECD/IEA 2014 Heating without Global Warming Market Developments and Policy Considerations for Renewable Heat
Page | 11
Introduction The production of heat weighs heavily on our final energy demand, and more energy is used for heat production than, for example, for transport. Producing this heat requires using fuels that have a strong impact on global energy security, and whose emissions from energy use are significant. Heat is used in the supply sector in power generation in thermal power plants, for instance, as well as in the end‐use sector in buildings and industry. It plays an important role in all energy economies in all regions of the world, not just in colder climates or developed economies. The use of energy for heating purposes has been growing steadily and is expected to continue growing in the future. The same holds true for the energy use for cooling, though the latter currently accounts for only a small share of global energy use.
So far, renewable energy plays a relatively minor role in the heat sector – the exception being the traditional, inefficient use of biomass for cooking and heating, which has proven a source of serious environmental and health effects. There is a range of commercially available renewable technologies which can contribute to energy needs for heat. In the right conditions, these technologies can already be competitive with fossil fuel sources. So far, however, the renewable heat sector has not been addressed by policy makers with the same vigour as have the renewable electricity and transport markets. This is due in part to the fact that the sector is more complex and diverse, and less amenable to regulation. Yet renewable heat can offer effective solutions to the challenges of ensuring energy security and supply, and can help limit climate change. The deployment of cost‐competitive renewable heat solutions, coupled with energy efficiency measures, could therefore allow broader energy and climate goals to be achieved more cost‐effectively.
While progress in the deployment of renewable heat has not been as rapid, sustained or widespread as for renewable electricity, there are signs of significant growth. In some cases, these are driven mainly by economically attractive market opportunities – for example, the rapid growth of solar water heating in China and in some Mediterranean countries, or the widespread deployment of geothermal energy use for heat in Iceland. In other cases, a more concerted policy effort is helping galvanise the market. This is particularly the case in the European Union where, under the Renewable Energy Directive, mandatory 2020 targets for renewable energy apply to all energy consumption. Renewable energy use for heating and cooling is an important component of the National Renewable Energy Action Plans established by each European Union (EU) member state to meet 2020 targets for renewable energy. Globally, a broad range of policy mechanisms are being used by governments to stimulate the renewable heat market in order to achieve different objectives, such as energy security and emissions reductions. However, relatively few countries are giving renewable heat priority in their energy strategies. Successful deployment in one country is not being replicated in neighbouring countries with similar renewable resources and energy needs.
The initial signs of growth for renewable heat highlight some issues. The data on renewable energy use for heat suffer from a number of deficiencies, such as data quality and availability, as well as methodological issues. There is also a need to improve some definitions and conventions.
This publication reviews the current technological status of different technologies, and highlights market and policy trends to identify opportunities to replicate successful technology and policy initiatives in a broader range of situations. Another aim is to look at the role of renewable energy use for heating and cooling in long‐term reduction of fossil energy demand and use; this is especially vital if significant emissions reductions in the energy sector are to be achieved.
Energy use for cooling, and the potential contribution of renewable heat for cooling, will be discussed at several places in this publication, but is not in the key focus of the analysis.
Heating without Global Warming © OECD/IEA 2014
Market Developments and Policy Considerations for Renewable Heat
Page | 12
The role of heat in today’s energy system
Definitions
Heat can be used for space heating, warming water, cooking, and various industrial processes. Due to the variety of energy sources and end uses, heat can be produced and consumed at many scales, ranging from very small domestic applications at the local level to large‐scale use in industrial processes and district heating networks. One important characteristic of heat is that it can be produced from different fuels, and be provided at different temperature levels. In the following descriptions, heat‐temperature ranges will be defined as low (<100 degrees Celsius [°C]), medium (100°C to 400°C) and high (>400°C). Temperature levels are important to define the suitability of different supply technologies to meet specific heat requirements in the various end‐use sectors.
Tracking all of these heat flows down to the end‐use application with precision is virtually impossible, as it requires monitoring a number of parameters which vary greatly by end use and by sector (residential, commercial, industry, etc.). Therefore, this paper uses data to approximate heat use and calls it the final energy use for heat (FEH).
The FEH indicator is calculated from the International Energy Agency (IEA) energy balances (IEA, 2013c, 2013d). Under this convention, energy related to the use of heat can be reported either as commercial heat or final energy consumption (FEC).
Commercial heat is defined in IEA statistics as heat that is produced and sold to a different end user. The heat is produced through co‐generation or heat plants and is often distributed through district heating networks. The heat can also be bought and sold, for instance between neighbouring industrial complexes. The transaction associated with purchased heat produces a reliable data point for national administrations to collect in a consistent manner, hence the category “heat” is reserved for these quantities in IEA statistics.
Most heat is not sold, however, because it is produced and consumed directly on‐site, through space heating for homes or industrial processes on a manufacturing site. Due to the variety of end uses, useful heat outputs are rarely measured unless there is a commercial need or financial incentive to invest in measuring the useful heat outputs at the end‐user level. While national administrations are beginning to recognise the importance of such data and beginning to track energy efficiency indicators at the end‐user level, most data are not yet available for cross‐country comparisons. In lieu of such precise data, the FEC is increasingly recognised as an indicator of heat use in many national statistics and tracking schemes.
Global energy use for heat in industry, buildings and other sectors reached 172 EJ in 2011. It thus accounts for one‐third of global primary energy supply, and more than half of world FEC.
Three‐quarters of final energy use for heat (FEH) is provided by fossil fuels, leading to around 10 GtCO2 emissions per year, one‐third of the global total in the energy sector.
Traditional biomass use accounted for 90% (32 EJ) of total energy use for heat in the buildings sector in 2011, but the use of modern bioenergy, solar thermal and geothermal energy is growing rapidly, though from a relatively low level.
Industry FEH is primarily met with fossil fuels, accounting for 90% of the total. Bioenergy is the only sizeable renewable energy source of heat today, and contributed 10% (8 EJ) to FEH in industry in 2011.
© OECD/IEA 2014 Heating without Global Warming Market Developments and Policy Considerations for Renewable Heat
Page | 13
FEC is defined as the amount of energy delivered in the form of fuel to the end user at the sectoral level and is also referred to as direct use for heat. It is important to note that this is the amount of energy consumed to generate heat for end‐use services rather than the output of useful heat itself. For example, the energy content of biomass delivered to private houses represents the FEC of biomass to the residential sector. Once the wood is combusted in the fireplace, inducing some transformation losses, the heat that raises the temperature of the living space represents the useful heat outputs.
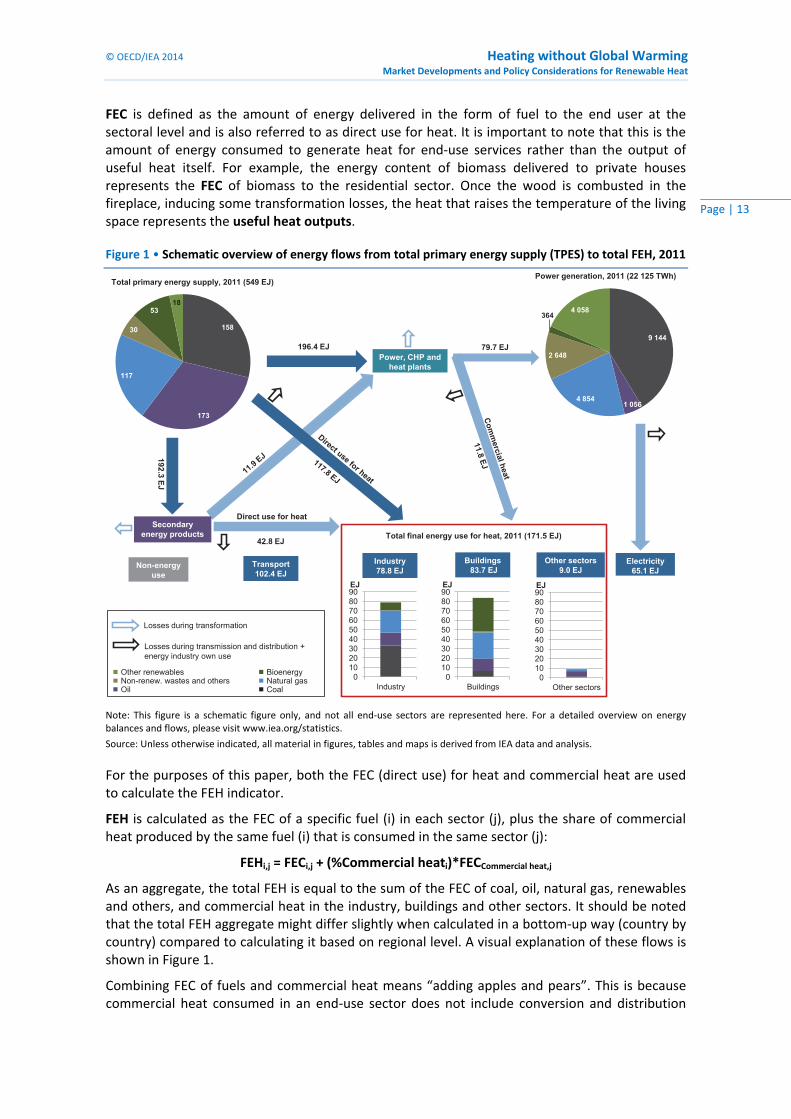
Figure 1 • Schematic overview of energy flows from total primary energy supply (TPES) to total FEH, 2011
Total primary energy supply, 2011 (549 EJ)
Secondary energy products
Direct use for heat
Power, CHP and heat plants
Total final energy use for heat, 2011 (171.5 EJ)
Electricity 65.1 EJ
Transport 102.4 EJ
Non-energy use
42.8 EJ
Power generation, 2011 (22 125 TWh)
192.3 EJLosses during transformation
Losses during transmission and distribution + energy industry own use
196.4 EJ 79.7 EJ
Industry 78.8 EJ
Buildings 83.7 EJ
Other sectors 9.0 EJ
9 144
1 0564 854
2 648
3644 058
158
173
117
30
5318
0102030405060708090
Industry
EJ
0102030405060708090
Buildings
EJ
0102030405060708090
Other sectors
EJ
Other renewables BioenergyNon-renew. wastes and others Natural gasOil Coal
Note: This figure is a schematic figure only, and not all end‐use sectors are represented here. For a detailed overview on energy balances and flows, please visit www.iea.org/statistics.
Source: Unless otherwise indicated, all material in figures, tables and maps is derived from IEA data and analysis.
For the purposes of this paper, both the FEC (direct use) for heat and commercial heat are used to calculate the FEH indicator.
FEH is calculated as the FEC of a specific fuel (i) in each sector (j), plus the share of commercial heat produced by the same fuel (i) that is consumed in the same sector (j):
FEHi,j = FECi,j + (%Commercial heati)*FECCommercial heat,j
As an aggregate, the total FEH is equal to the sum of the FEC of coal, oil, natural gas, renewables and others, and commercial heat in the industry, buildings and other sectors. It should be noted that the total FEH aggregate might differ slightly when calculated in a bottom‐up way (country by country) compared to calculating it based on regional level. A visual explanation of these flows is shown in Figure 1.
Combining FEC of fuels and commercial heat means “adding apples and pears”. This is because commercial heat consumed in an end‐use sector does not include conversion and distribution
Heating without Global Warming © OECD/IEA 2014
Market Developments and Policy Considerations for Renewable Heat
Page | 14
losses in the order of roughly 10% to 20% that occurred during conversion of the primary energy input into commercial heat and during its distribution to the end user. However, since commercial heat accounts for less than 7% of total FEH, the overall difference between the numbers presented here and the actual primary energy content are in the range of 0.7% to 1.4% and thus negligible.
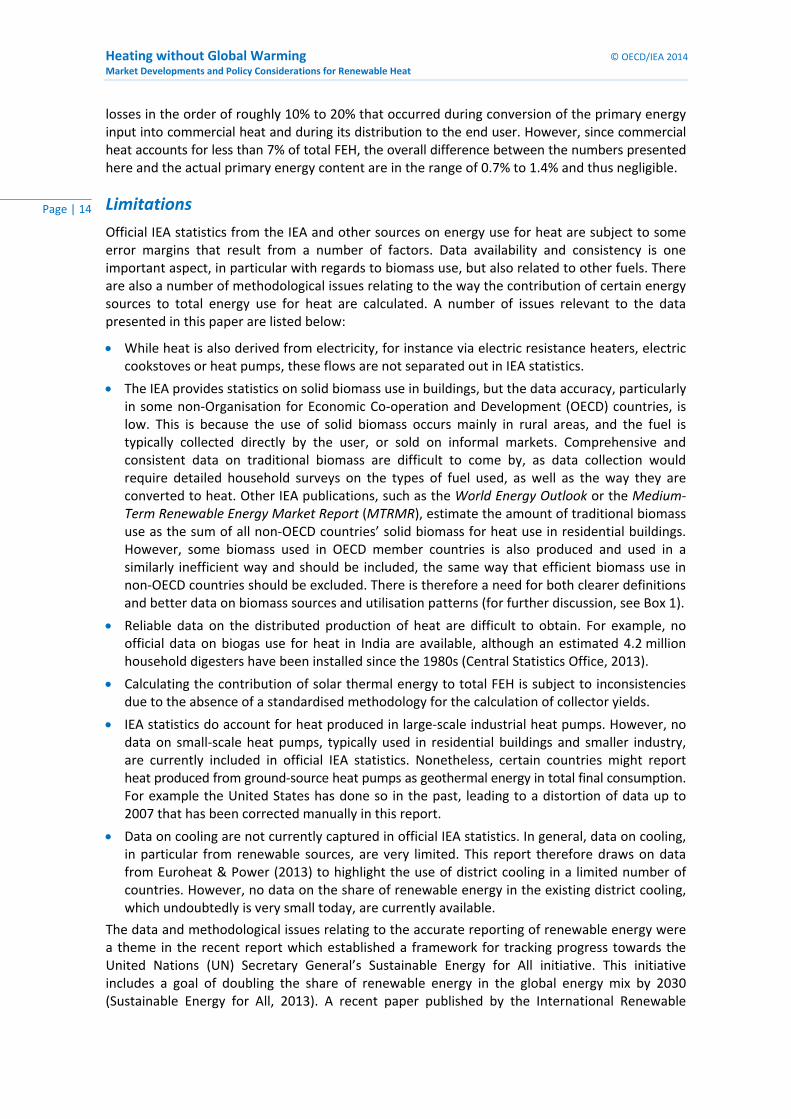
Limitations
Official IEA statistics from the IEA and other sources on energy use for heat are subject to some error margins that result from a number of factors. Data availability and consistency is one important aspect, in particular with regards to biomass use, but also related to other fuels. There are also a number of methodological issues relating to the way the contribution of certain energy sources to total energy use for heat are calculated. A number of issues relevant to the data presented in this paper are listed below:
While heat is also derived from electricity, for instance via electric resistance heaters, electric cookstoves or heat pumps, these flows are not separated out in IEA statistics.
The IEA provides statistics on solid biomass use in buildings, but the data accuracy, particularly in some non‐Organisation for Economic Co‐operation and Development (OECD) countries, is low. This is because the use of solid biomass occurs mainly in rural areas, and the fuel is typically collected directly by the user, or sold on informal markets. Comprehensive and consistent data on traditional biomass are difficult to come by, as data collection would require detailed household surveys on the types of fuel used, as well as the way they are converted to heat. Other IEA publications, such as the World Energy Outlook or the Medium‐Term Renewable Energy Market Report (MTRMR), estimate the amount of traditional biomass use as the sum of all non‐OECD countries’ solid biomass for heat use in residential buildings. However, some biomass used in OECD member countries is also produced and used in a similarly inefficient way and should be included, the same way that efficient biomass use in non‐OECD countries should be excluded. There is therefore a need for both clearer definitions and better data on biomass sources and utilisation patterns (for further discussion, see Box 1).
Reliable data on the distributed production of heat are difficult to obtain. For example, no official data on biogas use for heat in India are available, although an estimated 4.2 million household digesters have been installed since the 1980s (Central Statistics Office, 2013).
Calculating the contribution of solar thermal energy to total FEH is subject to inconsistencies due to the absence of a standardised methodology for the calculation of collector yields.
IEA statistics do account for heat produced in large‐scale industrial heat pumps. However, no data on small‐scale heat pumps, typically used in residential buildings and smaller industry, are currently included in official IEA statistics. Nonetheless, certain countries might report heat produced from ground‐source heat pumps as geothermal energy in total final consumption. For example the United States has done so in the past, leading to a distortion of data up to 2007 that has been corrected manually in this report.
Data on cooling are not currently captured in official IEA statistics. In general, data on cooling, in particular from renewable sources, are very limited. This report therefore draws on data from Euroheat & Power (2013) to highlight the use of district cooling in a limited number of countries. However, no data on the share of renewable energy in the existing district cooling, which undoubtedly is very small today, are currently available.
The data and methodological issues relating to the accurate reporting of renewable energy were a theme in the recent report which established a framework for tracking progress towards the United Nations (UN) Secretary General’s Sustainable Energy for All initiative. This initiative includes a goal of doubling the share of renewable energy in the global energy mix by 2030 (Sustainable Energy for All, 2013). A recent paper published by the International Renewable

© OECD/IEA 2014 Heating without Global Warming Market Developments and Policy Considerations for Renewable Heat
Page | 15
Energy Agency (IRENA) builds on this goal and discusses, among other subjects, some of the statistical issues related to bioenergy and distributed renewable energy (IRENA, 2013).
To enhance data accuracy and thus the potential for a detailed analysis of renewable energy use for heat in different end‐use sectors, governments should encourage their statistical offices to improve data accuracy, and international organisations should engage in capacity building to enhance data quality and reporting. Regular surveys on bioenergy use in a given country, in particular in developing countries, would help provide more accurate data to better assess the share of bioenergy in FEH. In addition, international standards should be established on the collection of data regarding heat pumps’ contribution towards energy use for heat in buildings and industry, including information on the efficiency of installed systems.
World FEH today
World TPES stood at 549 EJ2 in 2011. About 32% of this energy was supplied by coal, followed by oil at 29% and natural gas at 21%. Bioenergy was the largest renewable source of energy, accounting for 10% of world TPES, with other renewables contributing 3%.
Figure 1 shows, in a simplified manner, the flow of primary energy to various transformation and end‐use sectors, focussing on FEH. Some of the primary fuels, such as natural gas or biomass, are typically used directly for heat production in industry and buildings, while others such as oil are transformed prior to such use. In addition, commercial heat from heat and co‐generation plants typically makes its way to the industry and buildings sector through district heating networks.
Total FEH, consisting of the direct use of different fuels plus the consumption of the share of commercial heat produced by the same source, reached 172 EJ in 2011. Around one‐third of TPES in 2011 was diverted towards FEH, with around 15% each being consumed in the industry and buildings sectors.
Looking at the different fuel sources underlines the energy security implications for total FEH globally.
More than 40% of primary energy supply of natural gas is used for heat production in industry and buildings.
In addition, around 20% each of world primary supply of coal and oil are used for the same purpose.
Out of the 54 EJ of primary bioenergy supply in 2011, more than 80% were used for heat production in buildings, and a smaller amount (15% of the total) was used in industry.
Replacing fossil fuel energy use for heat with renewable energy thus has a strong impact on CO2 emissions: energy use for heat accounts for more than 10 GtCO2, or one‐third of global energy‐related CO2 emissions (IEA, 2013e). In addition, replacing fossil fuels with renewable energy sources improves energy security, in particular for countries that rely heavily on fossil fuel imports of to meet their energy demand.
FEH in buildings
The buildings sector accounts for the largest consumption of heat in most countries around the world. The most important uses within the sector are for cooking, hot water and space heating, most of which require low‐temperature heat of less than 100°C. The low‐temperature requirement is an important characteristic, as it means that various renewable energy technologies can be used to – partially or entirely – meet the sector’s heat demand. Two profiles of energy demand for heating and cooling can be identified within the buildings sector: residential buildings and
2 This report expresses heat units in exajoules. 1 EJ = 23.8846 million tonnes of oil equivalent; 1 EJ = 277.7777 terawatt hours thermal.
Heating without Global Warming © OECD/IEA 2014
Market Developments and Policy Considerations for Renewable Heat
Page | 16
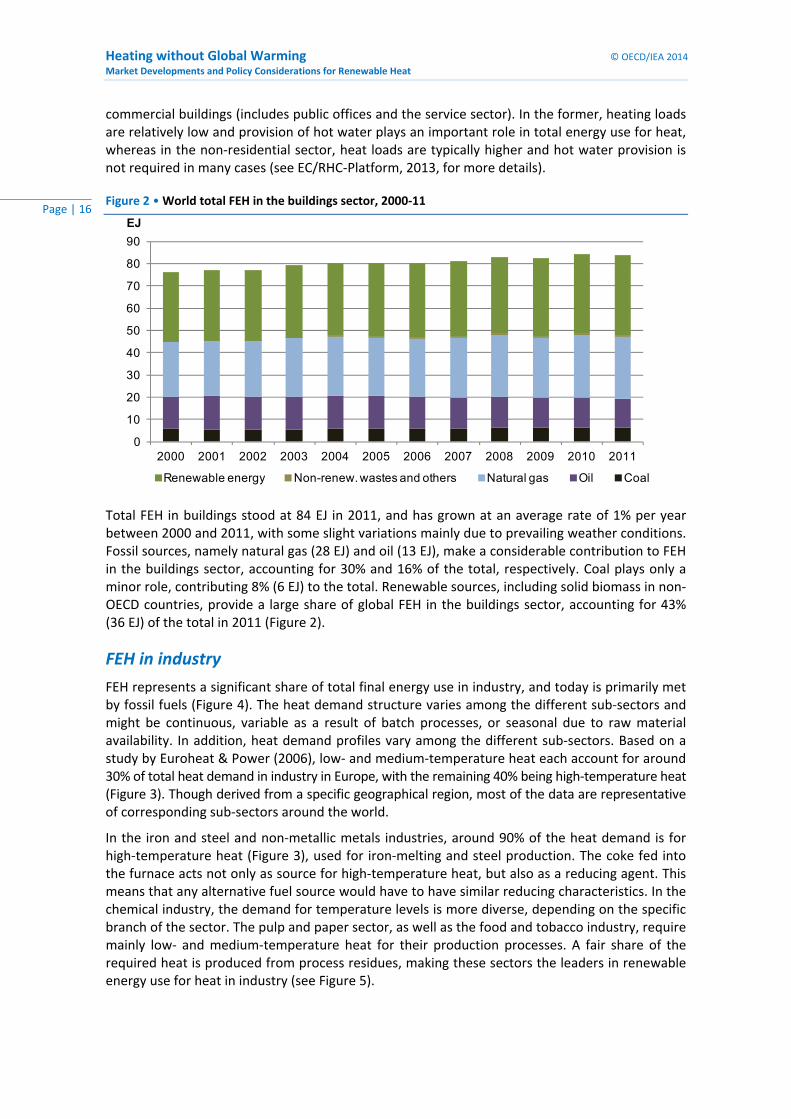
commercial buildings (includes public offices and the service sector). In the former, heating loads are relatively low and provision of hot water plays an important role in total energy use for heat, whereas in the non‐residential sector, heat loads are typically higher and hot water provision is not required in many cases (see EC/RHC‐Platform, 2013, for more details).
Figure 2 • World total FEH in the buildings sector, 2000‐11
0
10
20
30
40
50
60
70
80
90
2000 2001 2002 2003 2004 2005 2006 2007 2008 2009 2010 2011
EJ
Renewable energy Non-renew. wastes and others Natural gas Oil Coal
Total FEH in buildings stood at 84 EJ in 2011, and has grown at an average rate of 1% per year between 2000 and 2011, with some slight variations mainly due to prevailing weather conditions. Fossil sources, namely natural gas (28 EJ) and oil (13 EJ), make a considerable contribution to FEH in the buildings sector, accounting for 30% and 16% of the total, respectively. Coal plays only a minor role, contributing 8% (6 EJ) to the total. Renewable sources, including solid biomass in non‐OECD countries, provide a large share of global FEH in the buildings sector, accounting for 43% (36 EJ) of the total in 2011 (Figure 2).
FEH in industry
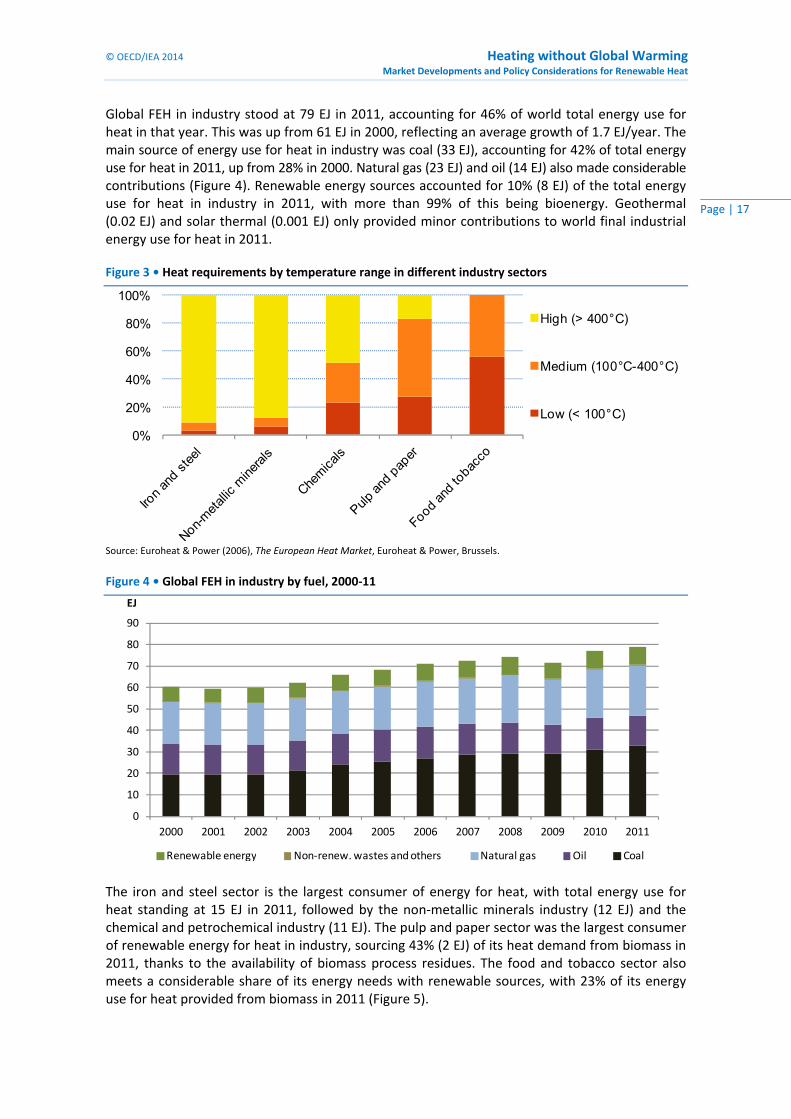
FEH represents a significant share of total final energy use in industry, and today is primarily met by fossil fuels (Figure 4). The heat demand structure varies among the different sub‐sectors and might be continuous, variable as a result of batch processes, or seasonal due to raw material availability. In addition, heat demand profiles vary among the different sub‐sectors. Based on a study by Euroheat & Power (2006), low‐ and medium‐temperature heat each account for around 30% of total heat demand in industry in Europe, with the remaining 40% being high‐temperature heat (Figure 3). Though derived from a specific geographical region, most of the data are representative of corresponding sub‐sectors around the world.
In the iron and steel and non‐metallic metals industries, around 90% of the heat demand is for high‐temperature heat (Figure 3), used for iron‐melting and steel production. The coke fed into the furnace acts not only as source for high‐temperature heat, but also as a reducing agent. This means that any alternative fuel source would have to have similar reducing characteristics. In the chemical industry, the demand for temperature levels is more diverse, depending on the specific branch of the sector. The pulp and paper sector, as well as the food and tobacco industry, require mainly low‐ and medium‐temperature heat for their production processes. A fair share of the required heat is produced from process residues, making these sectors the leaders in renewable energy use for heat in industry (see Figure 5).
© OECD/IEA 2014 Heating without Global Warming Market Developments and Policy Considerations for Renewable Heat
Page | 17
Global FEH in industry stood at 79 EJ in 2011, accounting for 46% of world total energy use for heat in that year. This was up from 61 EJ in 2000, reflecting an average growth of 1.7 EJ/year. The main source of energy use for heat in industry was coal (33 EJ), accounting for 42% of total energy use for heat in 2011, up from 28% in 2000. Natural gas (23 EJ) and oil (14 EJ) also made considerable contributions (Figure 4). Renewable energy sources accounted for 10% (8 EJ) of the total energy use for heat in industry in 2011, with more than 99% of this being bioenergy. Geothermal (0.02 EJ) and solar thermal (0.001 EJ) only provided minor contributions to world final industrial energy use for heat in 2011.
Figure 3 • Heat requirements by temperature range in different industry sectors
0%
20%
40%
60%
80%
100%
High (> 400°C)
Medium (100°C-400°C)
Low (< 100°C)
Source: Euroheat & Power (2006), The European Heat Market, Euroheat & Power, Brussels.
Figure 4 • Global FEH in industry by fuel, 2000‐11
0
10
20
30
40
50
60
70
80
90
2000 2001 2002 2003 2004 2005 2006 2007 2008 2009 2010 2011
EJ
Renewable energy Non‐renew. wastes and others Natural gas Oil Coal
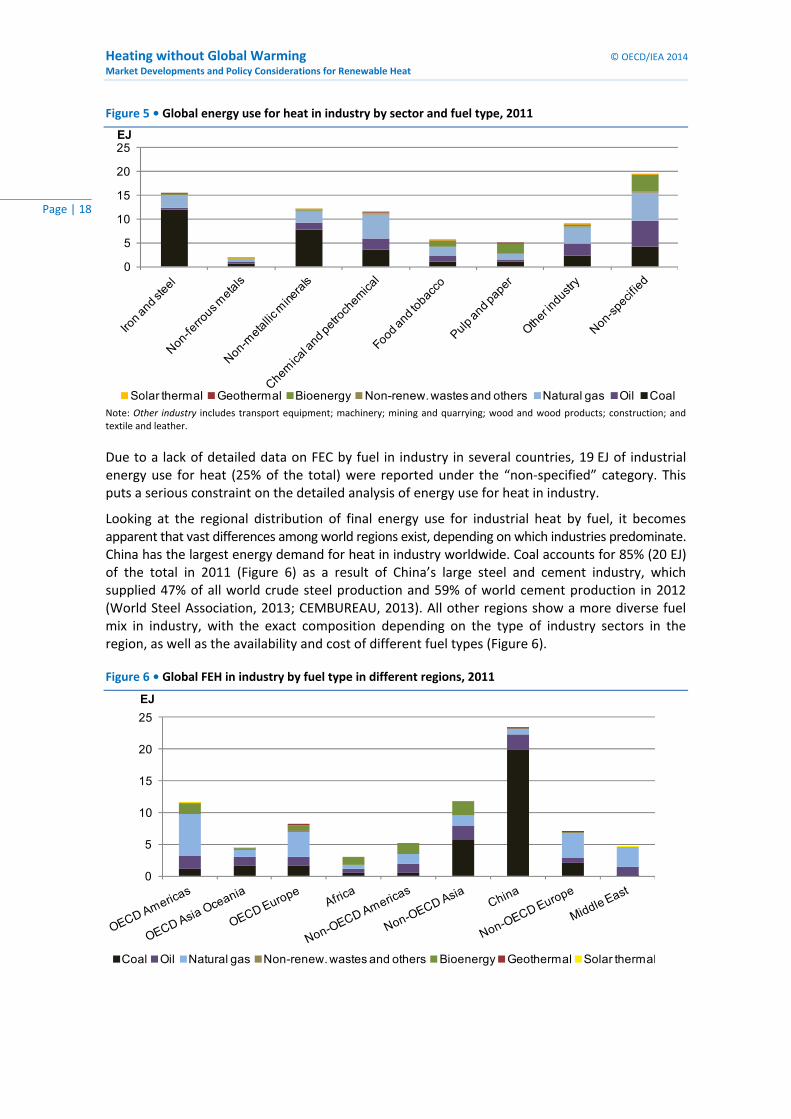
The iron and steel sector is the largest consumer of energy for heat, with total energy use for heat standing at 15 EJ in 2011, followed by the non‐metallic minerals industry (12 EJ) and the chemical and petrochemical industry (11 EJ). The pulp and paper sector was the largest consumer of renewable energy for heat in industry, sourcing 43% (2 EJ) of its heat demand from biomass in 2011, thanks to the availability of biomass process residues. The food and tobacco sector also meets a considerable share of its energy needs with renewable sources, with 23% of its energy use for heat provided from biomass in 2011 (Figure 5).
Heating without Global Warming © OECD/IEA 2014
Market Developments and Policy Considerations for Renewable Heat
Page | 18
Figure 5 • Global energy use for heat in industry by sector and fuel type, 2011
0
5
10
15
20
25EJ
Solar thermal Geothermal Bioenergy Non-renew. wastes and others Natural gas Oil Coal Note: Other industry includes transport equipment; machinery; mining and quarrying; wood and wood products; construction; and textile and leather.
Due to a lack of detailed data on FEC by fuel in industry in several countries, 19 EJ of industrial energy use for heat (25% of the total) were reported under the “non‐specified” category. This puts a serious constraint on the detailed analysis of energy use for heat in industry.
Looking at the regional distribution of final energy use for industrial heat by fuel, it becomes apparent that vast differences among world regions exist, depending on which industries predominate. China has the largest energy demand for heat in industry worldwide. Coal accounts for 85% (20 EJ) of the total in 2011 (Figure 6) as a result of China’s large steel and cement industry, which supplied 47% of all world crude steel production and 59% of world cement production in 2012 (World Steel Association, 2013; CEMBUREAU, 2013). All other regions show a more diverse fuel mix in industry, with the exact composition depending on the type of industry sectors in the region, as well as the availability and cost of different fuel types (Figure 6).
Figure 6 • Global FEH in industry by fuel type in different regions, 2011
0
5
10
15
20
25
EJ
Coal Oil Natural gas Non-renew. wastes and others Bioenergy Geothermal Solar thermal
© OECD/IEA 2014 Heating without Global Warming Market Developments and Policy Considerations for Renewable Heat
Page | 19
Renewable energy use for heat in buildings and industry
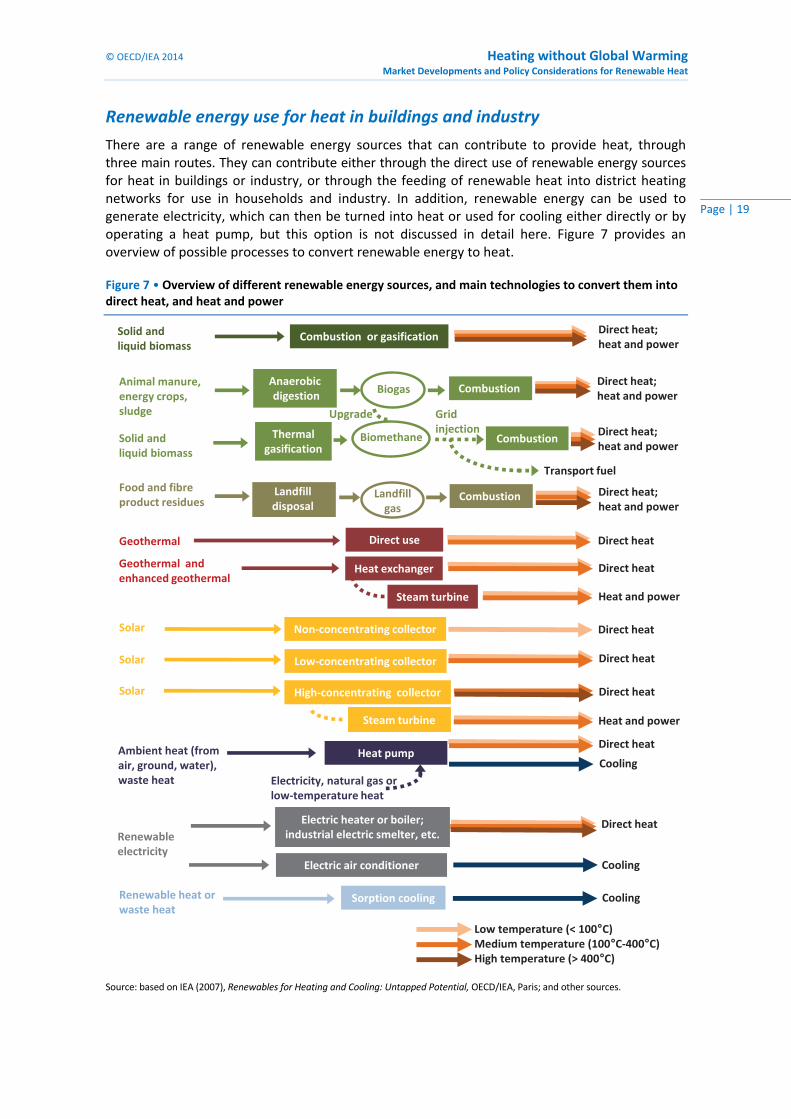
There are a range of renewable energy sources that can contribute to provide heat, through three main routes. They can contribute either through the direct use of renewable energy sources for heat in buildings or industry, or through the feeding of renewable heat into district heating networks for use in households and industry. In addition, renewable energy can be used to generate electricity, which can then be turned into heat or used for cooling either directly or by operating a heat pump, but this option is not discussed in detail here. Figure 7 provides an overview of possible processes to convert renewable energy to heat.
Figure 7 • Overview of different renewable energy sources, and main technologies to convert them into direct heat, and heat and power
Solid and liquid biomass
Animal manure, energy crops, sludge
Food and fibre product residues
Geothermal
Solar
Combustion or gasification
Anaerobic digestion
Direct heat
Biogas
Landfill disposal
Combustion
Landfill gas
Combustion
Direct use
Non-concentrating collector
Direct heat
Solar Low-concentrating collector
Direct heat; heat and power
Ambient heat (from air, ground, water), waste heat
Solar High-concentrating collector
Low temperature (< 100°C) Medium temperature (100°C-400°C) High temperature (> 400°C)
Biomethane
Upgrade Grid injection
Transport fuel
Direct heat
Heat pump
Heat exchanger
Combustion
Direct heat
Direct heat
Steam turbine
Geothermal and enhanced geothermal
Steam turbine
Direct heat
Electricity, natural gas or low-temperature heat
Heat and power
Heat and power
Renewable electricity
Electric heater or boiler; industrial electric smelter, etc.
Direct heat
Thermal gasification
Solid and liquid biomass
Renewable heat or waste heat
Sorption cooling Cooling
Electric air conditioner Cooling
Cooling
Direct heat; heat and power
Direct heat; heat and power
Direct heat; heat and power
Source: based on IEA (2007), Renewables for Heating and Cooling: Untapped Potential, OECD/IEA, Paris; and other sources.
Heating without Global Warming © OECD/IEA 2014
Market Developments and Policy Considerations for Renewable Heat
Page | 20
The optimal combination of renewable energy technologies to meet the final energy demand for heat of a given end user depends strongly on local conditions such as population density, characteristics of heat demand (quantity, daily and seasonal variability, temperature range), and quantity and quality of available energy infrastructure (EC/RHC‐Platform, 2011). To use renewable energy for heat production efficiently and effectively, renewable heat technologies should match the temperature level and load profile required by the thermal energy demand as closely as possible.
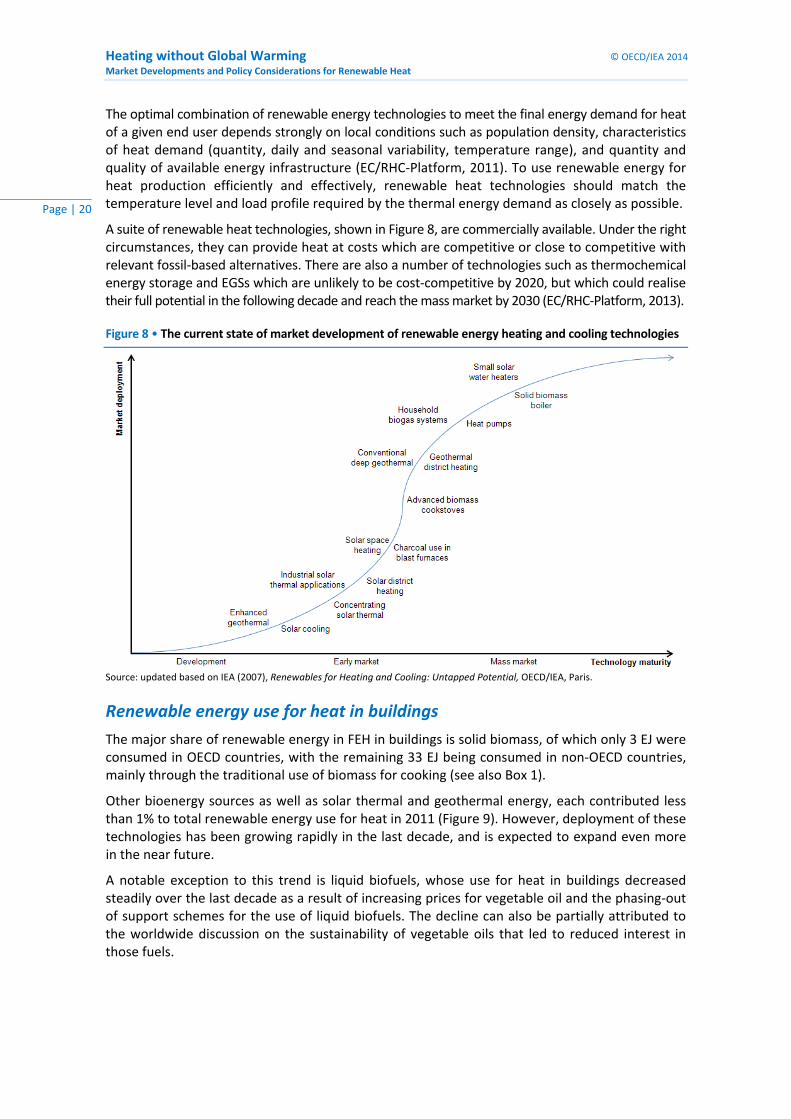
A suite of renewable heat technologies, shown in Figure 8, are commercially available. Under the right circumstances, they can provide heat at costs which are competitive or close to competitive with relevant fossil‐based alternatives. There are also a number of technologies such as thermochemical energy storage and EGSs which are unlikely to be cost‐competitive by 2020, but which could realise their full potential in the following decade and reach the mass market by 2030 (EC/RHC‐Platform, 2013).
Figure 8 • The current state of market development of renewable energy heating and cooling technologies
Source: updated based on IEA (2007), Renewables for Heating and Cooling: Untapped Potential, OECD/IEA, Paris.
Renewable energy use for heat in buildings
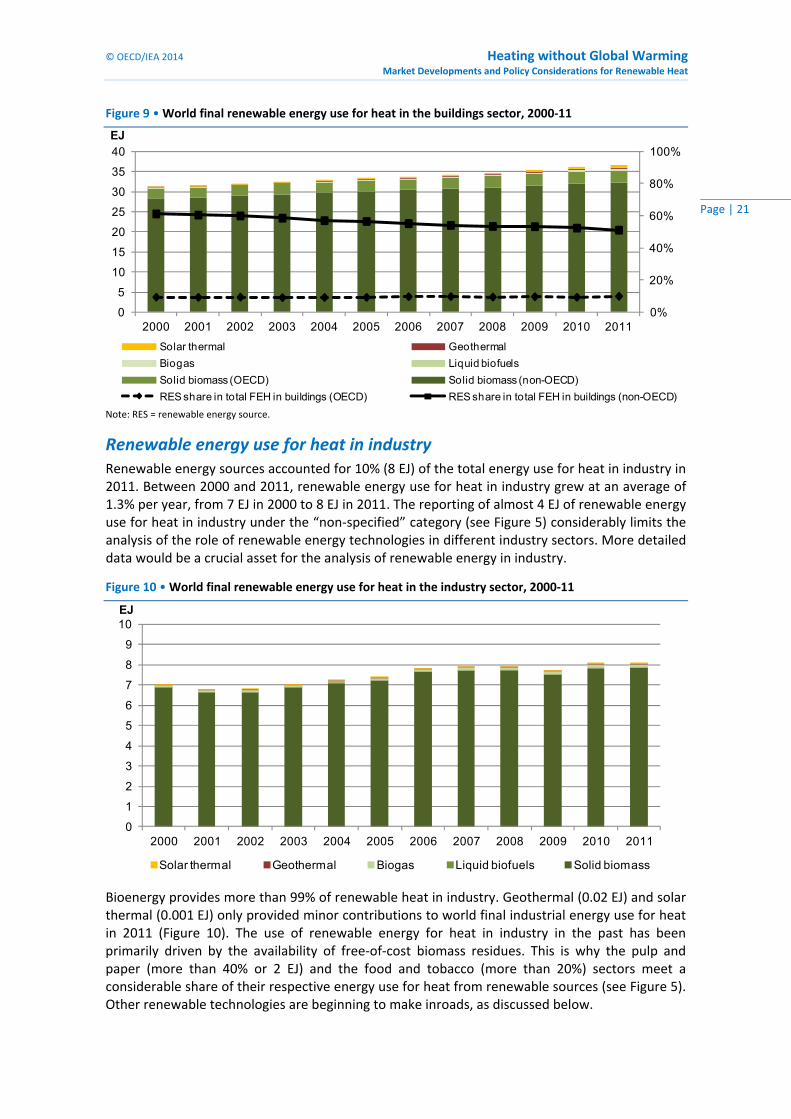
The major share of renewable energy in FEH in buildings is solid biomass, of which only 3 EJ were consumed in OECD countries, with the remaining 33 EJ being consumed in non‐OECD countries, mainly through the traditional use of biomass for cooking (see also Box 1).
Other bioenergy sources as well as solar thermal and geothermal energy, each contributed less than 1% to total renewable energy use for heat in 2011 (Figure 9). However, deployment of these technologies has been growing rapidly in the last decade, and is expected to expand even more in the near future.
A notable exception to this trend is liquid biofuels, whose use for heat in buildings decreased steadily over the last decade as a result of increasing prices for vegetable oil and the phasing‐out of support schemes for the use of liquid biofuels. The decline can also be partially attributed to the worldwide discussion on the sustainability of vegetable oils that led to reduced interest in those fuels.
© OECD/IEA 2014 Heating without Global Warming Market Developments and Policy Considerations for Renewable Heat
Page | 21
Figure 9 • World final renewable energy use for heat in the buildings sector, 2000‐11
0%
20%
40%
60%
80%
100%
0
5
10
15
20
25
30
35
40
2000 2001 2002 2003 2004 2005 2006 2007 2008 2009 2010 2011
EJ
Solar thermal Geothermal
Biogas Liquid biofuels
Solid biomass (OECD) Solid biomass (non-OECD)
RES share in total FEH in buildings (OECD) RES share in total FEH in buildings (non-OECD) Note: RES = renewable energy source.
Renewable energy use for heat in industry Renewable energy sources accounted for 10% (8 EJ) of the total energy use for heat in industry in 2011. Between 2000 and 2011, renewable energy use for heat in industry grew at an average of 1.3% per year, from 7 EJ in 2000 to 8 EJ in 2011. The reporting of almost 4 EJ of renewable energy use for heat in industry under the “non‐specified” category (see Figure 5) considerably limits the analysis of the role of renewable energy technologies in different industry sectors. More detailed data would be a crucial asset for the analysis of renewable energy in industry.
Figure 10 • World final renewable energy use for heat in the industry sector, 2000‐11
0
1
2
3
4
5
6
7
8
9
10
2000 2001 2002 2003 2004 2005 2006 2007 2008 2009 2010 2011
EJ
Solar thermal Geothermal Biogas Liquid biofuels Solid biomass
Bioenergy provides more than 99% of renewable heat in industry. Geothermal (0.02 EJ) and solar thermal (0.001 EJ) only provided minor contributions to world final industrial energy use for heat in 2011 (Figure 10). The use of renewable energy for heat in industry in the past has been primarily driven by the availability of free‐of‐cost biomass residues. This is why the pulp and paper (more than 40% or 2 EJ) and the food and tobacco (more than 20%) sectors meet a considerable share of their respective energy use for heat from renewable sources (see Figure 5). Other renewable technologies are beginning to make inroads, as discussed below.

Heating without Global Warming © OECD/IEA 2014
Market Developments and Policy Considerations for Renewable Heat
Page | 22
Bioenergy use for heat
Biomass resources
Biomass is defined as any organic (i.e. decomposing) matter derived from plants or animals available on a renewable basis. Biomass used for energy includes wood and agricultural crops, herbaceous and woody energy crops, municipal organic wastes, as well as animal manure. Biomass‐based energy is the oldest source of consumer energy known to mankind, and is still the largest source of renewable energy thanks to its abundance in most parts of the world.3 It currently accounts for roughly 10% of world TPES. Most of this is traditional use of biomass for cooking and heating, which is still crucial in providing basic energy in many poor households in developing countries (see Box 1).
Biomass is a unique source of renewable energy, as it can be provided as a solid, gaseous or liquid fuel. Furthermore, it can be used for generating electricity and transport fuels, as well as heat at different temperature levels for use in the buildings sector, in industry and in transport. Because bioenergy can be stored at times of low demand, it allows for generation of biomass‐derived electricity and heat to meet seasonal demands.4
While production of bioenergy feedstocks can create additional employment and income with positive socio‐economic benefits for farmers and rural communities, there are also potential negative aspects. The large‐scale deployment of bioenergy can create competition with existing uses of biomass, such as for food and feed or forest products, or can compete for land used for their production. This competition can create upward pressure on agricultural and forestry commodity prices and thus affect food security. In some cases, the use of bioenergy may also lead to direct and indirect land‐use changes, resulting in increased greenhouse gas (GHG) emissions, more intensive land use, pressure on water resources and loss of biodiversity.
3 It should be noted, however, that not all of the biomass used for bioenergy production today is sourced on a renewable basis. 4 Some biomass feedstocks can be stored for weeks or months in the field or forest, and up to years under dry conditions protected from the weather. Other feedstocks such as organic waste and manure are less suited for storage, as they decay and lose their energy content over time.
A range of bioenergy heating technologies are available, ranging from advanced cookstoves designed to reduce use of firewood and smoke pollution, to wood pellet stoves, biogas systems and large‐scale heating and co‐generation plants. Heat derived from biomass can be cost‐competitive with fossil fuels in buildings and industry in many cases, already today.
Traditional biomass use is by far the most important source of renewable energy used for heat and accounts for 90% (32 EJ) of total energy use for heat in the buildings sector in 2011. It is associated with deforestation and indoor smoke pollution, however, and should successively be reduced through deployment of more efficient cooking and heating technologies.
Modern bioenergy use for heat has been growing as a result of support policies in a number of countries around the world and stood at 3 EJ in 2011 with further growth expected in the coming years.
Bioenergy is the only sizeable renewable energy source used for heat in the industry sector today, and contributed 10% (8 EJ) to the total in 2011. The absence of specific drivers, in addition to a number of sector‐specific barriers, is hampering the enhanced use of renewable energy for heat in industry at the moment.
Most bioenergy heating technologies are already mature, but further cost reductions can be achieved through enhanced globalisation of the equipment market, and the expansion of large‐scale supply chains for sustainable biomass, among others.
© OECD/IEA 2014 Heating without Global Warming Market Developments and Policy Considerations for Renewable Heat
Page | 23
A sound policy framework will be vital to minimise the potential negative aspects and maximise the social, environmental and economic benefits of bioenergy production and use. Only then can bioenergy contribute to meeting energy demand and reducing GHG emissions in a sustainable way.
Bioenergy heating technologies
Box 1 • Traditional use of biomass
Biomass use for cooking
Traditional use of biomass, i.e. the use of solid biomass in open fires or simple stoves at very low combustion efficiencies (10% to 20% of primary energy converted into useful heat), provides basic energy in many poor households in developing countries. In many cases, the combustion of traditional biomass causes substantial indoor smoke pollution with severe health impacts, particularly for women and children. The World Health Organisation (2011) estimates that about 2 million people worldwide die prematurely every year as a result of indoor smoke pollution from biomass combustion, and to a smaller extent as a result of coal use for cooking and heating.
An estimated 2.6 billion people worldwide rely on the traditional use of biomass as a primary source of energy (IEA, 2012b), but solid data on the actual consumption of biomass in this traditional form are difficult to obtain. One reason is that the typical fuel sources such as firewood, charcoal, straw and dung are either collected directly by the consumers or traded on local, informal markets not covered by national statistics. Global traditional use of biomass is estimated by the IEA and others (IPCC, 2011) to be around 33 EJ to 43 EJ today. Given that there is no standard definition of the traditional use of biomass, and in light of data inaccuracies, this paper does not attempt to separate the traditional use of biomass from modern biomass. Traditional use of biomass is therefore included in the category “solid biomass”.
One important issue of particular relevance – though not limited only to traditional use of biomass – is the question of sustainability. Unsustainable biomass uses leading to deforestation should not, in principle, be counted as renewable. While institutions like the Global Bioenergy Partnership (GBEP) have developed sustainability indicators for bioenergy addressing all three pillars of sustainability (environmental, social and economic) (GBEP, 2011), tracking the sustainability of every single installation, or indeed every bioenergy input, does not seem feasible in practice.
Despite the uncertainty regarding data on traditional use of biomass (for more detail see IRENA, 2013), it is evident that a rapidly growing population in many developing countries will likely continue to drive demand for traditional use of biomass, though ongoing urbanisation can act as a counterweight to this trend. There is therefore an urgent need to replace inefficient open fires and simple stoves with more efficient advanced biomass stoves, or to substitute other fuels (biogas, ethanol, liquefied petroleum gas [LPG], kerosene), in order to ensure a more resource‐efficient and cleaner energy supply.
Although traditional use of biomass accounts for more than 6% of world total primary supply today, the useful heat provided to end users is relatively minimal. Assuming conversion efficiency from fuel to useful heat of 10% to 20%, the useful heat delivered to end users globally today is only in the range of 3 EJ to 6 EJ per year. If this were to be provided through cleaner and more efficient fuels such as biogas, ethanol, LPG or kerosene, 6 EJ to 12 EJ of fuel would be needed (assuming a conversion of 50% from fuel to useful heat), significantly less than the estimated 33 EJ to 43 EJ of biomass used in the traditional manner for heat production. Given the significant health and environmental benefits associated with such a switch to cleaner fuels, replacing the traditional use of biomass with clean, affordable sources of heat should be a key priority in many developing countries.
Heating without Global Warming © OECD/IEA 2014
Market Developments and Policy Considerations for Renewable Heat
Page | 24
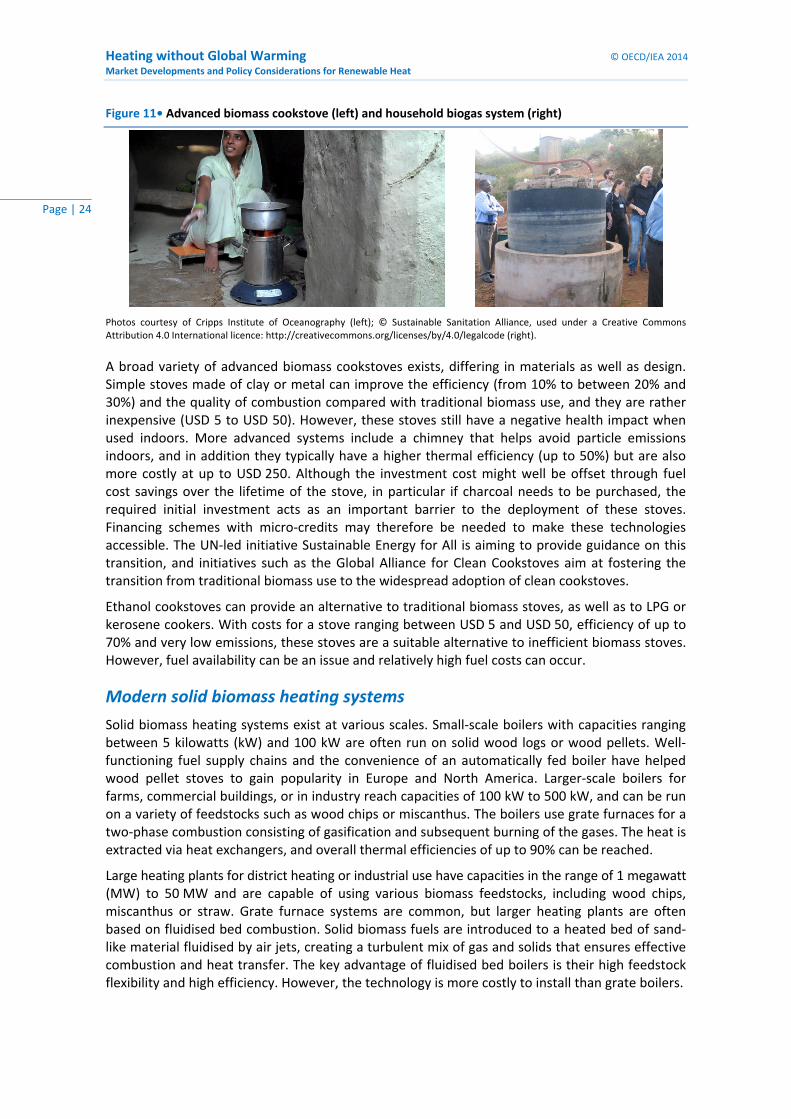
Figure 11• Advanced biomass cookstove (left) and household biogas system (right)
Photos courtesy of Cripps Institute of Oceanography (left); © Sustainable Sanitation Alliance, used under a Creative Commons Attribution 4.0 International licence: http://creativecommons.org/licenses/by/4.0/legalcode (right).
A broad variety of advanced biomass cookstoves exists, differing in materials as well as design. Simple stoves made of clay or metal can improve the efficiency (from 10% to between 20% and 30%) and the quality of combustion compared with traditional biomass use, and they are rather inexpensive (USD 5 to USD 50). However, these stoves still have a negative health impact when used indoors. More advanced systems include a chimney that helps avoid particle emissions indoors, and in addition they typically have a higher thermal efficiency (up to 50%) but are also more costly at up to USD 250. Although the investment cost might well be offset through fuel cost savings over the lifetime of the stove, in particular if charcoal needs to be purchased, the required initial investment acts as an important barrier to the deployment of these stoves. Financing schemes with micro‐credits may therefore be needed to make these technologies accessible. The UN‐led initiative Sustainable Energy for All is aiming to provide guidance on this transition, and initiatives such as the Global Alliance for Clean Cookstoves aim at fostering the transition from traditional biomass use to the widespread adoption of clean cookstoves.
Ethanol cookstoves can provide an alternative to traditional biomass stoves, as well as to LPG or kerosene cookers. With costs for a stove ranging between USD 5 and USD 50, efficiency of up to 70% and very low emissions, these stoves are a suitable alternative to inefficient biomass stoves. However, fuel availability can be an issue and relatively high fuel costs can occur.
Modern solid biomass heating systems
Solid biomass heating systems exist at various scales. Small‐scale boilers with capacities ranging between 5 kilowatts (kW) and 100 kW are often run on solid wood logs or wood pellets. Well‐functioning fuel supply chains and the convenience of an automatically fed boiler have helped wood pellet stoves to gain popularity in Europe and North America. Larger‐scale boilers for farms, commercial buildings, or in industry reach capacities of 100 kW to 500 kW, and can be run on a variety of feedstocks such as wood chips or miscanthus. The boilers use grate furnaces for a two‐phase combustion consisting of gasification and subsequent burning of the gases. The heat is extracted via heat exchangers, and overall thermal efficiencies of up to 90% can be reached.
Large heating plants for district heating or industrial use have capacities in the range of 1 megawatt (MW) to 50 MW and are capable of using various biomass feedstocks, including wood chips, miscanthus or straw. Grate furnace systems are common, but larger heating plants are often based on fluidised bed combustion. Solid biomass fuels are introduced to a heated bed of sand‐like material fluidised by air jets, creating a turbulent mix of gas and solids that ensures effective combustion and heat transfer. The key advantage of fluidised bed boilers is their high feedstock flexibility and high efficiency. However, the technology is more costly to install than grate boilers.
© OECD/IEA 2014 Heating without Global Warming Market Developments and Policy Considerations for Renewable Heat
Page | 25
Box 2 • Biomass as a renewable source of high‐temperature heat in industry
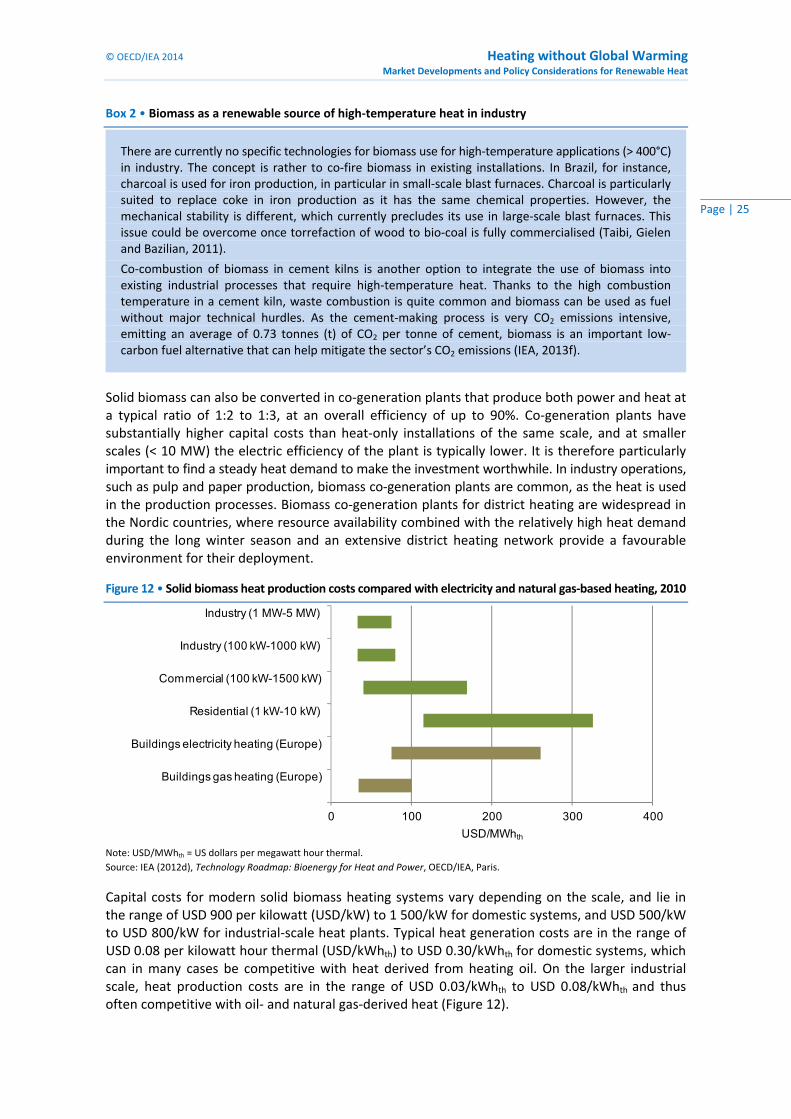
Solid biomass can also be converted in co‐generation plants that produce both power and heat at a typical ratio of 1:2 to 1:3, at an overall efficiency of up to 90%. Co‐generation plants have substantially higher capital costs than heat‐only installations of the same scale, and at smaller scales (< 10 MW) the electric efficiency of the plant is typically lower. It is therefore particularly important to find a steady heat demand to make the investment worthwhile. In industry operations, such as pulp and paper production, biomass co‐generation plants are common, as the heat is used in the production processes. Biomass co‐generation plants for district heating are widespread in the Nordic countries, where resource availability combined with the relatively high heat demand during the long winter season and an extensive district heating network provide a favourable environment for their deployment.
Figure 12 • Solid biomass heat production costs compared with electricity and natural gas‐based heating, 2010
0 100 200 300 400
Buildings gas heating (Europe)
Buildings electricity heating (Europe)
Residential (1 kW-10 kW)
Commercial (100 kW-1500 kW)
Industry (100 kW-1000 kW)
Industry (1 MW-5 MW)
USD/MWhth Note: USD/MWhth = US dollars per megawatt hour thermal.
Source: IEA (2012d), Technology Roadmap: Bioenergy for Heat and Power, OECD/IEA, Paris.
Capital costs for modern solid biomass heating systems vary depending on the scale, and lie in the range of USD 900 per kilowatt (USD/kW) to 1 500/kW for domestic systems, and USD 500/kW to USD 800/kW for industrial‐scale heat plants. Typical heat generation costs are in the range of USD 0.08 per kilowatt hour thermal (USD/kWhth) to USD 0.30/kWhth for domestic systems, which can in many cases be competitive with heat derived from heating oil. On the larger industrial scale, heat production costs are in the range of USD 0.03/kWhth to USD 0.08/kWhth and thus often competitive with oil‐ and natural gas‐derived heat (Figure 12).
There are currently no specific technologies for biomass use for high‐temperature applications (> 400°C) in industry. The concept is rather to co‐fire biomass in existing installations. In Brazil, for instance, charcoal is used for iron production, in particular in small‐scale blast furnaces. Charcoal is particularly suited to replace coke in iron production as it has the same chemical properties. However, the mechanical stability is different, which currently precludes its use in large‐scale blast furnaces. This issue could be overcome once torrefaction of wood to bio‐coal is fully commercialised (Taibi, Gielen and Bazilian, 2011).
Co‐combustion of biomass in cement kilns is another option to integrate the use of biomass into existing industrial processes that require high‐temperature heat. Thanks to the high combustion temperature in a cement kiln, waste combustion is quite common and biomass can be used as fuel without major technical hurdles. As the cement‐making process is very CO2 emissions intensive, emitting an average of 0.73 tonnes (t) of CO2 per tonne of cement, biomass is an important low‐carbon fuel alternative that can help mitigate the sector’s CO2 emissions (IEA, 2013f).

Heating without Global Warming © OECD/IEA 2014
Market Developments and Policy Considerations for Renewable Heat
Page | 26
Biogas systems
Biogas is a fuel suitable to provide heat (and power) in buildings and industry. Household biogas systems consist of a small (1 cubic metre [m3] to 5 m3) digester, in which organic household wastes, manure and faeces are digested under anaerobic conditions into a methane containing biogas. The biogas can be stored in rubber balloons and used for cooking, heating and lighting purposes. The costs for household biogas systems are typically in the range of USD 500/kW to USD 5 000/kW, depending on the size and system used. Since the digester in these systems is usually not heated, biogas productivity decreases in winter, as bacterial activity slows at low temperatures.
Biogas is also produced at larger scales of 150 kW up to 20 MW. The biogas can be derived from landfills, and can also be produced by digesting sewage sludge, manure and energy crops in dedicated biogas installations. Mixed manure and energy crop systems are often installed on farms, and typically consist of a pre‐treatment unit that mixes energy crops and manure, a digester, post‐digester and storage for the used digestate. To ensure stable biogas output throughout the year, the digester is heated to 37°C to 42°C.
Most dedicated biogas plants convert the biogas on‐site into electricity, often encouraged by feed‐in tariffs for renewable electricity, as is the case for instance in Germany. An increasing number of plants are operated in co‐generation mode with a typical ratio of electricity output to heat of 1:2. Capital costs of the plants are typically USD 2 500/kW to USD 5 000/kW, including the co‐generation plant. A small but growing application is the upgrading of biogas to biomethane by cleaning the gas and increasing the methane content to around 95%, up from roughly 60% in the raw biogas. The upgraded biomethane is then injected into the natural gas grid and can be used for power generation, as well as for producing heat in industry and buildings.
Liquid biofuels
As part of the efforts to reduce indoor air pollution from traditional use of biomass, the use of ethanol as cooking fuel has gained some momentum in developing countries (see above). Liquid biofuels such as vegetable oil or biodiesel produced from rapeseed, oil palm and other renewable sources can be used in oil burner heating systems instead of heating oil, with only minor retrofitting of the existing burner. In addition to vegetable oil‐based biofuels, pyrolysis oil5 could be used for heat production, replacing heavy or light fuel oil. Pyrolysis oil use in larger (above 1 megawatt thermal [MWth]) heavy fuel oil burners has been demonstrated successfully (BTG‐BTL, 2011). Light fuel oil systems need to be adjusted due to the higher viscosity and different chemical properties of pyrolysis oil compared with light fuel oil.
Bioenergy use for heat in buildings
Bioenergy is by far the most important source of renewable heat in the buildings sector, and its use has been growing steadily during the last decade from around 31 EJ in 2000 to 36 EJ in 2011. Although the numbers are subject to some uncertainty (see discussion on traditional biomass above), they clearly underline the importance of bioenergy in global energy use for heat, particularly in many developing countries.
Non‐OECD countries account for more than 90% of global bioenergy used for heat and in several developing countries biomass accounts for more than 90% of total FEH. China (8.4 EJ) and India (6.0 EJ) were the biggest consumers of bioenergy for heat in the buildings sector in 2011 in
5 Pyrolysis is produced through heating biomass to temperatures of 400°C to 600°C in the absence of oxygen. The process
results in solid charcoal and a product gas, of which a certain share can be condensed to pyrolysis oil.
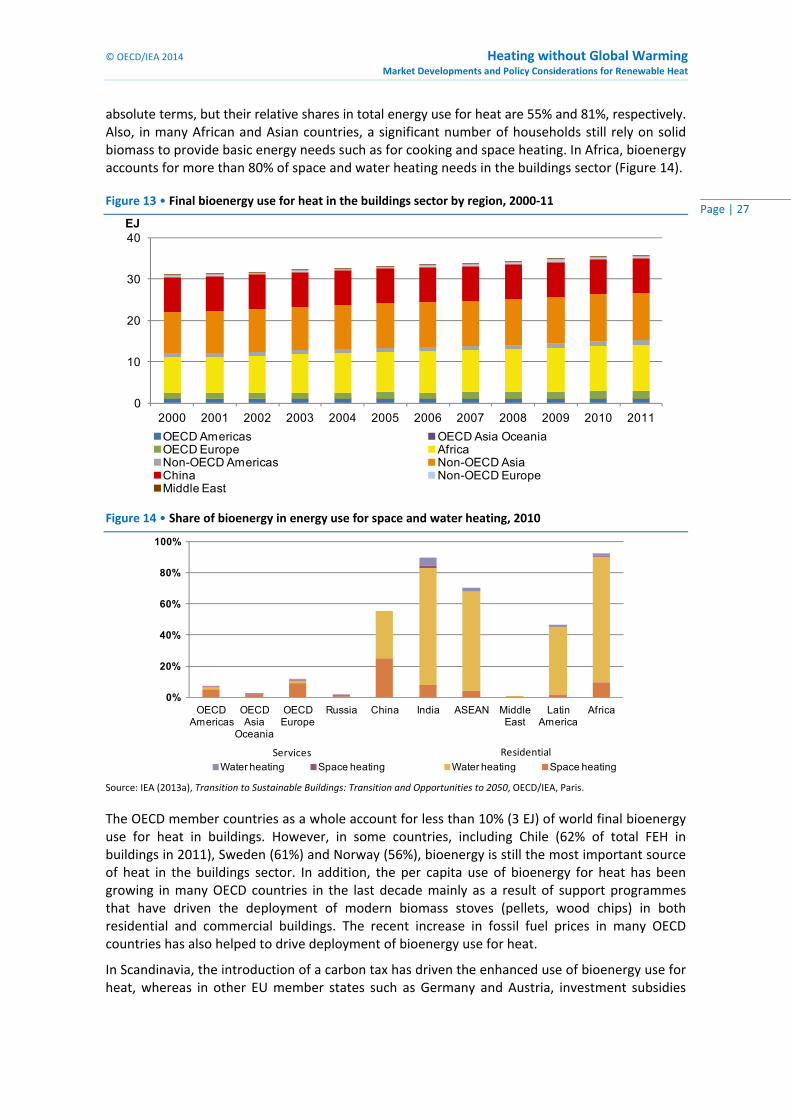
© OECD/IEA 2014 Heating without Global Warming Market Developments and Policy Considerations for Renewable Heat
Page | 27
absolute terms, but their relative shares in total energy use for heat are 55% and 81%, respectively. Also, in many African and Asian countries, a significant number of households still rely on solid biomass to provide basic energy needs such as for cooking and space heating. In Africa, bioenergy accounts for more than 80% of space and water heating needs in the buildings sector (Figure 14).
Figure 13 • Final bioenergy use for heat in the buildings sector by region, 2000‐11
0
10
20
30
40
2000 2001 2002 2003 2004 2005 2006 2007 2008 2009 2010 2011
EJ
OECD Americas OECD Asia Oceania OECD Europe Africa Non-OECD Americas Non-OECD AsiaChina Non-OECD EuropeMiddle East
Figure 14 • Share of bioenergy in energy use for space and water heating, 2010
0%
20%
40%
60%
80%
100%
OECD Americas
OECD Asia
Oceania
OECD Europe
Russia China India ASEAN Middle East
Latin America
Africa
Water heating Space heating Water heating Space heatingServices Residential
Source: IEA (2013a), Transition to Sustainable Buildings: Transition and Opportunities to 2050, OECD/IEA, Paris.
The OECD member countries as a whole account for less than 10% (3 EJ) of world final bioenergy use for heat in buildings. However, in some countries, including Chile (62% of total FEH in buildings in 2011), Sweden (61%) and Norway (56%), bioenergy is still the most important source of heat in the buildings sector. In addition, the per capita use of bioenergy for heat has been growing in many OECD countries in the last decade mainly as a result of support programmes that have driven the deployment of modern biomass stoves (pellets, wood chips) in both residential and commercial buildings. The recent increase in fossil fuel prices in many OECD countries has also helped to drive deployment of bioenergy use for heat.
In Scandinavia, the introduction of a carbon tax has driven the enhanced use of bioenergy use for heat, whereas in other EU member states such as Germany and Austria, investment subsidies
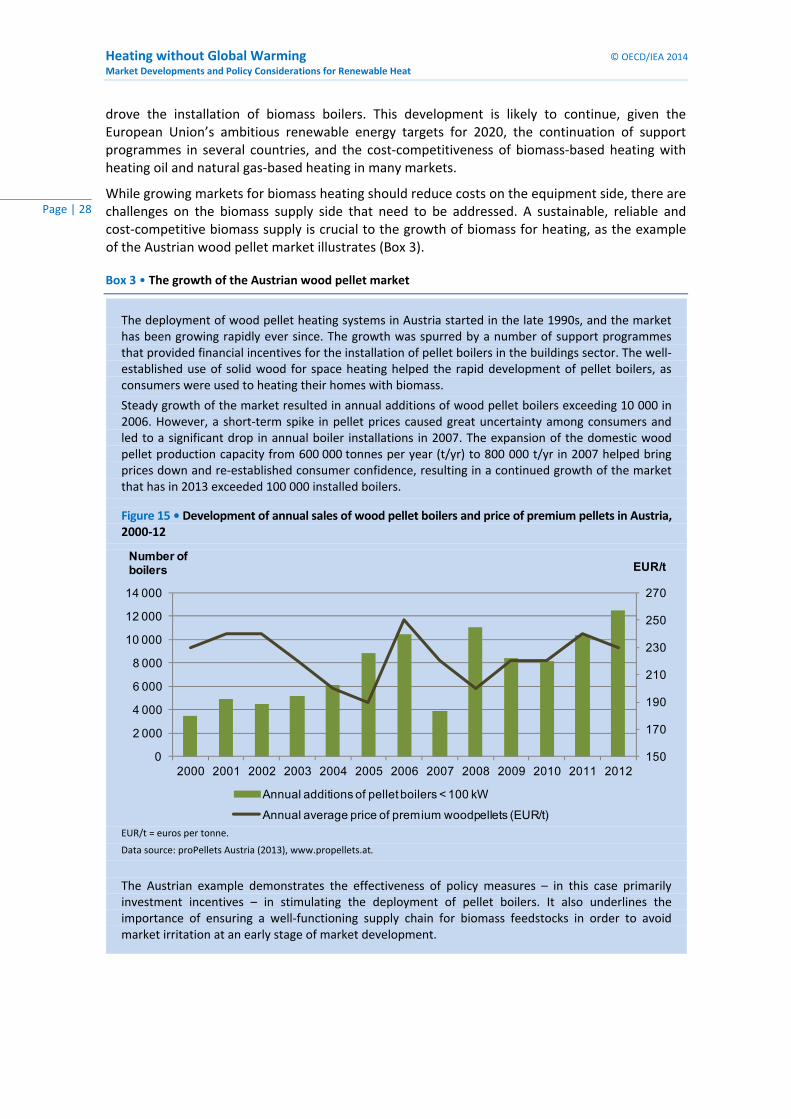
Heating without Global Warming © OECD/IEA 2014
Market Developments and Policy Considerations for Renewable Heat
Page | 28
drove the installation of biomass boilers. This development is likely to continue, given the European Union’s ambitious renewable energy targets for 2020, the continuation of support programmes in several countries, and the cost‐competitiveness of biomass‐based heating with heating oil and natural gas‐based heating in many markets.
While growing markets for biomass heating should reduce costs on the equipment side, there are challenges on the biomass supply side that need to be addressed. A sustainable, reliable and cost‐competitive biomass supply is crucial to the growth of biomass for heating, as the example of the Austrian wood pellet market illustrates (Box 3).
Box 3 • The growth of the Austrian wood pellet market
The deployment of wood pellet heating systems in Austria started in the late 1990s, and the market has been growing rapidly ever since. The growth was spurred by a number of support programmes that provided financial incentives for the installation of pellet boilers in the buildings sector. The well‐established use of solid wood for space heating helped the rapid development of pellet boilers, as consumers were used to heating their homes with biomass.
Steady growth of the market resulted in annual additions of wood pellet boilers exceeding 10 000 in 2006. However, a short‐term spike in pellet prices caused great uncertainty among consumers and led to a significant drop in annual boiler installations in 2007. The expansion of the domestic wood pellet production capacity from 600 000 tonnes per year (t/yr) to 800 000 t/yr in 2007 helped bring prices down and re‐established consumer confidence, resulting in a continued growth of the market that has in 2013 exceeded 100 000 installed boilers.
Figure 15 • Development of annual sales of wood pellet boilers and price of premium pellets in Austria, 2000‐12
150
170
190
210
230
250
270
0
2 000
4 000
6 000
8 000
10 000
12 000
14 000
2000 2001 2002 2003 2004 2005 2006 2007 2008 2009 2010 2011 2012
EUR/tNumber of boilers
Annual additions of pellet boilers < 100 kW
Annual average price of premium woodpellets (EUR/t) EUR/t = euros per tonne.
Data source: proPellets Austria (2013), www.propellets.at.
The Austrian example demonstrates the effectiveness of policy measures – in this case primarily investment incentives – in stimulating the deployment of pellet boilers. It also underlines the importance of ensuring a well‐functioning supply chain for biomass feedstocks in order to avoid market irritation at an early stage of market development.

© OECD/IEA 2014 Heating without Global Warming Market Developments and Policy Considerations for Renewable Heat
Page | 29
Biogas
Biogas production has been gaining momentum in some OECD countries such as Germany and Sweden, where it is used primarily for power generation. Waste heat from co‐generation plants is either used on‐site for heating farm buildings or drying crops, or it is fed into the local district heating network. More recently, plants for upgrading biogas to biomethane for use in gas‐fired power plants, households, and the transport sector have been installed in Germany and other countries. Thanks to these developments, OECD Europe is the second largest consumer of biogas for heat in buildings worldwide, although total use is still small (0.02 EJ in 2011), followed by OECD Asia Oceania (0.01 EJ). Renewable energy targets for 2020 within the European Union have been the strongest driver for the recent development of biogas use in buildings in OECD Europe.
Figure 16 • Final biogas use for heat in the buildings sector by region, 2000‐11
0.0
0.1
0.2
0.3
0.4
0.5
2000 2001 2002 2003 2004 2005 2006 2007 2008 2009 2010 2011
EJ
OECD Americas OECD Asia Oceania OECD Europe Africa Non-OECD Americas Non-OECD AsiaChina Non-OECD EuropeMiddle East
Note: India does not report data on biogas use for heat, despite having 4.2 million digesters deployed.
In many non‐OECD countries, biogas has been produced for several decades, as fuel for heating and cooking in buildings. China is the leading country in total biogas use for heat in the buildings sector, with a consumption of 0.3 EJ of biogas, produced in 43 million household biogas digesters (REN21, 2012). This impressive number is the result of support programmes for biogas that were initiated in the late 1960s, when biogas was first seen as an important way to improve rural energy supply. Energy supply in rural areas is still a priority for the government, and support for household biogas systems in the form of investment subsidies (covering 25% to 40% of total project investment) are currently provided. Biogas digesters have also been financed through the Asian Development Bank, the United Nations Environment Programme (UNEP) and other institutions, for instance through providing loans. The Chinese government has set a target of 80 million rural household biogas digesters by 2020, which should lead to further growth of biogas use for heat in buildings.
India, too, has promoted household biogas digesters since the 1980s through, among other incentives, support programmes providing 20% to 40% of the installation costs. The total number of digesters subsequently reached 4.2 million in 2011 (Central Statistics Office, 2013). In order to ensure efficient operation of the digesters, the Indian government pursues several capacity‐building programmes. Despite the significant number of digesters, no data on actual biogas production and its use in buildings are available in IEA statistics.
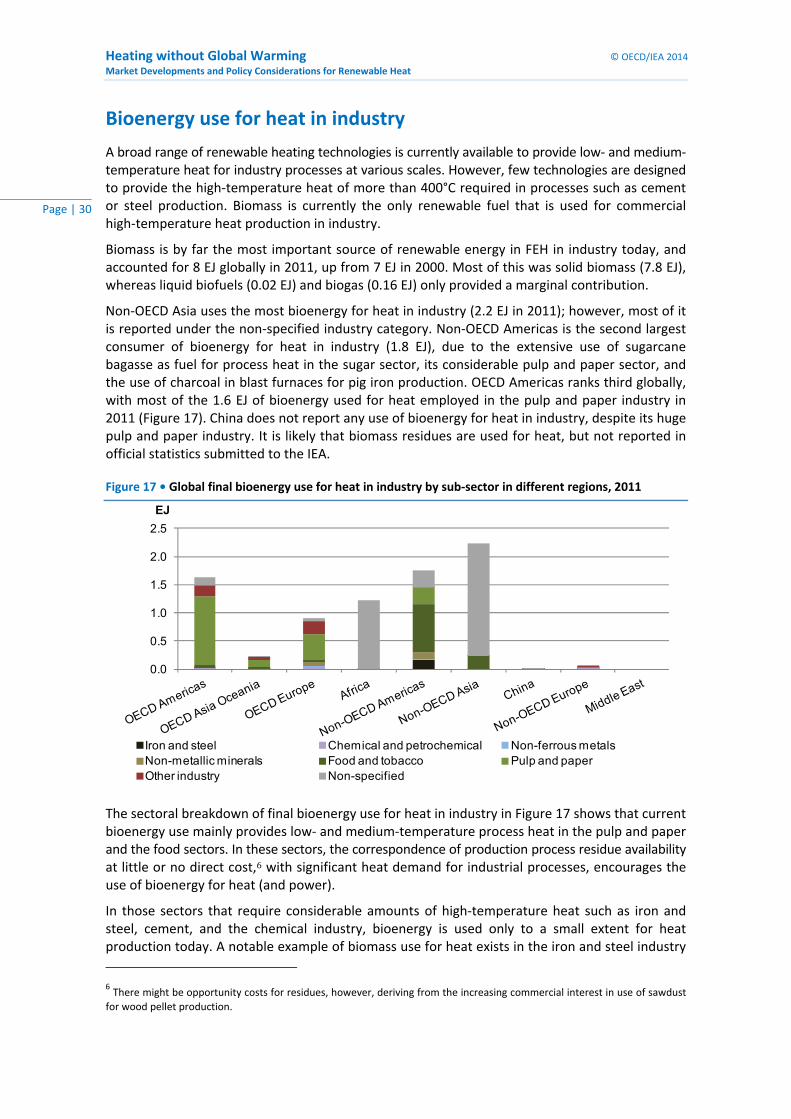
Heating without Global Warming © OECD/IEA 2014
Market Developments and Policy Considerations for Renewable Heat
Page | 30
Bioenergy use for heat in industry
A broad range of renewable heating technologies is currently available to provide low‐ and medium‐temperature heat for industry processes at various scales. However, few technologies are designed to provide the high‐temperature heat of more than 400°C required in processes such as cement or steel production. Biomass is currently the only renewable fuel that is used for commercial high‐temperature heat production in industry.
Biomass is by far the most important source of renewable energy in FEH in industry today, and accounted for 8 EJ globally in 2011, up from 7 EJ in 2000. Most of this was solid biomass (7.8 EJ), whereas liquid biofuels (0.02 EJ) and biogas (0.16 EJ) only provided a marginal contribution.
Non‐OECD Asia uses the most bioenergy for heat in industry (2.2 EJ in 2011); however, most of it is reported under the non‐specified industry category. Non‐OECD Americas is the second largest consumer of bioenergy for heat in industry (1.8 EJ), due to the extensive use of sugarcane bagasse as fuel for process heat in the sugar sector, its considerable pulp and paper sector, and the use of charcoal in blast furnaces for pig iron production. OECD Americas ranks third globally, with most of the 1.6 EJ of bioenergy used for heat employed in the pulp and paper industry in 2011 (Figure 17). China does not report any use of bioenergy for heat in industry, despite its huge pulp and paper industry. It is likely that biomass residues are used for heat, but not reported in official statistics submitted to the IEA.
Figure 17 • Global final bioenergy use for heat in industry by sub‐sector in different regions, 2011
0.0
0.5
1.0
1.5
2.0
2.5
EJ
Iron and steel Chemical and petrochemical Non-ferrous metalsNon-metallic minerals Food and tobacco Pulp and paperOther industry Non-specified
The sectoral breakdown of final bioenergy use for heat in industry in Figure 17 shows that current bioenergy use mainly provides low‐ and medium‐temperature process heat in the pulp and paper and the food sectors. In these sectors, the correspondence of production process residue availability at little or no direct cost,6 with significant heat demand for industrial processes, encourages the use of bioenergy for heat (and power).
In those sectors that require considerable amounts of high‐temperature heat such as iron and steel, cement, and the chemical industry, bioenergy is used only to a small extent for heat production today. A notable example of biomass use for heat exists in the iron and steel industry
6 There might be opportunity costs for residues, however, deriving from the increasing commercial interest in use of sawdust
for wood pellet production.
© OECD/IEA 2014 Heating without Global Warming Market Developments and Policy Considerations for Renewable Heat
Page | 31
in Brazil. Brazil has long experience in using charcoal in pig iron production (Box 4), with charcoal accounting for 37% (0.2 EJ) of total FEH in the iron and steel sector in 2011.
In the non‐metallic minerals sector, coal is by far the most important source of energy for heat use, accounting for 65% (8 EJ) of global energy use for heat in the sector. Biomass use is less common and is mainly limited to the use of solid biomass, accounting for roughly 1% of global FEH in the sector. On the country level, Brazil and Portugal are quite advanced and respectively meet 32 % (0.1 EJ) and 27% (0.02 EJ) of total energy use for heat in the non‐metallic minerals sector with biomass.
Box 4 • Charcoal in the Brazilian iron industry
Bioenergy use for heat: Conclusions
Bioenergy represents the most important source of renewable energy used for heat in both buildings and industry, and its use is likely to expand in both sectors in the future. In the buildings sector, a growing population, lack of affordable alternative energy sources, and the health and environmental problems associated with the traditional use of biomass will likely continue to drive the use of bioenergy for heat in many non‐OECD countries. The dominance of traditional biomass in FEH in buildings in these countries can only be reduced by the development of viable supply chains for advanced biomass cookstoves and other alternative technologies (biogas systems, solar cookers, LPG stoves) that provide clean, safe and affordable energy for cooking and space heating. However, barriers such as the upfront costs for new stoves, and lack of consumer awareness, call for dedicated programmes to establish supply chains for advanced biomass stoves and inform consumers about their benefits. The successful household biogas programmes in China and India, for instance, could be replicated in many other developing regions with similar climatic conditions. In fact, biogas programmes have been established in Africa, Asia and Latin America through various development agencies, often in co‐operation with development banks and local institutions. As for other modern bioenergy heating technologies, viable supply chains with local companies marketing and installing the equipment will be vital for successful deployment. Micro‐credit programmes or other ways of allowing farmers and families to invest in biogas installations are another important enabler for the deployment of bioenergy heating and cooking technologies in developing countries.
Biomass is the only available renewable source with the potential to significantly reduce the net emissions intensity of iron and steel‐making suitable to replace coal in iron‐smelting blast furnaces. Brazil is the only country worldwide that uses biomass in iron production, with 37% of its iron and steel sector’s energy used for heat provided by charcoal in 2011. Charcoal is directly fed into blast furnaces used for production of pig iron. The price of charcoal is currently USD 250 per tonne (USD/t) to USD 270/t, according to experts in the field, compared with USD 320/t for Australian coke at a Brazilian port.
However, the price differential between charcoal and coke is less than it appears, since physiochemical properties affect the performance of charcoal in the production process, limit its functionality in large blast furnaces, and may affect final steel product quality. As metallurgical charcoal from fast‐growth energy forests is generally of low density, with low compression strength, it can only be used in smaller blast furnaces with limited steel output capacity. The chemical properties of charcoal, such as volatile content and ash content and characteristics, are very important to the quality of the iron and steel produced. Quality assurance is therefore important in order not to compromise the quality of the final product. The use of torrefied wood pellets, for which the first commercial‐scale production plants are currently under construction, could address these quality issues and enable large‐scale, international supply chains.
Heating without Global Warming © OECD/IEA 2014
Market Developments and Policy Considerations for Renewable Heat
Page | 32
In OECD member countries, biomass‐based heating technologies are fairly well developed and reach high thermal efficiencies. The technologies are relatively mature, but there is still scope for cost reduction through mass production. Steadily increasing fuel prices for natural gas and heating oil in most OECD countries over recent years should help further deployment in buildings. Some policy support, even if only in the form of awareness‐raising campaigns, would help promote deployment of recent developments in modern bioenergy use for heat.
The industry sector still has significant potential for enhanced use of bioenergy for heat, in particular in high‐temperature applications. For example, bioenergy is the only renewable energy source available on a commercial scale today that can provide the high temperatures required, for instance, in iron and cement production. Bioenergy fuel costs, compared with those of coal and coke, are the greatest barrier to a broader uptake of bioenergy in these processes. In addition, fuel availability and quality are important issues. The commercialisation of torrefaction technology, a process which makes a charcoal‐like product, would help to address quality issues and develop efficient international supply chains that could reduce the cost of biomass.
Overall, however, little progress in the use of bioenergy for heat in industry is to be expected without policy intervention. A reasonable price for CO2 emissions could, for instance, help to drive the use of bioenergy for industrial heat. Dedicated quotas for renewable energy, or investment subsidies for new biomass boilers, are other possible measures that would help make the use of bioenergy for heat in industry more attractive in a broader range of sub‐sectors.
Bioenergy technology development and RD&D needs
Although bioenergy is the most important source of renewable energy used for heat today in both buildings and industry, and bioenergy technologies for heat are generally mature, further RD&D will be important to advance the role of bioenergy in global energy use for heat. Some RD&D priorities for biomass are listed below:
For developing countries relying on traditional use of biomass, the most urgent technology development needed is low‐cost, efficient, clean cookstoves.
Commercialisation of torrefaction technology to produce high‐quality feedstocks with characteristics similar to coke will be key to the increased use of biomass in high‐temperature industry applications.
Further work on biomass gasification would help advance biomass use in high‐temperature heat applications (for details, see IEA, 2012d).
General research priorities for large‐scale bioenergy applications include the security and sustainability of biomass supply, including long‐distance trade.
© OECD/IEA 2014 Heating without Global Warming Market Developments and Policy Considerations for Renewable Heat
Page | 33
Solar thermal energy
Solar radiation
Solar energy provides the largest potential source of renewable energy, theoretically able to cover 6 200 times the current world primary energy supply (IEA, 2011a). The potential for using solar energy for heating and cooling systems is thus vast, although the quantity and quality of solar radiation varies in different parts of the world.
It is important to distinguish between different types of solar radiation: the direct radiation coming straight from the sun’s disk, and diffuse radiation, which is indirect. Some solar heating and cooling systems can use both direct and diffuse solar radiation, so even under cloudy conditions there is some energy available for conversion into heat. For concentrating collectors, which can provide higher temperatures with acceptable efficiency, the best resource areas are those where cloud cover is limited and direct normal irradiance (DNI) is high, such as in arid and semi‐arid regions. The deployment of the technical solar energy potential depends on land and/or roof space availability, proximity to heating and cooling demand, and the presence of thermal energy networks.
Solar thermal heat technologies
A variety of technologies exists to capture solar radiation and convert it into heat for a wide number of applications. Several solar heating technologies are already mature and can be competitive in certain regions of the world in applications such as domestic hot water heating and swimming pool heating. An overview of different solar heating technologies, their current status in terms of technology maturity and deployment, and the associated costs is provided below. A more detailed overview can be found in previous IEA publications (IEA, 2011a, 2012c).
Various solar thermal technologies are available today, including direct hot water systems, combined hot water and space heating systems as well as large‐scale systems for district heating and industrial applications. High‐temperature technologies for industrial applications are in a very early stage of development.
Solar hot water installations are now cost‐competitive with fossil fuels and electricity in China, Israel and several other countries. Solar district heating is also increasingly competitive in Denmark, and combined hot water and space heating systems are economically attractive under favourable circumstances.
With 12% annual growth from 2000 to 2011, solar thermal energy is the fastest‐growing renewable energy source used for heat in the buildings sector. Thanks to this rapid deployment, costs for collectors have decreased 50% in the last 20 years.
Total solar thermal energy use for heat in buildings stood at 0.7 EJ in 2011, with China alone using 0.5 EJ, mainly for water heating.
The contribution of solar thermal heat in industry is small, despite a considerable potential in several low‐ and medium‐temperature processes. Important barriers include cost‐efficiency and the lack of standardised equipment for industrial processes.
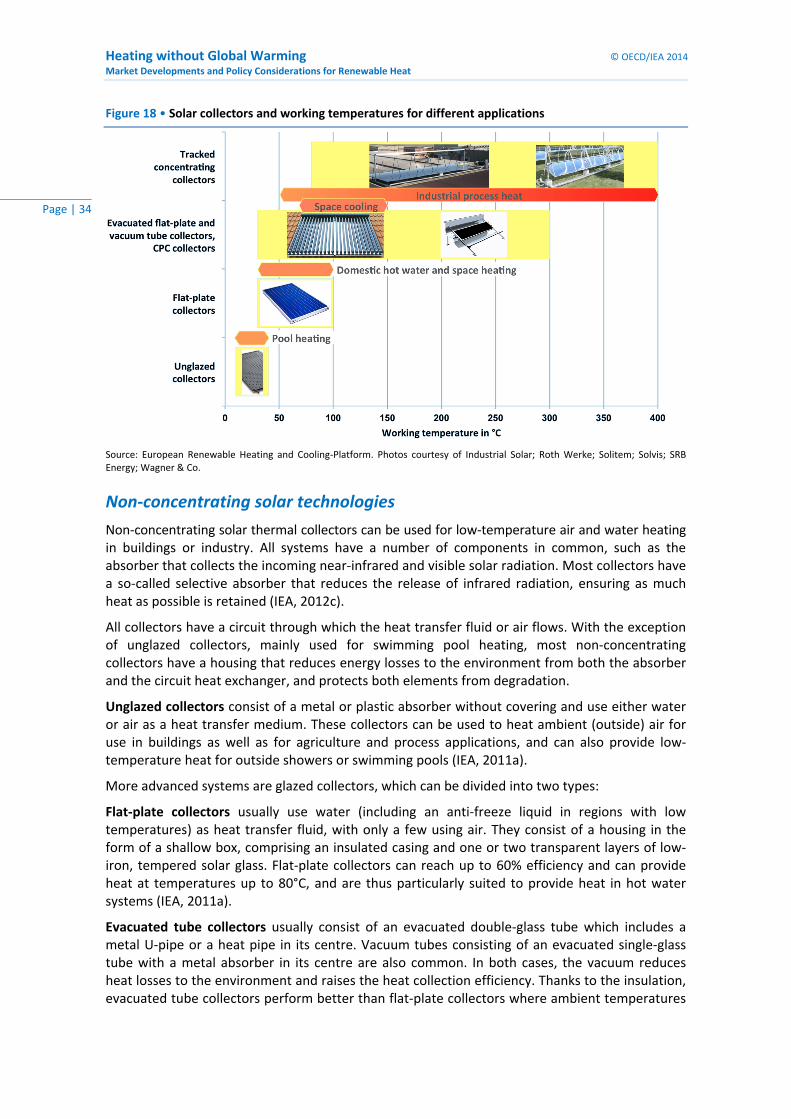
Heating without Global Warming © OECD/IEA 2014
Market Developments and Policy Considerations for Renewable Heat
Page | 34
Figure 18 • Solar collectors and working temperatures for different applications
Source: European Renewable Heating and Cooling‐Platform. Photos courtesy of Industrial Solar; Roth Werke; Solitem; Solvis; SRB Energy; Wagner & Co.
Non‐concentrating solar technologies
Non‐concentrating solar thermal collectors can be used for low‐temperature air and water heating in buildings or industry. All systems have a number of components in common, such as the absorber that collects the incoming near‐infrared and visible solar radiation. Most collectors have a so‐called selective absorber that reduces the release of infrared radiation, ensuring as much heat as possible is retained (IEA, 2012c).
All collectors have a circuit through which the heat transfer fluid or air flows. With the exception of unglazed collectors, mainly used for swimming pool heating, most non‐concentrating collectors have a housing that reduces energy losses to the environment from both the absorber and the circuit heat exchanger, and protects both elements from degradation.
Unglazed collectors consist of a metal or plastic absorber without covering and use either water or air as a heat transfer medium. These collectors can be used to heat ambient (outside) air for use in buildings as well as for agriculture and process applications, and can also provide low‐temperature heat for outside showers or swimming pools (IEA, 2011a).
More advanced systems are glazed collectors, which can be divided into two types:
Flat‐plate collectors usually use water (including an anti‐freeze liquid in regions with low temperatures) as heat transfer fluid, with only a few using air. They consist of a housing in the form of a shallow box, comprising an insulated casing and one or two transparent layers of low‐iron, tempered solar glass. Flat‐plate collectors can reach up to 60% efficiency and can provide heat at temperatures up to 80°C, and are thus particularly suited to provide heat in hot water systems (IEA, 2011a).
Evacuated tube collectors usually consist of an evacuated double‐glass tube which includes a metal U‐pipe or a heat pipe in its centre. Vacuum tubes consisting of an evacuated single‐glass tube with a metal absorber in its centre are also common. In both cases, the vacuum reduces heat losses to the environment and raises the heat collection efficiency. Thanks to the insulation, evacuated tube collectors perform better than flat‐plate collectors where ambient temperatures

© OECD/IEA 2014 Heating without Global Warming Market Developments and Policy Considerations for Renewable Heat
Page | 35
are lower, and also work better in low irradiation conditions and are thus likely to be favoured in locations where clouded skies are common. Evacuated tube collectors demonstrate high efficiency, and provide heat of up to 160°C (IEA, 2011a). They are therefore suitable for high‐demand water heating systems, or for provision of process heat.
Figure 19 • Solar hot water system with flat‐plate collectors on a rooftop in Jerusalem, Israel (left), and 2 MWth solar thermal system using evacuated tubes to provide district heat in Wels, Austria (right)
Photos courtesy of Anselm Eisentraut.
There are different types of solar thermal heating systems in buildings, the most widespread being hot water systems with a thermosiphon, that are common for instance in China, as well as systems with forced circulation that are more common in central and northern Europe. Such systems can cover up to 60% of the total energy required for hot water provision in a single family building (ESTTP, 2013). Combi‐systems that provide both hot water and space heating are mainly used in central Europe, in particular in Germany, Austria, Switzerland and France. In well‐insulated buildings in central Europe, these systems provide 20% to 30% of the overall energy demand for hot water and space heating, whereas in more sunny countries up to 60% can be reached.
The fact that solar thermal systems can usually cover only a share of buildings’ hot water and/or space heating demand means that a backup system, for instance in form of a gas boiler, is still needed. This is an important difference compared with other renewable heating technologies, for instance biomass heating systems. The complexity of combining a solar thermal system with another heat source forms an important barrier to wider uptake of these systems. This barrier could be addressed by developing compact hybrid systems that combine the solar thermal system with the backup in a single unit that is easier to install.
The costs associated with solar air and water heating depend on the type of technology, system design and complexity, and specific regional circumstances (resource availability, labour costs, etc.). For systems at building scale, investment costs can range between USD 240 per kilowatt thermal (/kWth) and USD 2 400/kWth around the world. Larger systems benefit from economies of scale and costs are typically between USD 350/kWth and USD 1 040/kWth (IEA, 2012c). The resulting heat production costs depend on the size of the installation, as well as the region in which they are installed. Solar hot water thermosiphons in China can generate heat in the range of USD 20/MWhth to USD 50/MWhth, competitive with both gas and electricity heating systems. Domestic systems with forced circulation in central Europe produce heat at considerably higher costs of USD 110/MWhth to USD 145/MWhth, which should still be competitive with electricity‐derived heat in most circumstances (Figure 20). The most cost‐effective solar thermal application in Europe is solar district heating in Denmark (see Box 5 for more details). The ground‐mounted collector fields of 10 000 square metres (m2) and more cost around USD 390/kWth installed and piped, and heat prices as low as USD 43/MWhth can be reached (Solarthermalword.org, 2014).
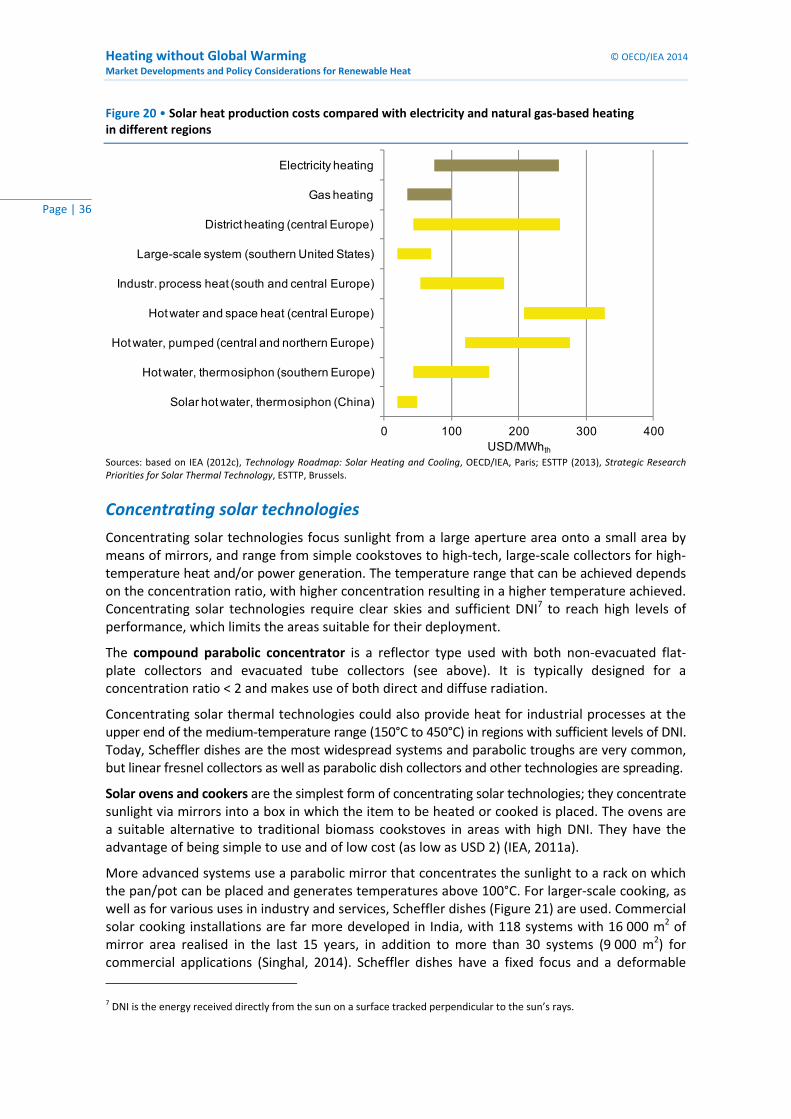
Heating without Global Warming © OECD/IEA 2014
Market Developments and Policy Considerations for Renewable Heat
Page | 36
Figure 20 • Solar heat production costs compared with electricity and natural gas‐based heating in different regions
0 100 200 300 400
Solar hot water, thermosiphon (China)
Hot water, thermosiphon (southern Europe)
Hot water, pumped (central and northern Europe)
Hot water and space heat (central Europe)
Industr. process heat (south and central Europe)
Large-scale system (southern United States)
District heating (central Europe)
Gas heating
Electricity heating
USD/MWhth Sources: based on IEA (2012c), Technology Roadmap: Solar Heating and Cooling, OECD/IEA, Paris; ESTTP (2013), Strategic Research Priorities for Solar Thermal Technology, ESTTP, Brussels.
Concentrating solar technologies
Concentrating solar technologies focus sunlight from a large aperture area onto a small area by means of mirrors, and range from simple cookstoves to high‐tech, large‐scale collectors for high‐temperature heat and/or power generation. The temperature range that can be achieved depends on the concentration ratio, with higher concentration resulting in a higher temperature achieved. Concentrating solar technologies require clear skies and sufficient DNI7 to reach high levels of performance, which limits the areas suitable for their deployment.
The compound parabolic concentrator is a reflector type used with both non‐evacuated flat‐plate collectors and evacuated tube collectors (see above). It is typically designed for a concentration ratio < 2 and makes use of both direct and diffuse radiation.
Concentrating solar thermal technologies could also provide heat for industrial processes at the upper end of the medium‐temperature range (150°C to 450°C) in regions with sufficient levels of DNI. Today, Scheffler dishes are the most widespread systems and parabolic troughs are very common, but linear fresnel collectors as well as parabolic dish collectors and other technologies are spreading.
Solar ovens and cookers are the simplest form of concentrating solar technologies; they concentrate sunlight via mirrors into a box in which the item to be heated or cooked is placed. The ovens are a suitable alternative to traditional biomass cookstoves in areas with high DNI. They have the advantage of being simple to use and of low cost (as low as USD 2) (IEA, 2011a).
More advanced systems use a parabolic mirror that concentrates the sunlight to a rack on which the pan/pot can be placed and generates temperatures above 100°C. For larger‐scale cooking, as well as for various uses in industry and services, Scheffler dishes (Figure 21) are used. Commercial solar cooking installations are far more developed in India, with 118 systems with 16 000 m2 of mirror area realised in the last 15 years, in addition to more than 30 systems (9 000 m2) for commercial applications (Singhal, 2014). Scheffler dishes have a fixed focus and a deformable
7 DNI is the energy received directly from the sun on a surface tracked perpendicular to the sun’s rays.

© OECD/IEA 2014 Heating without Global Warming Market Developments and Policy Considerations for Renewable Heat
Page | 37
reflective area made of a number of individual mirrors, and they automatically track the sun’s daily movement. A 10 m2 dish costs in the range of USD 1 450 to USD 2 900, and can provide about 22 kilowatt hours thermal per day (IEA, 2011a).
Figure 21 • Scheffler dishes associated in pairs in a cooking system at Hyderabad (India)
Photo courtesy of Deepak Gadhia.
Mid‐sized industrial solar ovens are based on two‐stage reflection. Heliostats, mirrors tracking the sun’s movement, concentrate the sunlight onto a large parabola, which then concentrates the rays on a fixed target. The technology is in an early stage of development, and the few installations that exist are mainly focussed on material testing (IEA, 2011a).
High‐concentrating, sun‐tracking solar technologies are mainly used to produce high‐temperature heat for electricity generation via steam turbines to date. However, they can also be used in heat applications in industry, or waste or surplus heat can be utilised in co‐generation installations. Concentrating solar thermal collectors generally need to track the sun (with one‐ or two‐axis tracking). Only devices with very low concentration can be mounted as stationary or with seasonal tracking only (IEA, 2011a).
For specific, very high‐temperature applications in industry, industrial solar ovens can be used to generate temperatures of up to several thousand degrees Celsius. As such, there is potential to use solar ovens in various industries, from firing pottery kilns to glass, aluminium and bronze production as well as specialty applications such as material testing (IEA, 2011a). However, the technology is yet in an early stage, and more pilot projects are needed to further explore the economical feasibility of using solar ovens in these processes at a commercial scale.
Solar thermal energy use for heat in buildings
Solar thermal heating installations have been growing considerably around the globe in the last decade. According to Mauthner and Weiss (2013), global installed solar thermal capacity was 268 gigawatts thermal (GWth) in 2012, including district heating and industry installations. Global solar thermal energy use for heat in buildings grew at 12% per year on average, and reached 0.7 EJ
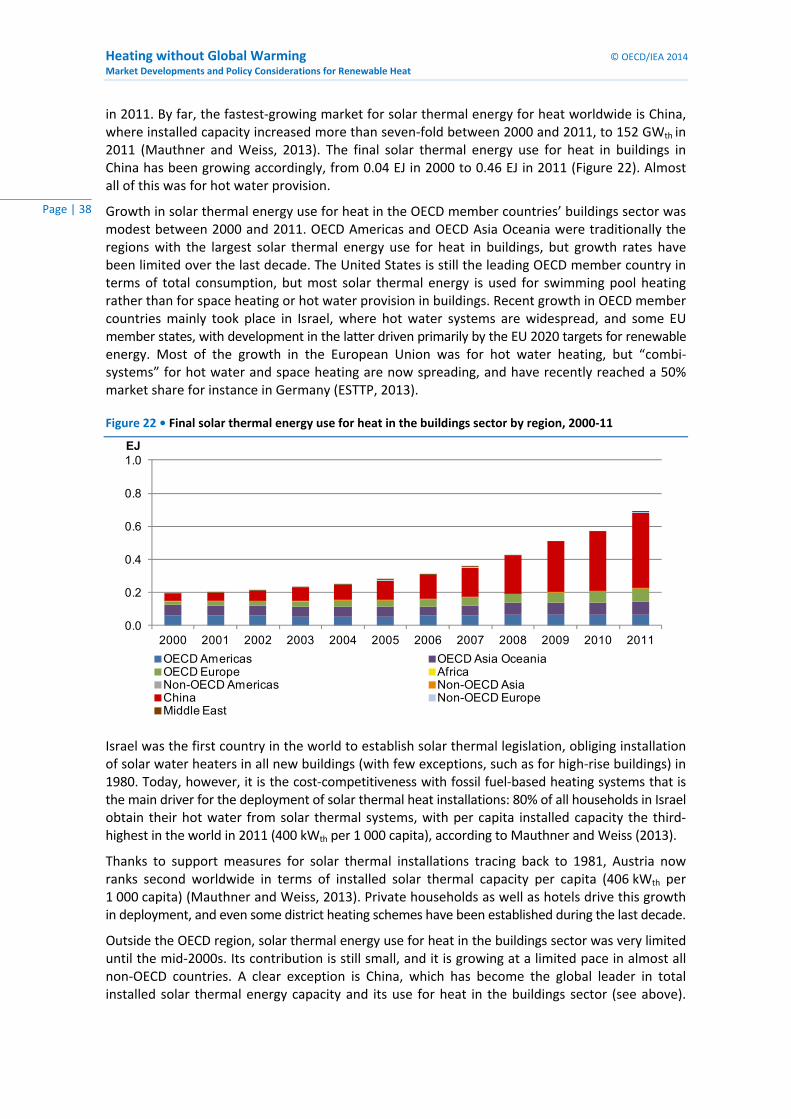
Heating without Global Warming © OECD/IEA 2014
Market Developments and Policy Considerations for Renewable Heat
Page | 38
in 2011. By far, the fastest‐growing market for solar thermal energy for heat worldwide is China, where installed capacity increased more than seven‐fold between 2000 and 2011, to 152 GWth in 2011 (Mauthner and Weiss, 2013). The final solar thermal energy use for heat in buildings in China has been growing accordingly, from 0.04 EJ in 2000 to 0.46 EJ in 2011 (Figure 22). Almost all of this was for hot water provision.
Growth in solar thermal energy use for heat in the OECD member countries’ buildings sector was modest between 2000 and 2011. OECD Americas and OECD Asia Oceania were traditionally the regions with the largest solar thermal energy use for heat in buildings, but growth rates have been limited over the last decade. The United States is still the leading OECD member country in terms of total consumption, but most solar thermal energy is used for swimming pool heating rather than for space heating or hot water provision in buildings. Recent growth in OECD member countries mainly took place in Israel, where hot water systems are widespread, and some EU member states, with development in the latter driven primarily by the EU 2020 targets for renewable energy. Most of the growth in the European Union was for hot water heating, but “combi‐systems” for hot water and space heating are now spreading, and have recently reached a 50% market share for instance in Germany (ESTTP, 2013).
Figure 22 • Final solar thermal energy use for heat in the buildings sector by region, 2000‐11
0.0
0.2
0.4
0.6
0.8
1.0
2000 2001 2002 2003 2004 2005 2006 2007 2008 2009 2010 2011
EJ
OECD Americas OECD Asia Oceania OECD Europe Africa Non-OECD Americas Non-OECD AsiaChina Non-OECD EuropeMiddle East
Israel was the first country in the world to establish solar thermal legislation, obliging installation of solar water heaters in all new buildings (with few exceptions, such as for high‐rise buildings) in 1980. Today, however, it is the cost‐competitiveness with fossil fuel‐based heating systems that is the main driver for the deployment of solar thermal heat installations: 80% of all households in Israel obtain their hot water from solar thermal systems, with per capita installed capacity the third‐highest in the world in 2011 (400 kWth per 1 000 capita), according to Mauthner and Weiss (2013).
Thanks to support measures for solar thermal installations tracing back to 1981, Austria now ranks second worldwide in terms of installed solar thermal capacity per capita (406 kWth per 1 000 capita) (Mauthner and Weiss, 2013). Private households as well as hotels drive this growth in deployment, and even some district heating schemes have been established during the last decade.
Outside the OECD region, solar thermal energy use for heat in the buildings sector was very limited until the mid‐2000s. Its contribution is still small, and it is growing at a limited pace in almost all non‐OECD countries. A clear exception is China, which has become the global leader in total installed solar thermal energy capacity and its use for heat in the buildings sector (see above).
© OECD/IEA 2014 Heating without Global Warming Market Developments and Policy Considerations for Renewable Heat
Page | 39
India is catching up since the National Solar Mission was published in 2010 with the long‐term objective to install 14 GWth (20 million m2) of solar thermal capacity by 2022. Including newly installed annual solar thermal capacity, India ranks third after China and Turkey in 2013.
The success of solar thermal installations in China is primarily due to the cost‐competitiveness of solar water heating systems compared with gas or electricity. While initial investment costs for solar thermal water heaters are higher than for gas‐ or electricity‐based heating systems, the average annual investment over the lifetime of a solar thermal heater is only one‐third to one‐fourth of the cost of a gas or electric heating system thanks to the fuel cost savings (IEA, 2012c). Most solar heating systems have previously been installed in rural areas, but according to industry sources the number of new installations in this segment has been shrinking in recent years. Almost 50% of the market is now with newly built buildings in urban areas, due to the introduction of solar obligations for larger building complexes in several cities and municipalities under the Renewable Energy Law of 2006 (Solarthermalworld.org, 2013a). As of March 2012, a solar obligation for new buildings has also been introduced in Beijing, which will likely lead to adoption of more building‐integrated solar thermal heating systems to meet the requirements of high‐rise buildings.
Solar thermal energy use for heat in industry
Process heat accounts for the major share of energy consumption in industry, and more than half of the heat demand, on average, is in the low‐ and medium‐temperature range below 400°C (Figure 3). According to studies, two‐thirds of the medium‐temperature heat required in industry processes is at levels below 200°C, providing excellent opportunities for the enhanced use of solar thermal heat (IEA, 2011a).
The current level of solar thermal energy used for heat in industry represents only a fraction of the considerable potential for this technology: solar thermal energy provided only 0.001 EJ of total FEH in industry in 2011. Solar thermal energy use for heat is most common in the textile industry, because solar process heat applications are most competitive within low‐temperature processes (e.g. textile drying in Greece). There are also a considerable number of successful examples of solar thermal energy use for heat in other industry sectors today (e.g. copper mining in Chile; metal processing/galvanisation in Germany), but most of the potential is still unexploited. The market continues to grow, but still only around 120 operating solar thermal systems with a total installed capacity of about 88 MWth (125 600 m
2) were dedicated to industrial process heat in early 2014, according to the IEA Solar Heating and Cooling Implementing Agreement project database.8
Solar thermal energy use for heat: Conclusions
The solar thermal heat market is growing dynamically, and solar thermal energy use for heat in buildings has increased significantly in a number of countries, whereas industrial applications for solar thermal heat are still a niche market. In all countries with considerable solar thermal energy used for heat, support policies have driven the initial solar thermal deployment. Obligations for solar thermal energy use in new or retrofitted buildings, and investment subsidies, as well as more general support measures such as CO2 taxes on fossil fuels are among the most widespread tools that have successfully supported market growth.
Still, the use of solar thermal energy for heat in buildings is at an early phase, and great potential exists for the enhanced use of this resource in a wider number of countries. Not every country has the suitable pre‐conditions, though, as resource availability obviously plays a key role for the
8 www.iea‐shc.org.
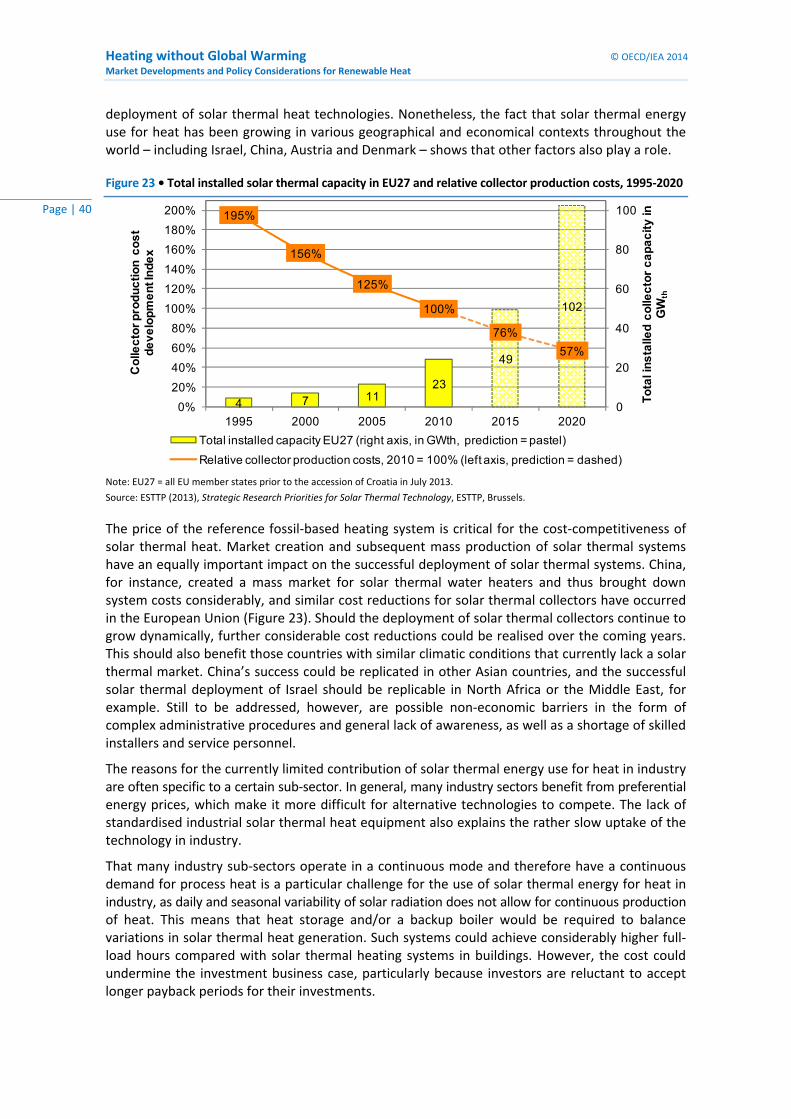
Heating without Global Warming © OECD/IEA 2014
Market Developments and Policy Considerations for Renewable Heat
Page | 40
deployment of solar thermal heat technologies. Nonetheless, the fact that solar thermal energy use for heat has been growing in various geographical and economical contexts throughout the world – including Israel, China, Austria and Denmark – shows that other factors also play a role.
Figure 23 • Total installed solar thermal capacity in EU27 and relative collector production costs, 1995‐2020
4 7 1123
49
102
195%
156%
125%
100%
76%
57%
0
20
40
60
80
100
0%
20%
40%
60%
80%
100%
120%
140%
160%
180%
200%
1995 2000 2005 2010 2015 2020
Tota
l ins
talle
d co
llect
or c
apac
ity in
G
Wth
Col
lect
or p
rodu
ctio
n co
st
deve
lopm
ent I
ndex
Total installed capacity EU27 (right axis, in GWth, prediction = pastel)
Relative collector production costs, 2010 = 100% (left axis, prediction = dashed) Note: EU27 = all EU member states prior to the accession of Croatia in July 2013.
Source: ESTTP (2013), Strategic Research Priorities for Solar Thermal Technology, ESTTP, Brussels.
The price of the reference fossil‐based heating system is critical for the cost‐competitiveness of solar thermal heat. Market creation and subsequent mass production of solar thermal systems have an equally important impact on the successful deployment of solar thermal systems. China, for instance, created a mass market for solar thermal water heaters and thus brought down system costs considerably, and similar cost reductions for solar thermal collectors have occurred in the European Union (Figure 23). Should the deployment of solar thermal collectors continue to grow dynamically, further considerable cost reductions could be realised over the coming years. This should also benefit those countries with similar climatic conditions that currently lack a solar thermal market. China’s success could be replicated in other Asian countries, and the successful solar thermal deployment of Israel should be replicable in North Africa or the Middle East, for example. Still to be addressed, however, are possible non‐economic barriers in the form of complex administrative procedures and general lack of awareness, as well as a shortage of skilled installers and service personnel.
The reasons for the currently limited contribution of solar thermal energy use for heat in industry are often specific to a certain sub‐sector. In general, many industry sectors benefit from preferential energy prices, which make it more difficult for alternative technologies to compete. The lack of standardised industrial solar thermal heat equipment also explains the rather slow uptake of the technology in industry.
That many industry sub‐sectors operate in a continuous mode and therefore have a continuous demand for process heat is a particular challenge for the use of solar thermal energy for heat in industry, as daily and seasonal variability of solar radiation does not allow for continuous production of heat. This means that heat storage and/or a backup boiler would be required to balance variations in solar thermal heat generation. Such systems could achieve considerably higher full‐load hours compared with solar thermal heating systems in buildings. However, the cost could undermine the investment business case, particularly because investors are reluctant to accept longer payback periods for their investments.
© OECD/IEA 2014 Heating without Global Warming Market Developments and Policy Considerations for Renewable Heat
Page | 41
For high‐temperature applications, solar thermal energy is not currently a feasible option, as high‐concentrating solar thermal installations for industrial use are unavailable at commercial scale, and thus are not competitive with conventional technologies. In addition, iron and steel production require fuels that act as reducing agents in the process, a characteristic that cannot be achieved by solar thermal energy.
Nonetheless, there are a range of low‐ and medium‐temperature industrial processes for which a great potential for the enhanced use of solar thermal energy for heat exists, such as in the food and textile sectors, and a number of successful projects exists worldwide (e.g. the InSun project,9 the So‐Pro Project10). The best pre‐conditions for the cost‐effective use of solar thermal heat in industry processes exist in those regions with considerable solar resources and limited seasonal variability. Also, in regions with high fossil fuel prices, solar thermal can make economic sense even if it replaces only part of the total heat load. With an increasing number of installations and advances in standardisation of equipment, system costs should continue to fall and opportunities for the use of solar thermal energy for industrial heat in a broader number of geographical contexts will present themselves.
Solar thermal technology development and RD&D needs
Good progress in the development of different solar thermal heat technologies has been made over the last two decades, but further RD&D is needed. The IEA solar heating and cooling roadmap (IEA, 2012c) and other research (EC/RHC‐Platform, 2013) highlight a number of technical advancements that should help drive the use of solar thermal energy for heat:
Compact hybrid units combining solar thermal and backup heating systems would make installation and operation easier.
New concepts for the integration of the collector area and storage volume into buildings could greatly enhance the use of solar thermal energy for heating and cooling in urban areas.
Standardisation of equipment also needs to be addressed, and further RD&D on cost‐efficient solar thermal heat storage is needed to reduce daily and seasonal variability of solar thermal heat.
RD&D activities are also required to optimise new applications of solar thermal technologies to medium‐ and high‐temperature industrial processes.
9 www.fp7‐insun.eu. 10 www.solar‐process‐heat.eu.
Heating without Global Warming © OECD/IEA 2014
Market Developments and Policy Considerations for Renewable Heat
Page | 42
Geothermal energy
Geothermal energy sources
Geothermal energy originates from the thermal energy in the Earth’s interior, and can be stored either in rock, liquid water or trapped steam. It is therefore the only renewable source of energy for heat that does not originate from the sun, which makes it independent of weather and season. There are three types of geothermal resources: convective or hydrothermal systems, conductive systems, and deep aquifers. Ambient heat at shallow depth that is extracted via heat pumps is not considered geothermal energy and is therefore not discussed here (see next chapter for more details).
Hydrothermal systems are based on naturally occurring water or vapour (steam) flows from inside the Earth to the surface – commonly known as hot springs or geysers – and can be found near tectonic plate boundaries, where seismic activity results in cracking of the Earth’s surface. Hydrothermal resources are the most widely used geothermal source today, and can provide heat at temperatures ranging from 100°C to 300°C (IEA, 2011c).
The second type of resource is deep aquifers, in which fluids are circulating in porous bedrock or fracture zones. These resources can typically be reached within a depth of 3 km, and can be sub‐divided into systems with hydrostatic pressure, as well as geo‐pressured systems where the pressure is higher than that of hydrostatic systems. Depending on the specific conditions, deep aquifers systems can provide heat at temperatures of 60°C to more than 300°C. In addition to natural aquifers, oil and gas fields can be a hydrothermal resource, as the water used in extraction warms up and could be used for heat and/or power generation.
The third resource is conductive systems, in which no natural flow of liquid exists, and artificial injection of water via fracking of the bedrock is required to extract the heat. The systems can be shallow systems that use ambient heat at a depth of less than 400m, hot rock resources at a depth of up to 5 km, or magma bodies that can typically be found at greater depths and have not yet been used for energy purposes. The different sources can provide low‐temperature heat (<°100°C) in shallow systems, medium‐temperature heat (100°C to 180°C) in hot rock sources, and heat with a temperature of more than 180°C in hot rock and magma systems (IEA, 2011c).
Geothermal heat technologies
Direct use
Geothermal energy can be used directly for heating and cooling purposes in buildings, for district heating, greenhouses, pools, and for industrial process heat. The hot water extracted from a hydrothermal resource or a deep aquifer can be used directly and be distributed through pipes to
Conventional geothermal technologies for heating are well established in the market, and often cost‐competitive with fossil fuels, but their potential is geographically limited. EGSs, which would considerably expand the potential for geothermal energy use for heat, are in an advanced demonstration phase with further technology improvements needed for full market penetration.
Global geothermal capacity stood at 45 GWth, and geothermal energy use for heat in buildings reached 0.3 EJ in 2011. China (0.13 EJ), Turkey (0.06 EJ) and Iceland (0.02 EJ) had the highest consumption of geothermal heat in the buildings sector.
In the industry sector, geothermal energy plays a very small role today: geothermal energy use for industrial heat stood at 0.02 EJ in 2011. The geographically limited availability of geothermal energy is the main reason for the lack of deployment.
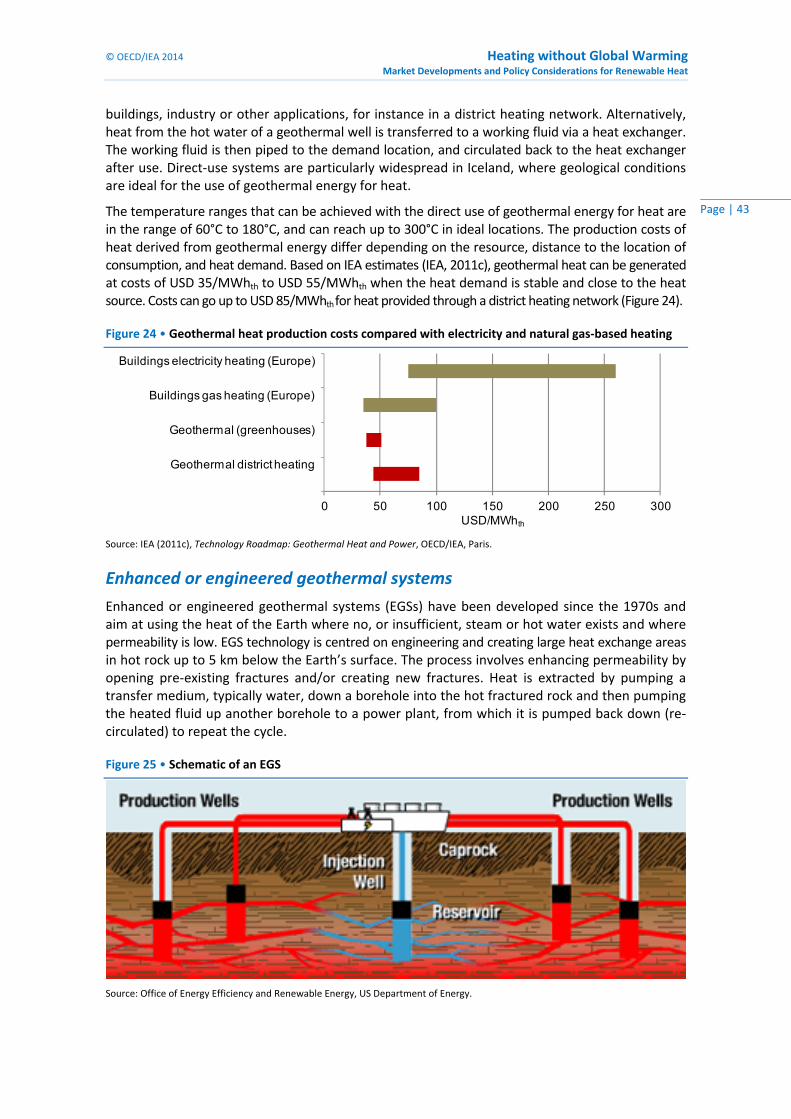
© OECD/IEA 2014 Heating without Global Warming Market Developments and Policy Considerations for Renewable Heat
Page | 43
buildings, industry or other applications, for instance in a district heating network. Alternatively, heat from the hot water of a geothermal well is transferred to a working fluid via a heat exchanger. The working fluid is then piped to the demand location, and circulated back to the heat exchanger after use. Direct‐use systems are particularly widespread in Iceland, where geological conditions are ideal for the use of geothermal energy for heat.
The temperature ranges that can be achieved with the direct use of geothermal energy for heat are in the range of 60°C to 180°C, and can reach up to 300°C in ideal locations. The production costs of heat derived from geothermal energy differ depending on the resource, distance to the location of consumption, and heat demand. Based on IEA estimates (IEA, 2011c), geothermal heat can be generated at costs of USD 35/MWhth to USD 55/MWhth when the heat demand is stable and close to the heat source. Costs can go up to USD 85/MWhth for heat provided through a district heating network (Figure 24).
Figure 24 • Geothermal heat production costs compared with electricity and natural gas‐based heating
0 50 100 150 200 250 300
Geothermal district heating
Geothermal (greenhouses)
Buildings gas heating (Europe)
Buildings electricity heating (Europe)
USD/MWhth Source: IEA (2011c), Technology Roadmap: Geothermal Heat and Power, OECD/IEA, Paris.
Enhanced or engineered geothermal systems
Enhanced or engineered geothermal systems (EGSs) have been developed since the 1970s and aim at using the heat of the Earth where no, or insufficient, steam or hot water exists and where permeability is low. EGS technology is centred on engineering and creating large heat exchange areas in hot rock up to 5 km below the Earth’s surface. The process involves enhancing permeability by opening pre‐existing fractures and/or creating new fractures. Heat is extracted by pumping a transfer medium, typically water, down a borehole into the hot fractured rock and then pumping the heated fluid up another borehole to a power plant, from which it is pumped back down (re‐circulated) to repeat the cycle.
Figure 25 • Schematic of an EGS
Source: Office of Energy Efficiency and Renewable Energy, US Department of Energy.
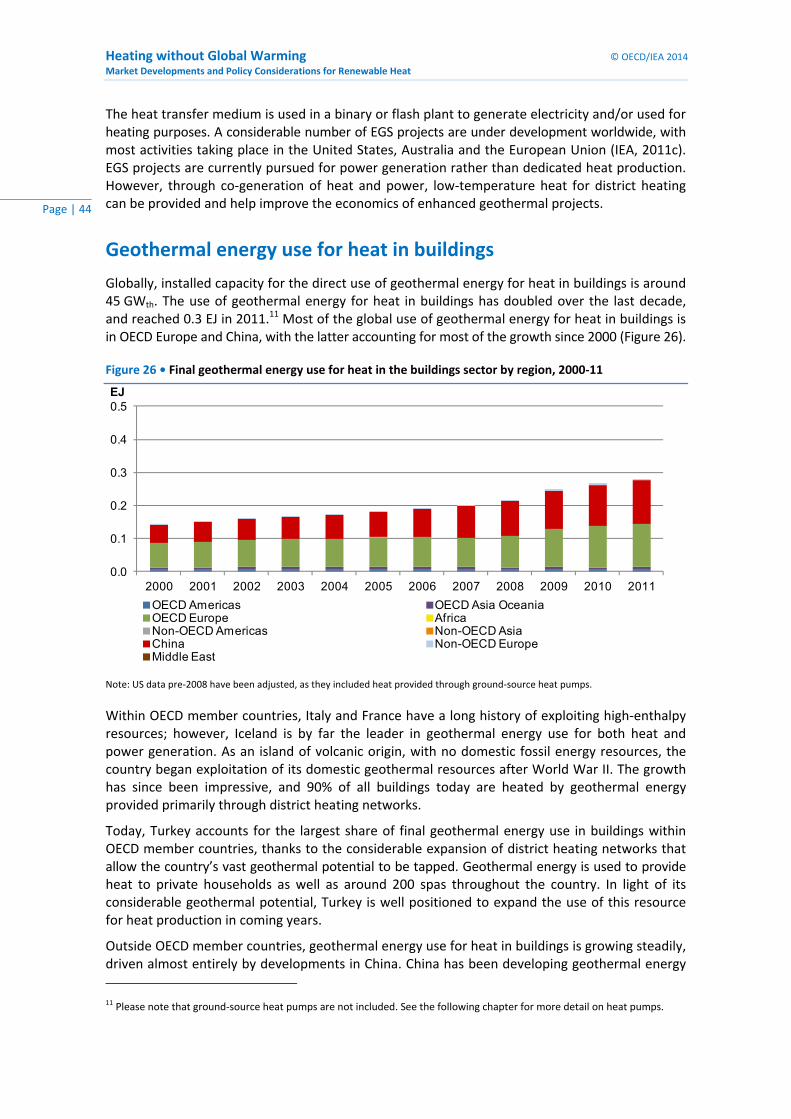
Heating without Global Warming © OECD/IEA 2014
Market Developments and Policy Considerations for Renewable Heat
Page | 44
The heat transfer medium is used in a binary or flash plant to generate electricity and/or used for heating purposes. A considerable number of EGS projects are under development worldwide, with most activities taking place in the United States, Australia and the European Union (IEA, 2011c). EGS projects are currently pursued for power generation rather than dedicated heat production. However, through co‐generation of heat and power, low‐temperature heat for district heating can be provided and help improve the economics of enhanced geothermal projects.
Geothermal energy use for heat in buildings
Globally, installed capacity for the direct use of geothermal energy for heat in buildings is around 45 GWth. The use of geothermal energy for heat in buildings has doubled over the last decade, and reached 0.3 EJ in 2011.11 Most of the global use of geothermal energy for heat in buildings is in OECD Europe and China, with the latter accounting for most of the growth since 2000 (Figure 26).
Figure 26 • Final geothermal energy use for heat in the buildings sector by region, 2000‐11
0.0
0.1
0.2
0.3
0.4
0.5
2000 2001 2002 2003 2004 2005 2006 2007 2008 2009 2010 2011
EJ
OECD Americas OECD Asia Oceania OECD Europe Africa Non-OECD Americas Non-OECD AsiaChina Non-OECD EuropeMiddle East
Note: US data pre‐2008 have been adjusted, as they included heat provided through ground‐source heat pumps.
Within OECD member countries, Italy and France have a long history of exploiting high‐enthalpy resources; however, Iceland is by far the leader in geothermal energy use for both heat and power generation. As an island of volcanic origin, with no domestic fossil energy resources, the country began exploitation of its domestic geothermal resources after World War II. The growth has since been impressive, and 90% of all buildings today are heated by geothermal energy provided primarily through district heating networks.
Today, Turkey accounts for the largest share of final geothermal energy use in buildings within OECD member countries, thanks to the considerable expansion of district heating networks that allow the country’s vast geothermal potential to be tapped. Geothermal energy is used to provide heat to private households as well as around 200 spas throughout the country. In light of its considerable geothermal potential, Turkey is well positioned to expand the use of this resource for heat production in coming years.
Outside OECD member countries, geothermal energy use for heat in buildings is growing steadily, driven almost entirely by developments in China. China has been developing geothermal energy
11 Please note that ground‐source heat pumps are not included. See the following chapter for more detail on heat pumps.
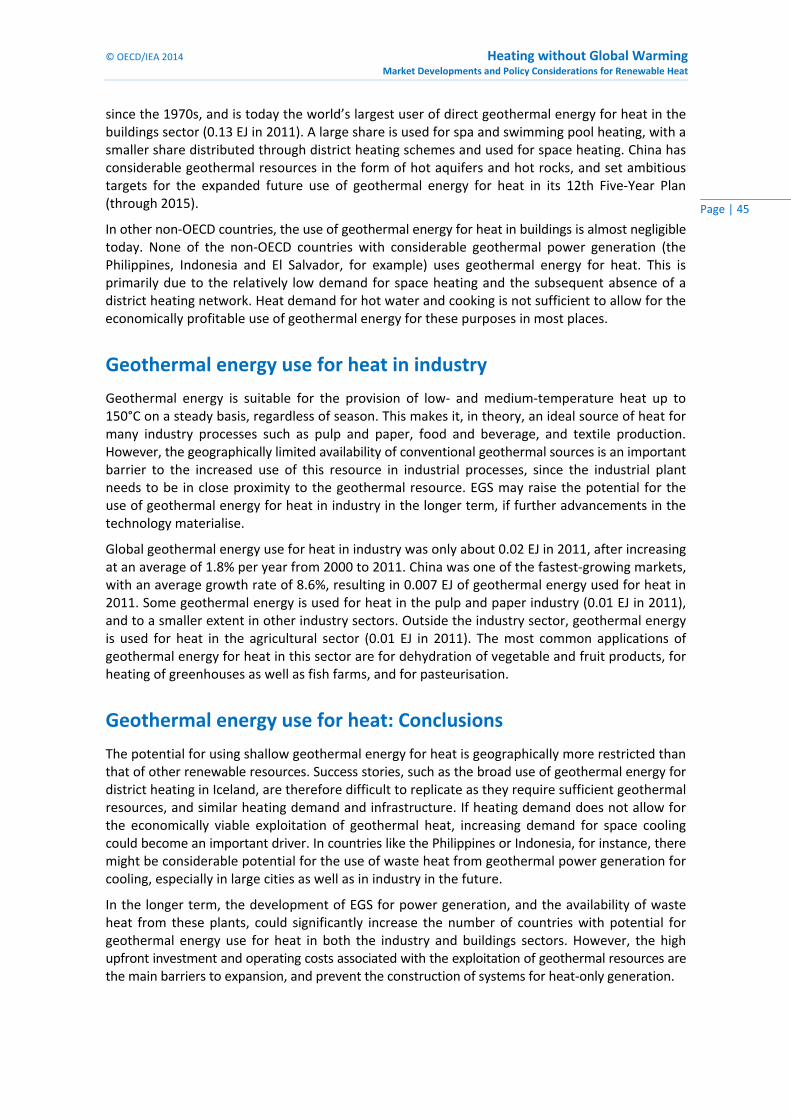
© OECD/IEA 2014 Heating without Global Warming Market Developments and Policy Considerations for Renewable Heat
Page | 45
since the 1970s, and is today the world’s largest user of direct geothermal energy for heat in the buildings sector (0.13 EJ in 2011). A large share is used for spa and swimming pool heating, with a smaller share distributed through district heating schemes and used for space heating. China has considerable geothermal resources in the form of hot aquifers and hot rocks, and set ambitious targets for the expanded future use of geothermal energy for heat in its 12th Five‐Year Plan (through 2015).
In other non‐OECD countries, the use of geothermal energy for heat in buildings is almost negligible today. None of the non‐OECD countries with considerable geothermal power generation (the Philippines, Indonesia and El Salvador, for example) uses geothermal energy for heat. This is primarily due to the relatively low demand for space heating and the subsequent absence of a district heating network. Heat demand for hot water and cooking is not sufficient to allow for the economically profitable use of geothermal energy for these purposes in most places.
Geothermal energy use for heat in industry
Geothermal energy is suitable for the provision of low‐ and medium‐temperature heat up to 150°C on a steady basis, regardless of season. This makes it, in theory, an ideal source of heat for many industry processes such as pulp and paper, food and beverage, and textile production. However, the geographically limited availability of conventional geothermal sources is an important barrier to the increased use of this resource in industrial processes, since the industrial plant needs to be in close proximity to the geothermal resource. EGS may raise the potential for the use of geothermal energy for heat in industry in the longer term, if further advancements in the technology materialise.
Global geothermal energy use for heat in industry was only about 0.02 EJ in 2011, after increasing at an average of 1.8% per year from 2000 to 2011. China was one of the fastest‐growing markets, with an average growth rate of 8.6%, resulting in 0.007 EJ of geothermal energy used for heat in 2011. Some geothermal energy is used for heat in the pulp and paper industry (0.01 EJ in 2011), and to a smaller extent in other industry sectors. Outside the industry sector, geothermal energy is used for heat in the agricultural sector (0.01 EJ in 2011). The most common applications of geothermal energy for heat in this sector are for dehydration of vegetable and fruit products, for heating of greenhouses as well as fish farms, and for pasteurisation.
Geothermal energy use for heat: Conclusions
The potential for using shallow geothermal energy for heat is geographically more restricted than that of other renewable resources. Success stories, such as the broad use of geothermal energy for district heating in Iceland, are therefore difficult to replicate as they require sufficient geothermal resources, and similar heating demand and infrastructure. If heating demand does not allow for the economically viable exploitation of geothermal heat, increasing demand for space cooling could become an important driver. In countries like the Philippines or Indonesia, for instance, there might be considerable potential for the use of waste heat from geothermal power generation for cooling, especially in large cities as well as in industry in the future.
In the longer term, the development of EGS for power generation, and the availability of waste heat from these plants, could significantly increase the number of countries with potential for geothermal energy use for heat in both the industry and buildings sectors. However, the high upfront investment and operating costs associated with the exploitation of geothermal resources are the main barriers to expansion, and prevent the construction of systems for heat‐only generation.

Heating without Global Warming © OECD/IEA 2014
Market Developments and Policy Considerations for Renewable Heat
Page | 46
Geothermal technology development and RD&D needs
The IEA technology roadmap on geothermal heat and power (IEA, 2011c) and others (e.g. EC/RHC‐Platform, 2013) highlight a number of critical technology developments needed to enhance the use of geothermal heat and power in the future:
Geothermal well design has reached a high standard, but further advancements are needed in production pump technology, particularly in submersible pumps for high‐temperature operations.
Optimised heat transfer from the ground source to the distribution system is needed to increase heat exchange efficiency and component longevity in the water thermal circuit.
Development of better databases on geothermal resources is needed to highlight the geothermal energy potential in different regions.
Commercialisation of EGS, in combination with continuous improvements of the efficiency of co‐generation plants, is needed to significantly enhance the potential for use of geothermal energy for heat in many regions.
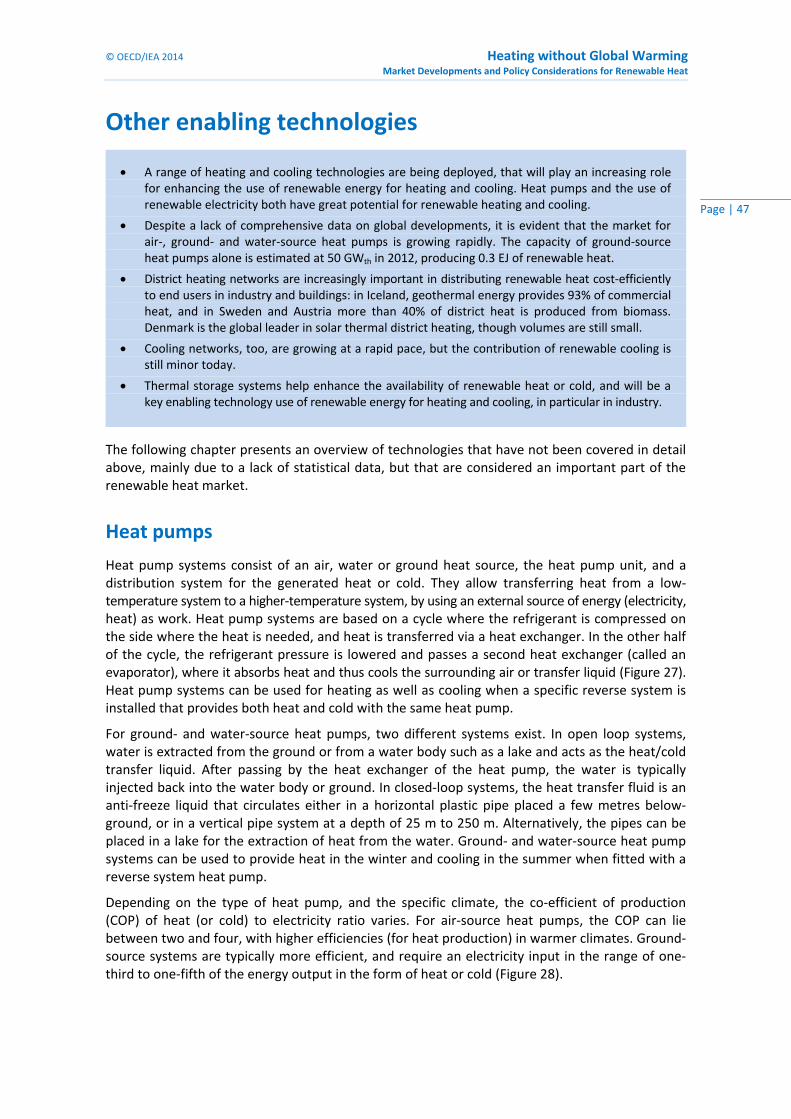
© OECD/IEA 2014 Heating without Global Warming Market Developments and Policy Considerations for Renewable Heat
Page | 47
Other enabling technologies
The following chapter presents an overview of technologies that have not been covered in detail above, mainly due to a lack of statistical data, but that are considered an important part of the renewable heat market.
Heat pumps
Heat pump systems consist of an air, water or ground heat source, the heat pump unit, and a distribution system for the generated heat or cold. They allow transferring heat from a low‐temperature system to a higher‐temperature system, by using an external source of energy (electricity, heat) as work. Heat pump systems are based on a cycle where the refrigerant is compressed on the side where the heat is needed, and heat is transferred via a heat exchanger. In the other half of the cycle, the refrigerant pressure is lowered and passes a second heat exchanger (called an evaporator), where it absorbs heat and thus cools the surrounding air or transfer liquid (Figure 27). Heat pump systems can be used for heating as well as cooling when a specific reverse system is installed that provides both heat and cold with the same heat pump.
For ground‐ and water‐source heat pumps, two different systems exist. In open loop systems, water is extracted from the ground or from a water body such as a lake and acts as the heat/cold transfer liquid. After passing by the heat exchanger of the heat pump, the water is typically injected back into the water body or ground. In closed‐loop systems, the heat transfer fluid is an anti‐freeze liquid that circulates either in a horizontal plastic pipe placed a few metres below‐ground, or in a vertical pipe system at a depth of 25 m to 250 m. Alternatively, the pipes can be placed in a lake for the extraction of heat from the water. Ground‐ and water‐source heat pump systems can be used to provide heat in the winter and cooling in the summer when fitted with a reverse system heat pump.
Depending on the type of heat pump, and the specific climate, the co‐efficient of production (COP) of heat (or cold) to electricity ratio varies. For air‐source heat pumps, the COP can lie between two and four, with higher efficiencies (for heat production) in warmer climates. Ground‐source systems are typically more efficient, and require an electricity input in the range of one‐third to one‐fifth of the energy output in the form of heat or cold (Figure 28).
A range of heating and cooling technologies are being deployed, that will play an increasing role for enhancing the use of renewable energy for heating and cooling. Heat pumps and the use of renewable electricity both have great potential for renewable heating and cooling.
Despite a lack of comprehensive data on global developments, it is evident that the market for air‐, ground‐ and water‐source heat pumps is growing rapidly. The capacity of ground‐source heat pumps alone is estimated at 50 GWth in 2012, producing 0.3 EJ of renewable heat.
District heating networks are increasingly important in distributing renewable heat cost‐efficiently to end users in industry and buildings: in Iceland, geothermal energy provides 93% of commercial heat, and in Sweden and Austria more than 40% of district heat is produced from biomass. Denmark is the global leader in solar thermal district heating, though volumes are still small.
Cooling networks, too, are growing at a rapid pace, but the contribution of renewable cooling is still minor today.
Thermal storage systems help enhance the availability of renewable heat or cold, and will be a key enabling technology use of renewable energy for heating and cooling, in particular in industry.
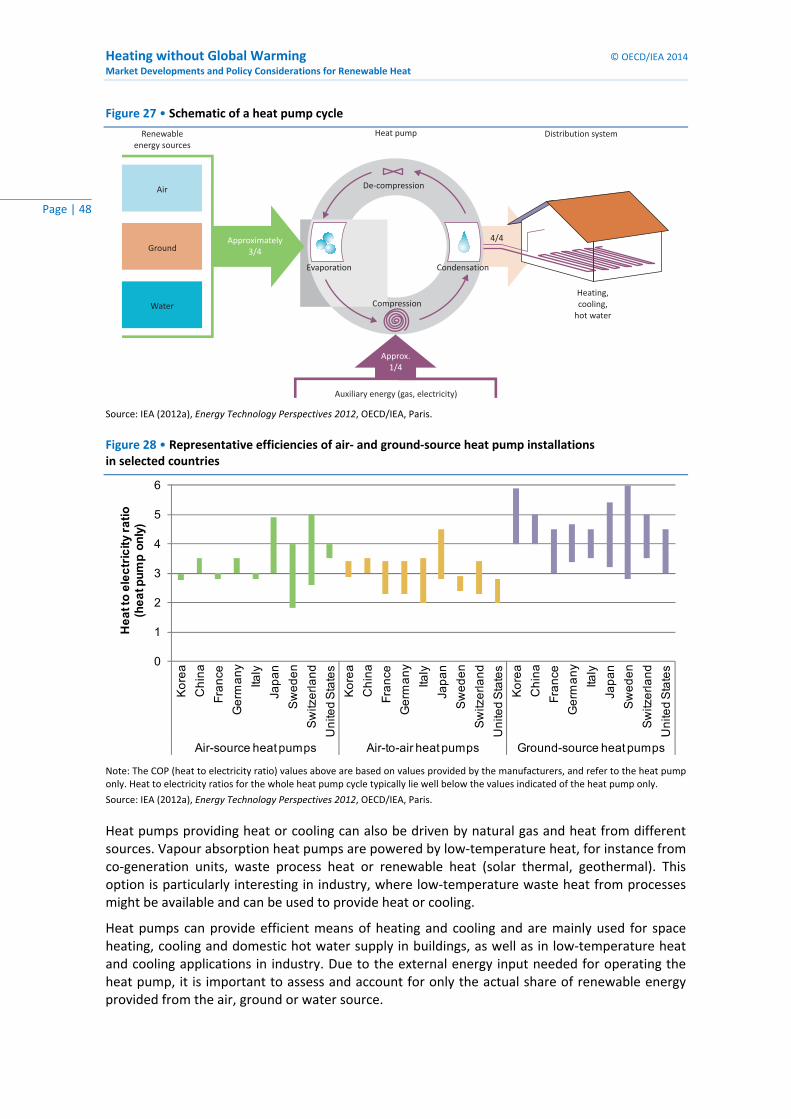
Heating without Global Warming © OECD/IEA 2014
Market Developments and Policy Considerations for Renewable Heat
Page | 48
Figure 27 • Schematic of a heat pump cycle
Heat pump Distribution system
Heating,
cooling,
hot water
Auxiliary energy (gas, electricity)
Compression
De-compression
Evaporation Condensation
Renewable
energy sources
Water
Ground
Air
4/4Approximately
3/4
Approx.
1/4
Source: IEA (2012a), Energy Technology Perspectives 2012, OECD/IEA, Paris.
Figure 28 • Representative efficiencies of air‐ and ground‐source heat pump installations in selected countries
0
1
2
3
4
5
6
Ko
rea
Ch
ina
Fra
nce
Ge
rma
ny
Italy
Jap
an
Sw
ed
en
Sw
itze
rla
nd
Un
ited
Sta
tes
Ko
rea
Ch
ina
Fra
nce
Ge
rma
ny
Italy
Jap
an
Sw
ed
en
Sw
itze
rla
nd
Un
ited
Sta
tes
Ko
rea
Ch
ina
Fra
nce
Ge
rma
ny
Italy
Jap
an
Sw
ed
en
Sw
itze
rla
nd
Un
ited
Sta
tes
Air-source heat pumps Air-to-air heat pumps Ground-source heat pumps
Hea
t to
elec
tric
ity ra
tio(h
eat p
ump
only
)
Note: The COP (heat to electricity ratio) values above are based on values provided by the manufacturers, and refer to the heat pump only. Heat to electricity ratios for the whole heat pump cycle typically lie well below the values indicated of the heat pump only.
Source: IEA (2012a), Energy Technology Perspectives 2012, OECD/IEA, Paris.
Heat pumps providing heat or cooling can also be driven by natural gas and heat from different sources. Vapour absorption heat pumps are powered by low‐temperature heat, for instance from co‐generation units, waste process heat or renewable heat (solar thermal, geothermal). This option is particularly interesting in industry, where low‐temperature waste heat from processes might be available and can be used to provide heat or cooling.
Heat pumps can provide efficient means of heating and cooling and are mainly used for space heating, cooling and domestic hot water supply in buildings, as well as in low‐temperature heat and cooling applications in industry. Due to the external energy input needed for operating the heat pump, it is important to assess and account for only the actual share of renewable energy provided from the air, ground or water source.
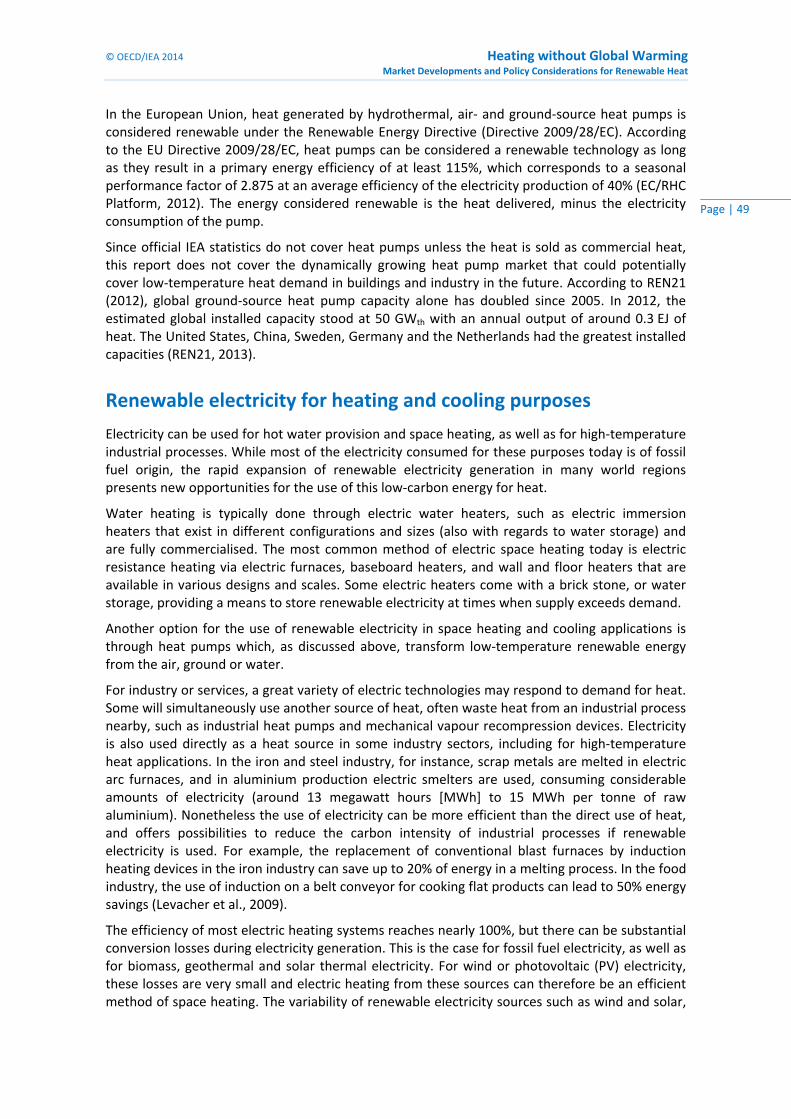
© OECD/IEA 2014 Heating without Global Warming Market Developments and Policy Considerations for Renewable Heat
Page | 49
In the European Union, heat generated by hydrothermal, air‐ and ground‐source heat pumps is considered renewable under the Renewable Energy Directive (Directive 2009/28/EC). According to the EU Directive 2009/28/EC, heat pumps can be considered a renewable technology as long as they result in a primary energy efficiency of at least 115%, which corresponds to a seasonal performance factor of 2.875 at an average efficiency of the electricity production of 40% (EC/RHC Platform, 2012). The energy considered renewable is the heat delivered, minus the electricity consumption of the pump.
Since official IEA statistics do not cover heat pumps unless the heat is sold as commercial heat, this report does not cover the dynamically growing heat pump market that could potentially cover low‐temperature heat demand in buildings and industry in the future. According to REN21 (2012), global ground‐source heat pump capacity alone has doubled since 2005. In 2012, the estimated global installed capacity stood at 50 GWth with an annual output of around 0.3 EJ of heat. The United States, China, Sweden, Germany and the Netherlands had the greatest installed capacities (REN21, 2013).
Renewable electricity for heating and cooling purposes
Electricity can be used for hot water provision and space heating, as well as for high‐temperature industrial processes. While most of the electricity consumed for these purposes today is of fossil fuel origin, the rapid expansion of renewable electricity generation in many world regions presents new opportunities for the use of this low‐carbon energy for heat.
Water heating is typically done through electric water heaters, such as electric immersion heaters that exist in different configurations and sizes (also with regards to water storage) and are fully commercialised. The most common method of electric space heating today is electric resistance heating via electric furnaces, baseboard heaters, and wall and floor heaters that are available in various designs and scales. Some electric heaters come with a brick stone, or water storage, providing a means to store renewable electricity at times when supply exceeds demand.
Another option for the use of renewable electricity in space heating and cooling applications is through heat pumps which, as discussed above, transform low‐temperature renewable energy from the air, ground or water.
For industry or services, a great variety of electric technologies may respond to demand for heat. Some will simultaneously use another source of heat, often waste heat from an industrial process nearby, such as industrial heat pumps and mechanical vapour recompression devices. Electricity is also used directly as a heat source in some industry sectors, including for high‐temperature heat applications. In the iron and steel industry, for instance, scrap metals are melted in electric arc furnaces, and in aluminium production electric smelters are used, consuming considerable amounts of electricity (around 13 megawatt hours [MWh] to 15 MWh per tonne of raw aluminium). Nonetheless the use of electricity can be more efficient than the direct use of heat, and offers possibilities to reduce the carbon intensity of industrial processes if renewable electricity is used. For example, the replacement of conventional blast furnaces by induction heating devices in the iron industry can save up to 20% of energy in a melting process. In the food industry, the use of induction on a belt conveyor for cooking flat products can lead to 50% energy savings (Levacher et al., 2009).
The efficiency of most electric heating systems reaches nearly 100%, but there can be substantial conversion losses during electricity generation. This is the case for fossil fuel electricity, as well as for biomass, geothermal and solar thermal electricity. For wind or photovoltaic (PV) electricity, these losses are very small and electric heating from these sources can therefore be an efficient method of space heating. The variability of renewable electricity sources such as wind and solar,
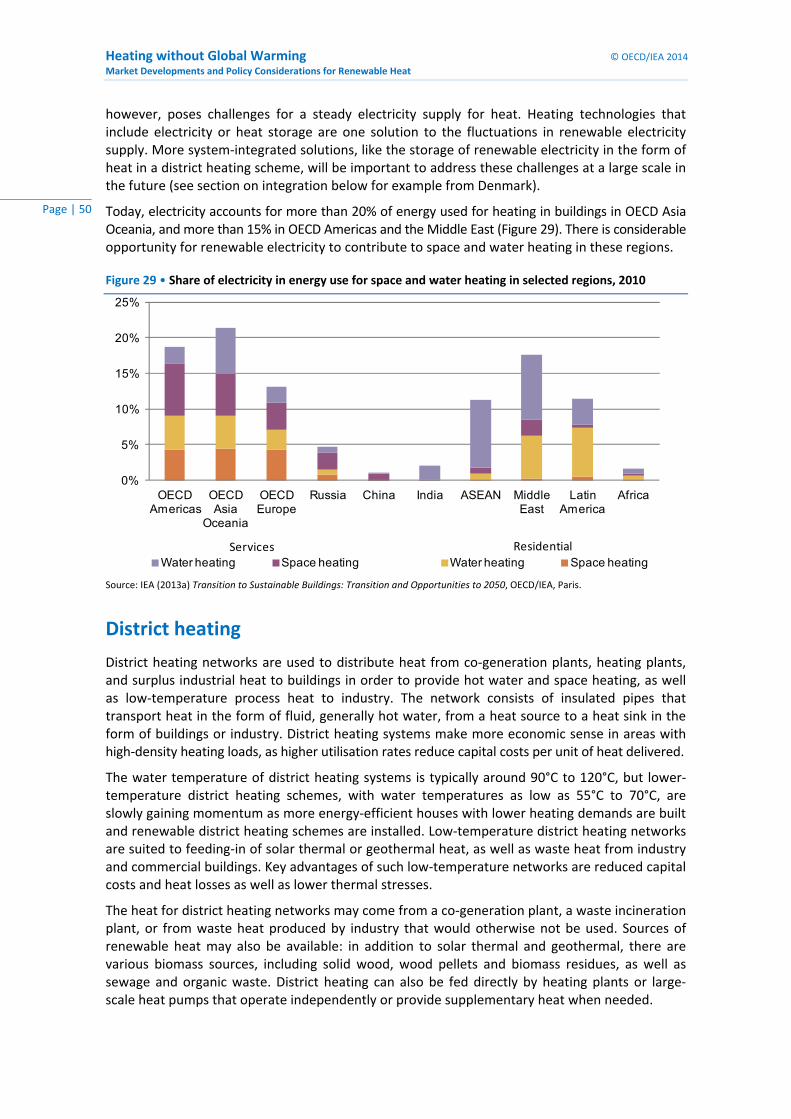
Heating without Global Warming © OECD/IEA 2014
Market Developments and Policy Considerations for Renewable Heat
Page | 50
however, poses challenges for a steady electricity supply for heat. Heating technologies that include electricity or heat storage are one solution to the fluctuations in renewable electricity supply. More system‐integrated solutions, like the storage of renewable electricity in the form of heat in a district heating scheme, will be important to address these challenges at a large scale in the future (see section on integration below for example from Denmark).
Today, electricity accounts for more than 20% of energy used for heating in buildings in OECD Asia Oceania, and more than 15% in OECD Americas and the Middle East (Figure 29). There is considerable opportunity for renewable electricity to contribute to space and water heating in these regions.
Figure 29 • Share of electricity in energy use for space and water heating in selected regions, 2010
0%
5%
10%
15%
20%
25%
OECD Americas
OECD Asia
Oceania
OECD Europe
Russia China India ASEAN Middle East
Latin America
Africa
Water heating Space heating Water heating Space heatingServices Residential
Source: IEA (2013a) Transition to Sustainable Buildings: Transition and Opportunities to 2050, OECD/IEA, Paris.
District heating
District heating networks are used to distribute heat from co‐generation plants, heating plants, and surplus industrial heat to buildings in order to provide hot water and space heating, as well as low‐temperature process heat to industry. The network consists of insulated pipes that transport heat in the form of fluid, generally hot water, from a heat source to a heat sink in the form of buildings or industry. District heating systems make more economic sense in areas with high‐density heating loads, as higher utilisation rates reduce capital costs per unit of heat delivered.
The water temperature of district heating systems is typically around 90°C to 120°C, but lower‐temperature district heating schemes, with water temperatures as low as 55°C to 70°C, are slowly gaining momentum as more energy‐efficient houses with lower heating demands are built and renewable district heating schemes are installed. Low‐temperature district heating networks are suited to feeding‐in of solar thermal or geothermal heat, as well as waste heat from industry and commercial buildings. Key advantages of such low‐temperature networks are reduced capital costs and heat losses as well as lower thermal stresses.
The heat for district heating networks may come from a co‐generation plant, a waste incineration plant, or from waste heat produced by industry that would otherwise not be used. Sources of renewable heat may also be available: in addition to solar thermal and geothermal, there are various biomass sources, including solid wood, wood pellets and biomass residues, as well as sewage and organic waste. District heating can also be fed directly by heating plants or large‐scale heat pumps that operate independently or provide supplementary heat when needed.
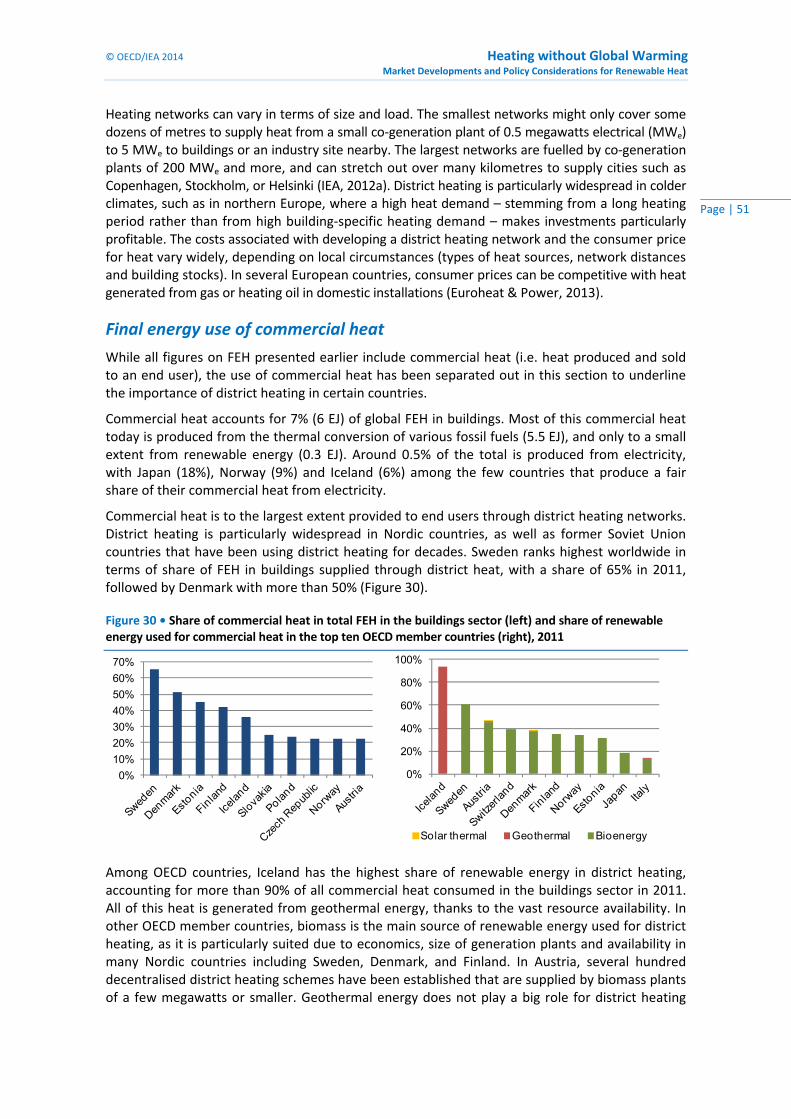
© OECD/IEA 2014 Heating without Global Warming Market Developments and Policy Considerations for Renewable Heat
Page | 51
Heating networks can vary in terms of size and load. The smallest networks might only cover some dozens of metres to supply heat from a small co‐generation plant of 0.5 megawatts electrical (MWe) to 5 MWe to buildings or an industry site nearby. The largest networks are fuelled by co‐generation plants of 200 MWe and more, and can stretch out over many kilometres to supply cities such as Copenhagen, Stockholm, or Helsinki (IEA, 2012a). District heating is particularly widespread in colder climates, such as in northern Europe, where a high heat demand – stemming from a long heating period rather than from high building‐specific heating demand – makes investments particularly profitable. The costs associated with developing a district heating network and the consumer price for heat vary widely, depending on local circumstances (types of heat sources, network distances and building stocks). In several European countries, consumer prices can be competitive with heat generated from gas or heating oil in domestic installations (Euroheat & Power, 2013).
Final energy use of commercial heat
While all figures on FEH presented earlier include commercial heat (i.e. heat produced and sold to an end user), the use of commercial heat has been separated out in this section to underline the importance of district heating in certain countries.
Commercial heat accounts for 7% (6 EJ) of global FEH in buildings. Most of this commercial heat today is produced from the thermal conversion of various fossil fuels (5.5 EJ), and only to a small extent from renewable energy (0.3 EJ). Around 0.5% of the total is produced from electricity, with Japan (18%), Norway (9%) and Iceland (6%) among the few countries that produce a fair share of their commercial heat from electricity.
Commercial heat is to the largest extent provided to end users through district heating networks. District heating is particularly widespread in Nordic countries, as well as former Soviet Union countries that have been using district heating for decades. Sweden ranks highest worldwide in terms of share of FEH in buildings supplied through district heat, with a share of 65% in 2011, followed by Denmark with more than 50% (Figure 30).
Figure 30 • Share of commercial heat in total FEH in the buildings sector (left) and share of renewable energy used for commercial heat in the top ten OECD member countries (right), 2011
0%
10%
20%
30%
40%
50%
60%
70%
0%
20%
40%
60%
80%
100%
Solar thermal Geothermal Bioenergy
Among OECD countries, Iceland has the highest share of renewable energy in district heating, accounting for more than 90% of all commercial heat consumed in the buildings sector in 2011. All of this heat is generated from geothermal energy, thanks to the vast resource availability. In other OECD member countries, biomass is the main source of renewable energy used for district heating, as it is particularly suited due to economics, size of generation plants and availability in many Nordic countries including Sweden, Denmark, and Finland. In Austria, several hundred decentralised district heating schemes have been established that are supplied by biomass plants of a few megawatts or smaller. Geothermal energy does not play a big role for district heating
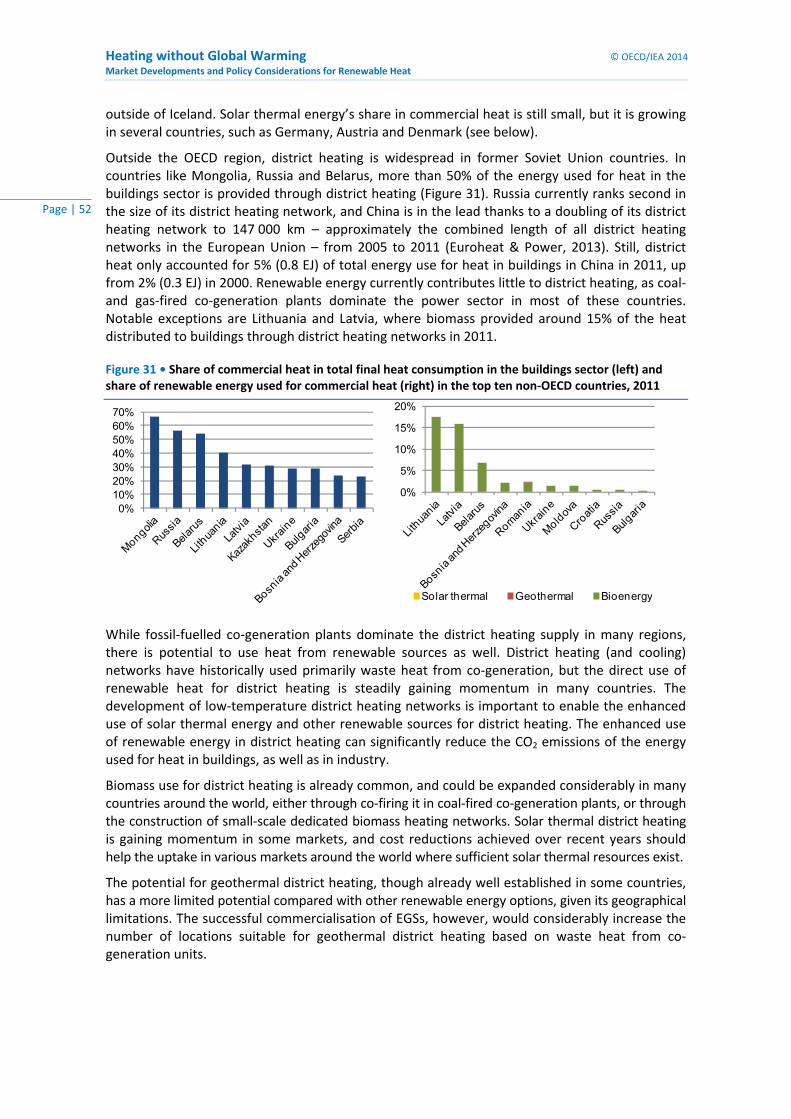
Heating without Global Warming © OECD/IEA 2014
Market Developments and Policy Considerations for Renewable Heat
Page | 52
outside of Iceland. Solar thermal energy’s share in commercial heat is still small, but it is growing in several countries, such as Germany, Austria and Denmark (see below).
Outside the OECD region, district heating is widespread in former Soviet Union countries. In countries like Mongolia, Russia and Belarus, more than 50% of the energy used for heat in the buildings sector is provided through district heating (Figure 31). Russia currently ranks second in the size of its district heating network, and China is in the lead thanks to a doubling of its district heating network to 147 000 km – approximately the combined length of all district heating networks in the European Union – from 2005 to 2011 (Euroheat & Power, 2013). Still, district heat only accounted for 5% (0.8 EJ) of total energy use for heat in buildings in China in 2011, up from 2% (0.3 EJ) in 2000. Renewable energy currently contributes little to district heating, as coal‐ and gas‐fired co‐generation plants dominate the power sector in most of these countries. Notable exceptions are Lithuania and Latvia, where biomass provided around 15% of the heat distributed to buildings through district heating networks in 2011.
Figure 31 • Share of commercial heat in total final heat consumption in the buildings sector (left) and share of renewable energy used for commercial heat (right) in the top ten non‐OECD countries, 2011
0%10%20%30%40%50%60%70%
0%
5%
10%
15%
20%
Solar thermal Geothermal Bioenergy
While fossil‐fuelled co‐generation plants dominate the district heating supply in many regions, there is potential to use heat from renewable sources as well. District heating (and cooling) networks have historically used primarily waste heat from co‐generation, but the direct use of renewable heat for district heating is steadily gaining momentum in many countries. The development of low‐temperature district heating networks is important to enable the enhanced use of solar thermal energy and other renewable sources for district heating. The enhanced use of renewable energy in district heating can significantly reduce the CO2 emissions of the energy used for heat in buildings, as well as in industry.
Biomass use for district heating is already common, and could be expanded considerably in many countries around the world, either through co‐firing it in coal‐fired co‐generation plants, or through the construction of small‐scale dedicated biomass heating networks. Solar thermal district heating is gaining momentum in some markets, and cost reductions achieved over recent years should help the uptake in various markets around the world where sufficient solar thermal resources exist.
The potential for geothermal district heating, though already well established in some countries, has a more limited potential compared with other renewable energy options, given its geographical limitations. The successful commercialisation of EGSs, however, would considerably increase the number of locations suitable for geothermal district heating based on waste heat from co‐generation units.
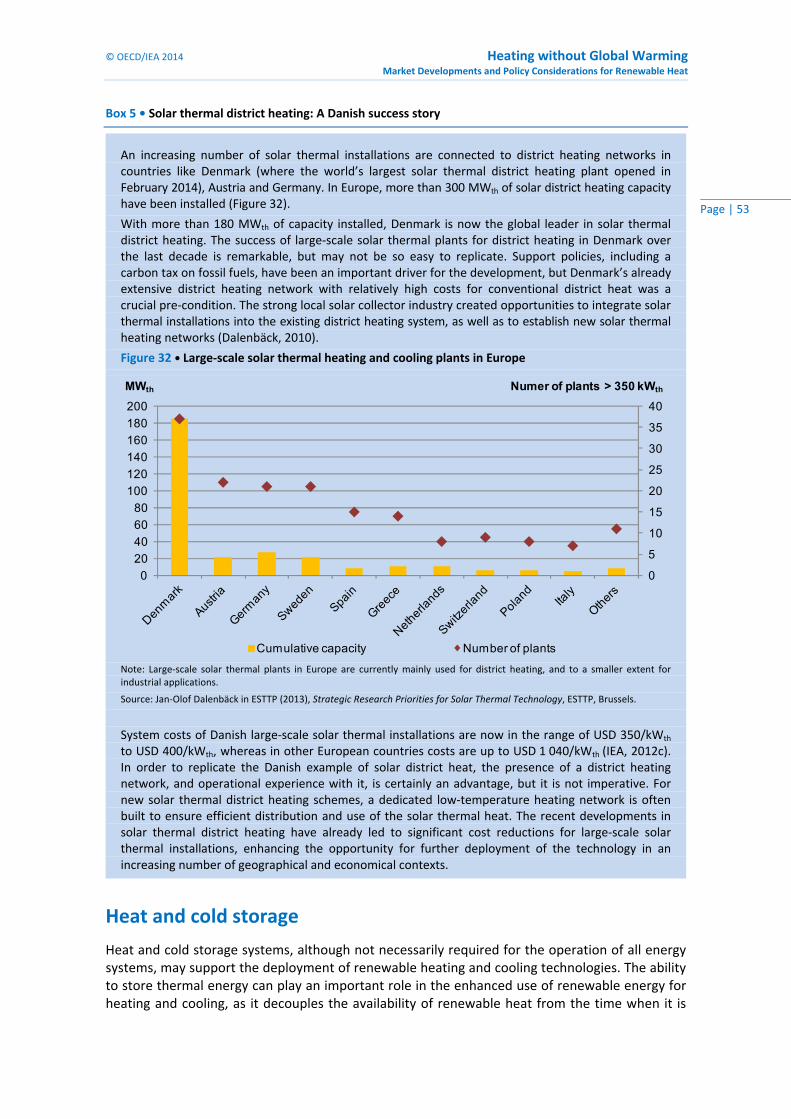
© OECD/IEA 2014 Heating without Global Warming Market Developments and Policy Considerations for Renewable Heat
Page | 53
Box 5 • Solar thermal district heating: A Danish success story
Heat and cold storage
Heat and cold storage systems, although not necessarily required for the operation of all energy systems, may support the deployment of renewable heating and cooling technologies. The ability to store thermal energy can play an important role in the enhanced use of renewable energy for heating and cooling, as it decouples the availability of renewable heat from the time when it is
An increasing number of solar thermal installations are connected to district heating networks in countries like Denmark (where the world’s largest solar thermal district heating plant opened in February 2014), Austria and Germany. In Europe, more than 300 MWth of solar district heating capacity have been installed (Figure 32).
With more than 180 MWth of capacity installed, Denmark is now the global leader in solar thermal district heating. The success of large‐scale solar thermal plants for district heating in Denmark over the last decade is remarkable, but may not be so easy to replicate. Support policies, including a carbon tax on fossil fuels, have been an important driver for the development, but Denmark’s already extensive district heating network with relatively high costs for conventional district heat was a crucial pre‐condition. The strong local solar collector industry created opportunities to integrate solar thermal installations into the existing district heating system, as well as to establish new solar thermal heating networks (Dalenbäck, 2010).
Figure 32 • Large‐scale solar thermal heating and cooling plants in Europe
0
5
10
15
20
25
30
35
40
0
20
40
60
80
100
120
140
160
180
200
Numer of plants > 350 kWthMWth
Cumulative capacity Number of plants Note: Large‐scale solar thermal plants in Europe are currently mainly used for district heating, and to a smaller extent for industrial applications.
Source: Jan‐Olof Dalenbäck in ESTTP (2013), Strategic Research Priorities for Solar Thermal Technology, ESTTP, Brussels.
System costs of Danish large‐scale solar thermal installations are now in the range of USD 350/kWth to USD 400/kWth, whereas in other European countries costs are up to USD 1 040/kWth (IEA, 2012c). In order to replicate the Danish example of solar district heat, the presence of a district heating network, and operational experience with it, is certainly an advantage, but it is not imperative. For new solar thermal district heating schemes, a dedicated low‐temperature heating network is often built to ensure efficient distribution and use of the solar thermal heat. The recent developments in solar thermal district heating have already led to significant cost reductions for large‐scale solar thermal installations, enhancing the opportunity for further deployment of the technology in an increasing number of geographical and economical contexts.
Heating without Global Warming © OECD/IEA 2014
Market Developments and Policy Considerations for Renewable Heat
Page | 54
needed, thus increasing the degree to which it can be utilised. This is particularly true for solar heating and cooling systems due to both the daily and seasonal solar variability. Heat storage systems exist for short‐term storage of a few days, and inter‐seasonal heat storage of several months.
Storing heat for one or two days is a common practice in domestic hot water or heating systems, with an acceptable cost for conventional hot water usage. However, seasonal heat storage can be important in climates with prolonged periods of low solar irradiation levels, in which heat storage would ideally bridge several months. More research and development into suitability of different storage media, particularly for seasonal storage, is needed (see IEA, 2014; EC/RHC Platform, 2012).
Four main types of the thermal energy storage technologies can be distinguished (IEA, 2012c): sensible storage, latent heat storage, sorption heat storage and thermochemical heat storage.
Sensible storage
Sensible storage systems make use of the heat capacity of a material whose temperature increases or decreases when heat or cold is stored. Water‐based storage systems, in the form of insulated storage tanks, are currently the most common systems on the market. They are commonly installed as part of domestic systems for hot water and space heating, and as storage for solar thermal district heating systems. Storing sensible heat at temperatures higher than 100°C requires pressurised liquid water or other materials such as concrete or molten salts.
Water‐based storage systems for cold are often seasonal systems. Water is chilled by cold ambient air during the winter and stored in aquifers, whence it is extracted during the cooling season. Another option to store cold is in the form of snow, if winter conditions allow for it, or in ice (either natural or artificially produced).
Latent heat storage
These systems utilise the phase‐change properties, either of melting or evaporation, of a material. If the temperature range is small, this type of storage can be more compact than heat or cold storage in water. Most latent heat storage technologies currently used are for low‐temperature heat storage in building structures to improve their thermal performance, or in cold storage systems. In addition, there are latent heat storage tanks which use paraffin or sodium as a storage material that allow for heat storage over several days.
Sorption heat storage
Sorption heat storage systems use a sorption material for the uptake of water vapour. The material can be either a solid (adsorption) or a liquid (absorption). These technologies are still largely in the development phase. In principle, sorption heat storage densities can be two to four times higher than those of sensible heat storage in water.
Thermochemical heat storage
These systems store energy by way of a chemical reaction. Some chemicals store heat 20 times more densely than water, but more common storage densities are four to ten times higher. Only a few thermochemical storage systems have been demonstrated so far, and the materials currently under investigation are salts that can exist in anhydrous and hydrated form.
© OECD/IEA 2014 Heating without Global Warming Market Developments and Policy Considerations for Renewable Heat
Page | 55
Renewable cooling technologies
Direct cooling systems
Direct cooling systems use a cold source such as water, ice or snow that is already in the required temperature range. Some external energy is needed to operate heat exchangers and for circulating the cooling medium, but much less is required than for conventional air conditioning or sorption cooling systems (Öko Institut, 2012).
The scale of direct cooling systems can vary from building to commercial‐scale, or to district‐scale cooling networks (see below). Snow and ice are suitable media in cold or mountainous climates, whereas the availability of cold water in the form of rivers, lakes, seas and deep aquifers is geographically less restricted. The temperature of deep aquifers or groundwater is largely unaffected by outside temperatures, making them suitable sources of renewable cold in the summer, when cooling demand is the highest. For snow, ice and surface water‐based systems, seasonality can be an issue, however, and seasonal storage of cold will be required during summer months (see above for an overview of different heat and cold storage technologies), or a combination with thermal‐ or electricity‐driven cooling systems is needed.
Indirect cooling systems
Indirect cooling systems require external electricity or water input, and include heat pumps as well as evaporative cooling. In a single‐stage evaporative cooling system, hot, dry air is ventilated into the evaporative cooler, where it is used to evaporate a water source. As the water evaporates, it cools down and increases the moisture content of the air, which is then ventilated into a building. In a two‐stage system, the cool airstream is used to cool down a separate airstream, thus avoiding problems with moisture inside the building. Both processes are more efficient than electric air conditioners (Öko Institut, 2012).
Sorption cooling systems
Thermally driven sorption cooling systems operate on a similar cycle as that of heat pumps, but use heat of at least 50°C to 70°C instead of electricity to drive the system, thus providing the option of using renewable heat (for instance from biogas or solar thermal) or waste heat from industry and co‐generation plants. Two different systems exist, the most common being a system with closed cycles. Two types of processes exist for closed‐cycle systems: adsorption‐ and absorption‐based.12 Based on closed‐cycle sorption, the basic physical process underpinning both technologies consists of at least two chemical components, one of them serving as the refrigerant and the other as the sorbent. Closed systems typically produce chilled water for use in air‐conditioning equipment. The efficiency of closed‐cycle systems can vary depending on the driving temperature. The majority of closed sorption chillers have been around for 70 years (today, large‐scale sorption chillers come from Asia; small‐ and medium‐scale from Europe).
Open cycle systems, also referred to as desiccant evaporative cooling systems, typically use water as the refrigerant, and a desiccant (i.e. a hygroscopic, moisture‐absorbing material) as the sorbent for direct treatment of air in a ventilation system (IEA, 2012c). Solid desiccant cooling systems are mature commercial technologies and have reached visible market penetration in some areas (e.g. supermarkets in the United States). In general, desiccant cooling systems are more efficient than electric air conditioning.
12 Adsorption is the bonding of a gas or other material on the surface of a solid; in the absorption process a new compound is formed from the absorbent and working fluids (IEA, 2011a).
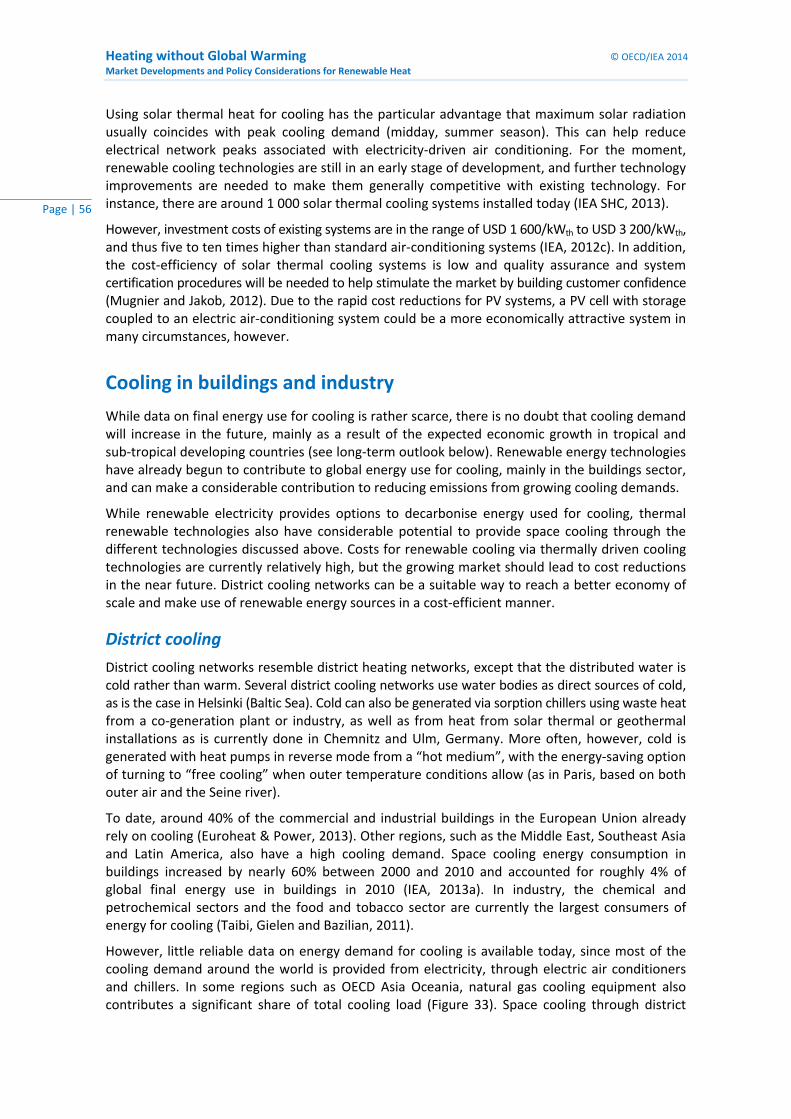
Heating without Global Warming © OECD/IEA 2014
Market Developments and Policy Considerations for Renewable Heat
Page | 56
Using solar thermal heat for cooling has the particular advantage that maximum solar radiation usually coincides with peak cooling demand (midday, summer season). This can help reduce electrical network peaks associated with electricity‐driven air conditioning. For the moment, renewable cooling technologies are still in an early stage of development, and further technology improvements are needed to make them generally competitive with existing technology. For instance, there are around 1 000 solar thermal cooling systems installed today (IEA SHC, 2013).
However, investment costs of existing systems are in the range of USD 1 600/kWth to USD 3 200/kWth, and thus five to ten times higher than standard air‐conditioning systems (IEA, 2012c). In addition, the cost‐efficiency of solar thermal cooling systems is low and quality assurance and system certification procedures will be needed to help stimulate the market by building customer confidence (Mugnier and Jakob, 2012). Due to the rapid cost reductions for PV systems, a PV cell with storage coupled to an electric air‐conditioning system could be a more economically attractive system in many circumstances, however.
Cooling in buildings and industry
While data on final energy use for cooling is rather scarce, there is no doubt that cooling demand will increase in the future, mainly as a result of the expected economic growth in tropical and sub‐tropical developing countries (see long‐term outlook below). Renewable energy technologies have already begun to contribute to global energy use for cooling, mainly in the buildings sector, and can make a considerable contribution to reducing emissions from growing cooling demands.
While renewable electricity provides options to decarbonise energy used for cooling, thermal renewable technologies also have considerable potential to provide space cooling through the different technologies discussed above. Costs for renewable cooling via thermally driven cooling technologies are currently relatively high, but the growing market should lead to cost reductions in the near future. District cooling networks can be a suitable way to reach a better economy of scale and make use of renewable energy sources in a cost‐efficient manner.
District cooling
District cooling networks resemble district heating networks, except that the distributed water is cold rather than warm. Several district cooling networks use water bodies as direct sources of cold, as is the case in Helsinki (Baltic Sea). Cold can also be generated via sorption chillers using waste heat from a co‐generation plant or industry, as well as from heat from solar thermal or geothermal installations as is currently done in Chemnitz and Ulm, Germany. More often, however, cold is generated with heat pumps in reverse mode from a “hot medium”, with the energy‐saving option of turning to “free cooling” when outer temperature conditions allow (as in Paris, based on both outer air and the Seine river).
To date, around 40% of the commercial and industrial buildings in the European Union already rely on cooling (Euroheat & Power, 2013). Other regions, such as the Middle East, Southeast Asia and Latin America, also have a high cooling demand. Space cooling energy consumption in buildings increased by nearly 60% between 2000 and 2010 and accounted for roughly 4% of global final energy use in buildings in 2010 (IEA, 2013a). In industry, the chemical and petrochemical sectors and the food and tobacco sector are currently the largest consumers of energy for cooling (Taibi, Gielen and Bazilian, 2011).
However, little reliable data on energy demand for cooling is available today, since most of the cooling demand around the world is provided from electricity, through electric air conditioners and chillers. In some regions such as OECD Asia Oceania, natural gas cooling equipment also contributes a significant share of total cooling load (Figure 33). Space cooling through district
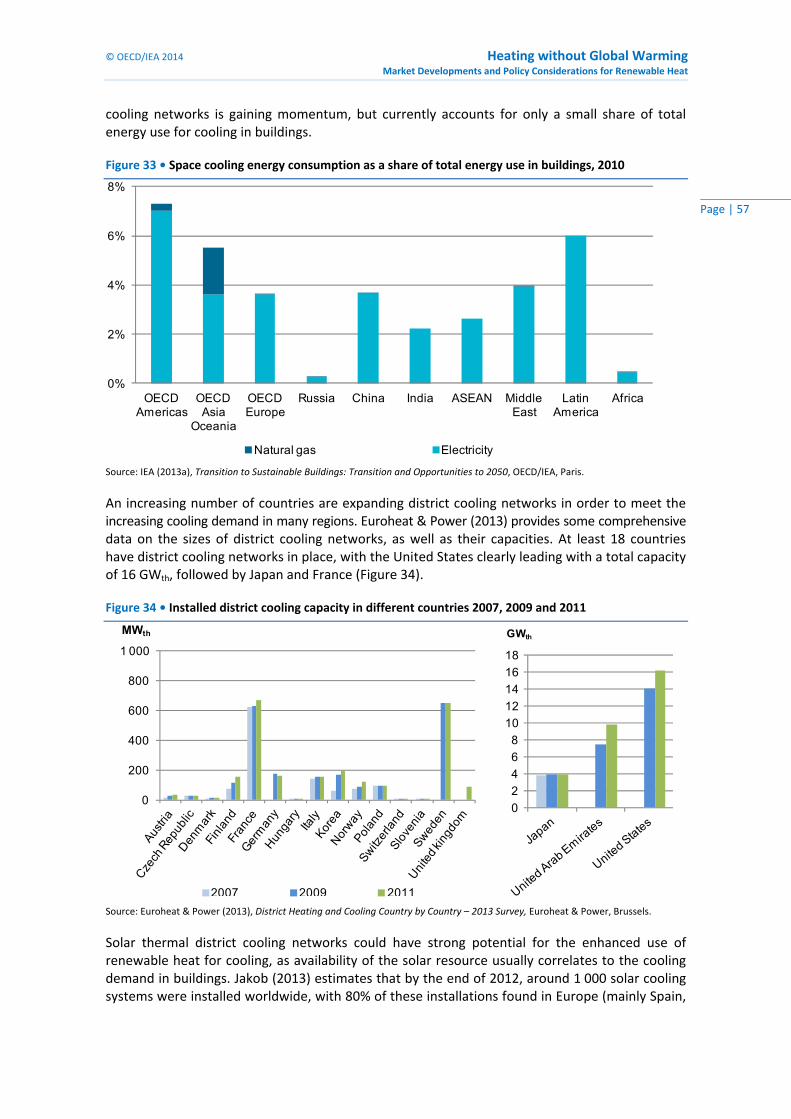
© OECD/IEA 2014 Heating without Global Warming Market Developments and Policy Considerations for Renewable Heat
Page | 57
cooling networks is gaining momentum, but currently accounts for only a small share of total energy use for cooling in buildings.
Figure 33 • Space cooling energy consumption as a share of total energy use in buildings, 2010
0%
2%
4%
6%
8%
OECD Americas
OECD Asia
Oceania
OECD Europe
Russia China India ASEAN Middle East
Latin America
Africa
Natural gas Electricity Source: IEA (2013a), Transition to Sustainable Buildings: Transition and Opportunities to 2050, OECD/IEA, Paris.
An increasing number of countries are expanding district cooling networks in order to meet the increasing cooling demand in many regions. Euroheat & Power (2013) provides some comprehensive data on the sizes of district cooling networks, as well as their capacities. At least 18 countries have district cooling networks in place, with the United States clearly leading with a total capacity of 16 GWth, followed by Japan and France (Figure 34).
Figure 34 • Installed district cooling capacity in different countries 2007, 2009 and 2011
0
200
400
600
800
1 000
MWth
2007 2009 2011
0
2
4
6
8
10
12
14
16
18
GWth
Source: Euroheat & Power (2013), District Heating and Cooling Country by Country – 2013 Survey, Euroheat & Power, Brussels.
Solar thermal district cooling networks could have strong potential for the enhanced use of renewable heat for cooling, as availability of the solar resource usually correlates to the cooling demand in buildings. Jakob (2013) estimates that by the end of 2012, around 1 000 solar cooling systems were installed worldwide, with 80% of these installations found in Europe (mainly Spain,
Heating without Global Warming © OECD/IEA 2014
Market Developments and Policy Considerations for Renewable Heat
Page | 58
Germany and Italy). While solar cooling remains a niche market, the market has grown by 40% to 70% in recent years.
In order to achieve a higher penetration of renewable energy use for cooling in buildings and industry, further technology development is needed to reduce costs. These cost reductions are crucial for the uptake of renewable heat‐driven cooling systems. Some key RD&D needs for renewable cooling have been identified by ESTTP (2013), EC/RHC‐Platform (2013) and others:
optimisation of sorption materials and efficiency improvements
standardisation of equipment to develop plug‐in‐ready, small‐scale renewable cooling systems
integration of thermal cooling systems in smart cooling networks
further improvement and cost reductions of cold storage.
Integration of heating and cooling in smart energy systems
While the heat and electricity markets have in the past mainly been linked through co‐generation plants feeding their waste heat to the district heating network, new opportunities for better integration of the two sectors are developing that could have an interesting impact on the development of renewable energy in both sectors.
A new way to integrate heat and electricity generation has been developed in Denmark, where 62% of all households are connected to the district heating network (Nordic Folkecenter, 2010) and wind power accounted for 27% of total electricity consumption in 2012 (EWEA, 2013). Thanks to regulatory changes that allowed co‐generation plants to sell electricity in the power market, positive synergies between heat production and electricity generation have been created. At times of high electricity prices resulting from low wind power generation, co‐generation plants feed electricity into the grid and store the heat in large accumulators or in the heating network itself. In the case that wind power generation exceeds demand, the electricity is used to provide hot water to the district heating network via immersion heaters. At the same time, co‐generation units are ramped down, and the district heating network is supplied with stored heat (IEA, 2012a).
Another innovative scheme for integrating renewable heat was launched by E.ON Hanse in the German city of Hamburg in 2011, with the support of the German federal government. Private households or companies can feed excess heat generated in solar thermal installations or in co‐generation plants into the district heating network, and store it in the 4 000 m3 storage installed as part of the local heating network. The heat producer can then withdraw the stored heat at a time when its demand exceeds its own generation, within a period of eight months, and pays a service fee of EUR 0.005 per kilowatt hour thermal for using the district heating network as storage (E.ON Hanse, 2011).
An example of integration of direct cooling with heat use for cooling exists in the district cooling network of Helsinki. During November to May, when the water temperature is below 8°C, water from the Baltic Sea is pumped to a heat exchanger, where the cold is extracted for the city’s district cooling network. During the summer period, when the sea water is too warm, excess heat from co‐generation plants is used to run thermally driven chillers and provide the required cold to the cooling network (Helsingin Energia, 2013).
The above‐mentioned examples show the first signs of a transition towards a more integrated energy system that provides energy services, such as heating, cooling and electricity supply, in an increasingly efficient manner. The long‐term role of such integrated systems is discussed later.
© OECD/IEA 2014 Heating without Global Warming Market Developments and Policy Considerations for Renewable Heat
Page | 59
Policies for renewable heat
This chapter analyses why governments should encourage the deployment of renewable heat technologies and the challenges they face. It also reviews the extent to which countries have put supportive renewable heat policies in place and provides examples of such policies in practice.
What’s different about heat?
As the previous chapters have illustrated, there is a range of well‐developed technologies available for generating heat from renewable sources. These technologies can be economically competitive with fossil fuel‐derived sources of heat in favourable circumstances – where the resource levels are good, where low‐cost sustainable biomass resources are available, and where market conditions are appropriate.
Globally, however, renewable heating is growing much more slowly than renewable electricity and has received much less attention from policy makers than the renewable electricity sector. More than 120 countries (REN21, 2013) in all world regions have introduced policies designed to promote renewable electricity, whereas only around 40 have specific policies for renewable heat, most of which are within the European Union (Figure 35). Their heat policy measures have been introduced to deliver the binding national targets for renewable energy enshrined within the EU Renewable Energy Directive. These targets are based on the proportion of renewable energy within total FEC, and include heat as well as electricity and transport fuels. A few other countries have technology‐specific policies aimed, in particular, at solar heating. But why is there this lack of attention from policy makers when heat represents a major proportion of energy use in most countries?
The heating sector offers particular challenges for policy makers. Heat is much less amenable to regulation than electricity, as most electricity is distributed via regulated grids and the whole production, transmission and distribution process is centralised and often has a public ownership history. Heat, on the other hand, is much less regulated since it is produced in millions of separate installations of widely varying sizes, at different temperatures, from several different and competing fuels, and across the full range of end‐use sectors: industry, commerce, the public sector and private households. Reliable data on heat production, its utilisation patterns and the costs of production are much more difficult to obtain than those for electricity. Heat metering is less practiced and more costly than for electricity. This makes the development of renewable energy heat policies, as well as the assessment of their effectiveness, much more difficult.
Renewable heat can in many circumstances provide a cost‐effective contribution to energy security, sustainability of the energy supply, economic development and energy access. It should therefore be systematically included in national energy strategies designed to tackle these issues.
Governments can play a key role in establishing the conditions in which the renewable heating sector can grow, but since both opportunities and challenges are locally specific, strategies must be based on local circumstances.
Policy portfolios should aim to encourage increasingly competitive sources of renewable heat, help minimise risks to investors and remove unnecessary institutional barriers. Well‐designed policy frameworks will be more cost‐effective than financial incentives alone.
A sector‐specific approach – distinguishing among industrial, commercial, public, and household investors – is likely to be more successful than a “one‐size‐fits‐all” policy.
Measures to enhance the use of renewable energy in the buildings sector are best introduced as part of an overall portfolio to improve building energy use, and should be integrated into building codes.

Heating without Global Warming © OECD/IEA 2014
Market Developments and Policy Considerations for Renewable Heat
Page | 60
A further complication for policy makers is the interaction between policies in the buildings sector designed to promote and encourage renewable heat production, and energy efficiency programmes aimed at reducing overall energy use and its carbon footprint.
Why should renewable heat be encouraged?
There are three classic policy drivers that are often cited as the rationale for renewable energy (and other sustainable energy) policy‐making (IEA, 2011d):
energy security and reduced fossil fuel input
environmental benefits
economic benefits.
In addition, renewable heating systems can improve energy access, a topic of considerable importance in many developing countries.
Energy security, and reduced fuel use and costs
As discussed above, around 40% of natural gas and 20% of oil and coal primary energy supply are used for heating globally. Where these fuels are imported, they have a significant and negative impact on the balance of payments. In addition, prices are susceptible to change in response to market developments and can rise rapidly, as has been the case with crude oil in the last decade. Substituting fossil fuels with renewable energy can reduce import dependency and vulnerability to fossil fuel price changes.
Reducing emissions
FEH in industry and buildings accounts for more than 10 gigatonnes, or one‐third, of global CO2 emissions, and is also responsible for the release of other pollutants to the atmosphere. Reducing these emissions can often be most cost‐effectively done through energy efficiency in the industry and building sectors, and by using low‐carbon electricity to meet heat demand where possible and economically sensible. The use of renewable heat will nonetheless play an important role in decarbonising the energy used for heat in buildings, where renewable heat sources can be an important means to reduce emissions at relatively low abatement costs. In the United Kingdom’s low‐carbon strategy, for example, heat pumps are an important technology to satisfy low‐temperature heat demand (DECC, 2011). In addition, renewable energy sources are critical to replace carbon‐intensive fuels such as coal and coke in high‐temperature processes in industry. When considering the “supply curve” for carbon‐saving measures, renewable heating options should be included and can be part of a low‐cost portfolio of carbon reducing measures.
Reducing local emissions is also an important objective. Using renewable sources for heating – for example, solar thermal energy or modern biomass – can reduce local emissions from coal use or the pollution and inefficiency of traditional biomass usage. Improving air quality is one of the major drivers in China to harness agricultural residues for fuel use (Box 6).
Economic benefits
The use of domestic renewable energy sources for heat can provide important economic benefits by reducing the need for imported fuels or providing more opportunities for energy exports. The manufacturing of renewable energy heating systems also provides opportunities for local job creation. Most heating systems, such as biomass boilers, solar thermal systems, or heat pumps are often small‐scale in nature and more amenable to local manufacture, thus creating a domestic
© OECD/IEA 2014 Heating without Global Warming Market Developments and Policy Considerations for Renewable Heat
Page | 61
value chain that might also be supported through exports. Heating system supply chains are, indeed, becoming more internationalised, as is in the example of low‐cost solar water heaters being exported from China.
Renewable energy heating can also play a role in rural economic development. This is particularly the case for biomass technologies, which can provide added income for rural communities as fuel suppliers, as well as providing energy access to the agricultural sector and rural industry. For example, China’s policy of encouraging the production of fuel pellets from agricultural residues was initiated as a way of boosting rural economic activity (Box 6).
Box 6 • Biomass pellets in China
Energy access
In addition, using renewable energy for heat can improve reliable access to clean, modern energy supplies, and at the same time reduce electricity blackouts. In South Africa, for example, a programme was established in 2009 to promote the use of solar water heating to reduce peak electricity demand for this purpose, and thereby avoid power outages. The aim of the programme
In 2008 the Chinese Ministry of Finance launched a subsidy initiative to encourage the use of pellets produced from agricultural residues to provide heat for rural industry and district heating, replacing coal. Some pellets are also used for cooking in improved cookstoves.
There were two main motives behind this initiative. The first was to provide a new and stable source of income in rural areas. Farmers provide the raw materials and labour for the process, and invest in the construction of pelletising plants.
The second aim was to improve air quality by reducing the inefficient and polluting use of coal in small‐scale furnaces. Environmental policies aiming at the reduction of coal use for heat (and power) introduced by some local governments have stimulated local demand for pellets and led to rising pellet prices.
Since the introduction of these incentive policies encouraging straw use were implemented in 2008, the market for pellets all over the country has been expanding rapidly, with output growing from around 250 000 tonnes in 2008 to nearly 6 million tonnes (Mt) in 2012 – equivalent to 3 Mt of standard coal. At present, there are more than 250 pellet plants in China, with an annual turnover of nearly USD 160 million. Currently, pellets are used for three main purposes:
To provide fuel for small‐sized biomass boilers. Small‐sized biomass boilers are mainly steam boilers and hot water boilers, with a capacity of under 4 t per hour in general. Today, the demand for biomass boiler material has reached 2 million t/yr to 3 million t/yr, accounting for more than 70% of total pellet sales.
As the production material of biomass charcoal. 3 t of pellets can generate 1 t of machine‐made charcoal, on average. This is mainly used for cooking in the catering industry, where the demand is around 1 Mt per year. In addition, 100 000 t of this charcoal is exported to Japan and Korea each year.
To meet the demands for fuel in improved stoves. Some local governments, such as Beijing for instance, promote the use of pellets in rural areas, providing subsidies or free improved stoves. Programmes of this sort have created a demand of between 150 000 t/yr and 200 000 t/yr.
The growing demand has driven very significant improvements in the design and operation of Chinese‐made pelletising systems. In recent years, the manufacturing standards for pellet briquetting machines have greatly improved, with the equipment becoming more reliable and efficient. The leading equipment companies are now capable of optimising the production process for different raw materials, thereby increasing productivity. The number of pellet system manufacturers with large‐scale production capacity has been growing gradually, and their products are increasingly exported, for instance to Africa.
Source: based on information provided by China National Renewable Energy Centre.
Heating without Global Warming © OECD/IEA 2014
Market Developments and Policy Considerations for Renewable Heat
Page | 62
is to install 1 million water heaters within five years, and around 400 000 systems have so far been installed. Modern renewable heating systems can also help meet the UN Sustainable Energy for All energy access goals, with solar water heaters and modern biomass stoves replacing inefficient and polluting biomass or coal‐fired cookstoves and chimneys.
Policy development
Ideally, renewable heat technologies would provide competitive sources of heat and the market would develop without government intervention. In practice, this seldom happens straightaway or at a large scale. Potential investors face a number of barriers and risks which prevent or discourage them from entering the market. The role of governments is to provide a supportive policy and regulatory environment that reduces barriers to deployment and allows investment to take place – into equipment and production facilities needed to supply the market, into research and innovation, into services needed to support the sector (installers, service companies, etc.) and in the deployment of heating projects themselves.
Successful policy development depends on the ability to assess which technologies have a significant potential to provide energy security, as well as economic or environmental benefits in specific markets and at a reasonable cost. These will depend on particular circumstances: the technology and the degree of market maturity, and particular local market conditions, since these affect the economics and practicability of producing heat. For example, competitiveness will be affected by the availability of the resource, the competing prices of alternative heating fuels, the climate (i.e. heating demand) and the regulatory framework. The opportunities for deployment will also vary in the different end‐use sectors – industry, residential and commercial buildings.
Governments therefore need to be well‐informed “customers” to devise policies appropriate to their needs. Policy initiatives should be founded upon a detailed assessment of the opportunities which can be provided by renewable heat within the overall national energy and environmental strategy. They should focus on the technologies and markets which can contribute economically to meeting national energy and environmental goals, rather than promoting the full spectrum of technologies at any cost when, for example, resource conditions are unfavourable.
As with opportunities, the particular barriers to deployment are highly market and technology dependent, and policy makers need to identify and tackle the specific hurdles. This is likely to be much more cost‐effective than offering high financial incentives (IEA, 2012e).
For example, streamlining administrative procedures is a low‐cost measure which can effectively unlock deployment. The diversity of end users and their specific demand means that no one‐size‐fits‐all policy is likely to be effective across markets, neither internationally nor even within one country.
The challenges associated with deploying renewable energy technologies are conveniently classified under a number of headings related to technology, market, economic and regulatory issues. Another way of assessing the challenges is to consider the three categories:
economic competitiveness
investor risks
institutional and other barriers.
Having a clear policy framework in place allows industry and other potential end users of renewable heating technologies to invest in projects with a clear view of the likely profitability and risk. The resultant growth of the sector will stimulate a competitive equipment and services market and investment in business development and industry capabilities, as well as in innovation.
© OECD/IEA 2014 Heating without Global Warming Market Developments and Policy Considerations for Renewable Heat
Page | 63
This will in turn lead to cost reductions and allow financial support levels to be reduced, as has been seen in the case of solar thermal collectors (Figure 23).
The following sections discuss these challenges and provide examples of measures which have been employed to overcome them.
Economic competitiveness
The principal barrier to investment is often the cost‐competitiveness of the relevant technology, at least when it is first introduced into a particular market. Immature or novel technologies will generally start off with high costs which decline as experience grows, as innovation improves efficiency and lowers costs, and as system production is scaled up.
Even for technologies which are mature in some markets, costs are likely to be initially higher when they are introduced into new countries, since supply chains for locally produced components or services for installation and maintenance need to be developed. Once a significant and competitive market starts to develop, these costs should come down and converge with international benchmarks, although some market‐specific cost differences (such as land or legal costs) are likely to prevail.
Policies that reduce the cost of fossil fuels, for instance through subsidies, are an important barrier that hinders the cost‐competitiveness of renewable energy use for heat in numerous countries. Financial support measures for fossil fuels are still very common, particularly in developing countries. Globally, subsidies for fossil fuels were in place in 40 countries worldwide, and reached an estimated USD 544 billion in 2012. Iran, Saudi Arabia, and Russia, followed by India, were the countries with the highest amount of such subsidies spent (IEA, 2013g). Redirecting at least part of these fossil fuel subsidies towards the promotion of renewable heat should, in many cases, prove to be an economically sensible way of financing energy access for the poorest part of the population, and at the same time reduce emissions and import dependency.
Government intervention to improve the competitiveness of renewable heating systems can be justified when it compensates for issues which are not recognised in the usual pricing structure. These may include the environmental impacts associated with fossil fuel use for heat, which are not fully priced in. Government support can also be justified in cases where learning and cost reductions need to be “bought” to bring technologies to the point where they can make a cost‐competitive contribution to a secure and sustainable energy supply. However, governments should avoid long‐term support for expensive technologies with little prospect of competitiveness, and support can be contingent on progress towards cost‐reduction targets being made within a certain time, with incentives periodically reviewed and adjusted.
Governments can also help level the playing field in which the renewable heating technologies compete – for example, by ensuring that the competitive position is not adversely affected by subsidies for fossil fuels, that carbon and other emissions are adequately reflected in pricing structures and that the tax regime is fair.
Practical measures are being taken in different markets to directly provide support for renewable heat:
CO2 taxes or carbon trading schemes: these can provide strong signals to encourage low‐carbon technologies. CO2 taxes have been adopted in many northern European countries, and have led to a considerable increase in renewable energy use for heat in buildings and industry in countries like Denmark or Sweden.
Carbon trading systems are usually directed at large energy producers and consumers, and often do not encompass small‐scale end users. Mechanisms to ensure a sufficiently high CO2 price are needed for these schemes to be effective in the deployment of low‐carbon technologies.
Heating without Global Warming © OECD/IEA 2014
Market Developments and Policy Considerations for Renewable Heat
Page | 64
Capital grants and rebates: this is a straightforward measure to reduce investment costs, usually best offered directly to the end user, and has been the most widely adopted way of providing incentives for investment (e.g. in Austria, Germany and China). Quality standards should be a prerequisite for capital grants, to help offset concerns about equipment quality and reliability and to ensure the support does actually result in renewable heat generation.
Operating grants or feed‐in tariffs: this system supports actual renewable energy heat generation, but may require that heat output is measured, which is not normally the case in small‐scale installations. The United Kingdom has introduced a version of the feed‐in tariff system for renewable heat production, the Renewable Heat Incentive, which provides such revenue support.
Tax reductions/exemptions: these may be available to end users (both in industry and buildings) to reduce investment costs, as is the case in the United States, where tax credits for renewable heating equipment were first introduced under the Energy Policy Act of 2005. They can also include exemptions from carbon taxes where applicable.
Soft loans and loan guarantees: this can be a low‐cost measure (for the state budget) to reduce the cost of capital, and thus the investment risk, and encourage deployment of renewable heat in both buildings and industry. In India, for instance, many banks offer soft loans for solar water heaters.
The most appropriate measures will depend on the technologies involved and their maturity, and on the sector. The relative merits and disadvantage of the various systems have been described (IEA RETD, 2010), but it is difficult to produce any meaningful quantitative comparative analysis of the various measures at this point because of the wide variations in capital costs of systems in different markets and lack of comparable data.
Governments can also play a key role in stimulating the RD&D necessary to bring forward and demonstrate innovative technologies which can open up new sectors (e.g. renewable energy use for cooling) or help reduce costs.
Investor risks
Renewable heating technologies often involve higher upfront capital investment than fossil fuel plants, but typically have lower operation costs, including fuel costs. For example, the capital cost of a domestic solar water heater is between five and ten times that of a gas boiler of similar scale. Given this capital intensity of renewable heating systems, project economics depend critically on the cost of capital and therefore on the perceived risk to investors.
The range of renewable heating technologies can involve a very diverse set of investors and users, including large‐scale industrial heat users, smaller‐scale industrial and commercial building owners, public sector investors (for example, in district heating plants) and private house owners. Each of these stakeholders has different investment priorities and perceptions of risk. Industrial investors are likely to require a high rate of return on investments which must compete for funds with projects more aligned with core business (such as manufacturing capacity expansion or upgrades), whereas public sector investors may be able to take a longer‐term view. Energy service companies (ESCOs) may have an important role to play in large‐scale renewable heat solutions for industry and commercial buildings, since investing in and operating energy supply systems is their core business.
It is also important to consider the position of equipment manufacturers and project developers. While users will want to be assured that they will get a good return on their individual projects, the project developers and the manufacturing sector will want to see a longer‐term flow of deals or business before investing in market development or in manufacturing capacity.
© OECD/IEA 2014 Heating without Global Warming Market Developments and Policy Considerations for Renewable Heat
Page | 65
The risks involved can be classified under a number of headings:
Policy risk: where projects depend on government support or policy incentives.
Technology risk: the efficiency and reliability of projects. The risk profile will be different for different technologies; for example, for geothermal projects the major risk is associated with the drilling phase (since there may be a failure to find heat at a good temperature).
Supplier and installer risk: investors will want to be confident that suppliers can deliver reliable systems and maintain them properly.
Regulatory risk: there may be uncertainties and costs imposed by complex approval procedures, which introduce uncertainty at the project development stage, or in complex and changing rules about support schemes, planning regimes or other environmental regulations.
Fuel price risk: the cost case depends on trends in conventional fuel prices, which are inevitably uncertain.
Market risk: heat demand can be sensitive. The energy demand of buildings can change in response to other energy efficiency measures. Industrial heat loads or temperature requirements may change, or businesses may relocate or close down. Heat is much more difficult to transport or distribute than electricity, where excess production can access and be sold via the grid.
In markets reliant on policy support, policy risk can be seen not only as significant, but as the most difficult element to manage for industry. This is true for project developers, and even more so for equipment and service providers. Providing policy stability and certainty is therefore an essential role for government. Stability can best be achieved through clearly articulated medium‐ and long‐term visions for the development of renewable heat as part of the overall national energy plan, with clear targets and with pre‐planned milestones and reviews. This gives investors confidence in the government’s intentions. Engaging relevant stakeholders in the development of this plan is critical.
Governments should also take responsibility for reducing the risks associated with regulatory affairs, such as planning and permitting, by having clear and transparent procedures and by streamlining processes as far as possible. This can be done, for example, by creating one‐stop shops for planning applications.
While many project risks must be accepted by investors and users, governments can help to minimise some technology‐specific risks. Providing support for projects at the demonstration stage can be an effective way of helping projects into the market, but these supports should be accompanied by monitoring and information dissemination programmes which ensure that lessons learnt are passed on and that successful projects are promoted to other potential users.
Governments can also assist in other ways:
by initiating system and installer quality assurance schemes
by establishing training and capacity building for installers and service personnel
by helping establish sustainable biomass supply chains
by establishing insurance schemes to offset drilling risks for geothermal project (as, for example, in France and Indonesia [ADEME, 2012])
by supporting energy performance and supply guarantees to facilitate financing for ESCOs, as in Austria and Brazil (Solarthermalworld.org, 2013b).
Once the industry takes off, these measures can be transferred to industry funding and management.
Institutional barriers and other issues
Institutional barriers, such as lengthy and complex administrative procedures, can prevent the deployment of renewable heat by reducing the likelihood of investments in new technologies.
Heating without Global Warming © OECD/IEA 2014
Market Developments and Policy Considerations for Renewable Heat
Page | 66
Other barriers to the deployment of renewable heat include the ownership structure in the buildings sector, which results in a “split incentives” situation. The building owner may need to be the investor in incremental technologies to improve energy performance, but may not benefit from operational savings in costs or comfort, which accrue instead to the building’s tenants (IEA, 2013a).
Issues specific to bioenergy are the availability and likely future cost of biomass, as well as its sustainability. These concerns can be exacerbated by uncertainties relating to sustainability standards.
Other important issues relate to the skills necessary to install and maintain systems. For example, heating engineers may not be familiar with solar or biomass heating systems. This lack of trained personnel can prevent the rapid uptake of renewable heat technologies, or might lead to inefficient system operation. In many established markets for renewable heat, training courses and certification schemes have been established by technology providers to ensure customer confidence and sustained market growth.
One critical aspect particular to new markets is the lack of reliable information on, and familiarity with, new technologies as they are introduced. For example, potential users and consumers may not be aware of the opportunities, such as fuel costs savings, provided by these technologies. Financing institutions may also be unaware or unfamiliar, and thus unwilling to provide the necessary financing. Awareness‐raising campaigns pursued by governments in co‐operation with industry are a relatively low‐cost and vital instrument to facilitate the deployment of renewable heat technologies in the early market phase.
Governments can also play a role in tackling the institutional and other barriers which can inhibit the deployment of these technologies.
One major concern is the ”split incentives” issue in the building sector, whereby building owners may need to be the investors in the new technology, but may not receive the benefits which accrue to their tenants. This is an issue which also affects the range of measures designed to improve the energy efficiency of buildings. One way to address this problem is through regulations which stipulate overall levels of energy use. In some cases, specific regulations may mandate the use of renewable energy to supply a share of the building’s heat, or require that renewable heat of a specific source (often solar energy) be used. Such measures can be a powerful stimulus to get the technology adopted, but are effective only when the requirement is specific, and where adequate enforcement and monitoring systems are in place to ensure that the requirements are fulfilled. However, such regulations can usually be introduced only for technologies which are technically mature and for which the additional costs of implementation are low.
It is also clearly better if measures to introduce renewable energy into the buildings sector are introduced as part of an overall portfolio designed to improve building energy use (IEA, 2013a). If the relevant measures are not considered in a co‐ordinated way, the result may be counter‐productive. For example, a building owner may install an oversized renewable heat source to reduce the building’s emissions, when in fact it would be more economical to first reduce overall energy consumption through energy efficiency measures, and then use a smaller renewable heat system to supply the decreased residual heat demand. For this reason, the French building energy code includes requirements on energy sufficiency and supply from renewable energy sources in addition to energy efficiency requirements (IEA/UNDP, 2013). The UK Renewable Heat Incentive requires a “Green Deal Assessment” of a house prior to applying for the incentive, to ensure minimum energy efficiency requirements are met (DECC, 2013).
Governments can improve dissemination of information about the technologies via public information campaigns, in which enhanced and authoritative information on resource availability, the economics, and other benefits and potentials of different renewable energy technologies are provided.
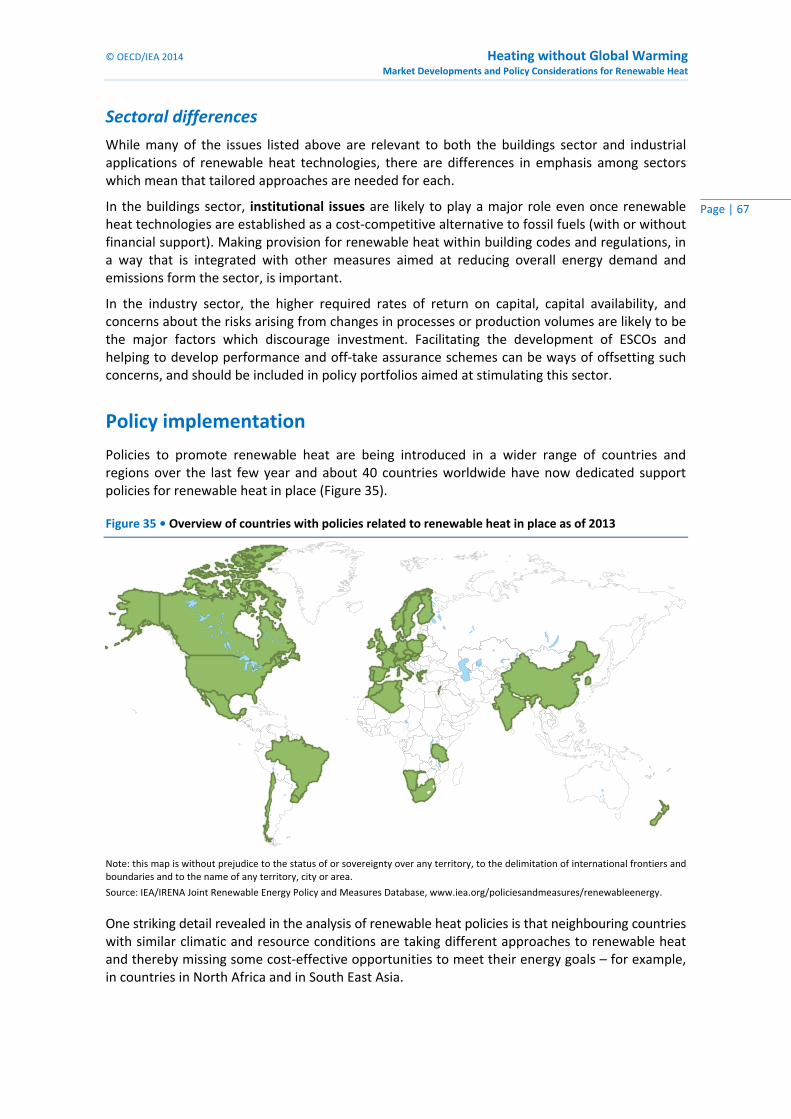
© OECD/IEA 2014 Heating without Global Warming Market Developments and Policy Considerations for Renewable Heat
Page | 67
Sectoral differences
While many of the issues listed above are relevant to both the buildings sector and industrial applications of renewable heat technologies, there are differences in emphasis among sectors which mean that tailored approaches are needed for each.
In the buildings sector, institutional issues are likely to play a major role even once renewable heat technologies are established as a cost‐competitive alternative to fossil fuels (with or without financial support). Making provision for renewable heat within building codes and regulations, in a way that is integrated with other measures aimed at reducing overall energy demand and emissions form the sector, is important.
In the industry sector, the higher required rates of return on capital, capital availability, and concerns about the risks arising from changes in processes or production volumes are likely to be the major factors which discourage investment. Facilitating the development of ESCOs and helping to develop performance and off‐take assurance schemes can be ways of offsetting such concerns, and should be included in policy portfolios aimed at stimulating this sector.
Policy implementation
Policies to promote renewable heat are being introduced in a wider range of countries and regions over the last few year and about 40 countries worldwide have now dedicated support policies for renewable heat in place (Figure 35).
Figure 35 • Overview of countries with policies related to renewable heat in place as of 2013
Note: this map is without prejudice to the status of or sovereignty over any territory, to the delimitation of international frontiers and boundaries and to the name of any territory, city or area.
Source: IEA/IRENA Joint Renewable Energy Policy and Measures Database, www.iea.org/policiesandmeasures/renewableenergy.
One striking detail revealed in the analysis of renewable heat policies is that neighbouring countries with similar climatic and resource conditions are taking different approaches to renewable heat and thereby missing some cost‐effective opportunities to meet their energy goals – for example, in countries in North Africa and in South East Asia.
Heating without Global Warming © OECD/IEA 2014
Market Developments and Policy Considerations for Renewable Heat
Page | 68
Policy best practice
A number of studies have looked at current policy experience and distilled some lessons from existing practice (e.g. IEA RETD, 2011). However, there is a lack of detailed and quantitative policy analysis allowing definitive guidance on policy best practice. It is possible to distil some general principles from existing experience, taking lessons where appropriate from work on analysis of renewables policies more generally:
Given their technical maturity and potential to provide sustainable energy cost‐competitively, renewable heat should be carefully considered in planning energy strategies, particularly in view of their potential contribution to energy security, the environment, economic development and energy access.
The strategy for development should be based on a systematic analysis of the specific opportunities and technologies most likely to be able to contribute significantly and cost‐competitively. The plan, developed with stakeholder engagement, should also examine the specific barriers inhibiting the uptake of the technologies, and this should be used to design effective policy frameworks.
The policy portfolio should recognise the different investment criteria likely to be applied in the different end‐use sectors, and the different ways in which they perceive risks and barriers to investment. A sector‐specific approach – distinguishing among industry, the commercial and public buildings sector, and household investors, is likely to be more successful than a “one‐size‐fits‐all” policy.
In order to provide a clear framework, the strategy and associated policy measures should be transparent and provide clear priorities and targets along with milestones and projected review dates.
Where incentives are deemed necessary, these should have the aim of encouraging progressive cost reduction, and so be reviewed regularly.
Governments can play an important role in mitigating other risks to investors by simplifying and clarifying regulatory frameworks. They can also play a catalytic role in addressing other risks and non‐economic barriers – such as developing quality assurance and skills‐training schemes and developing information programmes.
For the buildings sector, measures designed to encourage renewable heating and cooling should be integrated and carefully co‐ordinated with initiatives aimed at improving energy efficiency and reducing carbon emissions from the buildings sector through building codes and standards. Institutional issues pose the largest barrier to the deployment of renewable heat technologies once they are cost‐competitive.
In industry, concerns about profitability and the availability of investment funds are likely to be the major concern. Here the promotion of ESCOs and support for performance guarantees can play important roles in stimulating the market.
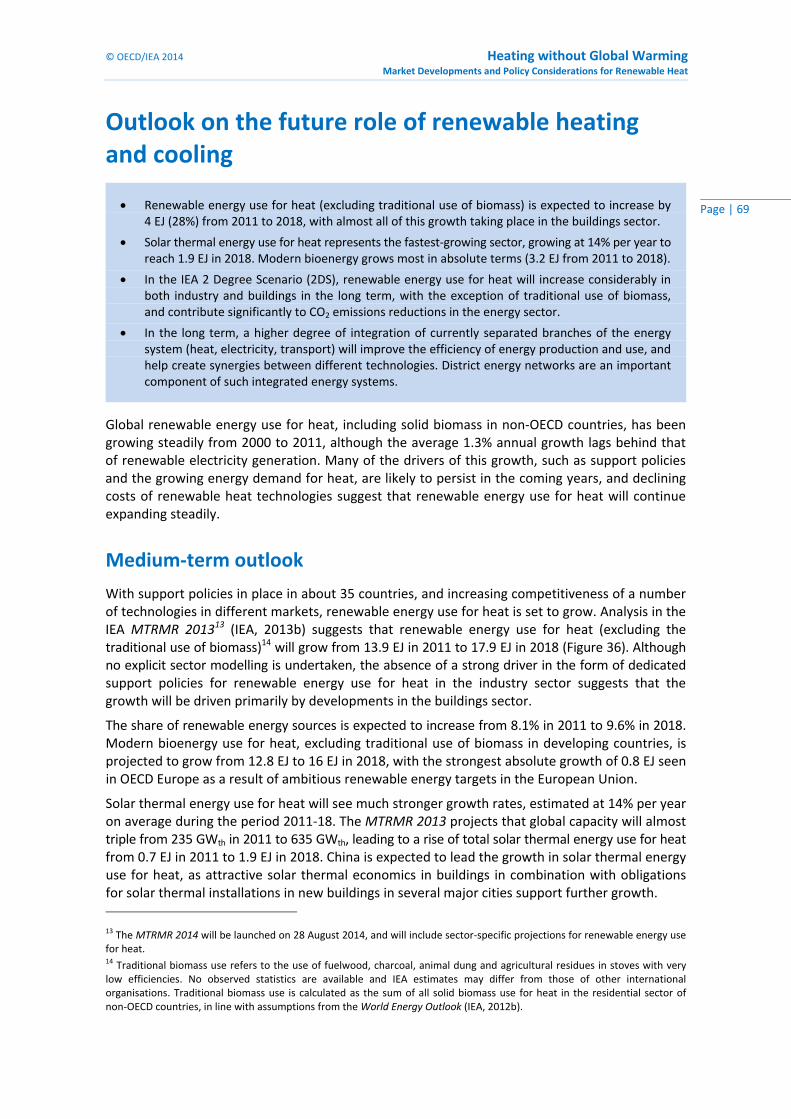
© OECD/IEA 2014 Heating without Global Warming Market Developments and Policy Considerations for Renewable Heat
Page | 69
Outlook on the future role of renewable heating and cooling
Global renewable energy use for heat, including solid biomass in non‐OECD countries, has been growing steadily from 2000 to 2011, although the average 1.3% annual growth lags behind that of renewable electricity generation. Many of the drivers of this growth, such as support policies and the growing energy demand for heat, are likely to persist in the coming years, and declining costs of renewable heat technologies suggest that renewable energy use for heat will continue expanding steadily.
Medium‐term outlook
With support policies in place in about 35 countries, and increasing competitiveness of a number of technologies in different markets, renewable energy use for heat is set to grow. Analysis in the IEA MTRMR 201313 (IEA, 2013b) suggests that renewable energy use for heat (excluding the traditional use of biomass)14 will grow from 13.9 EJ in 2011 to 17.9 EJ in 2018 (Figure 36). Although no explicit sector modelling is undertaken, the absence of a strong driver in the form of dedicated support policies for renewable energy use for heat in the industry sector suggests that the growth will be driven primarily by developments in the buildings sector.
The share of renewable energy sources is expected to increase from 8.1% in 2011 to 9.6% in 2018. Modern bioenergy use for heat, excluding traditional use of biomass in developing countries, is projected to grow from 12.8 EJ to 16 EJ in 2018, with the strongest absolute growth of 0.8 EJ seen in OECD Europe as a result of ambitious renewable energy targets in the European Union.
Solar thermal energy use for heat will see much stronger growth rates, estimated at 14% per year on average during the period 2011‐18. The MTRMR 2013 projects that global capacity will almost triple from 235 GWth in 2011 to 635 GWth, leading to a rise of total solar thermal energy use for heat from 0.7 EJ in 2011 to 1.9 EJ in 2018. China is expected to lead the growth in solar thermal energy use for heat, as attractive solar thermal economics in buildings in combination with obligations for solar thermal installations in new buildings in several major cities support further growth.
13 The MTRMR 2014 will be launched on 28 August 2014, and will include sector‐specific projections for renewable energy use for heat. 14 Traditional biomass use refers to the use of fuelwood, charcoal, animal dung and agricultural residues in stoves with very low efficiencies. No observed statistics are available and IEA estimates may differ from those of other international organisations. Traditional biomass use is calculated as the sum of all solid biomass use for heat in the residential sector of non‐OECD countries, in line with assumptions from the World Energy Outlook (IEA, 2012b).
Renewable energy use for heat (excluding traditional use of biomass) is expected to increase by 4 EJ (28%) from 2011 to 2018, with almost all of this growth taking place in the buildings sector.
Solar thermal energy use for heat represents the fastest‐growing sector, growing at 14% per year to reach 1.9 EJ in 2018. Modern bioenergy grows most in absolute terms (3.2 EJ from 2011 to 2018).
In the IEA 2 Degree Scenario (2DS), renewable energy use for heat will increase considerably in both industry and buildings in the long term, with the exception of traditional use of biomass, and contribute significantly to CO2 emissions reductions in the energy sector.
In the long term, a higher degree of integration of currently separated branches of the energy system (heat, electricity, transport) will improve the efficiency of energy production and use, and help create synergies between different technologies. District energy networks are an important component of such integrated energy systems.
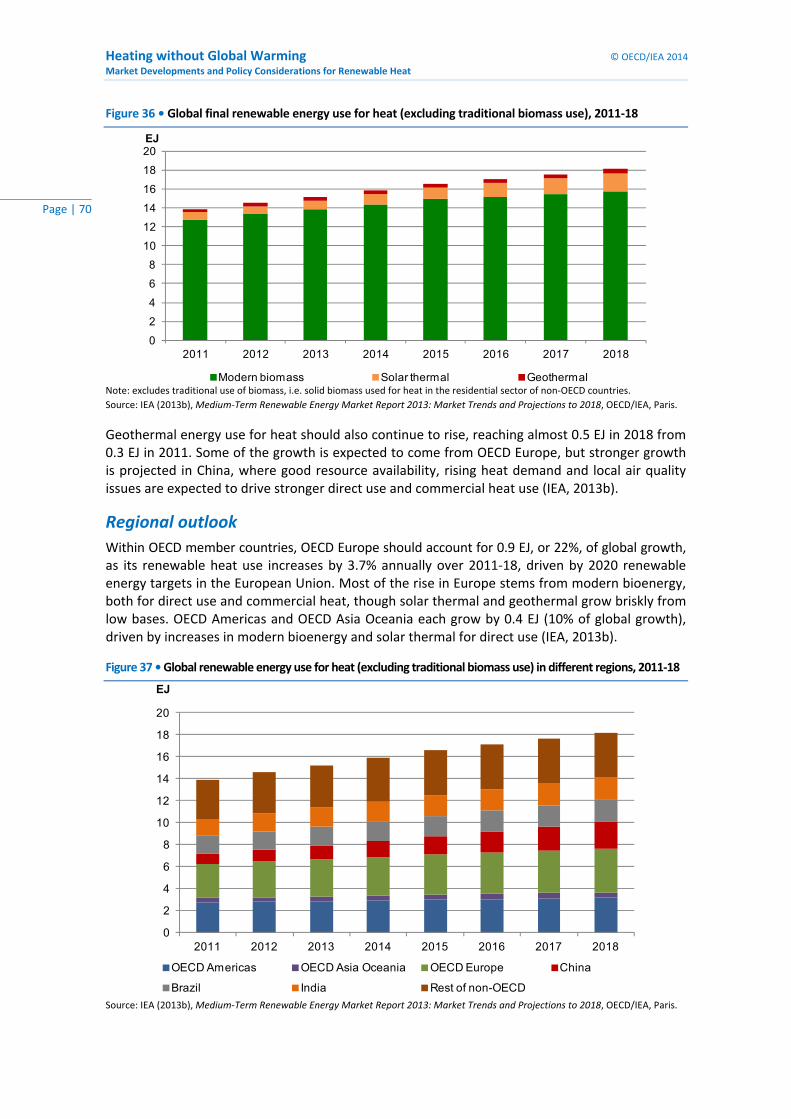
Heating without Global Warming © OECD/IEA 2014
Market Developments and Policy Considerations for Renewable Heat
Page | 70
Figure 36 • Global final renewable energy use for heat (excluding traditional biomass use), 2011‐18
0
2
4
6
8
10
12
14
16
18
20
2011 2012 2013 2014 2015 2016 2017 2018
EJ
Modern biomass Solar thermal Geothermal Note: excludes traditional use of biomass, i.e. solid biomass used for heat in the residential sector of non‐OECD countries.
Source: IEA (2013b), Medium‐Term Renewable Energy Market Report 2013: Market Trends and Projections to 2018, OECD/IEA, Paris.
Geothermal energy use for heat should also continue to rise, reaching almost 0.5 EJ in 2018 from 0.3 EJ in 2011. Some of the growth is expected to come from OECD Europe, but stronger growth is projected in China, where good resource availability, rising heat demand and local air quality issues are expected to drive stronger direct use and commercial heat use (IEA, 2013b).
Regional outlook
Within OECD member countries, OECD Europe should account for 0.9 EJ, or 22%, of global growth, as its renewable heat use increases by 3.7% annually over 2011‐18, driven by 2020 renewable energy targets in the European Union. Most of the rise in Europe stems from modern bioenergy, both for direct use and commercial heat, though solar thermal and geothermal grow briskly from low bases. OECD Americas and OECD Asia Oceania each grow by 0.4 EJ (10% of global growth), driven by increases in modern bioenergy and solar thermal for direct use (IEA, 2013b).
Figure 37 • Global renewable energy use for heat (excluding traditional biomass use) in different regions, 2011‐18
0
2
4
6
8
10
12
14
16
18
20
2011 2012 2013 2014 2015 2016 2017 2018
EJ
OECD Americas OECD Asia Oceania OECD Europe China
Brazil India Rest of non-OECD Source: IEA (2013b), Medium‐Term Renewable Energy Market Report 2013: Market Trends and Projections to 2018, OECD/IEA, Paris.
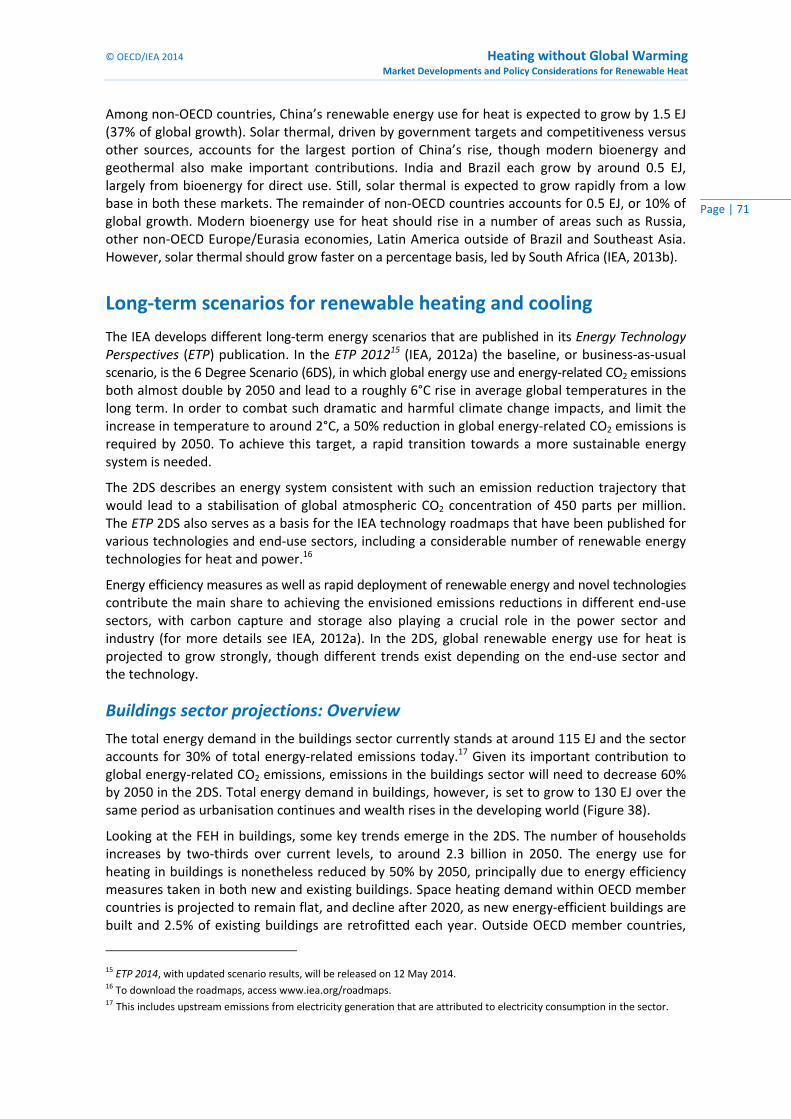
© OECD/IEA 2014 Heating without Global Warming Market Developments and Policy Considerations for Renewable Heat
Page | 71
Among non‐OECD countries, China’s renewable energy use for heat is expected to grow by 1.5 EJ (37% of global growth). Solar thermal, driven by government targets and competitiveness versus other sources, accounts for the largest portion of China’s rise, though modern bioenergy and geothermal also make important contributions. India and Brazil each grow by around 0.5 EJ, largely from bioenergy for direct use. Still, solar thermal is expected to grow rapidly from a low base in both these markets. The remainder of non‐OECD countries accounts for 0.5 EJ, or 10% of global growth. Modern bioenergy use for heat should rise in a number of areas such as Russia, other non‐OECD Europe/Eurasia economies, Latin America outside of Brazil and Southeast Asia. However, solar thermal should grow faster on a percentage basis, led by South Africa (IEA, 2013b).
Long‐term scenarios for renewable heating and cooling
The IEA develops different long‐term energy scenarios that are published in its Energy Technology Perspectives (ETP) publication. In the ETP 201215 (IEA, 2012a) the baseline, or business‐as‐usual scenario, is the 6 Degree Scenario (6DS), in which global energy use and energy‐related CO2 emissions both almost double by 2050 and lead to a roughly 6°C rise in average global temperatures in the long term. In order to combat such dramatic and harmful climate change impacts, and limit the increase in temperature to around 2°C, a 50% reduction in global energy‐related CO2 emissions is required by 2050. To achieve this target, a rapid transition towards a more sustainable energy system is needed.
The 2DS describes an energy system consistent with such an emission reduction trajectory that would lead to a stabilisation of global atmospheric CO2 concentration of 450 parts per million. The ETP 2DS also serves as a basis for the IEA technology roadmaps that have been published for various technologies and end‐use sectors, including a considerable number of renewable energy technologies for heat and power.16
Energy efficiency measures as well as rapid deployment of renewable energy and novel technologies contribute the main share to achieving the envisioned emissions reductions in different end‐use sectors, with carbon capture and storage also playing a crucial role in the power sector and industry (for more details see IEA, 2012a). In the 2DS, global renewable energy use for heat is projected to grow strongly, though different trends exist depending on the end‐use sector and the technology.
Buildings sector projections: Overview
The total energy demand in the buildings sector currently stands at around 115 EJ and the sector accounts for 30% of total energy‐related emissions today.17 Given its important contribution to global energy‐related CO2 emissions, emissions in the buildings sector will need to decrease 60% by 2050 in the 2DS. Total energy demand in buildings, however, is set to grow to 130 EJ over the same period as urbanisation continues and wealth rises in the developing world (Figure 38).
Looking at the FEH in buildings, some key trends emerge in the 2DS. The number of households increases by two‐thirds over current levels, to around 2.3 billion in 2050. The energy use for heating in buildings is nonetheless reduced by 50% by 2050, principally due to energy efficiency measures taken in both new and existing buildings. Space heating demand within OECD member countries is projected to remain flat, and decline after 2020, as new energy‐efficient buildings are built and 2.5% of existing buildings are retrofitted each year. Outside OECD member countries,
15 ETP 2014, with updated scenario results, will be released on 12 May 2014. 16 To download the roadmaps, access www.iea.org/roadmaps. 17 This includes upstream emissions from electricity generation that are attributed to electricity consumption in the sector.
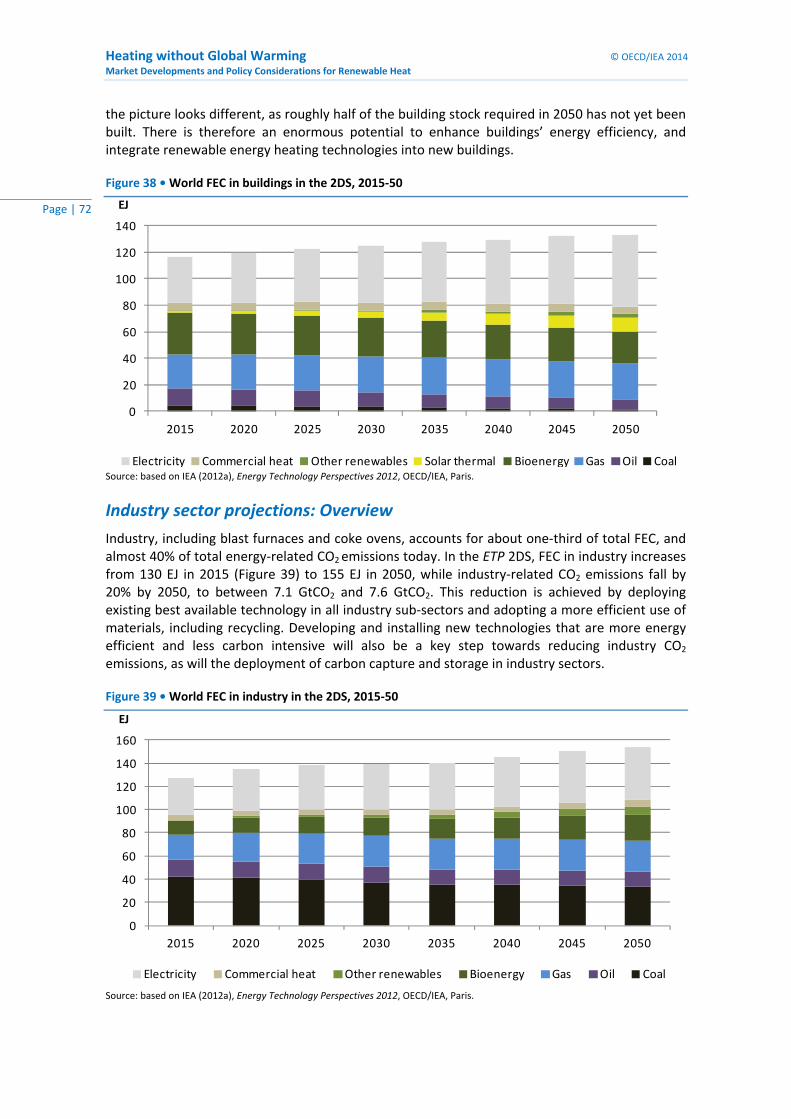
Heating without Global Warming © OECD/IEA 2014
Market Developments and Policy Considerations for Renewable Heat
Page | 72
the picture looks different, as roughly half of the building stock required in 2050 has not yet been built. There is therefore an enormous potential to enhance buildings’ energy efficiency, and integrate renewable energy heating technologies into new buildings.
Figure 38 • World FEC in buildings in the 2DS, 2015‐50
0
20
40
60
80
100
120
140
2015 2020 2025 2030 2035 2040 2045 2050
EJ
Electricity Commercial heat Other renewables Solar thermal Bioenergy Gas Oil Coal Source: based on IEA (2012a), Energy Technology Perspectives 2012, OECD/IEA, Paris.
Industry sector projections: Overview
Industry, including blast furnaces and coke ovens, accounts for about one‐third of total FEC, and almost 40% of total energy‐related CO2 emissions today. In the ETP 2DS, FEC in industry increases from 130 EJ in 2015 (Figure 39) to 155 EJ in 2050, while industry‐related CO2 emissions fall by 20% by 2050, to between 7.1 GtCO2 and 7.6 GtCO2. This reduction is achieved by deploying existing best available technology in all industry sub‐sectors and adopting a more efficient use of materials, including recycling. Developing and installing new technologies that are more energy efficient and less carbon intensive will also be a key step towards reducing industry CO2 emissions, as will the deployment of carbon capture and storage in industry sectors.
Figure 39 • World FEC in industry in the 2DS, 2015‐50
0
20
40
60
80
100
120
140
160
2015 2020 2025 2030 2035 2040 2045 2050
EJ
Electricity Commercial heat Other renewables Bioenergy Gas Oil Coal Source: based on IEA (2012a), Energy Technology Perspectives 2012, OECD/IEA, Paris.
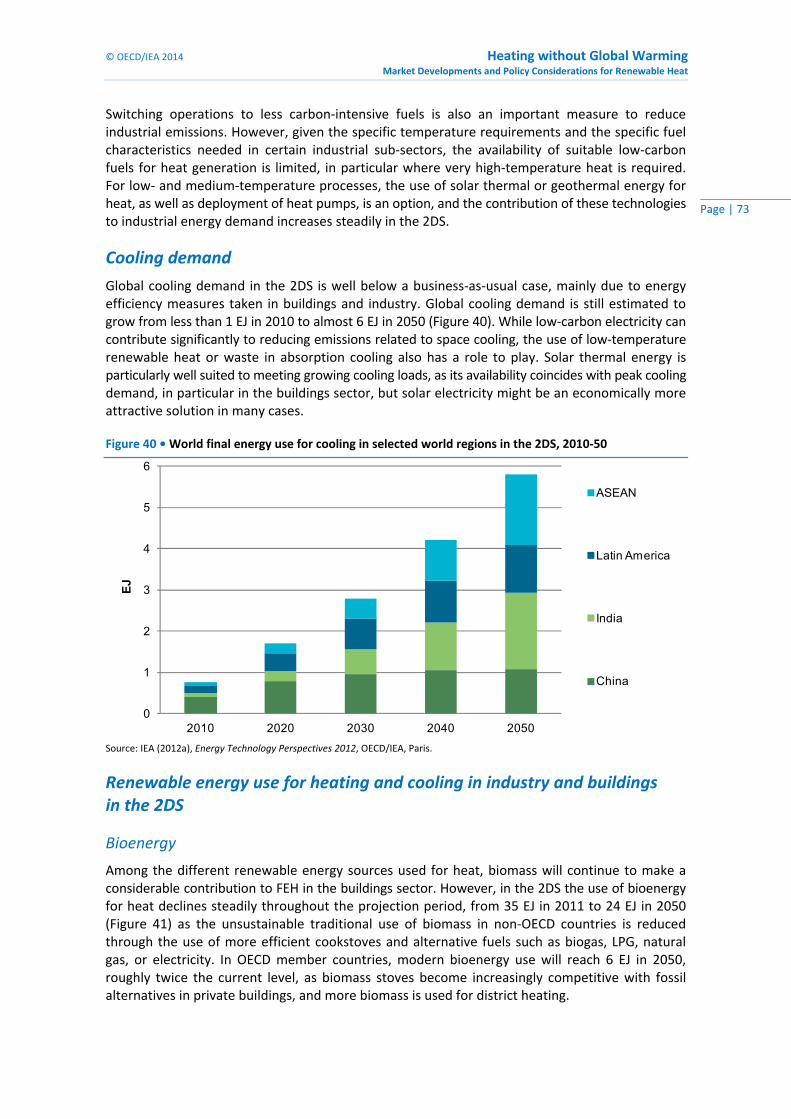
© OECD/IEA 2014 Heating without Global Warming Market Developments and Policy Considerations for Renewable Heat
Page | 73
Switching operations to less carbon‐intensive fuels is also an important measure to reduce industrial emissions. However, given the specific temperature requirements and the specific fuel characteristics needed in certain industrial sub‐sectors, the availability of suitable low‐carbon fuels for heat generation is limited, in particular where very high‐temperature heat is required. For low‐ and medium‐temperature processes, the use of solar thermal or geothermal energy for heat, as well as deployment of heat pumps, is an option, and the contribution of these technologies to industrial energy demand increases steadily in the 2DS.
Cooling demand
Global cooling demand in the 2DS is well below a business‐as‐usual case, mainly due to energy efficiency measures taken in buildings and industry. Global cooling demand is still estimated to grow from less than 1 EJ in 2010 to almost 6 EJ in 2050 (Figure 40). While low‐carbon electricity can contribute significantly to reducing emissions related to space cooling, the use of low‐temperature renewable heat or waste in absorption cooling also has a role to play. Solar thermal energy is particularly well suited to meeting growing cooling loads, as its availability coincides with peak cooling demand, in particular in the buildings sector, but solar electricity might be an economically more attractive solution in many cases.
Figure 40 • World final energy use for cooling in selected world regions in the 2DS, 2010‐50
0
1
2
3
4
5
6
2010 2020 2030 2040 2050
EJ
ASEAN
Latin America
India
China
Source: IEA (2012a), Energy Technology Perspectives 2012, OECD/IEA, Paris.
Renewable energy use for heating and cooling in industry and buildings in the 2DS
Bioenergy
Among the different renewable energy sources used for heat, biomass will continue to make a considerable contribution to FEH in the buildings sector. However, in the 2DS the use of bioenergy for heat declines steadily throughout the projection period, from 35 EJ in 2011 to 24 EJ in 2050 (Figure 41) as the unsustainable traditional use of biomass in non‐OECD countries is reduced through the use of more efficient cookstoves and alternative fuels such as biogas, LPG, natural gas, or electricity. In OECD member countries, modern bioenergy use will reach 6 EJ in 2050, roughly twice the current level, as biomass stoves become increasingly competitive with fossil alternatives in private buildings, and more biomass is used for district heating.
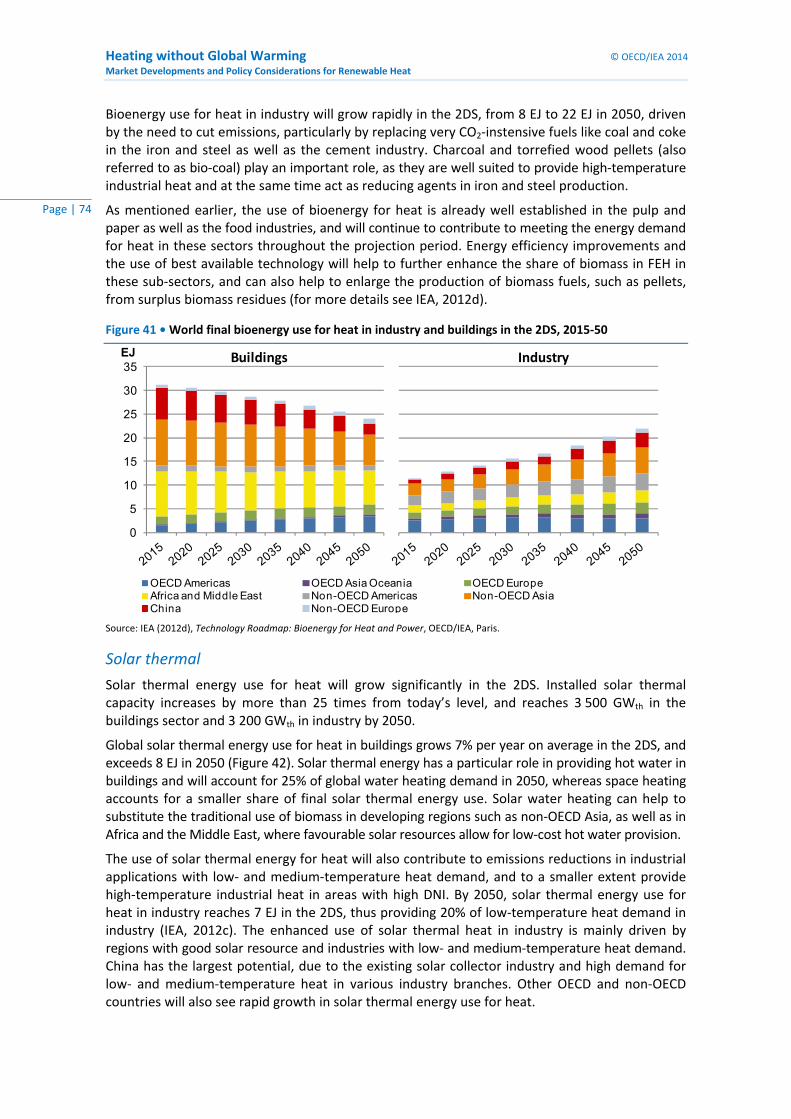
Heating without Global Warming © OECD/IEA 2014
Market Developments and Policy Considerations for Renewable Heat
Page | 74
Bioenergy use for heat in industry will grow rapidly in the 2DS, from 8 EJ to 22 EJ in 2050, driven by the need to cut emissions, particularly by replacing very CO2‐instensive fuels like coal and coke in the iron and steel as well as the cement industry. Charcoal and torrefied wood pellets (also referred to as bio‐coal) play an important role, as they are well suited to provide high‐temperature industrial heat and at the same time act as reducing agents in iron and steel production.
As mentioned earlier, the use of bioenergy for heat is already well established in the pulp and paper as well as the food industries, and will continue to contribute to meeting the energy demand for heat in these sectors throughout the projection period. Energy efficiency improvements and the use of best available technology will help to further enhance the share of biomass in FEH in these sub‐sectors, and can also help to enlarge the production of biomass fuels, such as pellets, from surplus biomass residues (for more details see IEA, 2012d).
Figure 41 • World final bioenergy use for heat in industry and buildings in the 2DS, 2015‐50
0
5
10
15
20
25
30
35EJ
OECD Americas OECD Asia Oceania OECD EuropeAfrica and Middle East Non-OECD Americas Non-OECD AsiaChina Non-OECD Europe
Buildings Industry
Source: IEA (2012d), Technology Roadmap: Bioenergy for Heat and Power, OECD/IEA, Paris.
Solar thermal
Solar thermal energy use for heat will grow significantly in the 2DS. Installed solar thermal capacity increases by more than 25 times from today’s level, and reaches 3 500 GWth in the buildings sector and 3 200 GWth in industry by 2050.
Global solar thermal energy use for heat in buildings grows 7% per year on average in the 2DS, and exceeds 8 EJ in 2050 (Figure 42). Solar thermal energy has a particular role in providing hot water in buildings and will account for 25% of global water heating demand in 2050, whereas space heating accounts for a smaller share of final solar thermal energy use. Solar water heating can help to substitute the traditional use of biomass in developing regions such as non‐OECD Asia, as well as in Africa and the Middle East, where favourable solar resources allow for low‐cost hot water provision.
The use of solar thermal energy for heat will also contribute to emissions reductions in industrial applications with low‐ and medium‐temperature heat demand, and to a smaller extent provide high‐temperature industrial heat in areas with high DNI. By 2050, solar thermal energy use for heat in industry reaches 7 EJ in the 2DS, thus providing 20% of low‐temperature heat demand in industry (IEA, 2012c). The enhanced use of solar thermal heat in industry is mainly driven by regions with good solar resource and industries with low‐ and medium‐temperature heat demand. China has the largest potential, due to the existing solar collector industry and high demand for low‐ and medium‐temperature heat in various industry branches. Other OECD and non‐OECD countries will also see rapid growth in solar thermal energy use for heat.
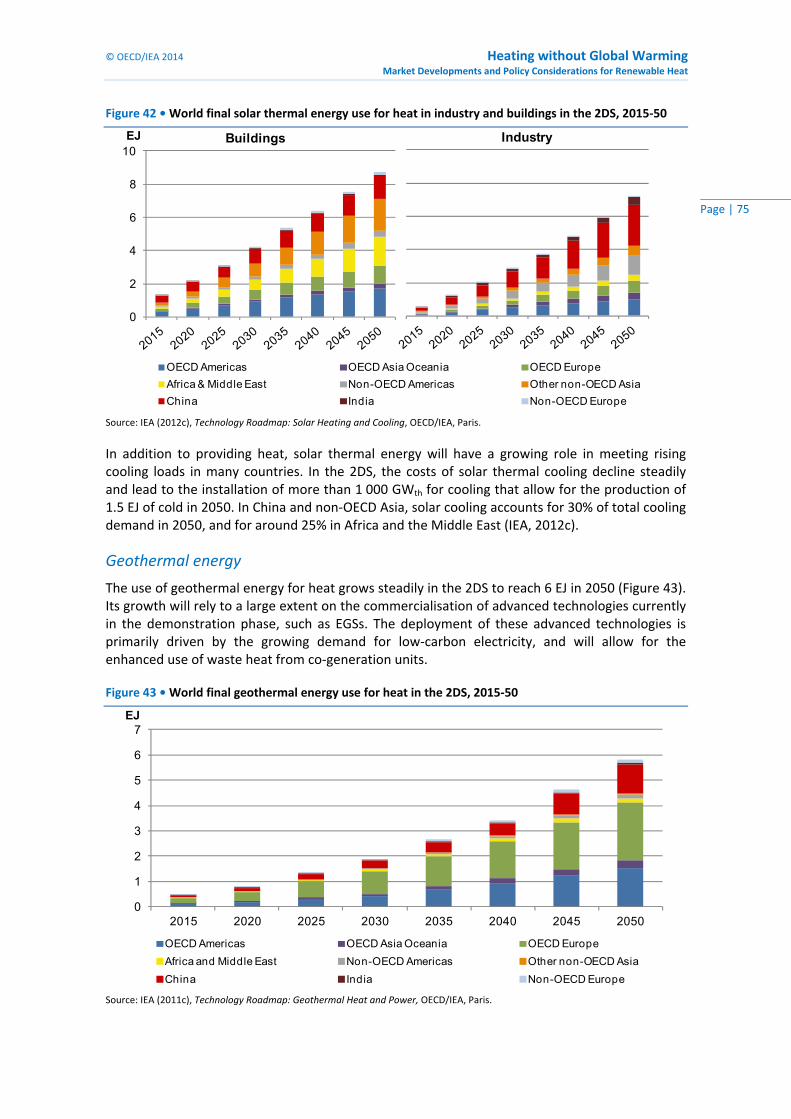
© OECD/IEA 2014 Heating without Global Warming Market Developments and Policy Considerations for Renewable Heat
Page | 75
Figure 42 • World final solar thermal energy use for heat in industry and buildings in the 2DS, 2015‐50
EJ Industry
OECD Americas OECD Asia Oceania OECD Europe
Africa & Middle East Non-OECD Americas Other non-OECD Asia
China India Non-OECD Europe
0
2
4
6
8
10Buildings
Source: IEA (2012c), Technology Roadmap: Solar Heating and Cooling, OECD/IEA, Paris.
In addition to providing heat, solar thermal energy will have a growing role in meeting rising cooling loads in many countries. In the 2DS, the costs of solar thermal cooling decline steadily and lead to the installation of more than 1 000 GWth for cooling that allow for the production of 1.5 EJ of cold in 2050. In China and non‐OECD Asia, solar cooling accounts for 30% of total cooling demand in 2050, and for around 25% in Africa and the Middle East (IEA, 2012c).
Geothermal energy
The use of geothermal energy for heat grows steadily in the 2DS to reach 6 EJ in 2050 (Figure 43). Its growth will rely to a large extent on the commercialisation of advanced technologies currently in the demonstration phase, such as EGSs. The deployment of these advanced technologies is primarily driven by the growing demand for low‐carbon electricity, and will allow for the enhanced use of waste heat from co‐generation units.
Figure 43 • World final geothermal energy use for heat in the 2DS, 2015‐50
0
1
2
3
4
5
6
7
2015 2020 2025 2030 2035 2040 2045 2050
EJ
OECD Americas OECD Asia Oceania OECD Europe
Africa and Middle East Non-OECD Americas Other non-OECD Asia
China India Non-OECD Europe Source: IEA (2011c), Technology Roadmap: Geothermal Heat and Power, OECD/IEA, Paris.
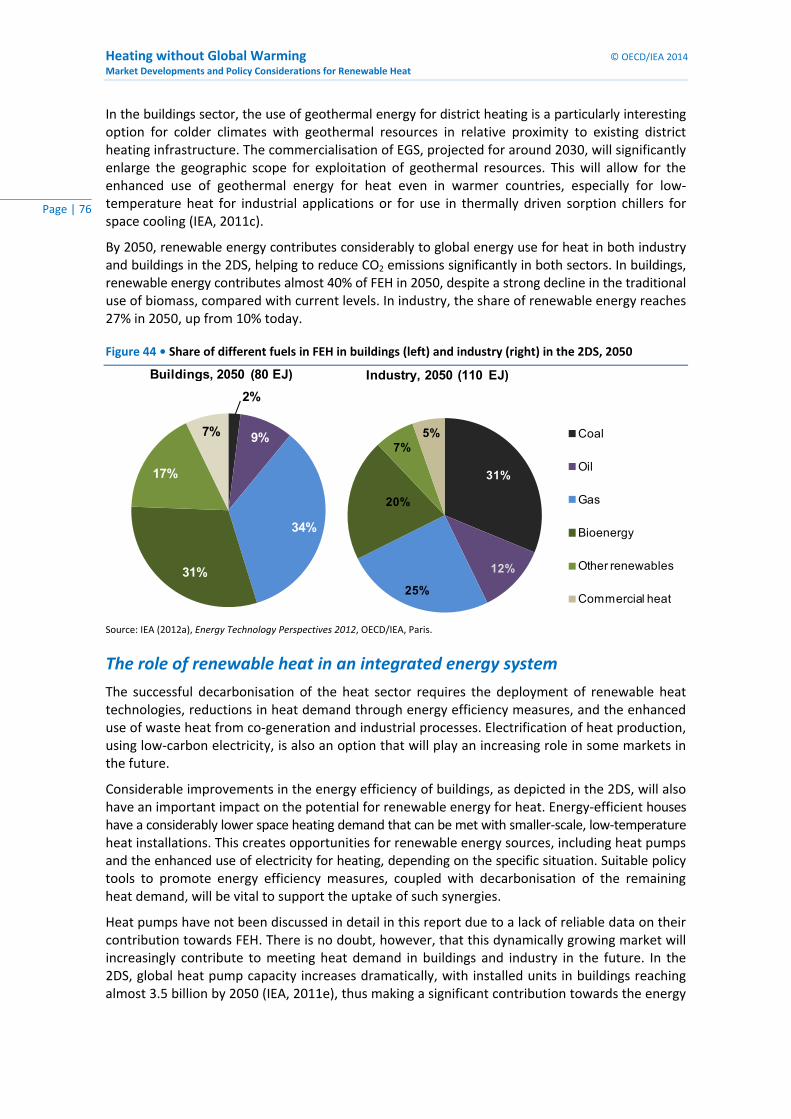
Heating without Global Warming © OECD/IEA 2014
Market Developments and Policy Considerations for Renewable Heat
Page | 76
In the buildings sector, the use of geothermal energy for district heating is a particularly interesting option for colder climates with geothermal resources in relative proximity to existing district heating infrastructure. The commercialisation of EGS, projected for around 2030, will significantly enlarge the geographic scope for exploitation of geothermal resources. This will allow for the enhanced use of geothermal energy for heat even in warmer countries, especially for low‐temperature heat for industrial applications or for use in thermally driven sorption chillers for space cooling (IEA, 2011c).
By 2050, renewable energy contributes considerably to global energy use for heat in both industry and buildings in the 2DS, helping to reduce CO2 emissions significantly in both sectors. In buildings, renewable energy contributes almost 40% of FEH in 2050, despite a strong decline in the traditional use of biomass, compared with current levels. In industry, the share of renewable energy reaches 27% in 2050, up from 10% today.
Figure 44 • Share of different fuels in FEH in buildings (left) and industry (right) in the 2DS, 2050
2%
9%
34%
31%
17%
7%
Buildings, 2050 (80 EJ)
31%
12%
25%
20%
7%5%
Industry, 2050 (110 EJ)
Coal
Oil
Gas
Bioenergy
Other renewables
Commercial heat
Source: IEA (2012a), Energy Technology Perspectives 2012, OECD/IEA, Paris.
The role of renewable heat in an integrated energy system
The successful decarbonisation of the heat sector requires the deployment of renewable heat technologies, reductions in heat demand through energy efficiency measures, and the enhanced use of waste heat from co‐generation and industrial processes. Electrification of heat production, using low‐carbon electricity, is also an option that will play an increasing role in some markets in the future.
Considerable improvements in the energy efficiency of buildings, as depicted in the 2DS, will also have an important impact on the potential for renewable energy for heat. Energy‐efficient houses have a considerably lower space heating demand that can be met with smaller‐scale, low‐temperature heat installations. This creates opportunities for renewable energy sources, including heat pumps and the enhanced use of electricity for heating, depending on the specific situation. Suitable policy tools to promote energy efficiency measures, coupled with decarbonisation of the remaining heat demand, will be vital to support the uptake of such synergies.
Heat pumps have not been discussed in detail in this report due to a lack of reliable data on their contribution towards FEH. There is no doubt, however, that this dynamically growing market will increasingly contribute to meeting heat demand in buildings and industry in the future. In the 2DS, global heat pump capacity increases dramatically, with installed units in buildings reaching almost 3.5 billion by 2050 (IEA, 2011e), thus making a significant contribution towards the energy
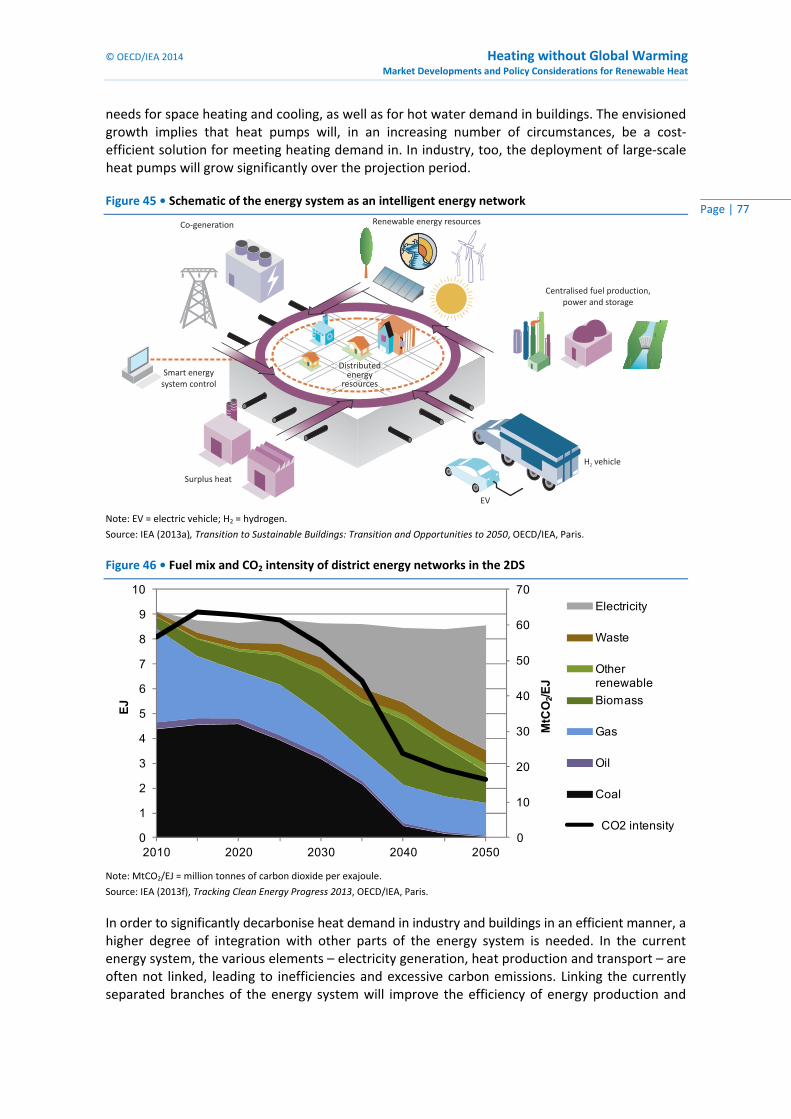
© OECD/IEA 2014 Heating without Global Warming Market Developments and Policy Considerations for Renewable Heat
Page | 77
needs for space heating and cooling, as well as for hot water demand in buildings. The envisioned growth implies that heat pumps will, in an increasing number of circumstances, be a cost‐efficient solution for meeting heating demand in. In industry, too, the deployment of large‐scale heat pumps will grow significantly over the projection period.
Figure 45 • Schematic of the energy system as an intelligent energy network
Centralised fuel production,
power and storage
Renewable energy resources
Surplus heat
H vehicle2
EV
Co-generation
Distributedenergy
resources
Smart energy
system control
Note: EV = electric vehicle; H2 = hydrogen.
Source: IEA (2013a), Transition to Sustainable Buildings: Transition and Opportunities to 2050, OECD/IEA, Paris.
Figure 46 • Fuel mix and CO2 intensity of district energy networks in the 2DS
0
10
20
30
40
50
60
70
0
1
2
3
4
5
6
7
8
9
10
2010 2020 2030 2040 2050
MtC
O2/E
J
EJ
Electricity
Waste
Other renewable
Biomass
Gas
Oil
Coal
CO2 intensity
Note: MtCO2/EJ = million tonnes of carbon dioxide per exajoule.
Source: IEA (2013f), Tracking Clean Energy Progress 2013, OECD/IEA, Paris.
In order to significantly decarbonise heat demand in industry and buildings in an efficient manner, a higher degree of integration with other parts of the energy system is needed. In the current energy system, the various elements – electricity generation, heat production and transport – are often not linked, leading to inefficiencies and excessive carbon emissions. Linking the currently separated branches of the energy system will improve the efficiency of energy production and
Heating without Global Warming © OECD/IEA 2014
Market Developments and Policy Considerations for Renewable Heat
Page | 78
use, and help create synergies between different technologies. District energy networks are an important component of such integrated energy systems.
By 2050, 6.3 billion people will live in cities, up from 3.5 billion today. This opens great opportunities for the enhanced development of district heating and cooling networks, as higher heat demand per area will significantly reduce the price of heat and cold distribution through such networks. District heating and cooling networks are already being installed at a rapid pace today, and will help to decarbonise the heat supply. These networks will allow for better utilisation of waste heat from co‐generation plants and thus enhance the efficiency of the fuels used in these plants. As well, district heating networks will enhance shares of renewable heat to be distributed to end users in industry and buildings. By 2050, the share of renewable energy distributed through district heating and cooling networks in the 2DS will reach 2 EJ (Figure 46), about one‐quarter of the total energy in the networks.
Daily and seasonal storage systems will need to be expanded to enhance the use of renewable energy for heat in buildings and industry. Large‐scale thermal storage will also be needed as part of smart district heating and cooling networks to make them an integral part of the energy system, connecting heat generation and distribution with the electricity sector by acting as storage for variable renewable electricity (in the form of heat). The expansion of integrated district heating networks can therefore reduce the need for separate, specific heating and cooling supply through individual devices, particularly in the buildings sector.
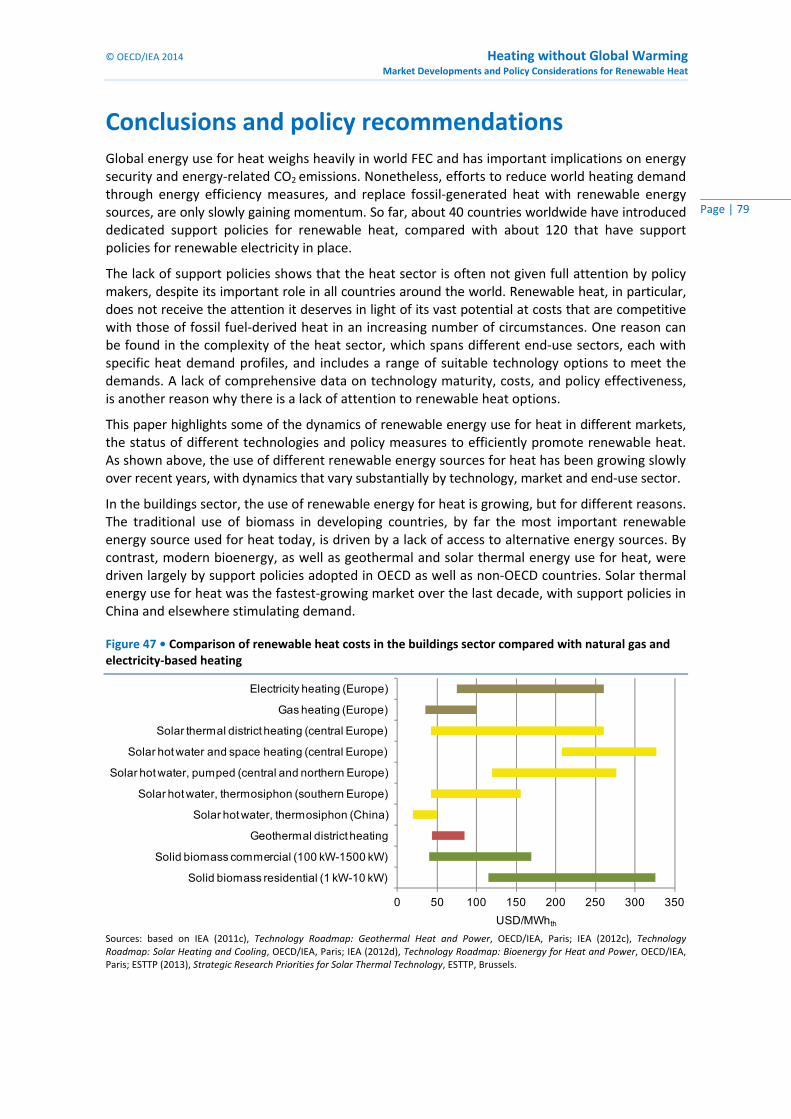
© OECD/IEA 2014 Heating without Global Warming Market Developments and Policy Considerations for Renewable Heat
Page | 79
Conclusions and policy recommendations Global energy use for heat weighs heavily in world FEC and has important implications on energy security and energy‐related CO2 emissions. Nonetheless, efforts to reduce world heating demand through energy efficiency measures, and replace fossil‐generated heat with renewable energy sources, are only slowly gaining momentum. So far, about 40 countries worldwide have introduced dedicated support policies for renewable heat, compared with about 120 that have support policies for renewable electricity in place.
The lack of support policies shows that the heat sector is often not given full attention by policy makers, despite its important role in all countries around the world. Renewable heat, in particular, does not receive the attention it deserves in light of its vast potential at costs that are competitive with those of fossil fuel‐derived heat in an increasing number of circumstances. One reason can be found in the complexity of the heat sector, which spans different end‐use sectors, each with specific heat demand profiles, and includes a range of suitable technology options to meet the demands. A lack of comprehensive data on technology maturity, costs, and policy effectiveness, is another reason why there is a lack of attention to renewable heat options.
This paper highlights some of the dynamics of renewable energy use for heat in different markets, the status of different technologies and policy measures to efficiently promote renewable heat. As shown above, the use of different renewable energy sources for heat has been growing slowly over recent years, with dynamics that vary substantially by technology, market and end‐use sector.
In the buildings sector, the use of renewable energy for heat is growing, but for different reasons. The traditional use of biomass in developing countries, by far the most important renewable energy source used for heat today, is driven by a lack of access to alternative energy sources. By contrast, modern bioenergy, as well as geothermal and solar thermal energy use for heat, were driven largely by support policies adopted in OECD as well as non‐OECD countries. Solar thermal energy use for heat was the fastest‐growing market over the last decade, with support policies in China and elsewhere stimulating demand.
Figure 47 • Comparison of renewable heat costs in the buildings sector compared with natural gas and electricity‐based heating
0 50 100 150 200 250 300 350
Solid biomass residential (1 kW-10 kW)
Solid biomass commercial (100 kW-1500 kW)
Geothermal district heating
Solar hot water, thermosiphon (China)
Solar hot water, thermosiphon (southern Europe)
Solar hot water, pumped (central and northern Europe)
Solar hot water and space heating (central Europe)
Solar thermal district heating (central Europe)
Gas heating (Europe)
Electricity heating (Europe)
USD/MWhth Sources: based on IEA (2011c), Technology Roadmap: Geothermal Heat and Power, OECD/IEA, Paris; IEA (2012c), Technology Roadmap: Solar Heating and Cooling, OECD/IEA, Paris; IEA (2012d), Technology Roadmap: Bioenergy for Heat and Power, OECD/IEA, Paris; ESTTP (2013), Strategic Research Priorities for Solar Thermal Technology, ESTTP, Brussels.
Heating without Global Warming © OECD/IEA 2014
Market Developments and Policy Considerations for Renewable Heat
Page | 80
Initial support policies have been so successful in establishing a commercial market and triggering reductions of equipment costs that solar thermal energy use for heat is now cost‐competitive with fossil fuel use for heat in a number of markets.
Other renewable heating technologies too can be cost‐competitive with fossil fuel‐based heating, in particular in the buildings sector. However, the range of reported costs is wide (Figure 47). This can be explained partly by resource availability. But costs of similar systems also vary widely between countries, and do not always represent the state of market development, with prices in some countries with well‐established markets being higher than in others. Charges for installation and the “soft costs” associated with marketing and customer acquisition can also play an important role in these differences.
There is also some evidence that vendors do not recognise the need to reduce costs to open up more, larger‐scale markets, since small‐scale local markets are seen as relatively price insensitive. In such circumstances financial incentives can discourage further cost reductions in technology. A UK study, for instance, found that financial incentives in combination with relatively high fossil fuel prices made biomass heating systems economically attractive for consumers and thus led to stable demand for installers. There was thus little pressure on the installer side to achieve further cost reductions (Carbon Trust, 2012). A more consistent effort to collect and analyse system cost information in different markets would help in the design of renewable heat policies and also facilitate comparison of the effectiveness of different policy portfolios.
Policy needs to help drive cost reductions and so cut the levels of financial support required. Such cost reductions prompt opportunities for continuous deployment of these technologies beyond established markets, but this also requires adjustment to support policies to avoid excessive costs to the public budget. Financial incentives can be replaced by obligations for renewable heat use in new buildings, for instance. In addition, awareness‐raising campaigns and the removal of non‐economic barriers will be important measures to sustain further growth and reduce emissions related to heat production.
The use of renewable energy for heat in the industry sector needs to be looked at separately. Only 10% of heat demand in industry today is met with renewable energy, and its use has been primarily driven by economic considerations, i.e. the availability of resources, primarily in the form of biomass, at costs competitive with fossil fuels. Very few current policies aim at promoting the use of renewable energy for heat in industry, despite considerable potential in various industrial processes. To promote renewable energy use for heat in industry, policy measures must address a number of barriers currently preventing a greater penetration:
In many countries, industry benefits from rather low prices for fossil fuels, which makes it difficult for renewable energy technologies to compete.
Technical challenges exist related to the large scale of installations required in industry, as well as to the lack of standardised solutions for industrial renewable heating equipment and the complexity of industrial processes and system integration.
While a broad range of technologies is commercially available to provide renewable low‐ and medium‐temperature heat for industry processes, only a few fully commercialised renewable energy technologies exist that can provide high‐temperature heat for industrial operations at acceptable costs – mostly relying on biomass.
Non‐economic barriers, such as the lack of awareness of the suitability of renewable heating applications in industry, and low acceptance of long payback periods, prevent greater penetration of certain technologies that are already cost‐competitive with fossil fuel technologies.
© OECD/IEA 2014 Heating without Global Warming Market Developments and Policy Considerations for Renewable Heat
Page | 81
Recommendations
This paper shows that the role of renewable energy in providing low‐carbon heat has been growing in both buildings and industry over the last decade. The IEA 2DS shows that the enhanced use of renewable energy will be crucial to decarbonise the increasing demand for heating and cooling in buildings and industry in the future.
To achieve such extensive decarbonisation, governments should develop renewable heat as part of a holistic strategy aimed at developing locally based energy sources that address the particular characteristics of local energy demands. Such a strategy needs to be based on a detailed local appraisal of both the potentials of different heat sources and the barriers towards their deployment. It should focus on technologies best able to make a cost‐effective contribution, considering the specific characteristics of heat demand in different end‐use sectors.
The first priority, however, should be to enhance energy efficiency measures and promote the use of available waste‐heat resources, in particular through thermal energy networks. Such networks will also act as enablers for the enhanced use of low‐carbon renewable heat, in particular in high‐density areas. The development of locally available, cost‐competitive renewable energy sources for heat, including efficient heat pumps and the use of renewable electricity for heat, will be an indispensable part of any holistic strategy aimed at the decarbonisation of energy demand in buildings and industry.
In order to enhance the use of renewable energy for heat in different end‐use sectors, governments should take into account several considerations:
Energy use for heat weighs heavily on total energy demand, and has a serious impact on energy security and energy‐related CO2 emissions. Renewable energy use for heat therefore deserves greater attention.
There is no “one‐size‐fits‐all” policy design that ensures the efficient support of renewable energy use for heat, as suitable policy measures depend strongly on the geographical and economic context. Countries willing to promote renewable heat should therefore make use of the successful experiences of other countries of similar economic and geographical conditions to ensure efficient policy design.
As a first low‐cost policy measure to promote the use of renewable heat, non‐economic barriers should be addressed and removed, for instance through awareness‐raising campaigns. Support policies for renewable heat and energy efficiency should be closely aligned in order to ensure efficient overall policy design.
The creation of a level playing field for renewable energy, through reduction of fossil fuel subsidies and/or by introduction of pricing mechanisms for CO2 emissions, is crucial to promote renewable energy use for heat.
Policies for renewable heat should be developed as part of a holistic strategy addressing the overall heat demand of a certain end‐use sector. Such a strategy should address renewable energy use for heating and cooling, together with energy efficiency measures and the enhanced use of waste heat.
While a set of mature renewable heating technologies is already available, in particular for the buildings sector, RD&D support is still needed for technologies in an early stage of development. Key areas include technologies suitable to meet industrial heat demand, renewable cooling technologies, and heat and cold storage.
Improved data on heat and cooling production, general demand and renewable energy use for such purposes, as well as technology costs, would considerably improve the analysis of the sector and the formulation of cost‐efficient policy measures.
Heating without Global Warming © OECD/IEA 2014
Market Developments and Policy Considerations for Renewable Heat
Page | 82
Acronyms, abbreviations and units of measure
Acronyms and abbreviations
2DS 2 Degree Scenario 6DS 6 Degree Scenario CO2 carbon dioxide COP co‐efficient of production DNI direct normal irradiance EGS enhanced geothermal systems ESCO energy service company ETP Energy Technology Perspectives EU European Union EU27 all EU member states prior to the accession of Croatia in July 2013 EV electric vehicle FEC final energy consumption FEH final energy use for heat GHG greenhouse gas H2 hydrogen IEA International Energy Agency IRENA International Renewable Energy Agency LPG liquefied petroleum gas MTRMR Medium‐Term Renewable Energy Market Report OECD Organisation for Economic Co‐Operation and Development PV photovoltaic RD&D research, development and demonstration RES renewable energy source TPES total primary energy supply UN United Nations UNEP United Nations Environment Programme USD United States dollar
Units of measure
°C degree Celsius EJ exajoule EUR/kWhth euros per kilowatt hour thermal EUR/t euros per tonne GtCO2 gigatonne of carbon dioxide GWth gigawatt thermal km kilometre kW kilowatt kWth/1 000 capita kilowatt thermal per 1 000 capita kWhth kilowatt hour thermal m2 square metre m3 cubic metre Mt megatonne MtCO2/EJ million tonnes of carbon dioxide per exajoule MW megawatt

© OECD/IEA 2014 Heating without Global Warming Market Developments and Policy Considerations for Renewable Heat
Page | 83
MWe megawatt electrical MWh megawatt hour MWth megawatt thermal t tonne t/yr tonnes per year USD/kWth United States dollars per kilowatt thermal USD/MWhth United States dollars per megawatt hour thermal USD/t United States dollars per tonne
Heating without Global Warming © OECD/IEA 2014
Market Developments and Policy Considerations for Renewable Heat
Page | 84
References ADEME (Agence de l’Environnement et de la Maîtrise de l’Énergie) (2012), French Know‐how in
the Field of Geothermal Energy District Heating and Electricity Systems, www2.ademe.fr.
BTG‐BTL (2011), Heat and Power from Pyrolysis Oil, www.btg‐btl.com/en/applications/heat‐power.
Carbon Trust (2012), Biomass Heat Accelerator, Carbon Trust, London.
CEMBUREAU (2013), Key Facts & Figures. World Cement Production 2012 by Region and Main Countries, www.cembureau.eu/about‐cement/key‐facts‐figures.
Central Statistics Office (2013), Energy Statistics 2012, Government of India, New Delhi.
Dalenbäck, J.‐O. (2010), Success Factors in Solar District Heating, www.solarthermalworld.org/content/success‐factors‐solar‐district‐heating‐2010.
DECC (Department of Energy and Climate Change) (2011), UK Carbon Plan: Delivering Our Low Carbon Future, DECC, London.
DECC (2013), Domestic Renewable Heat Incentive. The First Step to Transforming the Way We Heat Our Homes, DECC, London.
EC (European Commission)/RHC‐Platform (European Technology Platform on Renewable Heating and Cooling) (2011), Common Vision for the Renewable Heating and Cooling Sector in Europe: 2020‐2030‐2050, Publications Office of the European Union, Luxembourg.
EC/RHC‐Platform (2012), Strategic Research Priorities for Renewable Heating and Cooling Cross‐cutting Technology, RHC‐Platform, Brussels.
EC/RHC‐Platform (2013), Strategic Research and Innovation Agenda for Renewable Heating and Cooling Sector in Europe: 2020‐2030‐2050, Publications Office of the European Union, Luxembourg.
E.ON Hanse (2011), Europaweit einmaliges Projekt zur Einspeisung regenerativ erzeugter Wärme (Europe‐wide unique project for the injection of renewable heat), www.eon‐hanse.com/pages/eha_de/Presse/Pressemitteilungen/Aktuelle_Presse/Pressemitteilung.htm?id=1459644.
ESTTP (European Technology Platform on Renewable Heating and Cooling) (2013), Strategic Research Priorities for Solar Thermal Technology, ESSTPP, Brussels.
Euroheat & Power (2006), The European Heat Market, Euroheat & Power, Brussels.
Euroheat & Power (2013), District Heating and Cooling Country by Country – 2013 Survey, Euroheat & Power, Brussels.
EWEA (European Wind Energy Association) (2013), Wind in Power. 2012 European Statistics, EWEA, Brussels.
GBEP (Global Bioenergy Partnership) (2011), The Global Bioenergy Partnership Sustainability Indicators for Bioenergy, GBEP, Rome.
Helsingin Energia (2013), Energy‐Efficient Urban Cooling, www.helen.fi/en/Households/Services/District‐cooling/Energy‐efficient‐urban‐cooling.
IEA (International Energy Agency) (2007), Renewables for Heating and Cooling: Untapped Potential, OECD/IEA, Paris.
© OECD/IEA 2014 Heating without Global Warming Market Developments and Policy Considerations for Renewable Heat
Page | 85
IEA (2011a), Solar Energy Perspectives, OECD/IEA, Paris.
IEA (2011b), Renewable Information 2011, OECD/IEA, Paris.
IEA (2011c), Technology Roadmap: Geothermal Heat and Power, OECD/IEA, Paris.
IEA (2011d), Deploying Renewables: Best and Future Policy Practice, OECD/IEA, Paris.
IEA (2011e), Technology Roadmap: Energy‐Efficient Buildings: Heating and Cooling Equipment, OECD/IEA, Paris.
IEA (2012a), Energy Technology Perspectives 2012, OECD/IEA, Paris.
IEA (2012b), World Energy Outlook 2012, OECD/IEA, Paris.
IEA (2012c), Technology Roadmap: Solar heating and Cooling, OECD/IEA, Paris.
IEA (2012d), Technology Roadmap: Bioenergy for Heat and Power, OECD/IEA, Paris.
IEA (2012e), Policies for Renewable Heat: An Integrated Approach, OECD/IEA, Paris.
IEA (2013a), Transition to Sustainable Buildings: Transition and Opportunities to 2050, OECD/IEA, Paris.
IEA (2013b), Medium‐Term Renewable Energy Market Report: Market Trends and Projections to 2018, OECD/IEA, Paris.
IEA (2013c), Energy Balances of OECD Countries 2013 Edition, OECD/IEA, Paris.
IEA (2013d), Energy Balances of Non‐OECD Countries 2013 Edition, OECD/IEA, Paris.
IEA (2013e), CO2 Emissions from Fuel Combustion 2013 Edition, OECD/IEA, Paris.
IEA (2013f), Tracking Clean Energy Progress 2013, OECD/IEA, Paris.
IEA (2013g), World Energy Outlook 2013, OECD/IEA, Paris.
IEA (2014), Technology Roadmap: Energy Storage, OECD/IEA, Paris.
IEA RETD (Renewable Energy Technology Deployment) (2010), Best Practices in the Deployment of Renewable Energy for Heating and Cooling in the Residential Sector, www.iea‐retd.org.
IEA RETD (2011), Renewable Energy for Residential Heating and Cooling, Earthscan, London.
IEA SHC (Solar Heating and Cooling Programme) (2013), Solar Cooling Position Paper, www.iea‐shc.org/data/sites/1/publications/IEA‐SHC‐Solar‐Cooling‐Position‐Paper‐‐Executive‐Summary.pdf.
IEA/UNDP (United Nations Development Programme) (2013), Modernising Building Energy Codes to Secure our Global Future, OECD/IEA, Paris.
IPCC (Intergovernmental Panel on Climate Change) (2011), IPCC Special Report on Renewable Energy Sources and Climate Change Mitigation, prepared by Working Group III of the Intergovernmental Panel on Climate Change, Cambridge University Press, Cambridge and New York.
IRENA (International Renewable Energy Agency) (2013), Statistical Issues: Bioenergy and Distributed Renewable Energy, IRENA, Abu Dhabi.
Jakob, U. (2013), “Status and perspectives of solar cooling outside Australia”, Australian Solar Cooling 2013 Conference, 12 April 2013, Sydney.
Levacher, L. et al. (2009), Energy Efficiency in Industry: From Existing Technologies to Innovative Solutions, ECEE 2009 Summer Study.
Heating without Global Warming © OECD/IEA 2014
Market Developments and Policy Considerations for Renewable Heat
Page | 86
Mauthner, F. and W. Weiss (2012), Solar Heat Worldwide 2012. Markets and Contribution to the Energy Supply 2010, www.iea‐shc.org/solar‐heat‐worldwide.
Mugnier, D. and U. Jakob (2012), “Keeping cool with the sun”, International Sustainable Energy Review, Vol. 6/1, Russell Publishing, United Kingdom, pp. 28‐30.
Nordic Folkecenter (2010), District heating can now store wind energy, www.folkecenter.net/gb/rd/power‐balancing/district‐heating.
Öko Institut (2012), Contribution of Renewable Cooling to the Renewable Energy Target of the EU, Öko Institut, Freiburg.
proPellets Austria (2013), www.propellets.at/de/heizen‐mit‐pellets/statistik/.
REN21 (Renewable Energy Network for the 21st Century) (2012), Renewables 2012 Global Status Report, REN21, Paris.
REN21 (2013), Renewables 2013 Global Status Report, REN21, Paris.
Singhal, A. (2014), Indian status on CSTs for heating and cooling applications, presentation at SEMThermal 2014 Conference, 18 February 2014, Berlin.
Solarthermalworld.org (2013a), China: 2013 market statistics and trends, www.solarthermalworld.org/content/china‐2013‐market‐statistics‐and‐trends.
Solarthermalworld.org (2013b), Austria/Brazil: Mechanism to guarantee energy supply contracts, www.solarthermalworld.org.
Solarthermalworld.org (2014), Denmark: “We have improved the cost/performance ratio by around 50% over the last 5 years”, www.solarthermalword.org.
Sustainable Energy for All (2013), Global Tracking Framework, www.se4all.org/tracking‐progress/.
Taibi, E., D. Gielen and M. Bazilian (2011), Renewable energy in industrial applications: An assessment of the 2050 potential, UNIDO, Vienna.
World Health Organisation (WHO) (2011), “Indoor air pollution and health”, Fact sheet, Number 292, WHO, Geneva.
World Steel Association (2013), Top Steel‐Producing Companies 2012, www.worldsteel.org/statistics/top‐producers.html.

www.iea.org/books
PDF versions at 20% discount
nlinebookshop
Tel: +33 (0)1 40 57 66 90
E-mail: [email protected]
International Energy Agency9 rue de la Fédération
75739 Paris Cedex 15, France
Secure Sustainable Together

The statistical data for Israel are supplied by and under the responsibility of the relevant Israeli authorities. The use of such data by the OECD is without prejudice to the status of the Golan
Heights, East Jerusalem and Israeli settlements in the West Bank under the terms of international law.
This document and any map included herein are without prejudice to the status of or sovereignty over any territory, to the delimitation of international frontiers and boundaries and to the name
of any territory, city or area.
IEA Publications 9, rue de la Fédération, 75739 Paris cedex 15
Printed in France by IEA, April 2014


9 rue de la Fédération 75739 Paris Cedex 15
www.iea.org
Secure Sustainable Together