fe a tu re s - university of new south · pdf filescada. national electricity market design...
TRANSCRIPT

National E
lectricity Market D
esign & P
erformance # 1
© H
. Outhred 2002
Fundam
entals of
Electricity Industry R
estructuring
National E
lectricity Market
Design and P
erformance
Hugh O
uthredU
niversity of New
South W
ales
Em
ail: h.outhred@unsw
.edu.auT
el: 0414 385 240
THE A
USTRA
LIAN
CRC FOR
RENEW
ABLE EN
ERGY
LTD

National E
lectricity Market D
esign & P
erformance # 2
© H
. Outhred 2002
Electricity industry structure in S
E A
ustralia
Gen 1
Gen 2
Gen X
GenerationS
ector:-large
generators
Gen 3
Transm
issionS
ector
NS
WV
ictoriaS
outh Aust.
Queensland
& possibly
Tasm
ania
Transm
issionS
ector
NS
WV
ictoriaS
outh Aust.
Queensland
& possibly
Tasm
ania
Electricity F
inancial instrument
& R
EC
(emission) trading
Distributor 1
Distributor 2
Distributor Y
Distributionsector
Electricity
Multi-regionN
ationalE
lectricityM
arket(N
EM
)
Intentionsoffers &
payments
Retailer Z
Retailer 2
Retailer 1
Retail
sector
Intentionsbids &
payments
Tx netw
orkpricing
Tx netw
orkpricing
Netw
orkaccess
End-use
Equipm
ent&
Distributed
resourcesE
lectricity
End-usesector
Contestable
customers
Franchise
customers
Retail
Markets
Em
beddedgenerators

National E
lectricity Market D
esign & P
erformance # 3
© H
. Outhred 2002
Key N
EM
features
•N
EM
covers all participating states:–
A m
ulti-region pool with intra-regional loss factors
–A
ncillary services, spot market &
projections
–A
uctions of inter-regional settlement residues
–O
perated by NE
MM
CO
(owned by states)
•C
ompulsory participants in N
EM
:–
All generators &
dispatchable links > 30 M
W
–N
etwork service providers &
retailers
•C
ontestable consumers m
ay buy from N
EM

National E
lectricity Market D
esign & P
erformance # 4
© H
. Outhred 2002
Region boundaries &
inter-connectors
•R
egions boundaries selected so that:–
Transm
ission constraints are rare within a region
–F
requently-occurring constraints are placed onregion boundaries
•R
egion boundaries to be reset as required:–
Whenever a constraint occurs >
50 hours/year
•U
nregulated inter-connectors are allowed:
–If dispatchable so that it can bid like a generator:
•‘D
irectlink’ the first (operating since July 200):–
180 MW
DC
link between N
SW
& Q
ueensland regions

National E
lectricity Market D
esign & P
erformance # 5
© H
. Outhred 2002
States participating in the
National E
lectricity Market
(NE
M)
• Queensland
• New
South W
ales & A
CT
• Victoria
• South A
ustralia• T
asmania (on connection
to the mainland)
NE
M regions are indicated, and their
boundaries need not be on state borders(e.g. tw
o regions in NS
W)
Queensland w
as expected to have 3 NE
Mregions, but transm
ission augmentation
is removing the associated flow
constraints

National E
lectricity Market D
esign & P
erformance # 6
© H
. Outhred 2002
NS
W, S
nowy, V
ictorian & S
A regions of N
EM
:-transm
ission & sub-transm
ission (NE
MM
CO
, 1999)

National E
lectricity Market D
esign & P
erformance # 7
© H
. Outhred 2002
NE
M M
odel(B
ased on NE
MM
CO
, 1997)
1,500 MW
NS
W
Snow
y
Victoria
1,100 MW
3,000 MW
1,100 MW
Queensland
500 MW
1,000 MW
South A
ust
500 MW 250 M
W
300 MW
Tasm
ania480 M
WB
asslink
thermal
or stabilityflow
limits
Directlink
180 MW
DC
(unregulated)
Murraylink (unregulated D
C)
& possibly S
AN
I (regulated AC
)

National E
lectricity Market D
esign & P
erformance # 8
© H
. Outhred 2002 S
pot market offers &
bids
•G
enerators, retailers & consum
ers:–
Price-quantity curve (sell/buy) for each half hour:•
≤ 10 daily prices, quantities changeable until dispatch
–D
emand forecasts ‘bid in’ at V
OLL
•D
ispatchable links between regions:
–F
low offer curve based on price difference
•B
ids & offers ranked to give dispatch stack:
–C
onsidering loss factors & inter-tie constraints
–5 m
inute prices set by economic dispatch:
•H
alf-hourly averages are calculated in ‘real time’

National E
lectricity Market D
esign & P
erformance # 9
© H
. Outhred 2002
NE
M P
re-dispatch, Dispatch &
AG
C
Bid D
atabase
Instructionsto
participants
Forecast
spot prices
Current
spot price
Pre-dispatch
(half-hourly)
Econom
ic Dispatch
(5 minutes)
NE
MM
CO
data(e.g. operating
constraints)
Day-ahead bids
fromparticipants
Continuous
re-bid quantities from
participants
AG
C(2 second cycle)
SC
AD
A
National E
lectricity Market D
esign & P
erformance # 10
© H
. Outhred 2002
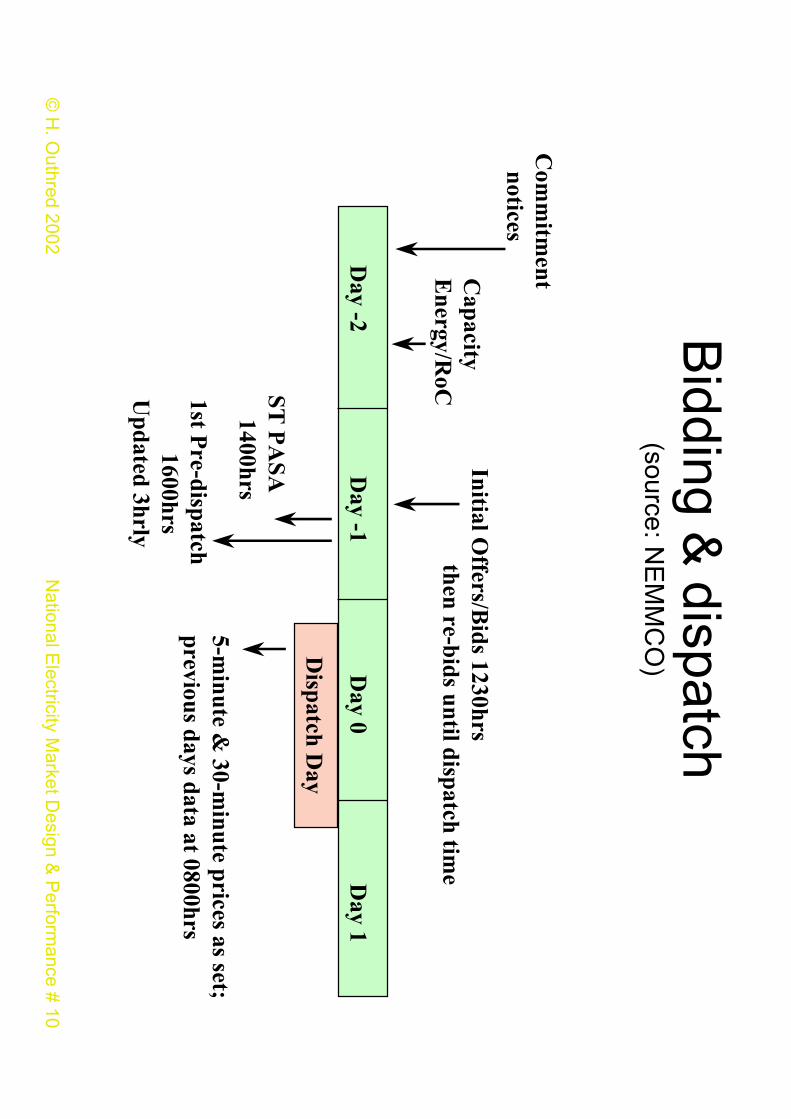
Bidding &
dispatch(source: N
EM
MC
O)
Day -2 D
ay -1 Day 0 D
ay 1
Dispatch D
ay
Com
mitm
ent notices
Initial Offers/B
ids 1230hrsthen re-bids until dispatch tim
e
ST P
ASA
1400hrs
1st Pre-dispatch
1600hrsU
pdated 3hrly
5-minute &
30-minute prices as set;
previous days data at 0800hrs
Capacity
Energy/R
oC

National E
lectricity Market D
esign & P
erformance # 11
© H
. Outhred 2002
Modelling regulated interconnectors
& intra-region location
•R
egulated interconnector between 2 regions
–M
odelled by a linearised marginal loss function:
•A
‘dynamic’ netw
ork loss factor that depends on flow
•F
low lim
its (security or thermal criteria)
•Locational effects w
ithin regions–
Modelled by ‘static’ netw
ork loss factors (LFs)
•A
nnual average of estimated half-hour m
arginal lossesfor each generator node &
group of consumer nodes
–Intra-regional constraints not m
odelled but a‘constrained-on’ generator cannot set price

National E
lectricity Market D
esign & P
erformance # 12
© H
. Outhred 2002
Service territories of N
SW
distributorsshow
ing transmission loss factors
1.0
31.0161
.03
1.0281.001
0.999
0.959
0.970
1.147
Gen
erator-sp
ecific loss facto
rIn
itial un
iform
distrib
uto
r transm
ission
loss facto
r

National E
lectricity Market D
esign & P
erformance # 13
© H
. Outhred 2002
Effect of intra-regional netw
ork lossfactors on spot m
arket outcomes
ReferenceN
ode(price p
r )
Generator
Consum
er
Qg , LF
g
Qc , LF
c
Generator produces Q
g & is paid p
r x LFg x Q
g
Consum
er consumes Q
c & pays p
r x LFc x Q
c
Net incom
e is given to network service provider(s)
Dispatch offer price =
DO
Pg
Referred offer price =
DO
P/LF
g
National E
lectricity Market D
esign & P
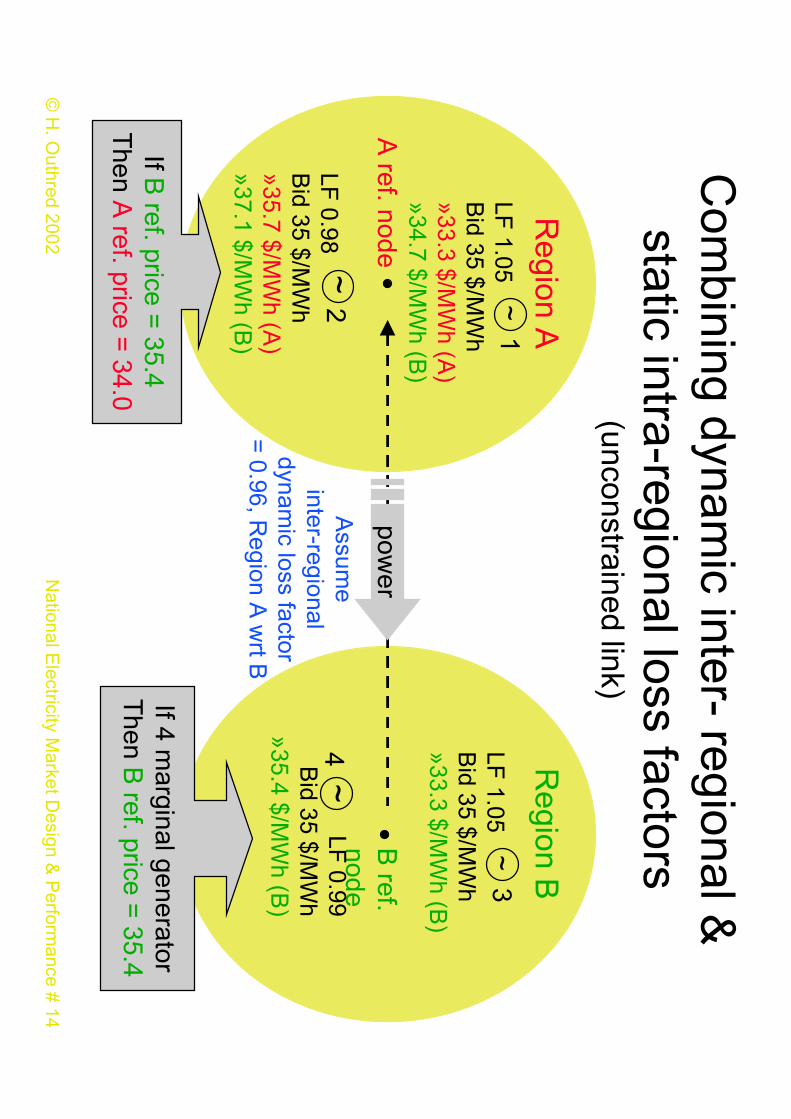
erformance # 14
© H
. Outhred 2002
Com
bining dynamic inter- regional &
static intra-regional loss factors(unconstrained link)
Region A
Region B
A ref. node
B ref.
nodeA
ssume
inter-regionaldynam
ic loss factor=
0.96, Region A
wrt B
power
If 4 marginal generator
Then B
ref. price = 35.4
If B ref. price =
35.4T
hen A ref. price =
34.0
LF 1.05
Bid 35 $/M
Wh
»33.3 $/MW
h (A)
»34.7 $/MW
h (B)
~1
LF 1.05
Bid 35 $/M
Wh
»33.3 $/MW
h (B)
~3
LF 0.98
Bid 35 $/M
Wh
»35.7 $/MW
h (A)
»37.1 $/MW
h (B)
~2
LF 0.99
Bid 35 $/M
Wh
»35.4 $/MW
h (B)
~4

National E
lectricity Market D
esign & P
erformance # 15
© H
. Outhred 2002
Dispatch, P
re-dispatch & P
AS
A
0 day 1 day 2 week 1 m
onth 1 year 1 year 2
Medium
Term
PA
SA
Pre-dispatch, re-bid &
final dispatch schedule
Short Term
PA
SA

National E
lectricity Market D
esign & P
erformance # 16
© H
. Outhred 2002
PA
SA
& reserve trader
PA
SA
•Energy
constraints•D
emand
forecasts•N
etwork
capacity
Registration of
available capacitiesD
ay-ahead O
ffers & bids
Pre-dispatch
thendispatch
Invitation to provide m
ore capacity
Purchase of
more capacity
NE
MM
CO
Expected
inadequacy
Purchased capacity
offered to market
(usually at VO
LL)A
vailablecapacity
Settlem
entsP
ayment for
purchased capacity

National E
lectricity Market D
esign & P
erformance # 17
© H
. Outhred 2002
VO
LL, VoE
G &
market intervention
•R
egional ref. spot price cap at ‘VO
LL’:–
‘value of lost load’, initially $5000/MW
h:•
No single correct num
ber
–A
pplies if load is involuntarily curtailed in a region
–O
ther regional reference prices ≤ VO
LL
•R
egional ref. spot price floor at ‘VoE
G’
–‘value of excess generation’ initially -$1000/M
WH
•C
ap & floor m
ay be reduced after 24 hours:–
If (price x hours)> 300,000 $/M
W then cap/floor
set to ±$300 $/MW
H daytim
e, ±$50 off-peak

National E
lectricity Market D
esign & P
erformance # 18
© H
. Outhred 2002
Financial instrum
ent trading in supportof N
EM
•T
rading in hedges & options:
–B
ilateral trading
–O
ver-the-counter instruments
–E
xchange-traded CF
Ds
•Inter-regional hedges:–
Specialised form
of financial instrument:
•to m
anage regional price difference risks
•funded by interconnector settlem
ent residues
–N
EM
MC
O intercon. settlem
ent residue auctions•
Com
menced in 1999

National E
lectricity Market D
esign & P
erformance # 19
© H
. Outhred 2002
Sydney F
utures Exchange C
FD
s for NS
W&
Victorian regional reference prices
Ba
se lo
ad
ele
ctricity futu
res
(since
Se
pt. 1
99
7)
Pe
ak p
erio
de
lectricity fu
ture
s(sin
ce M
arch
19
99
)U
nd
erlyin
gco
mm
od
ityN
EM
reg
ion
en
erg
yp
er ca
len
da
r mo
nth
Mo
nth
ly en
erg
y,7
am
-10
pm
, WW
Ds
Co
ntra
ct un
it5
00
MW
h5
00
MW
h
Tick size
$2
5$
25
Tra
din
g h
orizo
n13 m
onth
s1
3 m
on
ths
Se
ttlem
en
t price
Ave
rag
e sp
ot p
riceo
ver th
e m
on
thA
vera
ge
spo
t price
,7
am
-10
pm
, WW
Ds

National E
lectricity Market D
esign & P
erformance # 20
© H
. Outhred 2002
Market perform
ance
•S
eparate NS
W &
Victorian m
arkets:–
June 1996 to May 1997
•Interim
National E
lectricity Market (N
EM
1)com
bining NS
W &
Victorian m
arkets:–
May 1997 to D
ecember 1998
•N
ational Electricity M
arket (NE
M)
–F
rom D
ecember 1998

National E
lectricity Market D
esign & P
erformance # 21
© H
. Outhred 2002
Co
mp
arison
of W
eekly Vo
lum
e Weig
hted
Averag
e SM
P
0
10
20
30
40
50
60
70
80
Date
Vic S
MP
NS
W S
MP
Separate N
SW
& V
ictorian markets
Weekly average prices, 6/96 - 2/97
Victoria
NS
W

National E
lectricity Market D
esign & P
erformance # 22
© H
. Outhred 2002 C
omm
ents on outcomes in
separate NS
W &
Vic m
arkets
•Long term
average prices were sim
ilar:–
Average prices both ~
$23/MW
h for 7/96-5/97
•P
rices in Victoria m
ore volatile than in NS
W:
–W
ider variation in underlying operating costs
–Inflexible base load plant:
•V
ictorian pool price was zero on occasions
–V
ictorian market sm
aller than NS
W (~
70%)
–S
umm
er demand m
ore temperature sensitive in
Victoria than in N
SW

National E
lectricity Market D
esign & P
erformance # 23
© H
. Outhred 2002
Victorian price-dem
and relationship
•T
he following graph show
s Victorian
demand &
price data sorted by demand:
–H
alf-hourly data pairs for July 1997 - June 98:•
prices are in $ per MW
h, demand is in M
W
•S
ome correlation betw
een price & dem
and
•E
ffective floor price of ~6 $/M
Wh
•P
rices vary for similar load levels
•P
rices often low but som
etimes high:
–Less excess base load capacity than in N
SW

National E
lectricity Market D
esign & P
erformance # 24
© H
. Outhred 2002
1997/98 Victo
rian L
DC
with
Price
(trun
cated at $200/M
Wh
)
0
10
00
20
00
30
00
40
00
50
00
60
00
70
00
80
00
12
00
14
00
16
00
18
00
11
00
01
12
00
11
40
01
16
00
1
Half hours
MW
0.0
0
20
.00
40
.00
60
.00
80
.00
10
0.0
0
12
0.0
0
14
0.0
0
16
0.0
0
18
0.0
0
20
0.0
0
$/MW
h
De
ma
nd
Price
Floor price for Vic ~$6

National E
lectricity Market D
esign & P
erformance # 25
© H
. Outhred 2002
Daily average prices, 1/97 - 11/97
(NE
M1 joint m
arket comm
enced May ‘97)

National E
lectricity Market D
esign & P
erformance # 26
© H
. Outhred 2002
Daily average prices, 12/97- 11/98
(change in NS
W vesting contracts)

National E
lectricity Market D
esign & P
erformance # 27
© H
. Outhred 2002
Victorian Price D
uration Curves, 94/95 -97/98(truncated at $300 M
Wh)
0.00
50.00
100.00
150.00
200.00
250.00
300.00
% Tim
e value exceeded
$/MWh
94/9595/9696/9797/98

National E
lectricity Market D
esign & P
erformance # 28
© H
. Outhred 2002
Com
ments on N
EM
1
•P
rior to NE
M1:
–P
rices were m
ore volatile in Victoria than in N
SW
•D
uring NE
M1:
–N
SW
& V
ictorian spot prices usually similar
–A
verage spot prices fell•
Additional com
petitive pressures–
even the Victorian m
arket with 5 com
peting base load plantm
ay not have been ‘fully’ competitive
–V
icpool 3 in 1994 still had one-week offers
–N
et flow on inter-connector from
Victoria to N
SW

National E
lectricity Market D
esign & P
erformance # 29
© H
. Outhred 2002
Price history since N
EM
inception(Q
uarterly averages, 12/98-6/02) (NE
CA
, 2002)

National E
lectricity Market D
esign & P
erformance # 30
© H
. Outhred 2002
Price-dem
andplots for N
EM
Queensland &
NS
W regions
Sept-D
ec 2000($/M
WH
vs MW
)(N
EC
A, 2000)

National E
lectricity Market D
esign & P
erformance # 31
© H
. Outhred 2002
Price-dem
andplots for N
EM
Victoria &
SA
regions S
ept-Dec 2000
($/MW
H vs M
W)
(NE
CA
, 2001)

National E
lectricity Market D
esign & P
erformance # 32
© H
. Outhred 2002
BC
A concerns about m
arket power
•B
CA
concerns about EI restructuring:
–Insufficient disaggregation of generation:
•In N
SW
, Queensland &
South A
ustralia
–N
ew interconnectors face too m
uch uncertainty
–N
etwork pricing distorted
–R
egulation cumbersom
e
•H
owever B
CA
recomm
ends improvem
entrather than radical change:–
Market design is basically sound

National E
lectricity Market D
esign & P
erformance # 33
© H
. Outhred 2002
Generator energy m
arket shares (%)
in NS
W &
Victoria, 1997-98 (E
SA
A, 1999)
& possible T
asmania scenario
0 20 40 60 80
12
34
5o
ther
NS
W Victo
ria
Tasm
ania
Theory & experience suggest ≤ 20%
share to avoid market pow
er

National E
lectricity Market D
esign & P
erformance # 34
© H
. Outhred 2002
Reducing generation to raise spot m
arket price(dem
and-side response: forward contract or reduce dem
and)(source: E
risk & B
ardak Group quoted by J W
ashusen, Pareto)
LY
A cap
acityred
uced
in re-
bid
to raise
spo
t price
National E
lectricity Market D
esign & P
erformance # 35
© H
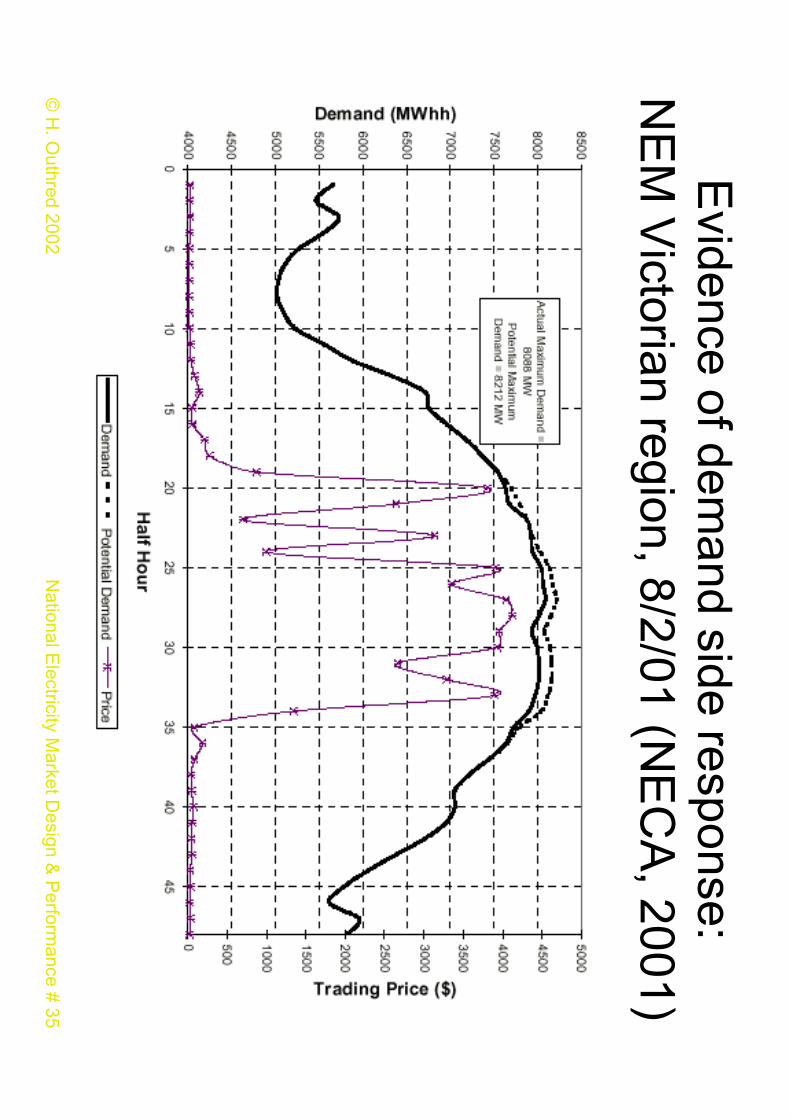
. Outhred 2002
Evidence of dem
and side response:N
EM
Victorian region, 8/2/01 (N
EC
A, 2001)

National E
lectricity Market D
esign & P
erformance # 36
© H
. Outhred 2002 F
uture directions for NE
M
•Im
proved network representation:
–M
ore (smaller) m
arket regions–
More m
arket network service providers
–B
etter locational signals for distributed resources
•Im
proved ancillary service arrangements:
–Increased use of com
petitive tendering &“causer pays”
•Im
proved bidding arrangements
•C
OA
G R
eview