fatigue fracture of neat and short glass fiber …pegorett/resources/papers/31-pegoretti...fatigue...
TRANSCRIPT

Fatigue Fracture of Neat and Short GlassFiber Reinforced Polypropylene: Effect of
Frequency and Material Orientation
ALESSANDRO PEGORETTI1 AND THEONIS RICCO
Department of Materials EngineeringUniversity of Trento
Via Mesiano 7738050 Trento, Italy
(Received November 12, 1998)(Revised July 14, 1999)
ABSTRACT: The influence of glass fibers content and testing conditions (frequency andmean load) on the fatigue crack propagation rate in injection molded neat and fiber rein-forced polypropylene has been investigated. The resistance to fatigue crack propagation in-creases as the fiber volume fraction increases. The fatigue resistance of either neat and fiberreinforced polypropylene is tremendously dependent on the crack propagation direction,with higher values for crack propagating transversely to the melt flow direction in themolded plaques. A dramatic increase of the crack growth rate per cycle by decreasing fre-quency, at any given crack length was found for all the materials investigated. Analysis ofdata obtained at various frequencies and applied mean loads suggests that crack propaga-tion is determined mostly by viscoelastic creep processes at the crack tip, the role of purefatigue appearing quite secondary.
KEY WORDS: mechanical properties, fatigue, short-fiber composites, glass fibers, poly-propylene matrix.
INTRODUCTION
ISOTACTIC POLYPROPYLENE (PP) REPRESENTS one of the most interestinglarge-volume thermoplastics with wide application in the automotive [1], appli-
ances, and house-hold fields. PP is characterized by many interesting propertiessuch as low density, relative high thermal stability, good processability and resis-tance to degradation. When proper fillers and/or reinforcements are incorporated
1Author to whom correspondence should be addressed.
1009Journal of COMPOSITE MATERIALS, Vol. 34, No. 12/2000
1530-793X/00/12 1009–19 $10.00/0 DOI: 10.1106/KF4C-438N-JFHB-H3EB© 2000 Technomic Publishing Co., Inc.

into PP, stiffness, strength and damage tolerance can be enhanced to fulfill the gapbetween commodities and engineering thermoplastics [2].
The strong focus on load-bearing industrial applications leads to a particular at-tention toward the fracture behavior of injection molded neat and filled PP compo-nents. In particular, the fatigue properties are of paramount importance for manyintended applications where components are subjected to load and environmentalhistories which vary in time over the period of service [2–10]. Fatigue damage isassociated with the initiation and propagation of cracks in the matrix and/or the de-struction of the bonding at the fiber/matrix interface. Final failure of PP and itsshort-fiber reinforced (SFR) composites under alternating loadings, mainly oc-curs by fatigue crack propagation (FCP) [2,5,6,10] characterized by a stable crackacceleration range which can be reasonably well described by the Paris-Erdoganrelationship [11]:
(1)
where da/dN is the crack growth per each cycle, A and n are constants and ∆K is thestress intensity amplitude at the crack tip under mode I (opening mode). In general,the most important testing variables affecting the FCP rate are frequency and waveform of the alternating load, temperature, environment, stress ratio and mean load[5]. Moreover material variables such as molecular weight, crystallinity, fibercontent and orientation also play a major role in determining the FCP behavior [2].
In processing operations, such as extrusion or injection molding, the hydrody-namic force field generated by the flow always produces some degree of orienta-tion depending on the tool design [12]. Such orientation phenomena are responsi-ble for anisotropic mechanical properties due to macromolecules partialalignment and/or, in the case of SFR composites, due to fiber preferred orienta-tion. The effect of fiber partial alignment on the FCP behavior of SFR compositeshas been examined by a number of authors on several kinds of thermoplastic matri-ces such as polypropylene [2,5], polyamide [13–19], polyethylene [20],polyetheretherketone [21,22], polybutylenterephthalate [23], polyethersulphone[24], and polytetrafluoroethylene [25]. In all cases the FCP resistance results to beenhanced by the presence of fibers, particularly when they are preferentiallyaligned transversely to the crack growth direction.
The aim of the present paper is to investigate the effect of fiber volume fraction,fiber orientation, mean load and test frequency on the FCP rate in polypropyleneshort glass fiber reinforced composites.
EXPERIMENTAL
Unfilled PP (Moplen 7073 XOP) and its short glass fiber composites reinforcedwith 10, 20, and 30 weight % (i.e., 3.9, 8.3, and 13.5 volume %) were supplied by
1010 ALESSANDRO PEGORETTI AND THEONIS RICCO
ndaA K
dN∆=

Montell Polyolefins S.p.A. (Ferrara, Italy) in the form of injection molded squareplaques (see Figure 1) with L = 127 mm and B = 2.5 mm. The fiber volume frac-tions (Vf) were evaluated for each composite from the matrix and fiber weight frac-tions (Wf) assuming the densities of glass fibers and matrix of 2.50 and 0.91 kgm–3, respectively. All plaques were obtained using a Negri-Bossi NB90 injec-tion-molding machine under the following conditions:
• melt temperature = 285°C• injection pressure = 4.5 MPa• holding pressure = 4.5 MPa• mold filling time = 12.5 s
• holding time = 30 s • cooling time = 60 s
The short E-glass fibers (Owens Corning R34B), with an average initial lengthof 4.5 mm and a diameter, d, of 14 µm, were treated with a polypropylene compati-ble coating (Hercoprime HG 201). After compounding and injection molding, themanufacturer evaluated an average fiber length, l, in the molded plaques of about400 µm, i.e., an average fiber aspect ratio, l/d, of about 30.
A differential scanning calorimeter Mettler DSC 30 was used to detect the melt-ing temperature, Tm, and the crystallinity content, Xc, of the matrix by integratingthe normalized area of the endothermal peak and rating the heat involved to the ref-
Fatigue Fracture of Reinforced Polypropylene 1011
Figure 1. Geometry of the injection molded plaques, and positions of L and T-samples ma-chined from them. MFD indicates the mold filling direction.
erence value of the 100% crystalline polymer (210 J/g) [26]. The conditions forDSC measurements were as follows: specimen weight: about 20 mg; temperatureinterval: 0 to 230°C; heating rate: 10°C/min; nitrogen flux: 100 ml/min.
Monotonic uniaxial tensile tests were performed on rectangular unnotchedspecimens of 10 × 120 × 2.5 mm3 with an Instron 4502 tensile tester equipped witha 10 kN load cell by using a strain gauge extensometer (Instron, model 2620). Allmeasurements were performed at room temperature, at a cross-head speed of 10mm min–1 on at least 5 specimens. Samples were machined both longitudinally(L-samples) and transversely (T-samples) with respect to the mold-fill direction,as depicted in Figure 1.
Toughness measurements were performed following the procedure indicated inthe ASTM standard D 5045 [27]. Single-edge notch bending (SENB) specimenswere obtained along longitudinal (L-samples) or transverse (T-samples) direction,as depicted in Figure 1. The specimen dimensions were 8 × 60 × 2.5 mm3, the spanwas 32 mm and the initial notch length was 4 mm. The specimens were loaded byusing an Instron 4502 machine at a cross-head speed of 10 mm min–1 (low speedtest, nominal strain rate of 0.008 s–1). Fracture toughness measurements at higherspeed were performed on the same type of specimens by using an instrumentedCharpy pendulum (CEAST S.p.A., Torino, Italy) with an impact speed of 0.925 ms–1 (high speed test, nominal strain rate of 43.4 s–1). Due to the specimens’ thin-ness, the size requirements for the KIC determination were not completely satis-fied. The guideline regarding the linearity recommendation was satisfied in allcases except for the pure PP matrix. In both cases (low or high speed), apparentfracture toughness, values were calculated using the following formula [27]:
(2)
where
(3)
Fc is the maximum load measured either in the low or high speed tests, B is thespecimen thickness, W is the specimen width, and x = a/W where a is the initialcrack length.
Fatigue crack propagation experiments were carried out on single-edge notchtension (SENT) L and T samples whose positions in the original injectionmolded square plaques are reported in Figure 1. The specimens’ dimensionswere chosen in accordance to the ISO/TC 61/SC 2/WG 7 N5 recommendations,
1012 ALESSANDRO PEGORETTI AND THEONIS RICCO
*,cK
1/ 2* cc
F aK f
BW WÊ ˆ= Á ˜Ë ¯
2
1/ 2
3/ 2
1.99 1 2.15 3.93 2.7
6
1 2 1
a a a a
W W W Wa af
W W a a
W W
È ˘È ˘È ˘Ê ˆ Ê ˆ Ê ˆ Ê ˆÍ ˙- - - +Í ˙Á ˜ Á ˜ Á ˜ Á ˜Í ˙Ë ¯ Ë ¯ Ë ¯ Ë ¯Í ˙Î ˚ Í ˙Ê ˆ Ê ˆ Î ˚Î ˚=Á ˜ Á ˜Ë ¯ Ë ¯ È ˘ È ˘Ê ˆ Ê ˆ+ -Á ˜ Á ˜Í ˙ Í ˙Ë ¯ Ë ¯Î ˚ Î ˚
i.e., B = 2.5 mm, W = 27 mm, Lt = 140 mm, and L0 = 60 mm. An initial crack oflength a0 = 3 mm was made by means of a razor blade. All the fatigue tests wereperformed with a closed loop servohydraulic MTS 858 Mini Bionix testing ma-chine, at room temperature, under tension-tension sinusoidal load control. The cy-clic frequencies were 0.1, 1, and 10 Hz, the mean load was 1200 N with a minimumto maximum load ratio of 0.4, except for the experiments where the effects of themean load was examined. Using a video camera, a video-recorder, and an imageanalyzer system, the crack length, a, was monitored as a function of the number ofcycles, N, without test interruption. For each experimental situation, at least threeseparate specimens were tested and an average crack propagation rate was ob-tained as the derivative of the best fitting polynomial curve. The stress intensityfactor, K, at the crack tip was evaluated on the basis of the linear elastic fracturemechanics approach which is often used to also describe fracture and fatigue be-havior of nonlinear elastic and heterogeneous materials [3]. The specific equationfor the stress intensity factor amplitude, ∆K, for SENT specimens is [28]:
(4)
where
(5)
∆P is the difference between the maximum and the minimum applied load, B is thethickness, and W the width of the specimens.
RESULTS AND DISCUSSION
Material Properties
As indicated by the DSC measurements reported in Table 1, the presence of fi-bers does not significantly affect the crystallinity content of the materials, whilethe melting temperature is slightly higher for the pure PP matrix with respect to thecomposites.
Fatigue Fracture of Reinforced Polypropylene 1013
Table 1. Melting temperature, Tm, and crystallinity content, Xc, asmeasured by DSC.
Material Tm (°C) Xc (wt%)
PP matrix 171 43PP + 3.9 vol% glass fibers 166 42PP + 8.3 vol% glass fibers 166 43PP + 13.5 vol% glass fibers 167 45
P aK aY
BW W
∆∆ Ê ˆ= Á ˜Ë ¯
2 3 4
1.99 0.41 18.7 38.48 53.85a a a a a
YW W W W W
È ˘Ê ˆ Ê ˆ Ê ˆ Ê ˆ= - + - +Í ˙Á ˜ Á ˜ Á ˜ Á ˜Ë ¯ Ë ¯ Ë ¯ Ë ¯Í ˙Î ˚

The results of static tensile tests performed on samples obtained both longitudi-nally (L-samples) and transversely (T-samples) to the mold fill direction are re-ported in Table 2. From the tensile modulus and yield strength values it comes outthat the mechanical response is clearly anisotropic with higher values along thelongitudinal direction, especially for fiber volume fractions higher than 3.9 vol%.In Figure 2 it is interesting to compare the experimental tensile modulus valueswith the theoretical previsions based on the empirical equation for the modulus,ER, of a composite containing fibers randomly oriented in a plane [29]:
(6)
where ELL and ETT are respectively the longitudinal and transverse tensile modulifor a unidirectionally aligned short fiber composite having the same fiber aspectratio and fiber volume fraction as the composite under consideration. Moduli ELL
and ETT can be estimated by the well-known Halpin-Tsai micromechanics equa-tions [30], i.e.:
where Em is the matrix modulus, Vf is the fiber volume fraction, and:
From Figure 2 it can be clearly observed that the measured values of the elasticmodulus deviate from the theoretical prediction for composites with a random fi-ber distribution. In particular L-samples have a higher elastic modulus which indi-cates a longitudinal preferred fiber orientation, while T-samples display a lower
1014 ALESSANDRO PEGORETTI AND THEONIS RICCO
Table 2. Elastic moduli, E, and yield strength, σy, as measured intensile tests. Subscripts L and T refer to longitudinal and
transversal direction, respectively (see Figure 1).
Material EL (GPa)ET
(GPa) �yL (MPa) �yT (MPa)
PP matrix 2.2 2.2 34.2 33.1PP + 3.9 vol% glass fibers 3.0 2.8 51.3 40.2PP + 8.3 vol% glass fibers 4.1 3.7 56.8* 47.6*PP + 13.5 vol% glass fibers 5.6 4.4 63.1* 52.2*
*Taken as the maximum stress.
3 5
8 8R LL TTE E E= +
ζ ζη ηη η
+ += =
- -1 1
;1 1
L L f T T fLL m TT m
L f T f
V VE E E E
V V
1 11
2 , 2; ;
f f
m mL T L T
f fL T
m m
E E
E EE Ed
E E
ζ ζζ ζ
η η- -
= = = =+ +
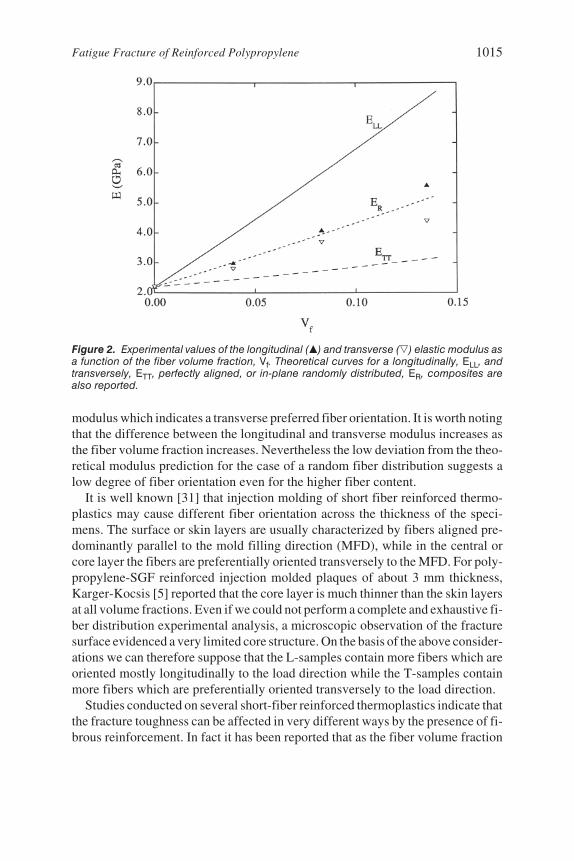
modulus which indicates a transverse preferred fiber orientation. It is worth notingthat the difference between the longitudinal and transverse modulus increases asthe fiber volume fraction increases. Nevertheless the low deviation from the theo-retical modulus prediction for the case of a random fiber distribution suggests alow degree of fiber orientation even for the higher fiber content.
It is well known [31] that injection molding of short fiber reinforced thermo-plastics may cause different fiber orientation across the thickness of the speci-mens. The surface or skin layers are usually characterized by fibers aligned pre-dominantly parallel to the mold filling direction (MFD), while in the central orcore layer the fibers are preferentially oriented transversely to the MFD. For poly-propylene-SGF reinforced injection molded plaques of about 3 mm thickness,Karger-Kocsis [5] reported that the core layer is much thinner than the skin layersat all volume fractions. Even if we could not perform a complete and exhaustive fi-ber distribution experimental analysis, a microscopic observation of the fracturesurface evidenced a very limited core structure. On the basis of the above consider-ations we can therefore suppose that the L-samples contain more fibers which areoriented mostly longitudinally to the load direction while the T-samples containmore fibers which are preferentially oriented transversely to the load direction.
Studies conducted on several short-fiber reinforced thermoplastics indicate thatthe fracture toughness can be affected in very different ways by the presence of fi-brous reinforcement. In fact it has been reported that as the fiber volume fraction
Fatigue Fracture of Reinforced Polypropylene 1015
Figure 2. Experimental values of the longitudinal (�) and transverse (�) elastic modulus asa function of the fiber volume fraction, Vf. Theoretical curves for a longitudinally, ELL, andtransversely, ETT, perfectly aligned, or in-plane randomly distributed, ER, composites arealso reported.

increases the fracture toughness can either increase, like in the case of SGF rein-forced PES [24], or remain constant, as for SGF reinforced PEEK [21], or even de-crease, like for SGF reinforced PTFE [25]. Results of the fracture toughness mea-surements are reported in Figure 3 for the materials under investigation. It can benoticed that the addition of fibers enhances the apparent fracture toughness, athigher values for the L-samples where the fibers are preferentially aligned trans-versely to the crack propagation direction. In other words in T-samples, where thefibers are mostly aligned along the crack propagation direction, fracture propa-gates at lower values. Moreover the apparent fracture toughness values ob-tained at high testing speed are systemically lower than those obtained at lowerspeed. A similar rate effect has been reported [32] for PP homopolymers filledwith glass flake.
Fatigue Crack Propagation (FCP)
A characteristic curve of the crack growth, ∆a, vs. the number of fatigue cycles,N is reported in Figure 4(a), while in Figure 4(b) the corresponding curve of thecrack propagation rate, da/dN, vs. the stress intensity factor amplitude, ∆K, can beobserved. In the first stage of the fatigue test the FCP rate decreases as already ob-served in previous works [2,5,10] for both neat and short glass fiber reinforced
1016 ALESSANDRO PEGORETTI AND THEONIS RICCO
*cK
*cK
Figure 3. Apparent fracture toughness, values as a function of the fiber volume fraction,Vf, as determined in low and high speed tests. Symbols as follows: (�) L direction, low speedtest; (�) T direction, low speed test; (�) L direction, high speed test and (�) T direction, highspeed test.
*cK ,
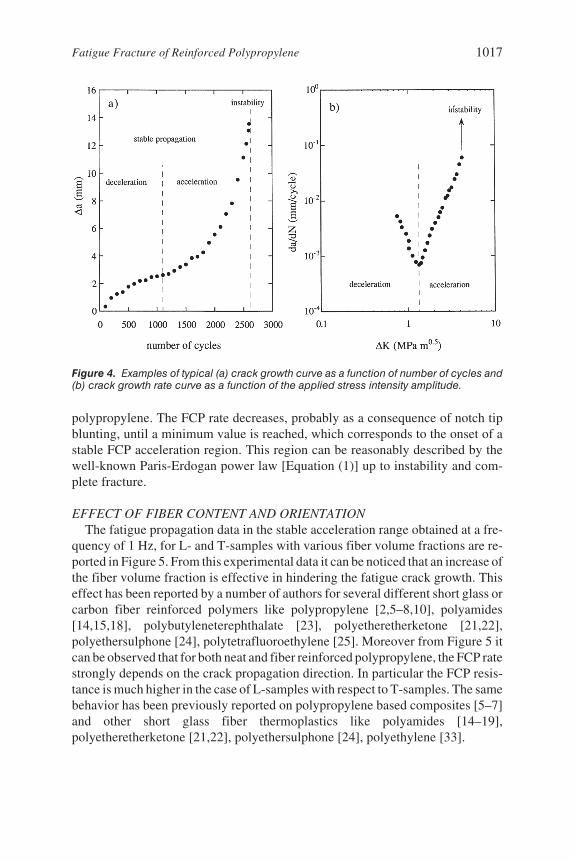
polypropylene. The FCP rate decreases, probably as a consequence of notch tipblunting, until a minimum value is reached, which corresponds to the onset of astable FCP acceleration region. This region can be reasonably described by thewell-known Paris-Erdogan power law [Equation (1)] up to instability and com-plete fracture.
EFFECT OF FIBER CONTENT AND ORIENTATIONThe fatigue propagation data in the stable acceleration range obtained at a fre-
quency of 1 Hz, for L- and T-samples with various fiber volume fractions are re-ported in Figure 5. From this experimental data it can be noticed that an increase ofthe fiber volume fraction is effective in hindering the fatigue crack growth. Thiseffect has been reported by a number of authors for several different short glass orcarbon fiber reinforced polymers like polypropylene [2,5–8,10], polyamides[14,15,18], polybutyleneterephthalate [23], polyetheretherketone [21,22],polyethersulphone [24], polytetrafluoroethylene [25]. Moreover from Figure 5 itcan be observed that for both neat and fiber reinforced polypropylene, the FCP ratestrongly depends on the crack propagation direction. In particular the FCP resis-tance is much higher in the case of L-samples with respect to T-samples. The samebehavior has been previously reported on polypropylene based composites [5–7]and other short glass fiber thermoplastics like polyamides [14–19],polyetheretherketone [21,22], polyethersulphone [24], polyethylene [33].
Fatigue Fracture of Reinforced Polypropylene 1017
Figure 4. Examples of typical (a) crack growth curve as a function of number of cycles and(b) crack growth rate curve as a function of the applied stress intensity amplitude.

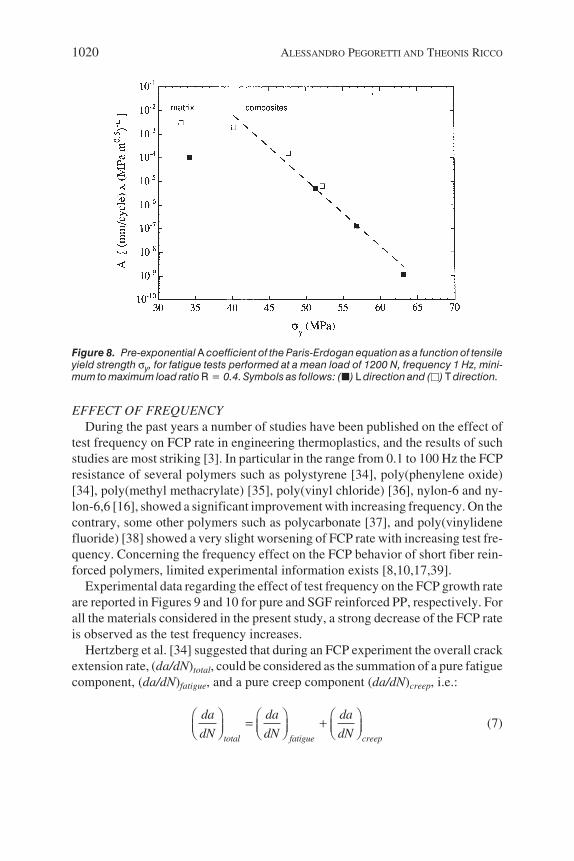
For all the materials under investigation, the values of the constant A which ap-pears in Equation (1), measured on both L- and T-samples, are reported in Figures6, 7 and 8 as a function of the fiber volume fraction, low-rate apparent fracturetoughness, and yield strength, respectively. Figure 6 clearly shows that as the fibervolume fraction increases the pre-exponential factor A decreases, thus confirmingthe observations reported by Karger-Kocsis for similar materials [5]. Moreoverthe FCP behavior of the L-samples is characterized by lower values of A than thecorresponding T-samples. Similar observations hold for Figure 7 which showshow coefficient A is decreasing as the fracture toughness increases. It is worth not-ing that the markedly different FCP behavior between L- and T-samples cannot beexplained only on the basis on their apparent fracture toughness values. In otherwords, samples with similar fracture toughness exhibit strongly different FCPrates for a given ∆K. From Figure 8 it is evident that for the composite under inves-tigation the pre-exponential factor A linearly decreases as the tensile yield strengthincreases. From the above considerations it seems reasonable to hypothesize thatthe fatigue crack propagation in SGF reinforced PP involves deformation mecha-nisms responsible for the yielding processes at the crack tip. The data reported inFigure 8 are further indicating that the FCP process in pure PP matrix is character-ized by A values lower that those attainable by linearly extrapolating the data of thecomposites, thus suggesting different fracture mechanisms.
1018 ALESSANDRO PEGORETTI AND THEONIS RICCO
Figure 5. da/dN vs ∆K plots, in a double logarithmic scale, obtained at a mean load of 1200N, frequency 1 Hz, minimum to maximum load ratio R = 0.4. Symbols as follows: (�) L direc-tion, Vf = 0 vol%; (�) L direction, Vf = 3.9 vol%; (�) L direction, Vf = 8.3 vol%; (�) L direc-tion, Vf = 13.5 vol%; (�) L direction, Vf = 0 vol%; (�) L direction, Vf = 3.9 vol%; () T direc-tion, Vf = 8.3 vol%; (�) T direction, Vf = 13.5 vol%.

Fatigue Fracture of Reinforced Polypropylene 1019
Figure 7. Pre-exponential A coefficient of the Paris-Erdogan equation as a function oflow-rate apparent fracture toughness, for fatigue tests performed at a mean load of 1200N, frequency 1 Hz, minimum to maximum load ratio R = 0.4. Symbols as follows: (�) L direc-tion and (�) T direction.
Figure 6. Pre-exponential A coefficient of the Paris-Erdogan equation as a function of the fi-ber volume fraction for tests performed at a mean load of 1200 N, frequency 1 Hz, minimum tomaximum load ratio R = 0.4. Symbols as follows: (�) L direction and (�) T direction.
c*K ,
EFFECT OF FREQUENCYDuring the past years a number of studies have been published on the effect of
test frequency on FCP rate in engineering thermoplastics, and the results of suchstudies are most striking [3]. In particular in the range from 0.1 to 100 Hz the FCPresistance of several polymers such as polystyrene [34], poly(phenylene oxide)[34], poly(methyl methacrylate) [35], poly(vinyl chloride) [36], nylon-6 and ny-lon-6,6 [16], showed a significant improvement with increasing frequency. On thecontrary, some other polymers such as polycarbonate [37], and poly(vinylidenefluoride) [38] showed a very slight worsening of FCP rate with increasing test fre-quency. Concerning the frequency effect on the FCP behavior of short fiber rein-forced polymers, limited experimental information exists [8,10,17,39].
Experimental data regarding the effect of test frequency on the FCP growth rateare reported in Figures 9 and 10 for pure and SGF reinforced PP, respectively. Forall the materials considered in the present study, a strong decrease of the FCP rateis observed as the test frequency increases.
Hertzberg et al. [34] suggested that during an FCP experiment the overall crackextension rate, (da/dN)total, could be considered as the summation of a pure fatiguecomponent, (da/dN)fatigue, and a pure creep component (da/dN)creep, i.e.:
(7)
1020 ALESSANDRO PEGORETTI AND THEONIS RICCO
Figure 8. Pre-exponential A coefficient of the Paris-Erdogan equation as a function of tensileyield strength σy, for fatigue tests performed at a mean load of 1200 N, frequency 1 Hz, mini-mum to maximum load ratio R = 0.4. Symbols as follows: (�) L direction and (�) T direction.
total fatigue creep
da da da
dN dN dNÊ ˆ Ê ˆ Ê ˆ= +Á ˜ Á ˜ Á ˜Ë ¯ Ë ¯ Ë ¯

Fatigue Fracture of Reinforced Polypropylene 1021
Figure 9. da/dN vs. ∆K curves for the pure PP matrix tested at a mean load of 1200 N, mini-mum to maximum load ratio R = 0.4. Symbols as follows: (�) L direction, frequency = 1 Hz;(�) L direction, frequency = 0.1 Hz; () T direction, frequency = 1 Hz; and (�) T directionfrequency = 0.1 Hz.
Figure 10. da/dN vs. ∆K curves for T-samples of composites tested at a mean load of 1200 N,minimum to maximum load ratio R = 0.4. Symbols as follows: (�) frequency = 0.1 Hz; (�)frequency = 1 Hz; and () frequency = 10 Hz.

More recently, Wyzgoski and Novak [16] proposed to rearrange Equation (7) asfollows:
(8)
where dt/dN is the time period, P, of the cyclic oscillation, which is also equal tothe inverse of the frequency (P = 1/ν). This dependence is illustrated in Figure 11,where the crack growth rate per cycle at a fixed level of ∆K is expressed as a func-tion of the time period for various T-samples. According to Equation (7), the inter-cept of the linear regression represents the crack growth rate contribution due totrue fatigue while the slope represents a crack speed due to the contribution of theviscoelastic creep. This procedure can be repeated in order to obtain the creepcomponent of the crack speed at various ∆K values. ∆K is related to the mean ap-plied stress intensity factor, Kmean, through the following relationship:
(9)
1022 ALESSANDRO PEGORETTI AND THEONIS RICCO
Figure 11. FCP rate for T-samples evaluated at a constant ∆K value of 5.5 MPa m0.5 vs. the fa-tigue time period (1/ν) for materials with (�) 0 vol%, (�) 3.9 vol%, () 8.3 vol%, (�) 13.5 vol%of short glass fibers.
total fatigue creep
da da da dt
dN dN dt dNÊ ˆ Ê ˆ Ê ˆ= +Á ˜ Á ˜ Á ˜Ë ¯ Ë ¯ Ë ¯
1
2(1 )meanR
K KR
∆+
=-

where R is the minimum to maximum load ratio. As reported in Figure 12(a), it ispossible to represent the Log (da/dt)creep component as a function of Log (Kmean)with a linear relationship for all the materials examined. In other words the creepcomponent can be reasonably well represented by a Paris-like equation [40] in theform:
(10)
which is usually employed for describing crack growth speed under static loads.For sake of comparison, in Figure 12(b) are reported the experimental (da/dt)total
values obtained at the test frequency of 0.1 Hz as a function of the Kmean. By com-paring Figures 12(a) and 12(b) it clearly comes out that, at least at the lowest fre-quency of 0.1 Hz, most of the crack growth can be attributed to a creep process. Asit can be observed from Figure 11 and previously reported in Reference [10], thecreep component during the FCP process in a cycle is less and less important as thefiber volume fraction and the test frequency increase. Moreover it is worth point-ing out that, as the authors observed in a previous work [10], hysteric heating at thecrack tip may occur, particularly at high frequency and low fiber volume fraction.For these cases it is consequently reasonable to hypothesize a crack propagationunder non-isothermal conditions.
Fatigue Fracture of Reinforced Polypropylene 1023
Figure 12. (a) Creep component, (da/dt)creep and (b) experimental total value at a test fre-quency of 0.1 Hz, (da/dt)total, of the crack speed as a function of the mean applied stress in-tensity factor, Kmean for materials with (�) 0 vol%, (�) 3.9 vol%, () 8.3 vol% and (�) 13.5vol% of short glass fibers.
mmean
daBK
dt=

EFFECT OF MEAN LOADEven if a number of studies have been conducted to evaluate the effect of mean
stress on the FCP rate in unfilled polymers, the results are quite controversial [3].Some polymers like poly(methyl methacrylate), poly(vinyl chloride), polysty-rene, poly(vinylidene fluoride), epoxy, nylon-66, exhibit an increase in crackgrowth at fixed ∆K level with increasing the mean load, while other polymers likepolycarbonate, ABS, polysulphone, poly(phenylene oxide)/high-impact-polysty-rene, low density polyethylene, exhibit lower growth rates as the mean load is in-creased. Moreover no data are currently available on the effects of the mean stresslevel on the FCP behavior of SGF reinforced PP.
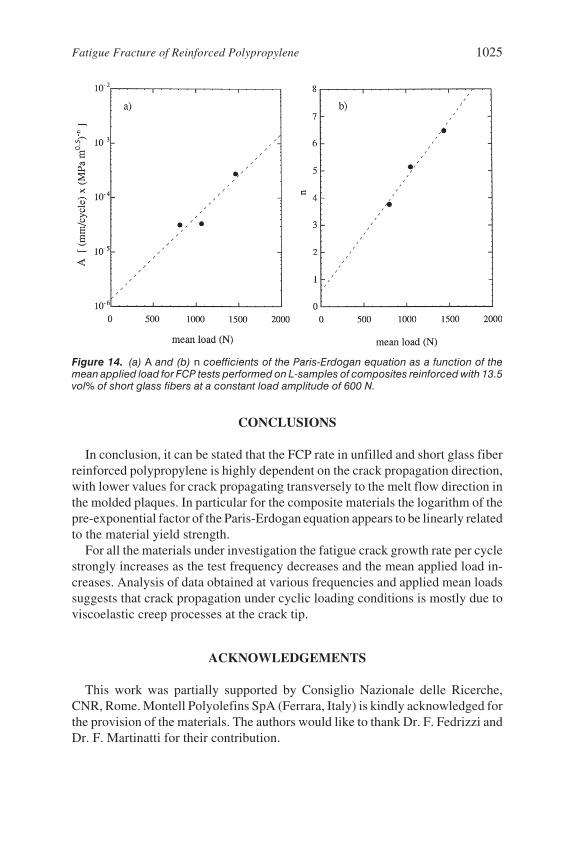
The effect of the applied mean load on the FCP behavior at 1 Hz was investi-gated on L-samples of composites reinforced with 13.5 vol% of SGF, the load am-plitude being constant (600 N). As reported in Figure 13, as the mean load (andconsequently R) decreases the FCP curves shift toward lower ∆K values, or inother words the crack growth rate at a fixed ∆K is reduced. This effect can be fur-ther analyzed by looking at the pre-exponential factor, A, and the slope, n, of theParis-Erdogan equation, as a function of the mean applied load (see Figure 14).Extrapolation to zero mean load gives an estimation of the FCP behavior underpure fatigue condition. In our case the linear extrapolation leads to estimate A =1.37*10–6 [(mm/cycle) × (MPa m0.5)n] and n = 0.6.
1024 ALESSANDRO PEGORETTI AND THEONIS RICCO
Figure 13. da/dN vs. ∆K curves for L-samples of composites reinforced with 13.5 vol% ofshort glass fibers during FCP tests at a constant load amplitude of 600 N. Symbols as follows:(�) mean load = 800 N (R = 0.46); (�) mean load = 1050 N (R = 0.56); and (�) meanload = 1440 N (R = 0.66).
CONCLUSIONS
In conclusion, it can be stated that the FCP rate in unfilled and short glass fiberreinforced polypropylene is highly dependent on the crack propagation direction,with lower values for crack propagating transversely to the melt flow direction inthe molded plaques. In particular for the composite materials the logarithm of thepre-exponential factor of the Paris-Erdogan equation appears to be linearly relatedto the material yield strength.
For all the materials under investigation the fatigue crack growth rate per cyclestrongly increases as the test frequency decreases and the mean applied load in-creases. Analysis of data obtained at various frequencies and applied mean loadssuggests that crack propagation under cyclic loading conditions is mostly due toviscoelastic creep processes at the crack tip.
ACKNOWLEDGEMENTS
This work was partially supported by Consiglio Nazionale delle Ricerche,CNR, Rome. Montell Polyolefins SpA (Ferrara, Italy) is kindly acknowledged forthe provision of the materials. The authors would like to thank Dr. F. Fedrizzi andDr. F. Martinatti for their contribution.
Fatigue Fracture of Reinforced Polypropylene 1025
Figure 14. (a) A and (b) n coefficients of the Paris-Erdogan equation as a function of themean applied load for FCP tests performed on L-samples of composites reinforced with 13.5vol% of short glass fibers at a constant load amplitude of 600 N.
REFERENCES
1. Dufton, P. 1992. “Use of PP in the automotive industry,” in Proceedings of Polypropylene in Au-tomotive Industry Conference, The Patrick Collection, Birmingham, UK, pp. 1–12.
2. Karger-Kocsis, J. 1995. “Microstructural aspects of fracture in polypropylene and its filled,chopped fiber and fiber mat reinforced composites,” in J. Karger-Kocsis (ed.), PolypropyleneStructure, Blends and Composites. Volume 3 Composites, London: Chapman & Hall, pp.142–201.
3. Hertzberg, R.W. and J.A. Manson. 1980. Fatigue of Engineering Plastics, New York: AcademicPress.
4. Karger-Kocsis, J. and K. Friedrich. 1989. “Effect of skin-core morphology on fatigue crack prop-agation in injection moulded polypropylene homopolymer,” Int. J. Fracture, 11: 161–168.
5. Karger-Kocsis, J., K. Friedrich and R.S. Bailey. 1991. “Fatigue crack propagation in short andlong glass fiber reinforced injection-molded polypropylene composites,” Adv. Composite Mate-rials, 1: 103–121.
6. Karger-Kocsis, J. 1991. “Microstructural aspects of the fatigue crack growth in polypropyleneand its chopped glass fiber reinforced composites,” J. Polymer Engineering, 10: 97–121.
7. Karger-Kocsis, J. 1991. “Structure and fracture mechanics of injection-molded composites,” inS.M. Lee (ed.) International Encyclopedia of Composites, vol. 5, New York: VCII Publ., pp.337–356.
8. Fedrizzi, F., F. Martinatti and T. Ricco. 1995. “Fatigue fracture of polypropylene/glass fibrecomposites,” in 3rd International Conference on Deformation and Fracture of Composites, Uni-versity of Surrey, Guildford, UK, pp. 362–367.
9. Ferreira, J.A.M., J.D.M. Costa and M.O.W. Richardson. 1997. “Effect of notch and test condi-tions on the fatigue of a glass-fibre-reinforced polypropylene composite,” Composites Science &Technology, 57: 1243–1248.
10. Pegoretti, A. and T. Ricco. 1999. “Fatigue crack propagation in polypropylene reinforced withshort glass fibres,” Composites Science & Technology, 59: 1055–1062.
11. Paris, P.C. and F. Erdogan. 1963. “A critical analysis of crack propagation laws,” J. Basic Eng.Trans., 85: 528–537.
12. Goettler, L.A. 1986. “The effects of processing variables on the mechanical properties of rein-forced thermoplastics,” in D.W. Clegg and A.A. Collyer (eds.) Mechanical Properties of Rein-forced Thermoplastics, London: Elsevier Applied Science Publishers, pp. 151–204.
13. Lang, R.W., J.A. Manson and R.W. Hertzberg. 1987. “Mechanisms of fatigue fracture in shortglass fibre-reinforced polymers,” J. Mater. Science, 22: 4015–4030.
14. Karger-Kocsis, J. and K. Friedrich. 1988. “Fatigue crack propagation in short and long fibre-rein-forced injection-moulded PA 66 composites,” Composites, 19: 105–114.
15. Martin, D.C., G.E. Novak and M.G. Wyzgoski. 1989. “Fatigue fracture of reaction injectionmolded (RIM) nylon composites,” J. Applied Polymer Science, 37: 3029–3056.
16. Wyzgoski, M.G., G.E. Novak and D.L. Simon. 1990. “Fatigue fracture of nylon polymers. Part 1Effect of frequency,” J. Mater. Science, 25: 4501–4510.
17. Wyzgoski, M.G. and G.E. Novak. 1991. “Fatigue fracture of nylon polymers. Part 2 Effect ofglass-fibre reinforcement,” J. Mater. Science, 26: 6314–6324.
18. Karger-Kocsis, J. 1990. “Effects of processing induced microstructure on the fatigue crack prop-agation of unfilled and short fibre-reinforced PA-6,” Composites, 21: 243–254.
19. Wyzgoski, M.G. and G.E. Novak. 1994. “Direct measurement of strain energy release rates dur-ing fatigue fracture of reinforced nylon 66,” International Conference Yield, Deformation andFracture, Cambridge, UK, pp. 39/1–39/4.
20. Darlington, M.W. 1991. “Short fibre reinforced thermoplastics: properties and design, in A.H.Cardon and G. Verchery (eds.) Durability of Polymer Based Composite Systems for StructuralApplications, London: Elsevier Science Publisher, pp. 80–98.
1026 ALESSANDRO PEGORETTI AND THEONIS RICCO

21. Friedrich, K., R. Walter, H. Voss and J. Karger-Kocsis. 1986. “Effect of short fibre reinforcementon the fatigue crack propagation and fracture of PEEK-matrix composites,” Composites, 17:205–216.
22. Evans, W.J., D.H. Isaac and K.S. Saib. 1996. “The effect of short carbon fibre reinforcement onfatigue crack growth in PEEK,” Composites Part A, 27A: 547–554.
23. Voss, H. and J. Karger-Kocsis. 1988. “Fatigue crack propagation in glass-fibre and glass-spherefilled PBT composites,” Int. J. Fatigue, 1: 3–11.
24. Voss, H. and R. Walter. 1985. Fracture and fatigue of short glass-fibre reinforcedpolyethersulphone composites,” J. Mat. Science Letter, 4: 1174–1177.
25. Voss, H. and K. Friedrich. 1986. “Fracture and fatigue of short glass fibre reinforced PTFE com-posites,” J. Mat. Science Letter, 5: 569–572.
26. Janimak, J.J., S.Z.D. Cheng, A. Zhang and E.T. Hsieh. 1992. “Isotacticity effect on crystalliza-tion and melting in polypropylene fractions: 3. Overall crystallization and melting behaviour,”Polymer, 33: 728–735.
27. ASTM D 5045, 1993. “Standard test methods for plane-strain fracture toughness and strain en-ergy release rate of plastic materials,” Annual Book of ASTM Standard, 08.03.
28. Broek, D. 1987. Elementary Engineering Fracture Mechanics. Dordrecht: Martinus NijhoffPublishers, p. 85.
29. Agarwal, D.B. and J.L. Broutman. 1990. Analysis and Performance of Fiber Composites. Secondedition. New York: John Wiley & Sons, p. 131.
30. Kardos, J.L. 1990. “Mechanical properties of polymeric composite materials,” in E. Baer, A.Moet (eds.) High Performance Polymers, Munich: Hanser Publishers, pp. 199–251.
31. Karger-Kocsis, J. 1989. “Microstructure and fracture mechanical performance of short-fibre re-inforced thermoplastics,” in K. Friedrich (ed.) Application of Fracture Mechanics to CompositeMaterials, Amsterdam: Elsevier Science Publishers, pp. 189–247.
32. Vu-Khanh, T. and B. Fisa. 1986. “Impact fracture of glass-flake reinforced polypropylene,”Polymer Composites, 7: 375–382.
33. Darlington, M.W. 1991. “Short fibre reinforced thermoplastics: properties and design,” in A.H.Cardon and G. Verchery (eds.) Durability of Polymer Based Composite Systems for StructuralApplications, London: Elsevier Science Publisher, pp. 80–98.
34. Hertzberg, R.W., J.A. Manson and M.D. Skibo. 1975. “Frequency sensitivity of fatigue pro-cesses in polymeric solids,” Polymer Engineering and Science, 15: 252–260.
35. Cheng, W.M., G.A. Miller, J.A. Manson, R.W. Hertzberg and L.H. Sperling. 1990. “Mechanicalbehaviour of poly(methyl methacrylate). Part 2 The temperature and frequency effects on the fa-tigue crack propagation behaviour,” J. Mater. Science, 25: 1924–1930.
36. Hertzberg, R.W. and J.A. Manson. 1973. “Micromechanisms of fatigue-crack advance in PVC,”J. Mater. Science, 8: 1554–1558.
37. Arad, S., J.C. Radon and L.E. Culver. 1972. “Growth of fatigue cracks in polycarbonate,” Poly-mer Engineering and Science, 12: 193–198.
38. Hertzberg, R.W., J.A. Manson and W.C. Wu. 1973. “Structure of polymers and fatigue crackpropagation,” ASTM STP 536: 391–403.
39. Lang, R.W., J.A. Manson and R.W. Hertzberg. 1983. “Fatigue crack propagation in short-glassfiber-reinforced nylon 6.6: effect of frequency,” in J.C. Seferis and L. Nicolais (eds.) The Role ofthe Polymeric Matrix in the Processing and Structural Properties of Composite Materials, NewYork: Plenum, pp. 377–396.
40. Williams, J.G. 1984. Fracture Mechanics of Polymers, West Sussex, England: Ellis HorwoodLtd., p. 176.
Fatigue Fracture of Reinforced Polypropylene 1027