fast phylogenetic dna barcoding
TRANSCRIPT

, published 27 December 2008, doi: 10.1098/rstb.2008.0169363 2008 Phil. Trans. R. Soc. B Kasper Munch, Wouter Boomsma, Eske Willerslev and Rasmus Nielsen Fast phylogenetic DNA barcoding
References
http://rstb.royalsocietypublishing.org/content/363/1512/3997.full.html#related-urls Article cited in:
http://rstb.royalsocietypublishing.org/content/363/1512/3997.full.html#ref-list-1
This article cites 27 articles, 13 of which can be accessed free
Subject collections
(49 articles)taxonomy and systematics � (712 articles)evolution �
(64 articles)bioinformatics � Articles on similar topics can be found in the following collections
Email alerting service hereright-hand corner of the article or click Receive free email alerts when new articles cite this article - sign up in the box at the top
http://rstb.royalsocietypublishing.org/subscriptions go to: Phil. Trans. R. Soc. BTo subscribe to
on August 15, 2014rstb.royalsocietypublishing.orgDownloaded from on August 15, 2014rstb.royalsocietypublishing.orgDownloaded from

Phil. Trans. R. Soc. B (2008) 363, 3997–4002
doi:10.1098/rstb.2008.0169
on August 15, 2014rstb.royalsocietypublishing.orgDownloaded from
Fast phylogenetic DNA barcoding
Published online 7 October 2008
Kasper Munch1,*, Wouter Boomsma2, Eske Willerslev3 and Rasmus Nielsen4,5
One concomputa
*Autho
1Department of Integrative Biology, and 5Departments of Integrative Biology and Statistics,University of California, Berkeley, CA 94720-3140, USA
2Bioinformatics Centre, University of Copenhagen, Ole Maaløes Vej 5, 2200 København N, Denmark3Department of Biology and Centre for Ancient Genetics, and 4Department of Biology,
University of Copenhagen, Universitetsparken 15, 2100 København Ø, Denmark
We present a heuristic approach to the DNA assignment problem based on phylogenetic inferencesusing constrained neighbour joining and non-parametric bootstrapping. We show that this methodperforms as well as the more computationally intensive full Bayesian approach in an analysis of500 insect DNA sequences obtained from GenBank. We also analyse a previously published datasetof environmental DNA sequences from soil from New Zealand and Siberia, and use these datato illustrate the fact that statistical approaches to the DNA assignment problem allow for moreappropriate criteria for determining the taxonomic level at which a particular DNA sequence canbe assigned.
Keywords: assignment; barcoding; phylogenetics; neighbour joining
1. INTRODUCTIONDNA barcoding is the use of DNA sequences for
identifying unknown biological specimens. A DNA
sequence is obtained for a particular marker, typically
cytochrome oxidase I in animals, and this sequence is
compared to a DNA database to determine to which
species or other taxonomic unit the specimen belongs.
DNA barcoding is, in one form or another, widely used
in conservation genetics and molecular ecology (e.g.
Duminil et al. 2006; Rubinoff 2006; Ward et al. 2008),
but is also used in a number of other areas including
forensic applications (e.g. Dawnay et al. 2007) and
ancient DNA studies (e.g. Willerslev et al. 2007). It has
often been associated with methods for delineating and
defining species based on DNA evidence (e.g. Floyd
et al. 2002; Hebert et al. 2003; Remigio & Hebert 2003;
Moritz & Cicero 2004). However, in this paper, we will
solely consider the statistical question of how to assign
DNA sequences to a priori defined taxonomical units.
This fundamental statistical problem has been
addressed in a number of studies (e.g. Matz & Nielsen
2005; Meyer & Paulay 2005; Steinke et al. 2005;
Nielsen & Matz 2006; Abdo & Golding 2007; Munch
et al. 2008). We recently proposed a Bayesian approach
based on a combination of automated database
searches, alignment and Bayesian phylogenetic infer-
ence (Munch et al. 2008). The objective of this
approach is to approximate the posterior probability
that the unknown specimen belongs to a specific
species or taxonomic group. This is done by first
obtaining a number of sequences with high homology
to the unknown specimen using database searches,
aligning these sequences to each other and the
tribution of 17 to a Discussion Meeting Issue ‘Statistical andtional challenges in molecular phylogenetics and evolution’.
r for correspondence ([email protected]).
3997
unknown specimen, and then determining the pos-terior probability of membership of a particular groupusing a Markov chain Monte Carlo (MCMC)approach similar to the one commonly used inphylogenetic inference (e.g. Yang & Rannala 1997;Huelsenbeck & Ronquist 2001). Under the assumptionthat the sequences in the alignment include all relevantspecies, the MCMC output can be directly processedto give the desired probabilities of taxon membership.This method was implemented in a computer program‘Statistical Assignment Package’ (SAP; Munch et al.2008), and was used in several applications, includingthe analysis of hundreds of ancient DNA sequencesfrom ice cores from the Greenlandic ice (Johnson et al.2007; Willerslev et al. 2007).
While the method in SAP was found to have goodstatistical performance on real and simulated datasets(Munch et al. 2008), it may not be easily applicable tolarge-scale datasets, such as the datasets produced inmetagenomics applications. In such applications,thousands or hundred of thousands of sequences arebeing analysed, rendering MCMC-based approachescomputationally intractable. In this paper, therefore,we explore the possibility of using the neighbour-joining algorithm (Saitou & Nei 1987) in combinationwith bootstrapping (Felsenstein 1985) as a heuristicapproach to approximate the posterior probabilities.An alternative approach is to interpret bootstrapproportions in a frequentist framework to make assign-ments based on hypothesis testing (e.g. Nielsen & Matz2006). The Bayesian interpretation of bootstrapproportions used here has the advantage that it allowsfor the possibility of using decision theory to devisecriteria for assignment (Abdo & Golding 2007). We willshow that while there often are large differencesbetween posterior probabilities and bootstrap pro-portions, the neighbour joining with bootstrapapproach nonetheless performs quite well as a method
This journal is q 2008 The Royal Society
3998 K. Munch et al. Statistical assignment of DNA sequences
on August 15, 2014rstb.royalsocietypublishing.orgDownloaded from
for DNA barcoding inference. As with all otherapproaches, the inferences are only as good as thedatabase used. The method does not model species notrepresented in the database, and can lead to wronginferences if the database is not representative.
2. MATERIAL AND METHODSSAP implements automatic assignment of sample sequences
to taxa based on the position of the sample sequence in the
phylogeny of life. In the first presentation of SAP (Munch
et al. 2008) a Bayesian approach was taken, using MCMC to
estimate the posterior probabilities that the sample sequence
forms a monophyletic group together with a particular
monophyletic clade.
Ideally, all available homologues available in the database
should be included in such analyses. However, due to the
computational complexity of running the MCMC analysis,
a heuristic is instead applied to compile a representative set
of sequence homologues. We use BLAST searches against
GenBank to identify homologues and retrieve sequences and
taxonomic annotation for each one, disregarding homologues
with insufficient annotation. By including only homologues
with a BLAST score of at least half that of the best matching
homologue, we exclude the bulk of sequence homologues
representing taxa whose probability of grouping with the
sample sequence is not appreciably large.
In many cases, however, even this cut-off does not limit the
number of homologues to a set that can be handled practically
by the MCMC approach. In these cases, we use a heuristic to
compile a limited set with the best possible taxonomic
coverage: we include only the best matching sequence
homologue for each species. A maximum of 30 different
species homologues are included in this manner. If allowed by
the BLAST score cut-off, up to 20 homologues providing
further taxonomic diversity are added progressively, includ-
ing up to 10 genera, 6 families, 5 orders, 3 classes and 2 phyla
in the set. If the BLAST score cut-off is reached before 50
homologues have been included in the set, additional
sequences are added for the species already represented in
the set by including homologues previously rejected as
suboptimal representatives for the species.
Based on the alignment of the compiled set of
homologues, phylogenetic trees are then sampled from a
Markov chain with stationary density of trees given by the
posterior probability of trees (e.g. Yang & Rannala 1997;
Huelsenbeck & Ronquist 2001). A backbone topological
constraint is imposed to increase the MCMC convergence
and to provide the method with information regarding
known phylogenetic relationships. The constraints are
generated from the retrieved taxonomic annotation.
The taxonomic annotation is mapped onto each sampled
tree. In this way, each clade in the tree is associated with the
taxon with lowest taxonomic rank, which includes all
sequences in the clade. The sister clade to the sample
sequence is then identified by assuming the rooting implicit
from the taxonomic annotation. In cases where the position of
the root relative to the sample sequence cannot be deduced
from the taxonomic annotation, the entire tree is considered
the sister clade. An estimate of the posterior probability of
assignment to a species or taxonomic group is then obtained
as the fraction of sampled trees where the sister clade is a
member of this species or group.
While this method was found to have desirable statistical
properties, it may be prohibitively slow for large metagenomic
datasets. We here propose a fast heuristic alternative:
sampling of trees using neighbour joining (Saitou & Nei
Phil. Trans. R. Soc. B (2008)
1987) and non-parametric bootstrapping (Felsenstein 1985).
We will use a constrained version of the neighbour-joining
algorithm, and in order to discuss properties of this
algorithm, we will first review how the standard neighbour-
joining algorithm works.
Neighbour joining progressively selects taxon pairs from a
set of taxa and constructs a new subtree that joins the pair.
The root of the new subtree replaces the two nodes that are
joined, reducing the taxon set by one. Pairs are selected by
minimizing the following criterion:
Qði; j ÞZ ðLK2Þdði; j ÞKXLkZ1
dði; kÞKXLkZ1
dð j; kÞ; ð2:1Þ
where L is the number of taxa left to be joined and d(i, j ) is the
distance between sequence i and j, here calculated using
Kimura’s (1980) two-parameter model. If i and j are joined
creating the new node p, then the distances d(i, p) and d( j, p)
are calculated using
dði; pÞZ1
2dði; j ÞC
1
2ðLK2Þ
XLkZ1
dði; kÞKXLkZ1
dð j; kÞ
" #: ð2:2Þ
When p replaces i and j in the distance matrix, the new
distances, from p to the remaining taxa, are calculated using
dðp; kÞZ1
2½dði; kÞKdði; pÞ�C
1
2½dð j; kÞKdð j; pÞ�: ð2:3Þ
We can interpret the neighbour-joining algorithm as a
greedy optimization algorithm of the balanced minimum
evolution criterion given by
l ZXLfi; jg
dði; j Þ
oði; j Þ; ð2:4Þ
where o(i, j ) is the sum of the number of outgoing branches
from internal nodes on the directed path from i to j (Desper &
Gascuel 2004; Semple & Steel 2004). For a binary tree, o(i, j )
reduces to 2n where n is the number of internal nodes
connecting i and j. Because the neighbour-joining algorithm
does not search the whole space of possible trees, it is not
guaranteed to return the tree maximizing l.
The algorithm is outlined below.
Initialization
— Define T as the set of L leaf nodes.
— Calculate the sequence distances between all pairs in T.
Iteration
— Identify the pair i, j in T for which Q(i, j ) is minimal.
— Define a new node p and compute the distance d( p, k)
to the k other nodes in T using equation (2.3).
— Add p to T and calculate lengths of edges i, p and j, p
using equation (2.2).
— Remove i and j from T.
Termination
— When T consists of two leaves i and j, add the remaining
edge between them with length d(i, j ).
Each iteration step requires only the recalculation of one
row in the Q matrix leaving the initial calculation of sequence
distances and the identification of the minimal entry in Q the
only operations with O(L2) complexity.
The constrained version of the algorithm is simply
implemented by replacing the first operation in the iteration by
— Identify the pair i, j among all pairs in T not violating the
backbone constraint, for which Q(i, j ) is minimal.
0.025 0.225 0.425 0.625 0.825
freq
uenc
y
0
100
200
300
400
Statistical assignment of DNA sequences K. Munch et al. 3999
on August 15, 2014rstb.royalsocietypublishing.orgDownloaded from
We immediately note that this constrained algorithm
preserves some of the desirable properties of neighbour
joining. Firstly, the interpretation of the neighbour-joining
algorithm as a greedy optimization algorithm of the minimum
evolution criterion in equation (2.4) is preserved—but now
subject to the backbone constraint. The constraints do not
affect the calculations of distances. Secondly, and quite
trivially, if the backbone constraint imposed is correct, the
usual arguments for statistical consistency of the neighbour-
joining method (e.g. Gascuel 1997) are also preserved.
However, the use of topological constraints does not
necessarily ensure high support for the correct assignment
in cases where the constraints are not themselves supported
by the sequence data.
With a fully specified constraint the computational
complexity of identifying the pair to join is now linear in L.
0
0
0.2 0.4 0.6 0.8 1.0
0.2
0.4
0.6
0.8
1.0
bootstrap probability
MC
MC
pro
babi
lity
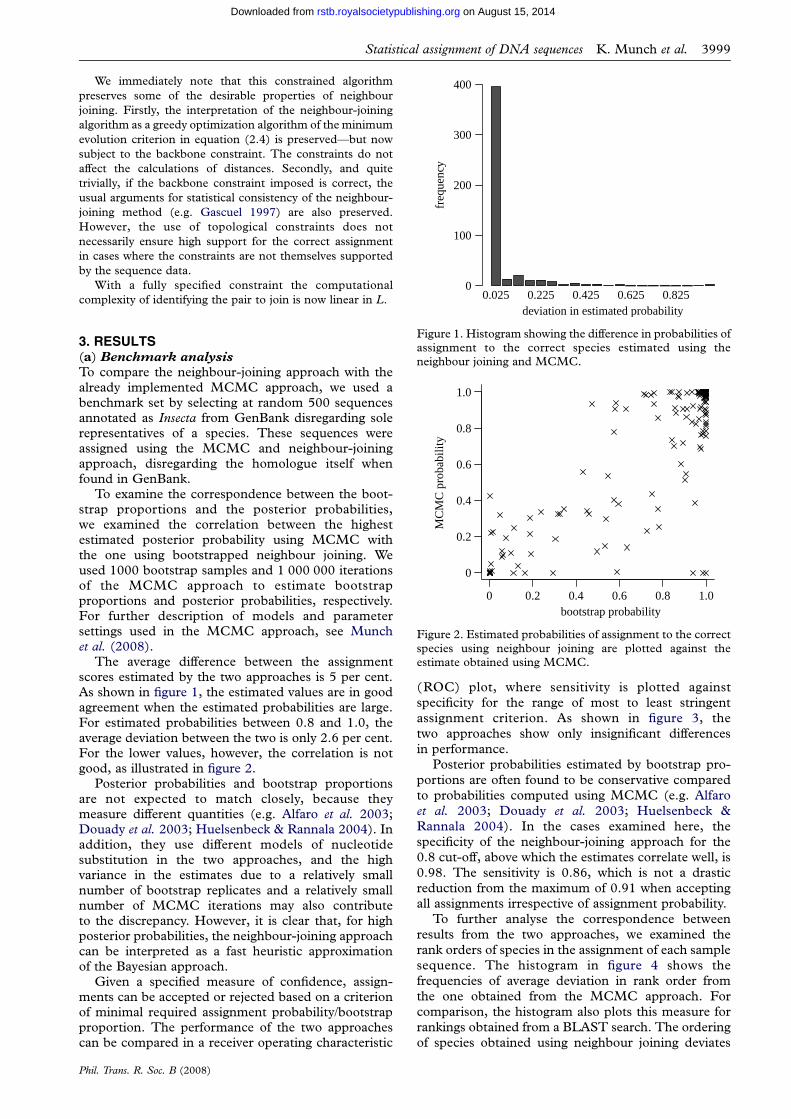
Figure 2. Estimated probabilities of assignment to the correctspecies using neighbour joining are plotted against theestimate obtained using MCMC.
deviation in estimated probability
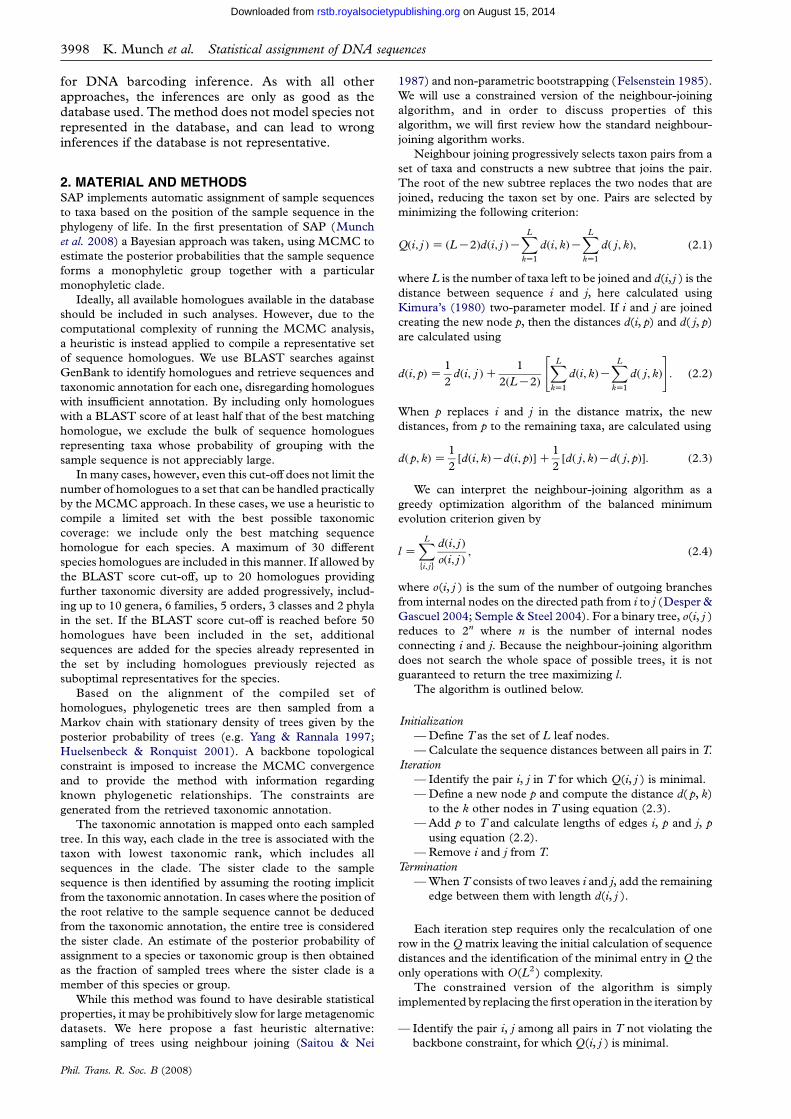
Figure 1. Histogram showing the difference in probabilities ofassignment to the correct species estimated using theneighbour joining and MCMC.
3. RESULTS(a) Benchmark analysis
To compare the neighbour-joining approach with thealready implemented MCMC approach, we used abenchmark set by selecting at random 500 sequencesannotated as Insecta from GenBank disregarding solerepresentatives of a species. These sequences wereassigned using the MCMC and neighbour-joiningapproach, disregarding the homologue itself whenfound in GenBank.
To examine the correspondence between the boot-strap proportions and the posterior probabilities,we examined the correlation between the highestestimated posterior probability using MCMC withthe one using bootstrapped neighbour joining. Weused 1000 bootstrap samples and 1 000 000 iterationsof the MCMC approach to estimate bootstrapproportions and posterior probabilities, respectively.For further description of models and parametersettings used in the MCMC approach, see Munchet al. (2008).
The average difference between the assignmentscores estimated by the two approaches is 5 per cent.As shown in figure 1, the estimated values are in goodagreement when the estimated probabilities are large.For estimated probabilities between 0.8 and 1.0, theaverage deviation between the two is only 2.6 per cent.For the lower values, however, the correlation is notgood, as illustrated in figure 2.
Posterior probabilities and bootstrap proportionsare not expected to match closely, because theymeasure different quantities (e.g. Alfaro et al. 2003;Douady et al. 2003; Huelsenbeck & Rannala 2004). Inaddition, they use different models of nucleotidesubstitution in the two approaches, and the highvariance in the estimates due to a relatively smallnumber of bootstrap replicates and a relatively smallnumber of MCMC iterations may also contributeto the discrepancy. However, it is clear that, for highposterior probabilities, the neighbour-joining approachcan be interpreted as a fast heuristic approximationof the Bayesian approach.
Given a specified measure of confidence, assign-ments can be accepted or rejected based on a criterionof minimal required assignment probability/bootstrapproportion. The performance of the two approachescan be compared in a receiver operating characteristic
Phil. Trans. R. Soc. B (2008)
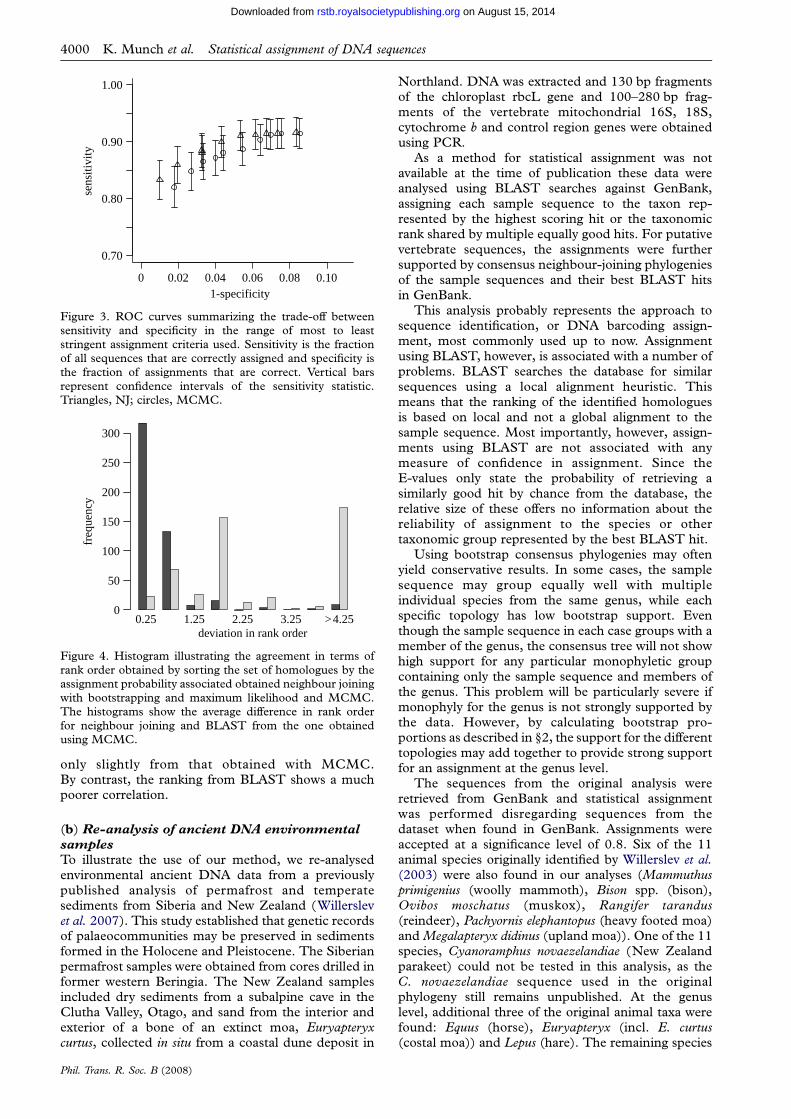
(ROC) plot, where sensitivity is plotted againstspecificity for the range of most to least stringentassignment criterion. As shown in figure 3, thetwo approaches show only insignificant differencesin performance.
Posterior probabilities estimated by bootstrap pro-portions are often found to be conservative comparedto probabilities computed using MCMC (e.g. Alfaroet al. 2003; Douady et al. 2003; Huelsenbeck &Rannala 2004). In the cases examined here, thespecificity of the neighbour-joining approach for the0.8 cut-off, above which the estimates correlate well, is0.98. The sensitivity is 0.86, which is not a drasticreduction from the maximum of 0.91 when acceptingall assignments irrespective of assignment probability.
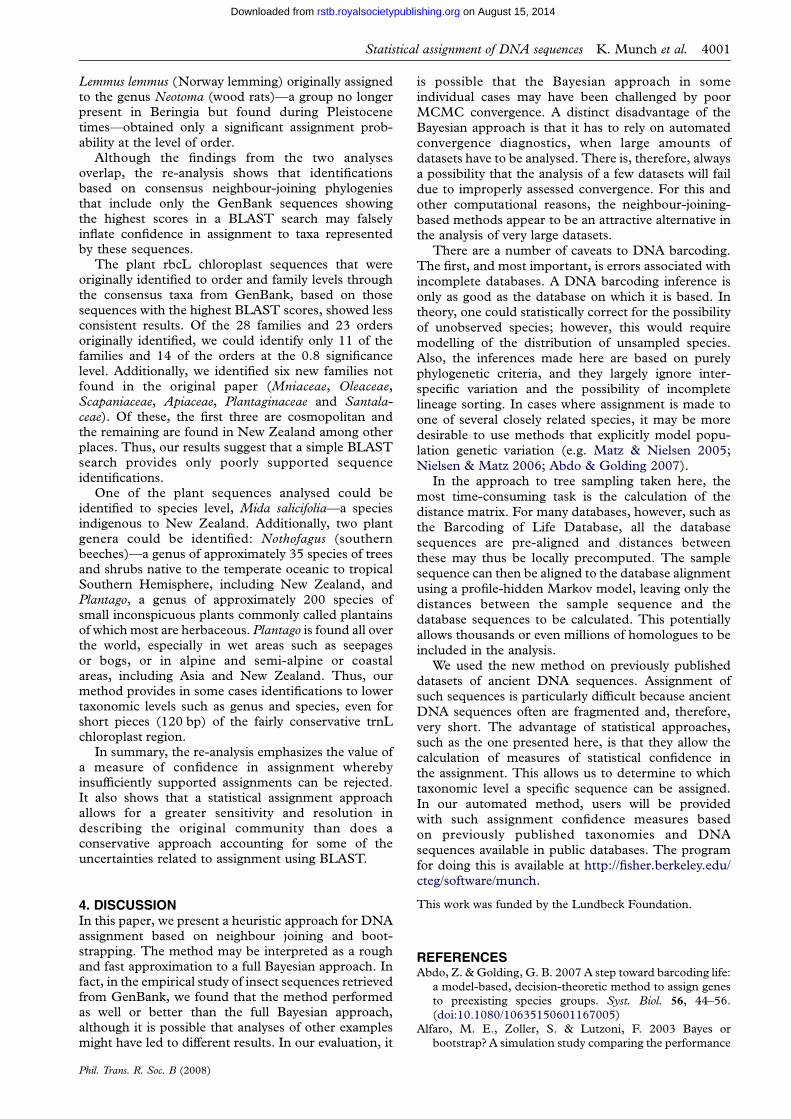
To further analyse the correspondence betweenresults from the two approaches, we examined therank orders of species in the assignment of each samplesequence. The histogram in figure 4 shows thefrequencies of average deviation in rank order fromthe one obtained from the MCMC approach. Forcomparison, the histogram also plots this measure forrankings obtained from a BLAST search. The orderingof species obtained using neighbour joining deviates
0 0.02 0.04 0.06 0.08 0.10
0.70
0.80
0.90
1.00
1-specificity
sens
itivi
ty
Figure 3. ROC curves summarizing the trade-off betweensensitivity and specificity in the range of most to leaststringent assignment criteria used. Sensitivity is the fractionof all sequences that are correctly assigned and specificity isthe fraction of assignments that are correct. Vertical barsrepresent confidence intervals of the sensitivity statistic.Triangles, NJ; circles, MCMC.
0.25 1.25 2.25 3.25 >4.25deviation in rank order
freq
uenc
y
0
50
100
150
200
250
300
Figure 4. Histogram illustrating the agreement in terms ofrank order obtained by sorting the set of homologues by theassignment probability associated obtained neighbour joiningwith bootstrapping and maximum likelihood and MCMC.The histograms show the average difference in rank orderfor neighbour joining and BLAST from the one obtainedusing MCMC.
4000 K. Munch et al. Statistical assignment of DNA sequences
on August 15, 2014rstb.royalsocietypublishing.orgDownloaded from
only slightly from that obtained with MCMC.By contrast, the ranking from BLAST shows a muchpoorer correlation.
(b) Re-analysis of ancient DNA environmental
samples
To illustrate the use of our method, we re-analysedenvironmental ancient DNA data from a previouslypublished analysis of permafrost and temperatesediments from Siberia and New Zealand (Willerslevet al. 2007). This study established that genetic recordsof palaeocommunities may be preserved in sedimentsformed in the Holocene and Pleistocene. The Siberianpermafrost samples were obtained from cores drilled informer western Beringia. The New Zealand samplesincluded dry sediments from a subalpine cave in theClutha Valley, Otago, and sand from the interior andexterior of a bone of an extinct moa, Euryapteryxcurtus, collected in situ from a coastal dune deposit in
Phil. Trans. R. Soc. B (2008)
Northland. DNA was extracted and 130 bp fragmentsof the chloroplast rbcL gene and 100–280 bp frag-ments of the vertebrate mitochondrial 16S, 18S,cytochrome b and control region genes were obtainedusing PCR.
As a method for statistical assignment was notavailable at the time of publication these data wereanalysed using BLAST searches against GenBank,assigning each sample sequence to the taxon rep-resented by the highest scoring hit or the taxonomicrank shared by multiple equally good hits. For putativevertebrate sequences, the assignments were furthersupported by consensus neighbour-joining phylogeniesof the sample sequences and their best BLAST hitsin GenBank.
This analysis probably represents the approach tosequence identification, or DNA barcoding assign-ment, most commonly used up to now. Assignmentusing BLAST, however, is associated with a number ofproblems. BLAST searches the database for similarsequences using a local alignment heuristic. Thismeans that the ranking of the identified homologuesis based on local and not a global alignment to thesample sequence. Most importantly, however, assign-ments using BLAST are not associated with anymeasure of confidence in assignment. Since theE-values only state the probability of retrieving asimilarly good hit by chance from the database, therelative size of these offers no information about thereliability of assignment to the species or othertaxonomic group represented by the best BLAST hit.
Using bootstrap consensus phylogenies may oftenyield conservative results. In some cases, the samplesequence may group equally well with multipleindividual species from the same genus, while eachspecific topology has low bootstrap support. Eventhough the sample sequence in each case groups with amember of the genus, the consensus tree will not showhigh support for any particular monophyletic groupcontaining only the sample sequence and members ofthe genus. This problem will be particularly severe ifmonophyly for the genus is not strongly supported bythe data. However, by calculating bootstrap pro-portions as described in §2, the support for the differenttopologies may add together to provide strong supportfor an assignment at the genus level.
The sequences from the original analysis wereretrieved from GenBank and statistical assignmentwas performed disregarding sequences from thedataset when found in GenBank. Assignments wereaccepted at a significance level of 0.8. Six of the 11animal species originally identified by Willerslev et al.(2003) were also found in our analyses (Mammuthusprimigenius (woolly mammoth), Bison spp. (bison),Ovibos moschatus (muskox), Rangifer tarandus(reindeer), Pachyornis elephantopus (heavy footed moa)and Megalapteryx didinus (upland moa)). One of the 11species, Cyanoramphus novaezelandiae (New Zealandparakeet) could not be tested in this analysis, as theC. novaezelandiae sequence used in the originalphylogeny still remains unpublished. At the genuslevel, additional three of the original animal taxa werefound: Equus (horse), Euryapteryx (incl. E. curtus(costal moa)) and Lepus (hare). The remaining species
Statistical assignment of DNA sequences K. Munch et al. 4001
on August 15, 2014rstb.royalsocietypublishing.orgDownloaded from
Lemmus lemmus (Norway lemming) originally assignedto the genus Neotoma (wood rats)—a group no longerpresent in Beringia but found during Pleistocenetimes—obtained only a significant assignment prob-ability at the level of order.
Although the findings from the two analysesoverlap, the re-analysis shows that identificationsbased on consensus neighbour-joining phylogeniesthat include only the GenBank sequences showingthe highest scores in a BLAST search may falselyinflate confidence in assignment to taxa representedby these sequences.
The plant rbcL chloroplast sequences that wereoriginally identified to order and family levels throughthe consensus taxa from GenBank, based on thosesequences with the highest BLAST scores, showed lessconsistent results. Of the 28 families and 23 ordersoriginally identified, we could identify only 11 of thefamilies and 14 of the orders at the 0.8 significancelevel. Additionally, we identified six new families notfound in the original paper (Mniaceae, Oleaceae,Scapaniaceae, Apiaceae, Plantaginaceae and Santala-ceae). Of these, the first three are cosmopolitan andthe remaining are found in New Zealand among otherplaces. Thus, our results suggest that a simple BLASTsearch provides only poorly supported sequenceidentifications.
One of the plant sequences analysed could beidentified to species level, Mida salicifolia—a speciesindigenous to New Zealand. Additionally, two plantgenera could be identified: Nothofagus (southernbeeches)—a genus of approximately 35 species of treesand shrubs native to the temperate oceanic to tropicalSouthern Hemisphere, including New Zealand, andPlantago, a genus of approximately 200 species ofsmall inconspicuous plants commonly called plantainsof which most are herbaceous. Plantago is found all overthe world, especially in wet areas such as seepagesor bogs, or in alpine and semi-alpine or coastalareas, including Asia and New Zealand. Thus, ourmethod provides in some cases identifications to lowertaxonomic levels such as genus and species, even forshort pieces (120 bp) of the fairly conservative trnLchloroplast region.
In summary, the re-analysis emphasizes the value ofa measure of confidence in assignment wherebyinsufficiently supported assignments can be rejected.It also shows that a statistical assignment approachallows for a greater sensitivity and resolution indescribing the original community than does aconservative approach accounting for some of theuncertainties related to assignment using BLAST.
4. DISCUSSIONIn this paper, we present a heuristic approach for DNAassignment based on neighbour joining and boot-strapping. The method may be interpreted as a roughand fast approximation to a full Bayesian approach. Infact, in the empirical study of insect sequences retrievedfrom GenBank, we found that the method performedas well or better than the full Bayesian approach,although it is possible that analyses of other examplesmight have led to different results. In our evaluation, it
Phil. Trans. R. Soc. B (2008)
is possible that the Bayesian approach in someindividual cases may have been challenged by poorMCMC convergence. A distinct disadvantage of theBayesian approach is that it has to rely on automatedconvergence diagnostics, when large amounts ofdatasets have to be analysed. There is, therefore, alwaysa possibility that the analysis of a few datasets will faildue to improperly assessed convergence. For this andother computational reasons, the neighbour-joining-based methods appear to be an attractive alternative inthe analysis of very large datasets.
There are a number of caveats to DNA barcoding.The first, and most important, is errors associated withincomplete databases. A DNA barcoding inference isonly as good as the database on which it is based. Intheory, one could statistically correct for the possibilityof unobserved species; however, this would requiremodelling of the distribution of unsampled species.Also, the inferences made here are based on purelyphylogenetic criteria, and they largely ignore inter-specific variation and the possibility of incompletelineage sorting. In cases where assignment is made toone of several closely related species, it may be moredesirable to use methods that explicitly model popu-lation genetic variation (e.g. Matz & Nielsen 2005;Nielsen & Matz 2006; Abdo & Golding 2007).
In the approach to tree sampling taken here, themost time-consuming task is the calculation of thedistance matrix. For many databases, however, such asthe Barcoding of Life Database, all the databasesequences are pre-aligned and distances betweenthese may thus be locally precomputed. The samplesequence can then be aligned to the database alignmentusing a profile-hidden Markov model, leaving only thedistances between the sample sequence and thedatabase sequences to be calculated. This potentiallyallows thousands or even millions of homologues to beincluded in the analysis.
We used the new method on previously publisheddatasets of ancient DNA sequences. Assignment ofsuch sequences is particularly difficult because ancientDNA sequences often are fragmented and, therefore,very short. The advantage of statistical approaches,such as the one presented here, is that they allow thecalculation of measures of statistical confidence inthe assignment. This allows us to determine to whichtaxonomic level a specific sequence can be assigned.In our automated method, users will be providedwith such assignment confidence measures basedon previously published taxonomies and DNAsequences available in public databases. The programfor doing this is available at http://fisher.berkeley.edu/cteg/software/munch.
This work was funded by the Lundbeck Foundation.
REFERENCESAbdo, Z. & Golding, G. B. 2007 A step toward barcoding life:
a model-based, decision-theoretic method to assign genes
to preexisting species groups. Syst. Biol. 56, 44–56.
(doi:10.1080/10635150601167005)
Alfaro, M. E., Zoller, S. & Lutzoni, F. 2003 Bayes or
bootstrap? A simulation study comparing the performance
4002 K. Munch et al. Statistical assignment of DNA sequences
on August 15, 2014rstb.royalsocietypublishing.orgDownloaded from
of Bayesian Markov chain Monte Carlo sampling andbootstrapping in assessing phylogenetic confidence. Mol.Biol. Evol. 20, 255–266. (doi:10.1093/molbev/msg028)
Dawnay, N., Ogden, R., McEwing, R., Carvalho, G. R. &Thorpe, R. S. 2007 Validation of the barcoding gene COIfor use in forensic genetic species identification. ForensicSci. Int. 173, 1–6. (doi:10.1016/j.forsciint.2006.09.013)
Desper, R. & Gascuel, O. 2004 Theoretical foundation of thebalanced minimum evolution method of phylogeneticinference and its relationship to weighted least-squarestree fitting. Mol. Biol. Evol. 21, 587–598. (doi:10.1093/molbev/msh049)
Douady, C. J., Delsuc, F., Boucher, Y., Ford Doolittle, W. &Douzery, E. J. P. 2003 Comparison of Bayesian andmaximum likelihood bootstrap measures of phylogeneticreliability. Mol. Biol. Evol. 20, 248–252. (doi:10.1093/molbev/msg042)
Duminil, J., Caron, H., Scotti, I., Cazal, S.-O. & Petit, R. J.2006 Blind population genetics survey of tropicalrainforest trees. Mol. Ecol. 15, 3505–3513. (doi:10.1111/j.1365-294X.2006.03040.x)
Felsenstein, J. 1985 Confidence limits on phylogenies: anapproach using the bootstrap. Evolution 39, 783–791.(doi:10.2307/2408678)
Floyd, R., Abebe, E., Papert, A. & Blaxter, M. 2002Molecular barcodes for soil nematode identification.Mol. Ecol. 11, 839–850. (doi:10.1046/j.1365-294X.2002.01485.x)
Gascuel, O. 1997 BIONJ: an improved version of the NJalgorithm based on a simple model of sequence data. Mol.Biol. Evol. 14, 685–695.
Hebert,P., Cywinska, A., Ball, S.& Dewaard, J. 2003 Biologicalidentifications through DNA barcodes. Proc. Biol. Sci. 270,313–321. (doi:10.1098/rspb.2002.2218)
Huelsenbeck, J. & Rannala, B. 2004 Frequentist properties ofBayesian posterior probabilities of phylogenetic treesunder simple and complex substitution models. Syst.Biol. 53, 904–913. (doi:10.1080/10635150490522629)
Huelsenbeck, J. P. & Ronquist, F. 2001 MRBAYES: Bayesianinference of phylogenetic trees. Bioinformatics 17,754–755. (doi:10.1093/bioinformatics/17.8.754)
Johnson, S. S. et al. 2007 Ancient bacteria show evidenceof DNA repair. Proc. Natl Acad. Sci. USA 104,14 401–14 405. (doi:10.1073/pnas.0706787104)
Kimura, K. 1980 A simple method for estimating evolution-ary rates of base substitutions through comparative studiesof nucleotide sequences. J. Mol. Evol. 16, 111–120.(doi:10.1007/BF01731581)
Phil. Trans. R. Soc. B (2008)
Matz, M. & Nielsen, R. 2005 A likelihood ratio test for
species membership based on DNA sequence data.
Phil. Trans. R Soc. B 360, 1969–1974. (doi:10.1098/rstb.
2005.1728)
Meyer, C. & Paulay, G. 2005 DNA barcoding: error rates
based on comprehensive sampling. PLoS Biol. 3, e422.
(doi:10.1371/journal.pbio.0030422)
Moritz, C. & Cicero, C. 2004 DNA barcoding: promise and
pitfalls. PLoS Biol. 2, e354. (doi:10.1371/journal.pbio.
0020354)
Munch, K., Boomsma, W., Huelsenbeck, J., Willerslev, E. &
Nielsen, R. 2008 Statistical assignment of DNA sequences
using Bayesian phylogenetics. Syst. Biol. 57, 750–757.
(doi:10.1080/10635150802422316)
Nielsen, R. & Matz, M. 2006 Statistical approaches for
DNA barcoding. Syst. Biol. 55, 162–169. (doi:10.1080/
10635150500431239)
Remigio, E. & Hebert, P. 2003 Testing the utility of partial
COI sequences for phylogenetic estimates of gastropod
relationships. Mol. Phylogenet. Evol. 29, 641–647. (doi:10.
1016/S1055-7903(03)00140-4)
Rubinoff, D. 2006 Utility of mitochondrial DNA barcodes in
species conservation. Conserv. Biol. 20, 1026–1033.
(doi:10.1111/j.1523-1739.2006.00542.x)
Saitou, N. & Nei, M. 1987 The neighbor-joining method:
a new method for reconstructing phylogenetic trees. Mol.
Biol. Evol. 4, 406–425.
Semple, C. & Steel, M. 2004 Cyclic permutations and
evolutionary trees. Adv. Appl. Math. 32, 669–680. (doi:10.
1016/S0196-8858(03)00098-8)
Steinke, D., Vences, M., Salzburger, W. & Meyer, A. 2005
TAXI: a software tool for DNA barcoding using distance
methods. Phil. Trans. R. Soc. B 360, 1975–1980. (doi:10.
1098/rstb.2005.1729)
Ward, R., Holmes, B., White, W. & Last, P. 2008 DNA
barcoding Australasian chondrichthyans: results and
potential uses in conservation. Marine Freshw. Res. 59,
57–71. (doi:10.1071/MF07148)
Willerslev, E. et al. 2003 Diverse plant and animal genetic
records from holocene and pleistocene sediments. Science
300, 791–795. (doi:10.1126/science.1084114)
Willerslev, E. et al. 2007 Ancient biomolecules from deep ice
cores reveal a forested southern Greenland. Science 317,
111–114. (doi:10.1126/science.1141758)
Yang, Z. & Rannala, B. 1997 Bayesian phylogenetic inference
using DNA sequences: a Markov Chain Monte Carlo
Method. Mol. Biol. Evol. 14, 717–724.