faculty work life and job satisfaction: …web4.uwindsor.ca/units/researchethicsboard... · web...
TRANSCRIPT

Faculty Work Life and Job Satisfaction: University of Windsor, 2012
A Survey Conducted by Students in 46/48-507-508 Graduate Seminar on Research Methods
Course Instructors: Drs. Janice Drakich and Eleanor Maticka-Tyndale
Students: Ahmed-Ali FarooqiCharles FikiAdeline GaspardKrystina HutchingsOluwemimo (Wemi) JayeobaAbdullah KasemNikolina LjepavaChelsea McLellanRhulangane (David) MungweteErwin SelimosSeda SunerAiguo (Tom) Zhang
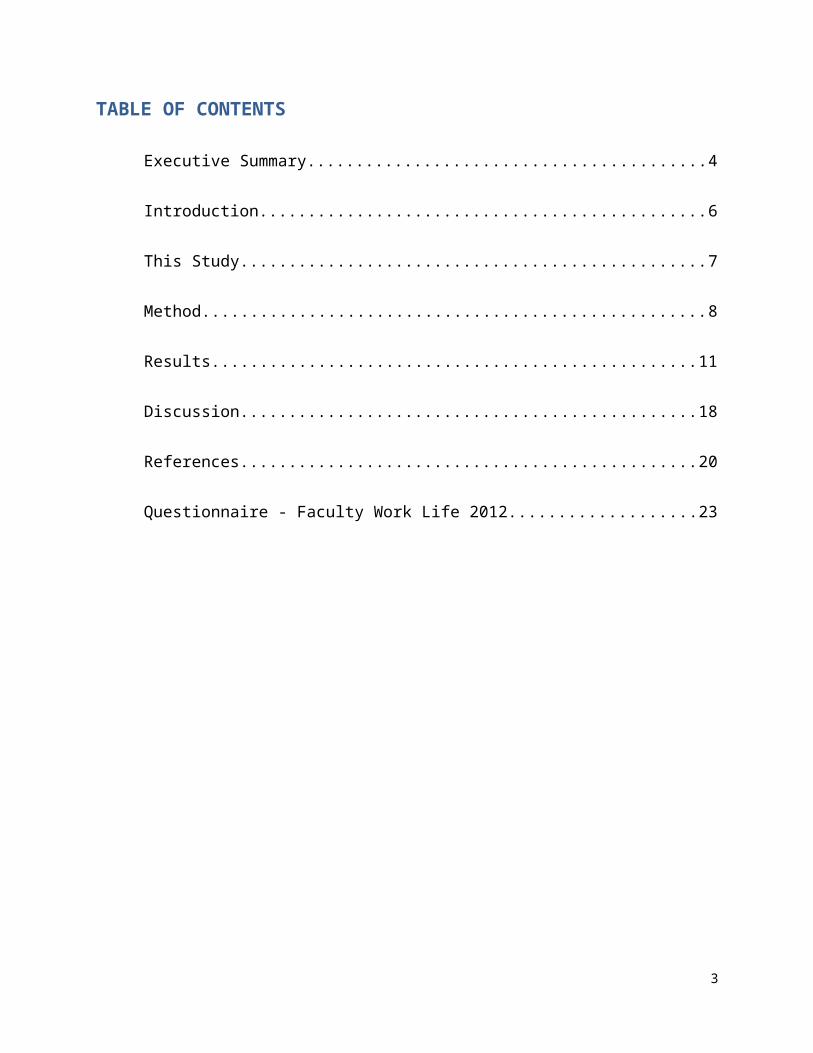
TABLE OF CONTENTS
Executive Summary...........................................................................................................................4
Introduction........................................................................................................................................6
This Study..........................................................................................................................................7
Method.............................................................................................................................................. 8
Results.............................................................................................................................................11
Discussion....................................................................................................................................... 18
References...................................................................................................................................... 20
Questionnaire - Faculty Work Life 2012..........................................................................................23
2
EXECUTIVE SUMMARY
Background
Research has documented job, workplace, and relationship characteristics as well as stress and work-life balance as contributing to the level of job satisfaction among university faculty. Job satisfaction, in turn, has been demonstrated to influence quality of teaching and productivity in research and service with dissatisfaction affecting both educational quality and costs. This has made job satisfaction of university faculty a growing area of concern and research.
The Project
Nearly 1000 full- and part-time faculty at the University of Windsor were invited to complete an online survey exploring their work-life and job satisfaction in late February, early March, 2012. The survey was prepared by students in 46/48-507 and 508, a graduate course in Survey Research Methods. Research procedures were approved by the University REB.
203 faculty opened the survey 132 completed 70% of the questions and were used as the sample for analysis.
The Findings
Given the small, nonrepresentative sample that responded to the survey, findings must be considered as reflecting experiences and perceptions of the 132 faculty who completed the survey and cannot necessarily be generalized to the entire University of Windsor faculty population. Faculty who completed the survey included:
68% full- and 32% part-time faculty 34% sessional or limited term appointments and 66% tenured or tenure-track appointments 42% men and 58% women All ranks (lecturer through to full professors)
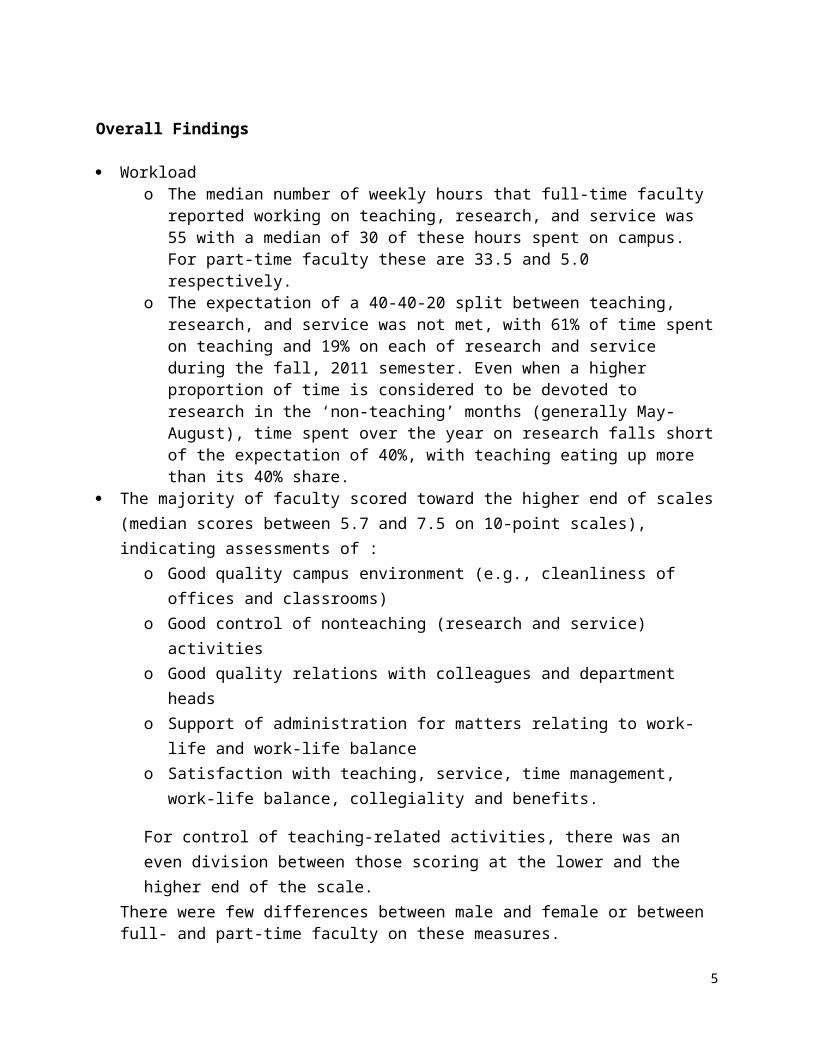
Overall Findings
Workloado The median number of weekly hours that full-time faculty reported working on teaching,
research, and service was 55 with a median of 30 of these hours spent on campus. For part-time faculty these are 33.5 and 5.0 respectively.
o The expectation of a 40-40-20 split between teaching, research, and service was not met, with 61% of time spent on teaching and 19% on each of research and service during the fall, 2011 semester. Even when a higher proportion of time is considered to be devoted to research in the ‘non-teaching’ months (generally May-August), time spent over the year on research falls short of the expectation of 40%, with teaching eating up more than its 40% share.
The majority of faculty scored toward the higher end of scales (median scores between 5.7 and 7.5 on 10-point scales), indicating assessments of :
o Good quality campus environment (e.g., cleanliness of offices and classrooms)o Good control of nonteaching (research and service) activitieso Good quality relations with colleagues and department headso Support of administration for matters relating to work-life and work-life balance
3

o Satisfaction with teaching, service, time management, work-life balance, collegiality and benefits.
For control of teaching-related activities, there was an even division between those scoring at the lower and the higher end of the scale.
There were few differences between male and female or between full- and part-time faculty on these measures.
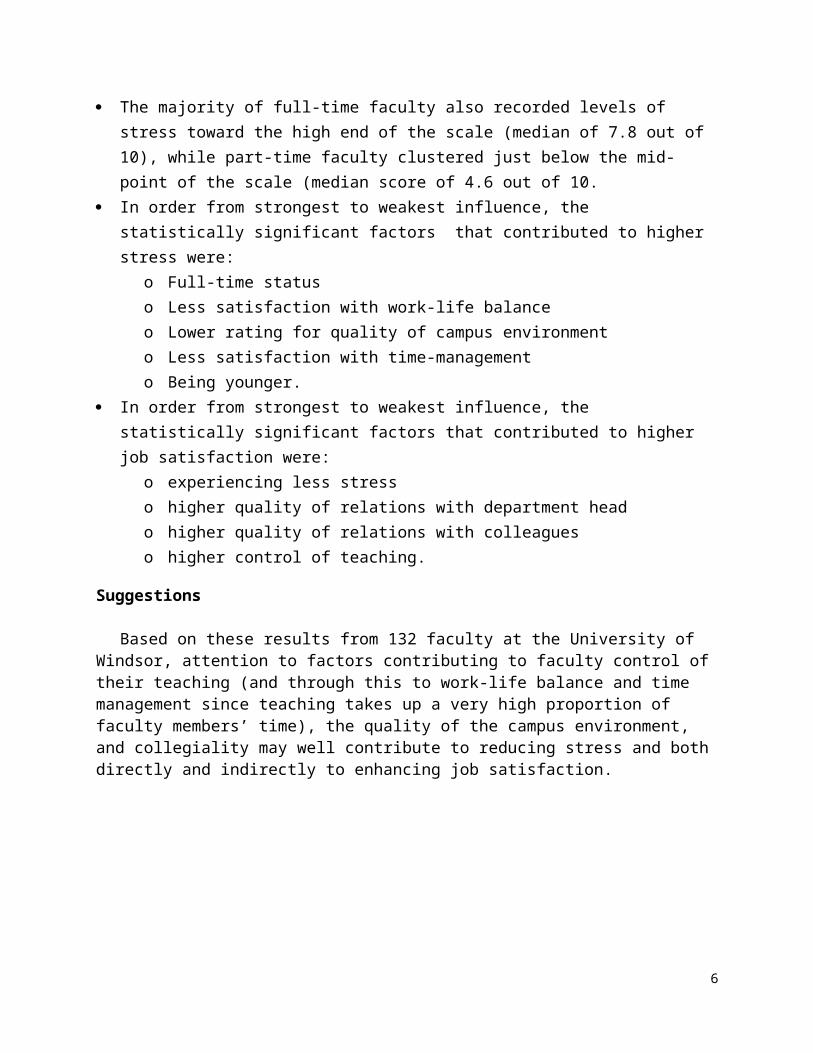
The majority of full-time faculty also recorded levels of stress toward the high end of the scale (median of 7.8 out of 10), while part-time faculty clustered just below the mid-point of the scale (median score of 4.6 out of 10.
In order from strongest to weakest influence, the statistically significant factors that contributed to higher stress were:
o Full-time statuso Less satisfaction with work-life balanceo Lower rating for quality of campus environmento Less satisfaction with time-managemento Being younger.
In order from strongest to weakest influence, the statistically significant factors that contributed to higher job satisfaction were:
o experiencing less stresso higher quality of relations with department heado higher quality of relations with colleagueso higher control of teaching.
Suggestions
Based on these results from 132 faculty at the University of Windsor, attention to factors contributing to faculty control of their teaching (and through this to work-life balance and time management since teaching takes up a very high proportion of faculty members’ time), the quality of the campus environment, and collegiality may well contribute to reducing stress and both directly and indirectly to enhancing job satisfaction.
4
INTRODUCTION
A study of work-life and job satisfaction among faculty at the University of Windsor was undertaken by students in the graduate seminar on survey research as a course assignment. Their interest in the topic was initially driven by curiosity with no specific expectations or hypotheses. As students searched the literature, however, they found a sizable scholarship on faculty job satisfaction. The research was primarily based in the United States, Europe, and Australia, with little in Canada. It consistently showed an association between job satisfaction and:
Demographic characteristics of faculty such as sex and marital status (Alexandrow-Stamatios, Matilyn, & Cary, 2003; August & Waltman, 2004; Bozeman & Gaughan, 2011; Liu & Ramsey, 2008; Ponjuan, Martin, Conley, & Trower, 2011; Sabharwal & Corley, 2009; Sanders, Willemsen, & Millar , 2008; Seifert & Umbach, 2008; Track & Patitu, 1992a);
Job characteristics such as whether faculty were full- or part-time, teaching workload, status as Assistant-Associate-Full Professors, and salary (Bozeman & Gaughan, 2001; Durham, Merritt, & Sorrell, 2007; Hagedorn, 1996; Horton, 2007; Maynard, 2008; Myers, 2011; Porter, 2007; Vardis, 2009; Vito, 2007);
Workplace atmosphere and relationships such as sense of collegiality, availability of job supports, and recognition of efforts and accomplishments (Bilimoria, Perry, Liang, Stoller, Higgins, & Taylor, 2006; Bozeman & Gaughan, 2011; Keashly & Neuman, 2010; Romig, O’Sullivan, & Denmark, 2011);
Experiences of stress and work-life balance (Brown, 2007; Catano, Francis, Haines, Kirpalani, Shannon, Stringer, & Lozanzki, 2010; Happ & Yoder, 1991; Olsen & Near, 1994; Schults, 2007).
Prior work also supported the need for research on satisfaction that took the specific and unique characteristics of the job of a university faculty member into consideration such as its tripartite nature including teaching, research, and service; the self-direction expected of faculty, often with minimal or no guidance or guidelines; and work-spread into personal and social time (Track & Patitu, 1992b). Recent research has identified changes in the role and expectations of university faculty as factors that are likely to have an impact on job satisfaction. These include increases in class size, expectations to adopt new teaching technologies and approaches to teaching, shifts in the roles of universities, increased pressure to obtain research funding, greater quantities of publications, increased responsibilities in the areas of student recruitment and counseling and the changing nature of university students and their expectations of university (Winefield, Gillespie, Stough, Dua, & Hapuararchi 2003).
The downside of job satisfaction – dissatisfaction – has a demonstrated affect on both educational quality and costs. Job dissatisfaction is associated with lower productivity in research, less attention to and poorer teaching and mentoring of students, burnout, absenteeism, negative health consequences, and higher attrition (Cetin, 2006; Cropsey, Masho, Shiang, Sikka, Kornstein, & Hampton, 2008; Mamisheishvili & Rosser, 2010; Rosser, 2004; Shanafelt, West, Sloan, Novotny, Poland, Menaker, & Dyrbye, 2009; Track & Patitu, 1992). These take a toll on students in the classroom, the reputation and status of the university, knowledge creation through research, and the cost to the university and tax payer of maintaining the university.
5
THIS STUDY
After reviewing the literature, students framed research questions and hypotheses addressing the effects of demographic and job characteristics, workplace atmosphere and relationships, work-life balance on stress, and the effects of all of these factors on job satisfaction.
6
METHOD
Under the guidance of the course instructors, Drs. Janice Drakich and Eleanor Maticka-Tyndale, the students designed an on-line questionnaire to examine the effect of demographic and job characteristics, workplace atmosphere, and relationships on the stress and job satisfaction experienced by full- and part-time faculty at the University of Windsor. The questionnaire and research procedures were reviewed and cleared by the University of Windsor Research Ethics Board.
Target Population, Recruitment, and Data Collection:
The target population was the 945 full- and part-time faculty members employed at the University of Windsor in February 2012. The questionnaire was available between February 16 and March 3, 2012. Emails were sent to all faculty on February 16 using the university’s mass-email system, inviting them to complete the on-line survey. Two reminder emails were sent over a 2 week period. Fluid Survey software was used to develop and administer the questionnaire. To complete the questionnaire, respondents clicked on a link in the invitation letter which took them to detailed information about procedures for the ethical conduct of the research and a further link to the questionnaire itself. When faculty completed and/or chose to exit the questionnaire, their responses were automatically saved to a database on a University of Windsor server. Of those invited, 203 opened the survey and 140 responded to at least 50% of the questions. This represents a response rate of 15% completing at least 50% of the questions.
Questionnaire Development:
The questionnaire had 114 questions and took an average of 17 minutes to complete. Questions were developed based on a review of the literature and of questionnaires used in similar research. The 114 questions asked about: general background characteristics, workload, work stress, control of various job-related functions, quality of work environment, job satisfaction, work-life balance, collegial relations, satisfaction with teaching, work-related services provided by the university, time management, collegiality, and benefits. The full questionnaire can be found at the end of this report.
Data Handling:
Survey responses were transferred from Fluid Surveys to SPSS software for analysis. No personal identifying information was retained in the data files. Students conducted the data checking, verification, and analysis under the supervision of Dr. Maticka-Tyndale. Aiguo (Tom) Zhang worked with Dr. Maticka-Tyndale to prepare the final results presented in this report.
Missing or Insufficient Data:Participants who responded to fewer than 70% of the survey questions were dropped from analysis,
leaving a sample of 132 full- and part-time faculty members in the dataset. To minimize loss of cases, missing responses to questions that were used in computing scales were imputed using expectation maximization or mean substitution as appropriate.
Because of the low response rate, the number of participants across faculties was too small to provide meaningful comparisons. Therefore, information about Faculty was eliminated from the data file.
7
Scalar Measures:Two statistical procedures -- factor analysis and reliability analysis using Cronbach’s alpha -- were
used to assess whether questions whose face-validity suggested they were measuring the same concept could be combined into scales. Results supported the creation of the follow scales:
Campus Environmental Quality: Summation of 3 questions asking about the condition of classrooms, offices, and the campus overall.
Control of Work: Two measures were created based on the summation of responses to questions about the amount of control faculty felt they had over different aspects of their teaching (4 questions) and of their nonteaching functions such as research and service (3 questions).
Quality of Relationships: Summation of 6 questions about the quality of relationships with colleagues and 2 about the quality of relationships with department heads were summed to create two quality of relationship scales.
Support of Administrators: Summation of responses to 6 questions asking about administrators’ support for different aspects of the work and life of faculty members.
Stress: Summation of responses to 4 questions about frequency of stress experienced related to teaching, research, service, and workload overall.
Satisfaction: Satisfaction was measured over 6 different areas.o Teaching: Summation of responses to 6 questions related to satisfaction with the level and
number of courses taught, number of students, control of content, quality of undergraduate students and access to teaching assistants.
o Service: Summation of responses to 7 questions related to satisfaction with the quality and access to teaching facilities, research services, teaching services, and administrative/ clerical support.
o Time management: Summation of responses to 4 questions asking about satisfaction with the amount of time spent on teaching, research, and service/administrative tasks.
o Work-life balance: Summation of responses to 2 questions asking about satisfaction with balance between work and family life and between work and social life.
o Collegiality: Summation of responses to 3 questions asking about satisfaction with professional relations with colleagues and department head and overall quality of relations with colleagues.
o Benefits: Summation of 2 questions about satisfaction with salary and benefit package.
Scores on all scales were standardized to a range of 0-10 to facilitate comparisons across scales.
Table 1: Internal Reliability of Scalar MeasuresScale Cronbach’s alphaCampus Environmental Quality .764Control: Teaching .699Control: Nonteaching functions .593Quality Colleague Relations .703Quality Relations with Dept. Head .857Support of Administration .862Stress .764Satisfaction: Teaching .813
Service .791Time Management .810Work-Life Balance .925Collegiality .829Benefits .864
8
The Cronbach’s alpha is a statistic that indicates how closely clustered or similar responses are on different questions used to comprise a scale. Alphas have an upper limit of 1.00 and generally an alpha of 0.6 is the minimum required for questions to be considered to ‘fit’ well enough together to be measuring a common concept. All of the created scales met this criterion except control of nonteaching functions, which is just marginally below this cut-point.
Four measures of workload were also created. Faculty were asked about the number of hours they spent in a typical or average week in the fall 2011 term performing specific tasks related to teaching, service, and research. The summation of responses produced measures of average self-reported time spent in each of these 3 areas as well as an estimate of the total hours of work in a typical or average week.
9
RESULTS
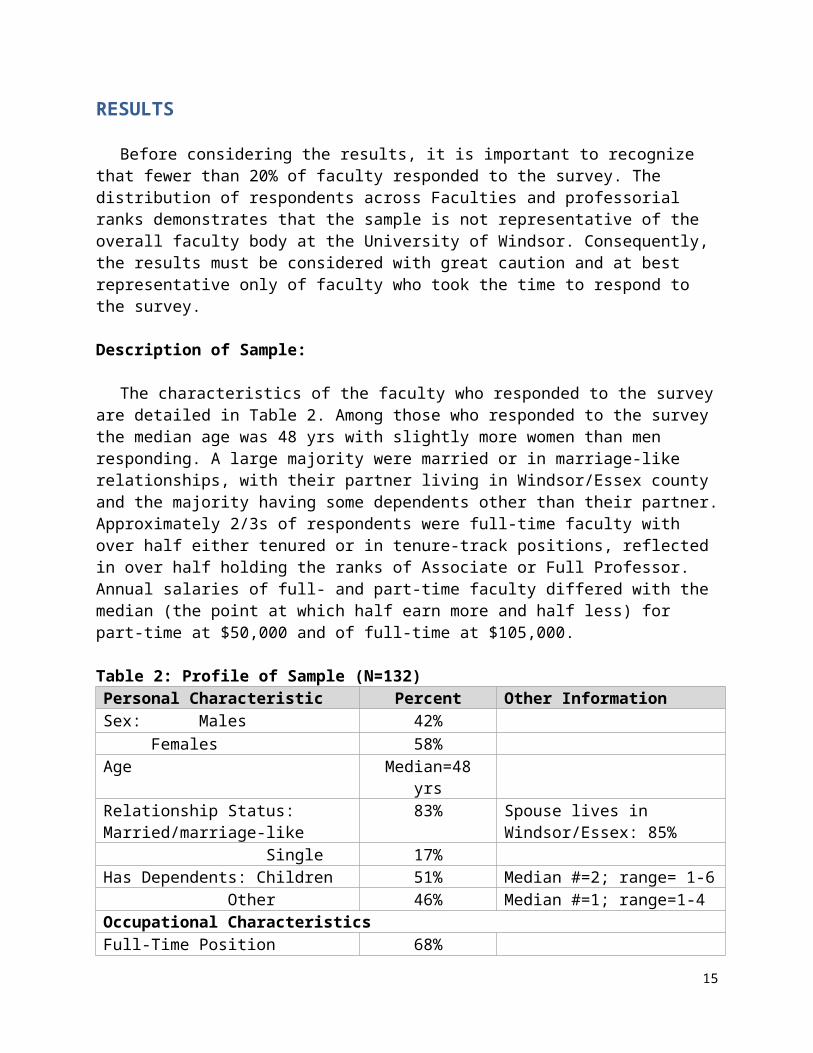
Before considering the results, it is important to recognize that fewer than 20% of faculty responded to the survey. The distribution of respondents across Faculties and professorial ranks demonstrates that the sample is not representative of the overall faculty body at the University of Windsor. Consequently, the results must be considered with great caution and at best representative only of faculty who took the time to respond to the survey.
Description of Sample:
The characteristics of the faculty who responded to the survey are detailed in Table 2. Among those who responded to the survey the median age was 48 yrs with slightly more women than men responding. A large majority were married or in marriage-like relationships, with their partner living in Windsor/Essex county and the majority having some dependents other than their partner. Approximately 2/3s of respondents were full-time faculty with over half either tenured or in tenure-track positions, reflected in over half holding the ranks of Associate or Full Professor. Annual salaries of full- and part-time faculty differed with the median (the point at which half earn more and half less) for part-time at $50,000 and of full-time at $105,000.
Table 2: Profile of Sample (N=132)Personal Characteristic Percent Other InformationSex: Males 42%
Females 58%Age Median=48 yrsRelationship Status: Married/marriage-like 83% Spouse lives in Windsor/Essex: 85%
Single 17%Has Dependents: Children 51% Median #=2; range= 1-6
Other 46% Median #=1; range=1-4Occupational CharacteristicsFull-Time Position 68%Part-Time Position 32% Prefer to be full-time: 70%Type of Position:
Sessional Instructor 32%Limited Term Appt 2%Tenure-Track 12%Tenured 45%
Rank: Lecturer 12%Assist. Prof 12%Assoc. Prof 33%Full Prof 19%Other 25%
Annual Salary: Part-Time Med=$50,000Full-Time Med=$105,000
Workload:
10
For workload, and for all other characteristics of faculty work life reported here, comparisons were made between male and female and between full- and part-time faculty members as well as between faculty members holding different ranks (lecturer, assistant, associate and full professors). Workload of full- and part-time faculty is reported in Table 3 and portrayed in graphic form in Figures 1 and 2.
Table 3: Full- and Part-Time Faculty Self-Reported Workload in Fall 2011 TermType of Workload Range
ReportedMean Median St. Dev.
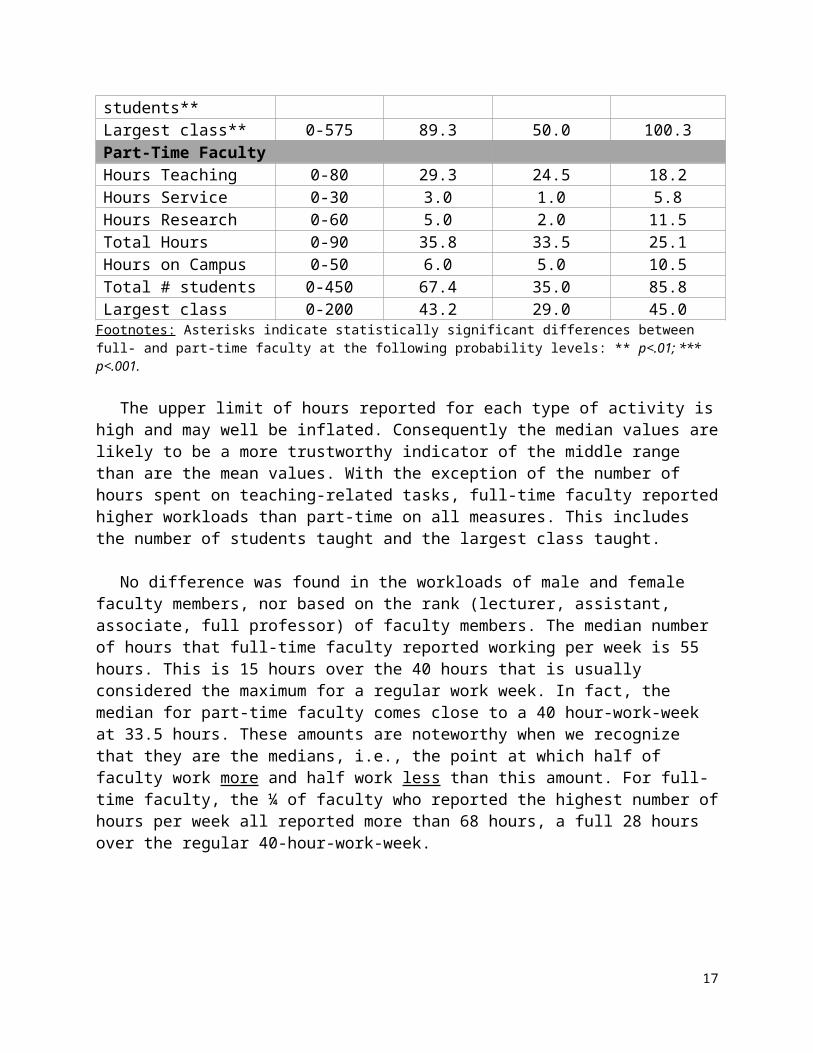
Full-Time FacultyHours Teaching 10-80 35.6 34.0 13.7Hours Service** 0-42 10.5 9.0 8.1Hours Research*** 1-41 11.5 8.0 8.9Total Hours*** 24-90 57.5 55.0 18.3Hours on Campus*** 0-60 25.0 30.0 18.3Total # students** 0-750 137.6 80.0 140.9Largest class** 0-575 89.3 50.0 100.3Part-Time FacultyHours Teaching 0-80 29.3 24.5 18.2Hours Service 0-30 3.0 1.0 5.8Hours Research 0-60 5.0 2.0 11.5Total Hours 0-90 35.8 33.5 25.1Hours on Campus 0-50 6.0 5.0 10.5Total # students 0-450 67.4 35.0 85.8Largest class 0-200 43.2 29.0 45.0
Footnotes: Asterisks indicate statistically significant differences between full- and part-time faculty at the following probability levels: ** p<.01; *** p<.001.
The upper limit of hours reported for each type of activity is high and may well be inflated. Consequently the median values are likely to be a more trustworthy indicator of the middle range than are the mean values. With the exception of the number of hours spent on teaching-related tasks, full-time faculty reported higher workloads than part-time on all measures. This includes the number of students taught and the largest class taught.
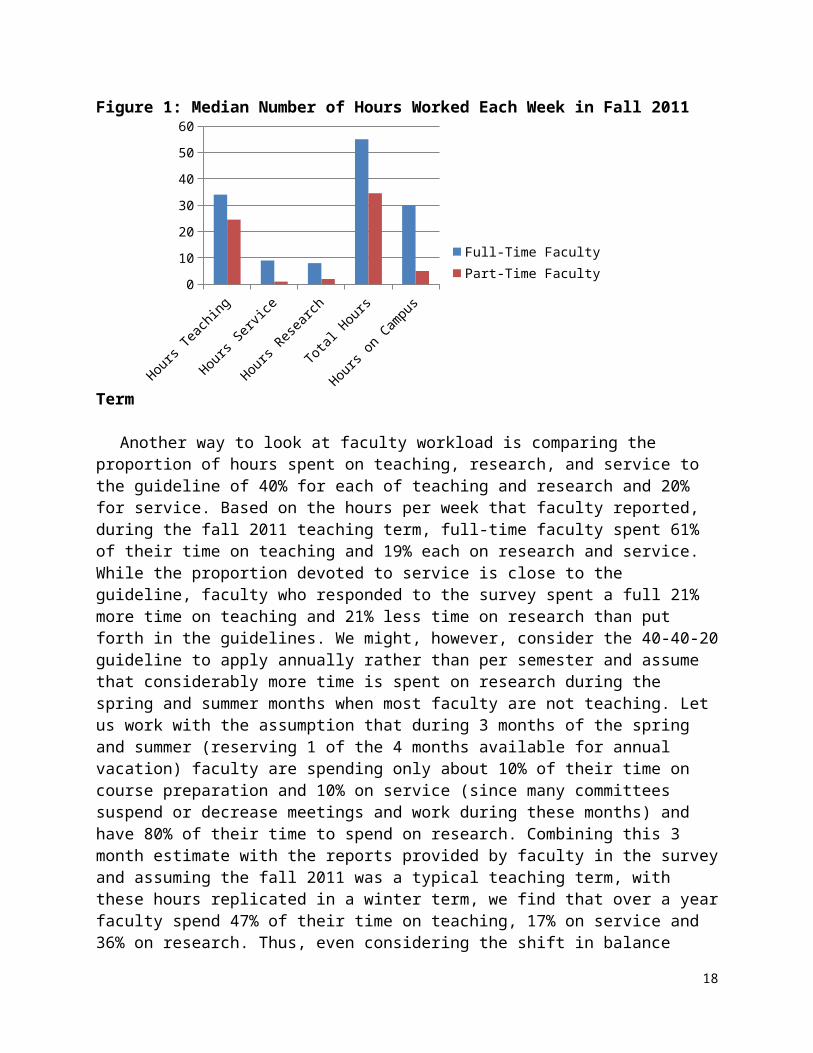
No difference was found in the workloads of male and female faculty members, nor based on the rank (lecturer, assistant, associate, full professor) of faculty members. The median number of hours that full-time faculty reported working per week is 55 hours. This is 15 hours over the 40 hours that is usually considered the maximum for a regular work week. In fact, the median for part-time faculty comes close to a 40 hour-work-week at 33.5 hours. These amounts are noteworthy when we recognize that they are the medians, i.e., the point at which half of faculty work more and half work less than this amount. For full-time faculty, the ¼ of faculty who reported the highest number of hours per week all reported more than 68 hours, a full 28 hours over the regular 40-hour-work-week.
11
Figure 1: Median Number of Hours Worked Each Week in Fall 2011 Term
Hours Teaching
Hours Service
Hours Research
Total Hours
Hours on Campus
0
10
20
30
40
50
60
Full-Time FacultyPart-Time Faculty
Another way to look at faculty workload is comparing the proportion of hours spent on teaching, research, and service to the guideline of 40% for each of teaching and research and 20% for service. Based on the hours per week that faculty reported, during the fall 2011 teaching term, full-time faculty spent 61% of their time on teaching and 19% each on research and service. While the proportion devoted to service is close to the guideline, faculty who responded to the survey spent a full 21% more time on teaching and 21% less time on research than put forth in the guidelines. We might, however, consider the 40-40-20 guideline to apply annually rather than per semester and assume that considerably more time is spent on research during the spring and summer months when most faculty are not teaching. Let us work with the assumption that during 3 months of the spring and summer (reserving 1 of the 4 months available for annual vacation) faculty are spending only about 10% of their time on course preparation and 10% on service (since many committees suspend or decrease meetings and work during these months) and have 80% of their time to spend on research. Combining this 3 month estimate with the reports provided by faculty in the survey and assuming the fall 2011 was a typical teaching term, with these hours replicated in a winter term, we find that over a year faculty spend 47% of their time on teaching, 17% on service and 36% on research. Thus, even considering the shift in balance across these three areas that occurs between fall-winter-spring/summer, it is likely that faculty are spending more than the 40% time allocated in guidelines to teaching, with the extra time coming from research (4%) and service (3%).
Since the number of courses taught is regulated by the collective agreement, the disproportionate amount of time spent on teaching may be related to class sizes. This has some support in the total number of students that faculty report. The mean number of students reported in the fall 2011 term was 137 with the ¼ of faculty who reported the largest number of students each covering 180-750 students in the term.
12

Figure 2: Average Number of Students Taught and Size of Largest Class
Total # students Largest class0
20
40
60
80
100
120
140
160
Full-Time FacultyPart-Time Faculty
Work Life :
Various measures of faculty work-life are reported in Table 4 and presented graphically in Figure 3.
Table 4: Scores on Measures Related to Work Life Scale Mean Median St. dev.Campus Environmental Quality 5.8 6.0 1.5Control: Teaching 5.0 5.0 2.3Control: Nonteaching functions 5.9 6.7 2.8Quality Colleague Relations 6.9 7.3 1.4Quality Relations with Dept. Head 6.9 8.0 2.4Support of Administration 6.7 6.8 2.0Stress 6.8 7.5 2.7
Footnotes: Scores on all scales were standardized to a range of 0-10 to facilitate comparison across scales.
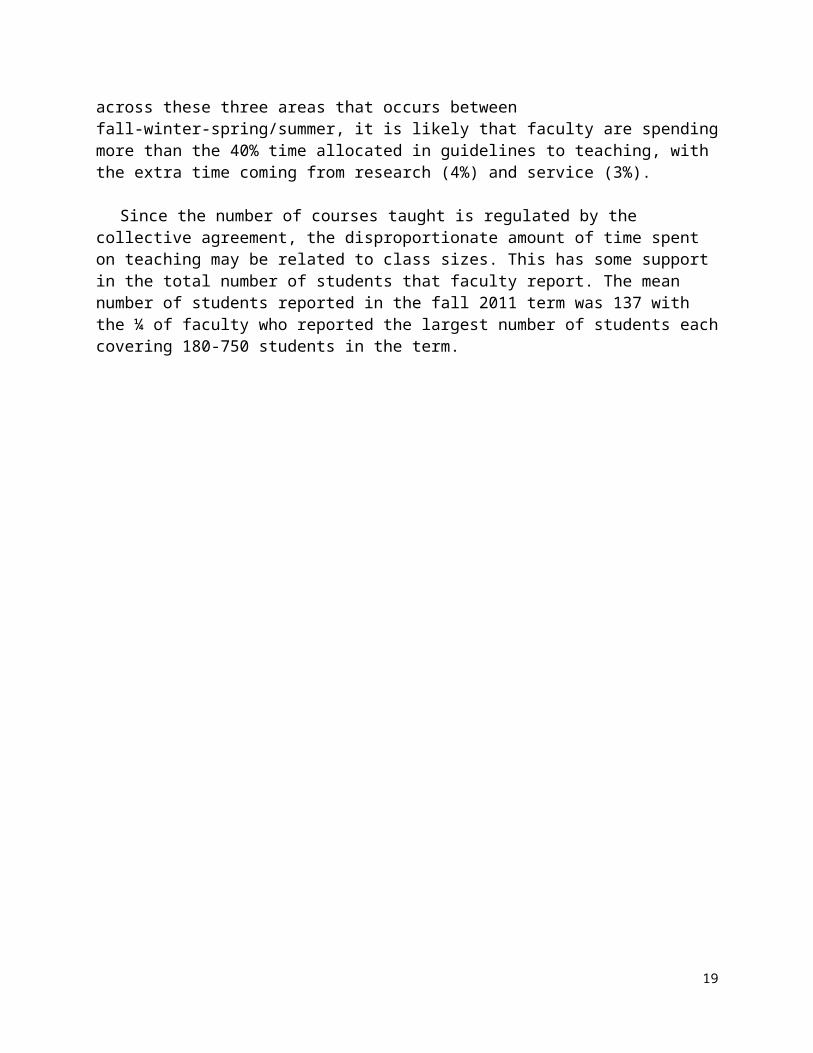
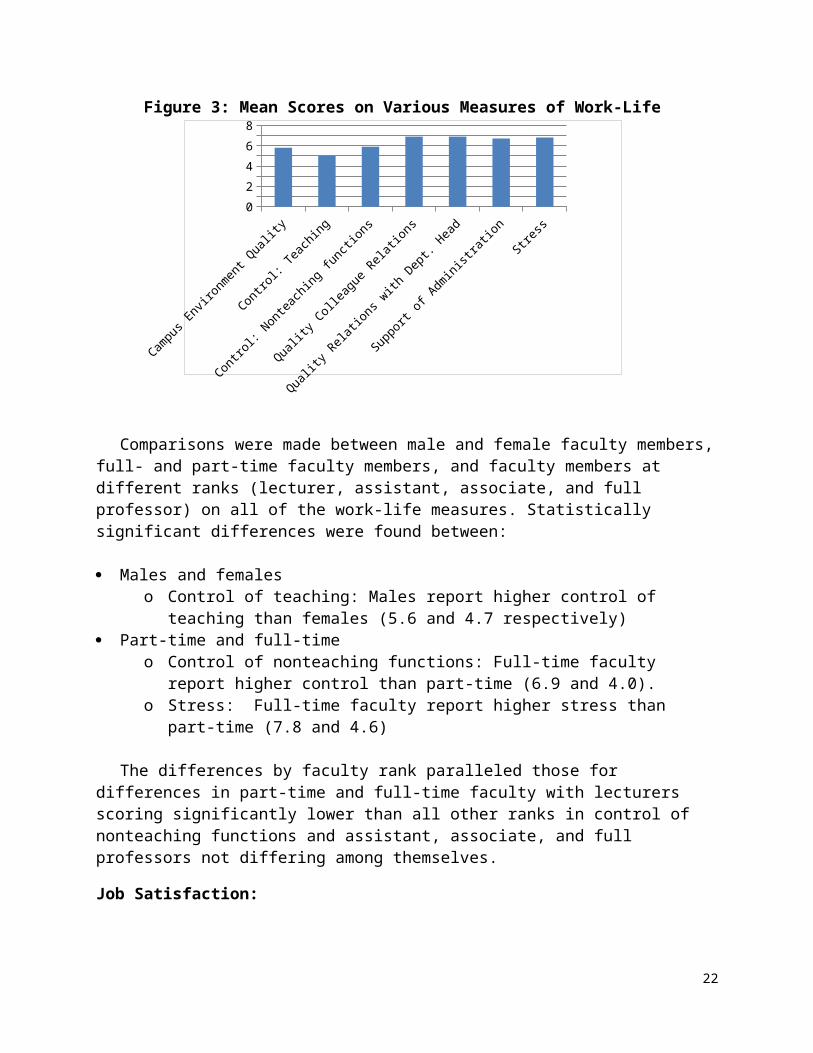
The means and medians on each scale support the conclusion that, on average, faculty score at slightly above the mid-point of each scale. This is a positive direction on all but the measure of stress, where the mean score of 6.8 and median of 7.5 indicate stress levels that are moving into the higher levels. Highest mean and median scores are seen in the quality of relations with colleagues and department head.
13

Figure 3: Mean Scores on Various Measures of Work-Life
Campus E
nvironmen
t Qualit
y
Control: T
eaching
Control: N
onteaching f
unctions
Quality
Colleagu
e Rela
tions
Quality
Relations w
ith Dep
t. Head
Support o
f Administr
ation
Stress
012345678
Comparisons were made between male and female faculty members, full- and part-time faculty members, and faculty members at different ranks (lecturer, assistant, associate, and full professor) on all of the work-life measures. Statistically significant differences were found between:
Males and females o Control of teaching: Males report higher control of teaching than females (5.6 and 4.7
respectively) Part-time and full-time
o Control of nonteaching functions: Full-time faculty report higher control than part-time (6.9 and 4.0).
o Stress: Full-time faculty report higher stress than part-time (7.8 and 4.6)
The differences by faculty rank paralleled those for differences in part-time and full-time faculty with lecturers scoring significantly lower than all other ranks in control of nonteaching functions and assistant, associate, and full professors not differing among themselves.
Job Satisfaction:
Table 5 and Figure 4 present results for measures of job satisfaction.
Table 5: Scores on Measures Related to Job SatisfactionSatisfaction with Mean Median St. dev.Teaching 7.3 7.7 1.8Service 6.4 6.6 1.8Time Management 5.7 5.5 2.0Work-Life Balance 5.9 6.0 2.6Collegiality 7.3 8.0 2.4Benefits 7.1 8.0 2.8
Footnotes: Scores on all scales were standardized to a range of 0-10 to facilitate comparison across scales.
14
Here again, mean and median scores are above the mid-point indicating more faculty scored their satisfaction toward the upper, or more satisfied end of each measure. Average satisfaction scores were highest for teaching, collegiality, and benefits and lowest for time-management.
Figure 4: Mean Scores for Satisfaction with Various Areas of Faculty Work-Life
Teaching
Servic
e
Time M
anage
ment
Work-Lif
e
Collegiali
ty
Benefi
ts0
1
2
3
4
5
6
7
8
Comparisons were again made between male and female faculty members, full- and part-time faculty, and faculty members at different ranks (lecturer, assistant, associate, and full professor) on all of the satisfaction measures. Statistically significant differences were found between:
Males and females o Satisfaction with time management: Males report higher satisfaction than females (6.2 and 5.4
respectively) Part-time and full-time
o Satisfaction with benefits: Full-time faculty report higher satisfaction than part-time (8.4 and 4.8).
The differences by faculty rank again paralleled those for differences in part-time and full-time faculty with lecturers scoring significantly lower than all other ranks in satisfaction with benefits and assistant, associate, and full professors not differing among themselves.
Multivariate Analyses for Stress and Satisfaction:
More complex exploratory analyses were performed to identify predictors of levels of stress and responses to a single question that asked faculty to rank their overall satisfaction. In each case, sex, age, marital status, part/full-time status, total workload, control of teaching and research, campus environmental quality, relationship with colleagues and department head, and support of administration were tested as potential predictors. For stress, all forms of satisfaction (teaching, service, time management, collegiality, work-life balance, and benefits) were also tested for their predictive ability. For satisfaction, stress was also tested. In each case, backward stepwise deletion procedures were used in ordinary least squares regression. In this procedure all possible predictors are included in a first analysis, with non-significant predictors removed one at a time from the weakest to less weak until only statistically significant predictors remain.
15

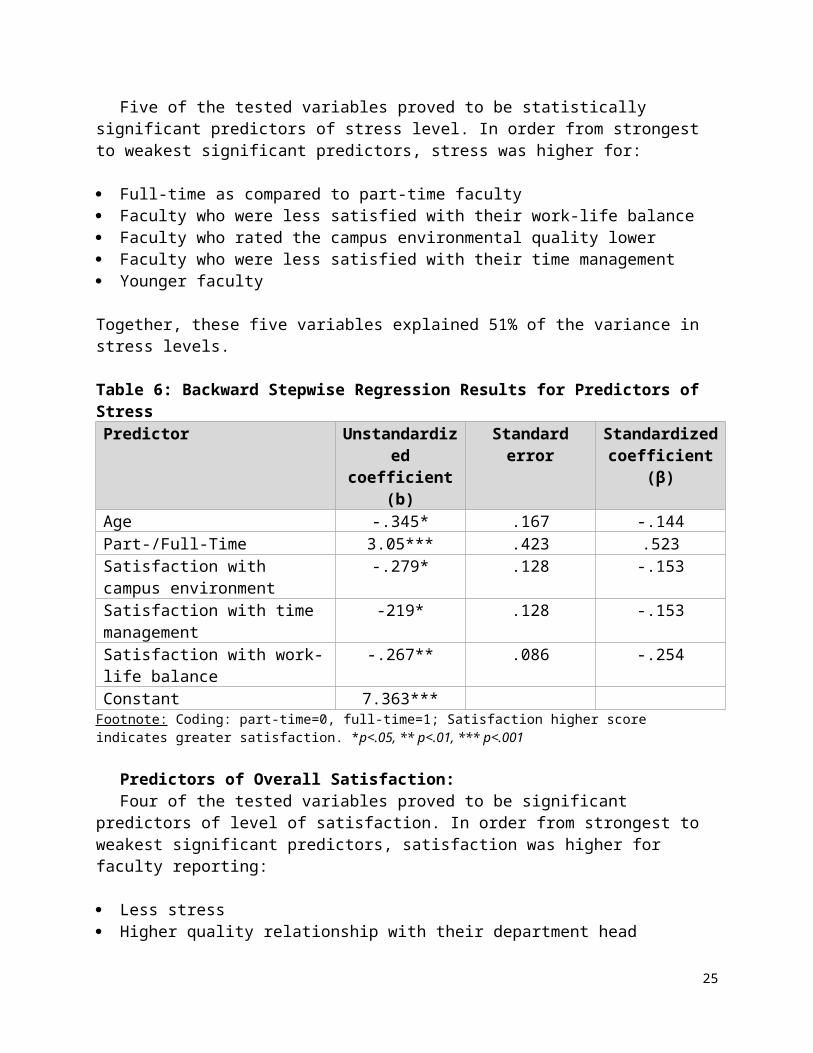
Predictors of Stress:Five of the tested variables proved to be statistically significant predictors of stress level. In order from
strongest to weakest significant predictors, stress was higher for:
Full-time as compared to part-time faculty Faculty who were less satisfied with their work-life balance Faculty who rated the campus environmental quality lower Faculty who were less satisfied with their time management Younger faculty
Together, these five variables explained 51% of the variance in stress levels.
Table 6: Backward Stepwise Regression Results for Predictors of StressPredictor Unstandardized
coefficient (b)Standard error Standardized
coefficient (β)Age -.345* .167 -.144Part-/Full-Time 3.05*** .423 .523Satisfaction with campus environment -.279* .128 -.153Satisfaction with time management -219* .128 -.153Satisfaction with work-life balance -.267** .086 -.254Constant 7.363***
Footnote: Coding: part-time=0, full-time=1; Satisfaction higher score indicates greater satisfaction. *p<.05, ** p<.01, *** p<.001
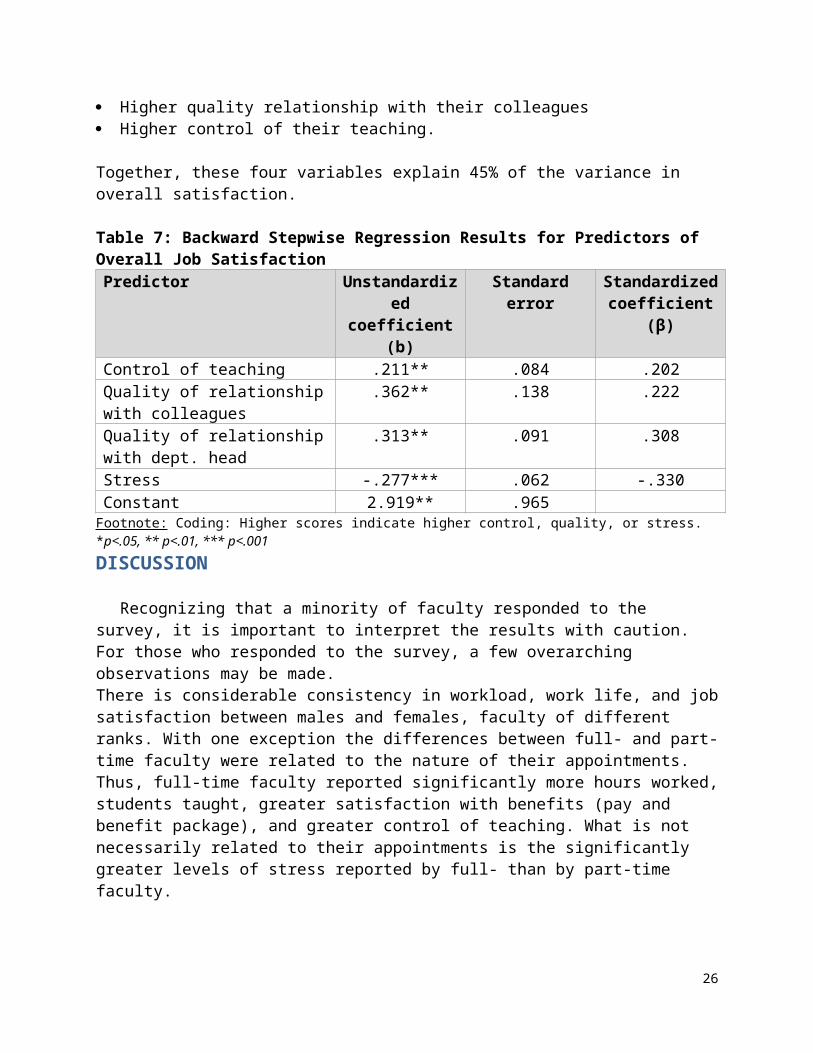
Predictors of Overall Satisfaction:Four of the tested variables proved to be significant predictors of level of satisfaction. In order from
strongest to weakest significant predictors, satisfaction was higher for faculty reporting:
Less stress Higher quality relationship with their department head Higher quality relationship with their colleagues Higher control of their teaching.
Together, these four variables explain 45% of the variance in overall satisfaction.
Table 7: Backward Stepwise Regression Results for Predictors of Overall Job SatisfactionPredictor Unstandardized
coefficient (b)Standard error Standardized
coefficient (β)Control of teaching .211** .084 .202Quality of relationship with colleagues .362** .138 .222Quality of relationship with dept. head .313** .091 .308Stress -.277*** .062 -.330Constant 2.919** .965
Footnote: Coding: Higher scores indicate higher control, quality, or stress. *p<.05, ** p<.01, *** p<.001DISCUSSION
Recognizing that a minority of faculty responded to the survey, it is important to interpret the results with caution. For those who responded to the survey, a few overarching observations may be made.
16
There is considerable consistency in workload, work life, and job satisfaction between males and females, faculty of different ranks. With one exception the differences between full- and part-time faculty were related to the nature of their appointments. Thus, full-time faculty reported significantly more hours worked, students taught, greater satisfaction with benefits (pay and benefit package), and greater control of teaching. What is not necessarily related to their appointments is the significantly greater levels of stress reported by full- than by part-time faculty.
The only areas of difference between male and female faculty were in control of teaching and satisfaction with time management. On each of these measures, males scored nearly 1 point higher than females. We considered that these might be related to differences in family responsibilities of male and female respondents; however, when marital status, number of dependents, and time spent on family care were considered, these did not help to explain the differences in these two scores.
Overall, the similarities in results by sex, rank and full- or part-time status differ from what is reported in the literature. This might reflect a difference in the situation of faculty and the university environment between Canada and the countries where most of the published research originates. Alternatively, it may be a result of the nonrepresentativeness or size of the sample available for analysis at the University of Windsor.
The full-time faculty who responded to the survey carry a heavy workload, reporting considerably more hours than encompassed in a regular 40-hour-work-week. The balance of their workload between teaching, research, and service does not match the guidelines of 40% for teaching, 40% for research, and 20% for service. Rather, over 60% of time was spent on teaching, 14-20% on research, and 18-24% on service with the latter primarily service to the university (variations depend on whether the mean or median number of hours are used in this calculation). While less time might be spent on teaching-related tasks during spring and summer and more on research, this still does not produce a 40-40-20 balance.
Considering the areas of faculty work-life examined in this research, most faculty appear to be above the mid-point of scales that measure quality of the campus environment, quality of collegiality, administrator support, and control of teaching and research, with scores on the various satisfaction measures also clustered toward the higher end of the scales. However, also clustered toward the high end of the scale is reported experiences of stress. The latter is important to consider since it is also the strongest predictor of job satisfaction, with those experiencing higher stress also experiencing lower job satisfaction. For the faculty who responded to this survey, job satisfaction, a key focus of this study, was influenced most strongly by levels of stress. Besides, stress, collegiality – both relations with colleagues and with department heads – also demonstrated a significant, and the second strongest, influence on job satisfaction. The final variable to influence satisfaction was control of teaching. This is not surprising given that, on average, faculty spend 61% of their time teaching. Those who feel they have greater control of this major part of their work-life – specifically control of the courses they taught, time spent in teaching and teaching-related activities, the content of their courses, and the number of students they taught – reported greater job satisfaction. These results are consistent with much of the published literature which identifies job characteristics (control of teaching), workplace relationships or collegiality, and stress as significant influences on job satisfaction.
Given the importance of stress for job satisfaction, the results for the analysis of influences on stress may provide further insight into influences on job satisfaction. The most important influence on stress was whether a faculty member worked full- or part-time with the difference already discussed in stress levels proving to be the most important predictor of stress level. This is followed by satisfaction with work-life balance, time-management, and the campus environment (e.g., quality of office and classroom space). The first two of these are related to the workload of faculty – already noted as both high and not matching the
17
40-40-20 balance between teaching-research-service presented as a guideline -- and the latter to where faculty members perform most of their work. Finally, age is the only demographic or personal characteristic that retained a significant influence on either stress or job satisfaction. Here we see that stress is greater for younger than older faculty, a factor that may be related to stage of career with younger faculty working to establish themselves as teachers and researchers and facing tenure and promotion reviews while older faculty are already established.
We hesitate to make recommendations or draw conclusions based on this small, nonrepresentative sample. However, given the consistency of the results of our multivariate analyses examining influences on stress and on job satisfaction with those based on larger studies with better samples that are already documented in the literature, we will make some suggestions. First, stress, collegiality, and teaching appear to be the major factors influencing job satisfaction among full- and part-time faculty at the University of Windsor. This suggests that attention should be paid to policies and activities that can contribute to collegiality both in terms of relations with colleagues and with department heads and also to teaching. At least during the fall, and likely winter terms, faculty spend the vast majority of their time on teaching. Enhancing their control of teaching through course selection, scheduling, course content, and size of classes will contribute to satisfaction. Considering that time-management and work-life balance figure prominently as influences on stress, policies to improve control of teaching may also indirectly influence stress levels in a beneficial manner. Finally, cutbacks in campus maintenance that leave classrooms and offices less than clean and furniture and equipment in less than good repair in some areas of campus contribute to both stress and job dissatisfaction. While savings are important to improve the financial standing of the University, there is a toll that is paid in the form of faculty dissatisfaction when savings leave areas of the campus in an undesirable state.
Students in the 46/48-507-508 course learned a great deal about survey research methods in conducting this exercise. Since this course is scheduled to be taught annually, perhaps the university community can consider the benefits that could accrue from having students in this course apply their annual survey research project to investigating other areas of interest, concern, or curiosity for units or groups at the University of Windsor. Potential participants in future research might also consider the benefits of having more robust and trustworthy results that would result in a greater number of those invited to participate in a survey such as this taking the time to participate.
18
REFERENCES
Alexandros-Stamatios, G. A., Matilyn, J.D., & Cary, L.C. (2003). Occupational stress, jobsatisfaction and health state in male and female junior hospital doctors in Greece. Journal of
Managerial Psychology, 18(6), 592-621.
August, L. & Waltman, J. (2004). Culture, climate, and contribution: Career satisfaction among female faculty. Research in Higher Education, 45(2), 177 – 192.
Bilimoria, D., Perry, S. R., Liang, X., Stoller, E. P., Higgins, P., & Taylor, C. (2006). How do female and male faculty members construct job satisfaction? The roles of perceived institutional leadership and mentoring and their mediating processes. Journal of Technology Transfer, 31(3), 355-365.
Bozeman, B. & Gaughan, M. (2011). Job satisfaction among university faculty: Individual, work, and institutional determinants. Journal of Higher Education, 82(2), 154-186.
Brown, J. C. (2007). Full and part time employee stress and job satisfaction at two upstate New York colleges. (Doctoral dissertation). Retrieved from ProQuest Dissertations
Catano, V., Francis, L., Haines, T., Kirpalani, H., Shannon, H., Stringer, B., & Lozanzki, L.(2010). Occupational stress in Canadian universities: A National survey. International Journal of Stress Management, 17(3), 232-258.
Cetin, M. O. (2006). The relationship between job satisfaction, occupational and organizational commitment of academics. Journal of American Academic of Business, Cambridge, 8(1), 78-88.
Cropsey, K.L. , Masho, S. W., Shiang, R., Sikka, V., Kornstein, S.G., & Hampton, C.L. (2008). Why do faculty leave? Reasons for attrition of women and minority faculty from a medical school: Four-year results. Journal of Women’s Health, 17(7), 1111-1118.
Durham, S., Merritt, J., & Sorrell, J. (2007). Implementing a new faculty workload formula. Nursing Education Perspectives, 28(4), 184-189.
Happ, A. C. & Yoder, E. P. (1991). Stress, job satisfaction and the community college faculty. Paper presented at the Annual Meeting of the American Education Research Association. Chicago, IL.
Hagedorn, L S (1996). Wage equity and female faculty job satisfaction: The role of wage differentials in a job satisfaction causal model. Research in Higher Education, 37(5), 569-598.
Horton, S. (2007). High aspirations: Differences in employee satisfaction between university faculty and staff. Applied Research in Quality of Life 1, 315–322. DOI 10.1007/s11482-007-9023-5
Keashly, L. & Neuman, J. (2010). Faculty experiences with bullying in higher education: Causes, consequences, and management. Administrative Theory & Praxis, 32(1), 48-70.
Liu, X. S. & Ramsey, J. (2008). Teachers job satisfaction: Analyses of the teacher follow-up survey in the United States for 2000–2001. Teaching and Teacher Education, 24, 1173–1184.
19

Mamiseishvili, K. & Rosser, V. J. (2010). Examining the relationship between faculty productivity and job satisfaction. The Journal of the Professoriate, 5(2), 100-132.
Maynard, D C. (2008). Are all part-time faculty underemployed? The influence of faculty status preference on satisfaction and commitment. Higher Education, 55(2), 139-154.
Myers, C B. (2011) Union status and faculty job satisfaction: Contemporary evidence from the 2004national study of postsecondary faculty. The Review of Higher Education, 34(4) 657.
Olsen, D. & Near, J., (1994). Role conflict and faculty life satisfaction. The Review of Higher Education, 17(2), 179-195
Ponjuan, L., Martin Conley, V., and Trower, C. (2011). Career stage differences in pre-tenure track faculty perceptions of professional and personal relationships with colleagues. The Journal of High Education, 82(3), 319-346.
Porter, S. R. (2007). A closer look at faculty service: What affects participation on committees? The Journal of Higher Education, 78(5), 523-541.
Romig, B., O’Sullivan Maillet, J., & Denmark, R. M. (2011). Factors affecting allied health faculty job satisfaction. Journal of Allied Health, 40(1), 3-14.
Sabharwal, M. & Corley, E. A. (2009). Faculty job satisfaction across gender and discipline. The Social Science Journal, 46, 539-556.
Sanders, K., Willemsen, T. M., & Millar, C. (2008). Views from above the glass ceiling: Does the academic environment influence women professor’s careers and experiences? Sex Roles, 60, 301-312. doi: 10.1007/s11199-008-9547-7.
Schults, N. (2007). Balancing faculty careers and family work: Tenure-track women’s perceptions of and experiences with work/family issues and their relationships to job satisfaction. Ph.D. dissertation, Bowling Green State University, United States of America, Ohio. Retrieved March 2, 2012 from, http://etd.ohiolink.edu/send-pdf.cgi/Schultz%20 Nicole%20J.pdf?bgsu1182799118
Shanafelt, T.D., West, C.P., Sloan, J.A., Novotny, P.J., Poland, G.A., Menaker, R., & Dyrbye, L.N. (2009). Career fit and burnout among academic faculty. Archives of Internal Medicine, 169(10), 990-995.
Seifert, T. A. & Umbach, P. D. (2008). The effects of faculty demographic characteristics and disciplinary context on dimensions of job satisfaction. Research in Higher Education, 49, 357-381.
Track, M. W. & Patitu, C. L. (1992a). Faculty job satisfaction: Women and minorities in peril. ERIC Digest. ERIC Digests, 1-6
Track, M. W. & Patitu, C. L. (1992b). ASHE-ERIC higher education report no. 4. Washington, DC: Association for the Study of Higher Education.
Vardis, I. (2009). The impacts of different types of workload allocation models on academic satisfaction and working life. High Education 57, 499-508.
Vito, M. M. (2007). The impact of faculty-student interaction outside the classroom on faculty
20

satisfaction, engagement, and retention. Ed.D. dissertation, Northern Arizona University, 2007. Retrieved December 12, 2011, from Dissertations & Theses: Full Text.(Publication No. AAT 3273748).
Winefield, A. H., Gillespie, N., Stough, C., Dua, J., Hapuarachchi, J., & Boyd, C. (2003).Occupational stress in Australian university staff: Results from a national survey. International Journal of Stress Management, 10(1), 51-63.
21
QUESTIONNAIRE - FACULTY WORK LIFE 2012
This section explores your day-to-day activities as a faculty member.
Thinking of a typical or average week during the fall 2011 academic term, how many hours did you spend:
Please write the number of hours for each task in the boxes provided.
Q1 Preparing to teach your courses.
Q2 In classroom teaching.
Q3 Grading student work.
Q4 Supervising students.
Q5 Meeting with students.
Q6 Informally discussing academic work with colleagues
Q7 Communicating electronically with students
Q8 Performing community service
Q9 Performing service to your department &/or university (e.g. committee work).
Q10 Performing service to your profession (e.g. reviewing grant proposals or articles, editorial boards, professional organizations).
Q11 On your own research (including writing proposals, papers, & presentations & conducting research).
Q12 Working on campus.
Q13 Caring for your family (e.g., caring for a dependent child, parent, or spouse).
22

Q14 Were you on a leave of absence (e.g., sabbatical, maternity, long term sick leave) during the fall 2011 term?YesNo
Q15 What is the total number of students you taught in the fall 2011 term?
Q16 How many students were in your largest class in the fall 2011 term?
Q17 Are you currently on a leave of absence (e.g., sabbatical, maternity, long term sick leave)?YesNo
Q18 How many graduate courses are you teaching in the 2011-2012 academic year?
Q19 How many undergraduate courses are you teaching in the 2011-2012 academic year?
Thinking of a typical month during the fall 2011 term, how often did you experience stress related to:Several times a week
Once a week
A few times a month but less
than once a week
Once a month at
most
Rarely or
never
Not applicabl
e
I decline to
answer
Q20 Teaching
Q21 Your research
Q22 Activities related to service to your department, university, &/or profession
Q23 Your workload overall
Q24 Overall, on a scale of 0 to 10 where 0 is none and 10 is very high, how would you rate the level of stress you experience on a weekly basis in relation to some aspect of your job?
0 12345678910I decline to answer
On a scale of 0 to 5 where 0 indicates no control and 5 full control how much personal control do you have over:0 - no control
1 2 3 4 5 - full control
not applica
ble
I decline
to answer
23
Q30 The total time you spend on teaching and teaching-related activities.
Q31 The content of your courses.
Q32 The number of students you teach.
Q33 The courses you teach.
Q34 The total time you spend on research.
Q35 The content or topic of your research.
Q36 The total time you spend on university and professional service activities.
Q37 The type of service you provide to the university and profession.
How would you rateExcellent Very
goodGood Fair Poor Not
applicableI decline
to answer
Q38 The quality (e.g., the paint, furnishings, cleanliness) of your office?
Q39 The quality (e.g., the paint, furnishings, cleanliness) of the classrooms you teach in this term?
Q40 The quality (e.g., the paint, furnishings , cleanliness) of the campus overall?
Q41 The teaching supports available in the average classroom where you teach this term?
Q42 How would you rate your overall job satisfaction?0 = not at all satisfied; 10= very satisfied
012345678910I decline to answer
24
What is your level of satisfaction with:Not
applicableVery
satisfiedSomewhat satisfied
Neither satisfied
nor unsatisfied
Somewhat unsatisfied
Very un satisfied
Decline to
answer
Q43 The way you spend your time as a faculty member.
Q44 The level of courses you teach.
Q45 The number of courses you teach.
Q46 The discretion you have over the content of the courses you teach.
Q47 The number of students you teach.
Q48 The quality of the undergraduate students with whom you interact.
Q49 The quality of facilities (i.e., office ,labs, classrooms).Q50 The amount of access you have to graduate and teaching assistants.
Q51 The amount of access you have to research services.
Q52 The amount of access you have to teaching services.Q53 The amount of access you have to administrative/clerical support.Q54 The quality of clerical/administrative services.
Q55 The quality of research services.
Q56 The quality of teaching services.
Q57 The amount of time you have to complete teaching-related tasks.
Q58 The amount of time you have for your research.Q59 The amount of time you have for service to university and administrative work.
25
What is your level of agreement with the following?Not
applicableStrongly agree
agree Neither agree nor
disagree
disagree Strongly disagree
I decline to
answer
Q60 The University does what it can to make family care-giving (e.g., caring for a dependent child, parent, or spouse) compatible with being a faculty member.
Q61 My departmental colleagues do what they can to make family care-giving (e.g., caring for a dependent child, parent, or spouse) compatible with being a faculty member.
Q62 How would you describe the quality of collegial relations within your department?PoorSatisfactoryGoodExcellentI don't knowI decline to answer
What is your level of agreement with the following?Strongly disagree
Disagree Neither disagree or agree
Agree Strongly agree
decline to
answer
Q63 When I have a problem at work I can freely discuss it with my colleagues.
Q64 When I have a problem at work I can freely discuss it with my department head.
Q65 No one in my department would deliberately act in a way that undermines my efforts.Q66 I ‘fit’ in my department.
Q66a I am excluded from informal networking in my department.Q67 I am comfortable asking for help from my colleagues.
Q68 My colleagues come to me for advice.
Q69 I am happy working with the people in my department.
Q70 When a colleague and I disagree, we can discuss our disagreement amicably.
Q71 When my department head and I disagree, we can discuss our disagreement amicably.Q72 There is a feeling of collegiality in my department.
26
What is your level of overall satisfaction withNot
applicableVery
satisfiedSomewh
at satisfied
Neither satisfied nor un
satisfied
Some what
unsatisfied
Very un satisfied
I decline
to answer
Q73 Your professional relationships with colleagues.
Q74 Your professional relationship with your department head.
Q75 The overall quality of your relations with colleagues.
Q76 The balance you have between your work and family life.Q77 The balance you have between your work and social life.Q78 The level of control you have over your work.
Q79 Your workload overall.
Q80 The salary you receive.
Q81 Your benefit package.
Q82 Your level of job security.
How much do you agree or disagree with the following?Strongly Disagree
Disagree Neither disagree nor agree
Agree Strongly agree
I decline to answer
Q83 Senior management shows a genuine interest in the well-being of faculty.
Q84 People at this university are supportive of their colleagues regardless of their heritage or background.
Q85 The university's policies and practices give me the flexibility to manage my personal and family life.
Q86 Senior management communicates openly about important matters.Q87 The overall appearance of the campus is pleasing.
Q88 The university takes reasonable steps to provide a safe and secure environment on campus.
Q89 The faculty association does a good job representing my interests.Q90 There's a sense that we're all on the same team.
Q100 This university is well run.
27
Next we have some questions about you
Responses to questions in this section that might make it possible to identify you will be coded to preserve your anonymity.
Q101 Are you:MaleFemaleOtherI decline to answer
Q102 What is your age?24 or under25 - 3435 - 4445 - 5455 - 6465 - 7475 or aboveI decline to answer
Q103 Are you married or in a marriage-like relationship?YesNoI decline to answer
Q104 Does your spouse or partner live in Windsor/Essex county?YesNoI decline to answer
Q105 How many dependent children do you have?
Q106 How many dependents, other than children (e.g., parent, spouse), do you have?
Q107 What is the position that you currently hold at the University of Windsor?Tenured faculty memberTenure-track faculty memberFaculty member with limited-term appointmentSessional faculty memberOtherI decline to answer
Q108 What is your rank?ProfessorAssociate professorAssistant professorLecturerOtherI decline to answer
28
29
Q109 What faculty are you in?Arts and Social ScienceScienceLawBusinessNursingEducationHuman KineticsEngineeringI decline to answer
Q110 Are you a part-time or full-time faculty member?Part-TimeFull-TimeI decline to answer
Q111 Would you prefer to have a full-time faculty position?YesNoI decline to answer
Q112 What was the year of your first full-time appointment to a tenure-track position?
Q113 What was your total base annual income from all sources in the year 2011?Less than $45,000$45,000 - $64,999$65,000 - $84,999$85,000 - $104,999$105,000 - $124,999$125,000 - $144,999$145,000 and aboveI decline to answer
Q114 Do you have any comments you would like to share with us?
30