factors predicting the hospital episode costs of emergency medical admissions
TRANSCRIPT
European Journal of Internal Medicine 25 (2014) 633–638
Contents lists available at ScienceDirect
European Journal of Internal Medicine
j ourna l homepage: www.e lsev ie r .com/ locate /e j im
Original Article
Factors predicting the hospital episode costs of emergencymedical admissions
Conor Lahiff a, Seán Cournane b,⁎, Donnacha Creagh c, Brian Fitzgerald d, Richard Conway a,Declan Byrne a, Bernard Silke a
a Division of Internal Medicine, St. James's Hospital, Dublin 8, Irelandb Medical Physics and Bioengineering Department, St. James's Hospital, Dublin 8, Irelandc Information Management Systems, St. James's Hospital, Dublin 8, Irelandd Office of the CEO, St. James's Hospital, Dublin 8, Ireland
⁎ Corresponding author. Tel.: +353 1 416 2833; fax: +E-mail address: [email protected] (S. Cournane).
http://dx.doi.org/10.1016/j.ejim.2014.06.0040953-6205/© 2014 European Federation of Internal Medi
a b s t r a c t
a r t i c l e i n f oArticle history:
Received 18 April 2014Received in revised form 28 May 2014Accepted 5 June 2014Available online 23 June 2014Keywords:Acute medical patientsHospital costsQuantile regressingOutcome
Background: Important outcome predictor variables for emergency medical admissions are the ManchesterTriage Category, Acute Illness Severity, Chronic Disabling Disease and Sepsis Status. We have examined whetherthese are also predictors of hospital episode costs.Methods:All patients admitted asmedical emergencies between January 2008 and December 2012were studied.Costs per case were adjusted by reference to the relative cost weight of each diagnosis related group (DRG) butincluded all pay costs, non-pay costs and infra-structural costs. We used a multi-variate logistic regression withgeneralized estimating equations (GEE), adjusted for correlated observations, to model the prediction of out-come (30-day in-hospital mortality) and hospital costs above or below themedian.We used quantile regressionto model total episode cost prediction over the predictor distribution (quantiles 0.25, 0.5 and 0.75).Results: The multivariate model, using the above predictor variables, was highly predictive of an in-hospital
death-AUROC of 0.91 (95% CI: 0.90, 0.92). Variables predicting outcome similarly predicted hospital episodecost; however predicting costs above or below the median yielded a lower AUROC of 0.73 (95% CI: 0.73, 0.74).Quantile regression analysis showed that hospital episode costs increased disproportionately over the predictordistribution; ordinary regression estimates of hospital episode costs over estimated the costs for low risk andunder estimated those for high-risk patients.Conclusion: Predictors of outcome also predict costs for emergencymedical admissions; however, due to costingdata heteroskedasticity and the non-linear relationship between dependant and predictor variables, the hospitalepisode costs are not as easy to predict based on presentation status.© 2014 European Federation of Internal Medicine. Published by Elsevier B.V. All rights reserved.
1. Introduction
Finance has become an increasingly important aspect of themodernmedical landscape. Spiralling general healthcare costs coupled withnew and effective but increasingly expensive treatments has driventhe cost of healthcare provision to ever increasing heights [1]. The globalfinancial crisis of recent years has given rise to a reevaluation ofhealthcare spending [2]. While understandably emotive and oftencriticised these assessments of value are essential to the future ofsustainable healthcare [3]. The estimation of costs is well developed incertain areas such as medication use [4]; however, in the prediction ofcost of acute medical care it is less well defined. Identification of thekey factors predicting the cost of hospital admissions is essential toenable appropriate targeting of cost reductions.
353 1 410 3478.
cine. Published by Elsevier B.V. All rig
AnAcuteMedical AdmissionUnit (AMAU)was established in our in-stitution in 2003. We have previously evaluated the outcomes of theAMAU [5–7] with a 60% reduction in in-hospital mortality witnessedover this 10-year period from 14.5% to 5.7% [6]. Much of the academiceffort has focused on understanding factors impacting inpatient out-comes following an emergencymedical admission and themodificationof these factors to improve care. Major mortality outcome predictorsidentified include Acute Illness Severity Score [8–13], Chronic DisablingDisease Score [14–16], Charlson Co-Morbidity Index [17], ManchesterTriage Category [18], and Sepsis Status.
A recent innovation for hospital practice in the Republic of Ireland isthe proposal thatMoney Follows the Patient (MFTP), by the use of a casebased funding model, weighted for Diagnosed Related Groups (DRG's).This initiative gives access, from 2008 onwards, to hospital in-patientcosts by episode. With the increased focus on costs, consequent on theausterity imposed by financial circumstances, we have investigatedthe extent to which the factors predicting clinical outcomes might alsodrive hospital episode costs. We have utilised a large database detailing
hts reserved.
634 C. Lahiff et al. / European Journal of Internal Medicine 25 (2014) 633–638
all emergency medical admissions to determine whether predictors ofoutcome would also predict episode cost.
2. Methods
2.1. Study setting
St James's Hospital (SJH) serves as a secondary care centre foremergency admissions for its local catchment area of 270,000 adults,operating a continuous sectorized acute general ‘take’ with patientsdirected towards surgical ormedical specialties. Emergencymedical pa-tients are admitted from the ED to an AMAU; its 59-bed capacity is suchthat up to 70% of all admissions could be predicted to receive their entirehospital care within the maximum permitted stay of 5 days in AMAU.Patients are not triaged to specialties or dispersed towards until theiracute illness has been stabilised. The operation and outcome of theAMAU [5,6] have been previously reported.
2.2. Data collection
An anonymous patient database has been created assembling coreepisodic information from the patient administration system, the na-tional hospital in-patient enquiry (HIPE) scheme, the patient electronicrecord and other laboratory IT systems. HIPE is a national database ofcoded discharge summaries from acute public hospitals in Ireland [19]having used the International Classification of Diseases, Ninth Revision,Clinical Modification (ICD-9-CM) from 1990 to 2005 and ICD-10-CMsince. The database includes the unique hospital number, admittingconsultant, date of birth, gender, area of residence by county, principaldiagnosis, up to nine additional secondary diagnoses, procedures andadmission and discharge dates. Additional information cross-linkedand available for analyses includes physiological, haematological andbiochemical parameters. The HIPE dataset has up to six fields of codeddiseases recorded at time of discharge/death, together with proceduresand investigations undertaken during the hospital stay. Data was relat-ed to all emergency medical patients admitted between January 1st2008 and 31st December 2012, including patients admitted to theIntensive Care Unit (ICU) or High Dependency Unit (HDU) but exclud-ing patients with acute ischaemic coronary disease, admitted directlyunder a specialist cardiology team.
We used the Clinical Classifications Software (CCS) for ICD-9-CM – adiagnosis and procedure categorization scheme – to collapse the(N14,000 diagnosis codes) ICD-9-CM'smultitude of codes into a smallernumber (approx 240) of clinically meaningful categories that are moreuseful for presenting descriptive statistics than are individual ICD-9-CM codes. For example, CCS can be used to identify populations fordisease- or procedure-specific studies or to develop statistical reportsproviding information (such as charges and length of stay) aboutrelatively specific conditions.
2.3. Outcome predictors
Disturbance of haemodynamic and physiological admission parame-ters may be utilised to predict a clinical outcome [8–11]. We have previ-ously derived an Acute Illness Severity Score, an age adjusted riskestimate, representing an aggregate laboratory score based on the ad-mission serum sodium, serum potassium, serum urea, red cell distribu-tion width, white blood cell count, serum albumin and troponin values[12,13]. The score derives from the principle of physiological homeosta-sis, with the expectation of maintenance of a stable internal milieu anddeviation from the normal equilibrium indicating the expected risk ofadverse outcome [13]. Blood culture requests were recorded alongwith a result. An urgent blood culture was one performed within 48 hof admission. Sepsiswas defined by three categories 1) no request duringthe admission 2) request but blood culture report negative and 3) culturerequest and positive result.
While life expectancy has increased by 4.0 and 2.6 years for malesand females respectively between 1970 and 2010, the time spent with‘disabling’ conditions has increased by 9.2 and 9.4 years, respectively,over this period [14]. This is based on a definition of ‘chronic disablingcondition’ as proposed by theUS Department of Health and Human Ser-vices [15] defined as an impairment of an individual's ability to functionduring routine daily tasks. While quantity of life has increased full qual-ity of life during these extended years cannot be assumed [16]. TheChronic Disabling Disease Score allocated one point for any singlecode in separate categories of cardiovascular, neurological, gastro-intestinal, diabetes, renal, neoplastic or other coded diseases; the scoreswere summed. Disabling disease is frequently present in our emergencyadmissions with IDC9/ICD10 discharge codes of 1, 2, 3 or 4 separatesystems in 23.3%, 28.7%, 21.9% and 15.5% of episodes, respectively. Thecalculated univariate risk, of an in-hospital death by day 30, gave OR'sof 3.1, 4.8, 7.7 and 14.0 with 1, 2, 3 and 4 disabling codes respectively.
Comorbidity was measured using the Charlson Comorbidity Index[17]. At time of presentation to the ED, patients were categorisedusing theManchester Triage System [18]: thesewere Category 1 (resus-citation), Category 2 (very urgent), Category 3 (urgent), Category 4(standard) and Category 5 (non-emergency).
2.4. Hospital costings
The Republic of Ireland proposes to introduce aMFTP system, a case-based funding model with DRG's, comparing hospital costs, quality andefficiency. The calculation of costs per case is adjusted by reference tothe relative cost weight of each DRG and encompasses all costs appro-priately associated with the delivery of that care including: 1) Paycosts, 2) non-pay costs — such as drugs, blood, medical and surgicalsupplies, radiology, laboratory equipment and supplies, heat, light &power and 3) costs of diagnostics, medical services, theatres, laborato-ries, wards and overhead allocations as appropriate.
The hospital uses a number of standard accounting costingmethod-ologies. The predominant approaches used in this exercisewere ActivityBased Costing and Absorption Costing [20,21]. Bothmethods are used inparallel to cost individual patient episodes of care by directly linkingcost to patient clinical data (e.g. laboratory and radiology tests, inpatientbeds, day). The accuracy of the costing is greatly enhanced because thehospital has utilised a robust devolved accounting and budgetaryframework since 2004. The financial data is validated by externallyaudited annual Financial Statements; in addition strong relationshipsbetween costing and clinical risk profile/outcomes data suggest thatthe financial calculations provide a realistic view of the costs of careprovision.
2.5. Statistical methods
Descriptive statistics were calculated for background demographicdata, including means/standard deviations (SD), medians/interquartileranges (IQR), or percentages. Comparisons between categorical variablesand mortality were made using chi-square tests. Significant predictorsfrom the univariate analyses were entered into a multivariable logisticregression model, using fractional polynomials for all continuous mea-sures, for examining non-linear associations. The method proposed bySauerbrei [22] was applied, to investigate non-linear functional relation-ships based on fractional polynomials and the combination of linear andnon-linear predictor variables with backward elimination. We used theHosmer and Lemeshow test for goodness-of-fit where non-significantdepartures between observed and predicted outcomes (p N 0.05)indicate an acceptable model fit (Hosmer–Lemeshow chi2 (10) 8.5:p = 0.58). For mortality and including all episodes, we employed ageneralized estimating equations (GEE) logistic model to allow forcorrelated observations (readmissions). Taking account of clusteringin the data allows better characterization of the variability of covar-iates; robust standard errors, in the GEE model, are derived using the
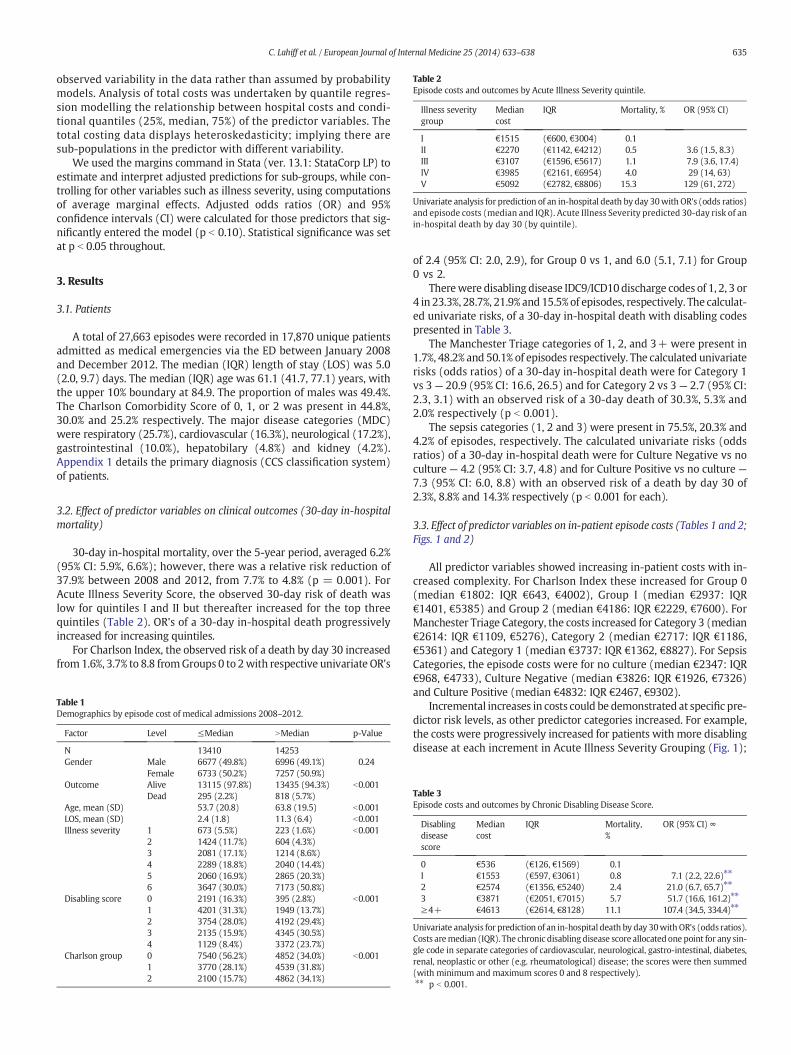
Table 2Episode costs and outcomes by Acute Illness Severity quintile.
Illness severitygroup
Mediancost
IQR Mortality, % OR (95% CI)
I €1515 (€600, €3004) 0.1II €2270 (€1142, €4212) 0.5 3.6 (1.5, 8.3)III €3107 (€1596, €5617) 1.1 7.9 (3.6, 17.4)IV €3985 (€2161, €6954) 4.0 29 (14, 63)V €5092 (€2782, €8806) 15.3 129 (61, 272)
Univariate analysis for prediction of an in-hospital death by day 30with OR's (odds ratios)and episode costs (median and IQR). Acute Illness Severity predicted 30-day risk of anin-hospital death by day 30 (by quintile).
635C. Lahiff et al. / European Journal of Internal Medicine 25 (2014) 633–638
observed variability in the data rather than assumed by probabilitymodels. Analysis of total costs was undertaken by quantile regres-sion modelling the relationship between hospital costs and condi-tional quantiles (25%, median, 75%) of the predictor variables. Thetotal costing data displays heteroskedasticity; implying there aresub-populations in the predictor with different variability.
We used the margins command in Stata (ver. 13.1: StataCorp LP) toestimate and interpret adjusted predictions for sub-groups, while con-trolling for other variables such as illness severity, using computationsof average marginal effects. Adjusted odds ratios (OR) and 95%confidence intervals (CI) were calculated for those predictors that sig-nificantly entered the model (p b 0.10). Statistical significance was setat p b 0.05 throughout.
3. Results
3.1. Patients
A total of 27,663 episodes were recorded in 17,870 unique patientsadmitted as medical emergencies via the ED between January 2008and December 2012. The median (IQR) length of stay (LOS) was 5.0(2.0, 9.7) days. The median (IQR) age was 61.1 (41.7, 77.1) years, withthe upper 10% boundary at 84.9. The proportion of males was 49.4%.The Charlson Comorbidity Score of 0, 1, or 2 was present in 44.8%,30.0% and 25.2% respectively. The major disease categories (MDC)were respiratory (25.7%), cardiovascular (16.3%), neurological (17.2%),gastrointestinal (10.0%), hepatobilary (4.8%) and kidney (4.2%).Appendix 1 details the primary diagnosis (CCS classification system)of patients.
3.2. Effect of predictor variables on clinical outcomes (30-day in-hospitalmortality)
30-day in-hospital mortality, over the 5-year period, averaged 6.2%(95% CI: 5.9%, 6.6%); however, there was a relative risk reduction of37.9% between 2008 and 2012, from 7.7% to 4.8% (p = 0.001). ForAcute Illness Severity Score, the observed 30-day risk of death waslow for quintiles I and II but thereafter increased for the top threequintiles (Table 2). OR's of a 30-day in-hospital death progressivelyincreased for increasing quintiles.
For Charlson Index, the observed risk of a death by day 30 increasedfrom1.6%, 3.7% to 8.8 fromGroups 0 to 2with respective univariate OR's
Table 1Demographics by episode cost of medical admissions 2008–2012.
Factor Level ≤Median NMedian p-Value
N 13410 14253Gender Male 6677 (49.8%) 6996 (49.1%) 0.24
Female 6733 (50.2%) 7257 (50.9%)Outcome Alive 13115 (97.8%) 13435 (94.3%) b0.001
Dead 295 (2.2%) 818 (5.7%)Age, mean (SD) 53.7 (20.8) 63.8 (19.5) b0.001LOS, mean (SD) 2.4 (1.8) 11.3 (6.4) b0.001Illness severity 1 673 (5.5%) 223 (1.6%) b0.001
2 1424 (11.7%) 604 (4.3%)3 2081 (17.1%) 1214 (8.6%)4 2289 (18.8%) 2040 (14.4%)5 2060 (16.9%) 2865 (20.3%)6 3647 (30.0%) 7173 (50.8%)
Disabling score 0 2191 (16.3%) 395 (2.8%) b0.0011 4201 (31.3%) 1949 (13.7%)2 3754 (28.0%) 4192 (29.4%)3 2135 (15.9%) 4345 (30.5%)4 1129 (8.4%) 3372 (23.7%)
Charlson group 0 7540 (56.2%) 4852 (34.0%) b0.0011 3770 (28.1%) 4539 (31.8%)2 2100 (15.7%) 4862 (34.1%)
of 2.4 (95% CI: 2.0, 2.9), for Group 0 vs 1, and 6.0 (5.1, 7.1) for Group0 vs 2.
Therewere disabling disease IDC9/ICD10discharge codes of 1, 2, 3 or4 in 23.3%, 28.7%, 21.9% and 15.5%of episodes, respectively. The calculat-ed univariate risks, of a 30-day in-hospital death with disabling codespresented in Table 3.
The Manchester Triage categories of 1, 2, and 3+ were present in1.7%, 48.2% and 50.1% of episodes respectively. The calculated univariaterisks (odds ratios) of a 30-day in-hospital death were for Category 1vs 3— 20.9 (95% CI: 16.6, 26.5) and for Category 2 vs 3— 2.7 (95% CI:2.3, 3.1) with an observed risk of a 30-day death of 30.3%, 5.3% and2.0% respectively (p b 0.001).
The sepsis categories (1, 2 and 3) were present in 75.5%, 20.3% and4.2% of episodes, respectively. The calculated univariate risks (oddsratios) of a 30-day in-hospital death were for Culture Negative vs noculture — 4.2 (95% CI: 3.7, 4.8) and for Culture Positive vs no culture —
7.3 (95% CI: 6.0, 8.8) with an observed risk of a death by day 30 of2.3%, 8.8% and 14.3% respectively (p b 0.001 for each).
3.3. Effect of predictor variables on in-patient episode costs (Tables 1 and 2;Figs. 1 and 2)
All predictor variables showed increasing in-patient costs with in-creased complexity. For Charlson Index these increased for Group 0(median €1802: IQR €643, €4002), Group I (median €2937: IQR€1401, €5385) and Group 2 (median €4186: IQR €2229, €7600). ForManchester Triage Category, the costs increased for Category 3 (median€2614: IQR €1109, €5276), Category 2 (median €2717: IQR €1186,€5361) and Category 1 (median €3737: IQR €1362, €8827). For SepsisCategories, the episode costs were for no culture (median €2347: IQR€968, €4733), Culture Negative (median €3826: IQR €1926, €7326)and Culture Positive (median €4832: IQR €2467, €9302).
Incremental increases in costs could be demonstrated at specific pre-dictor risk levels, as other predictor categories increased. For example,the costs were progressively increased for patients with more disablingdisease at each increment in Acute Illness Severity Grouping (Fig. 1);
Table 3Episode costs and outcomes by Chronic Disabling Disease Score.
Disablingdiseasescore
Mediancost
IQR Mortality,%
OR (95% CI) ∞
0 €536 (€126, €1569) 0.1I €1553 (€597, €3061) 0.8 7.1 (2.2, 22.6)⁎⁎
2 €2574 (€1356, €5240) 2.4 21.0 (6.7, 65.7)⁎⁎
3 €3871 (€2051, €7015) 5.7 51.7 (16.6, 161.2)⁎⁎
≥4+ €4613 (€2614, €8128) 11.1 107.4 (34.5, 334.4)⁎⁎
Univariate analysis for prediction of an in-hospital death by day 30with OR's (odds ratios).Costs aremedian (IQR). The chronic disabling disease score allocatedone point for any sin-gle code in separate categories of cardiovascular, neurological, gastro-intestinal, diabetes,renal, neoplastic or other (e.g. rheumatological) disease; the scores were then summed(with minimum and maximum scores 0 and 8 respectively).⁎⁎ p b 0.001.
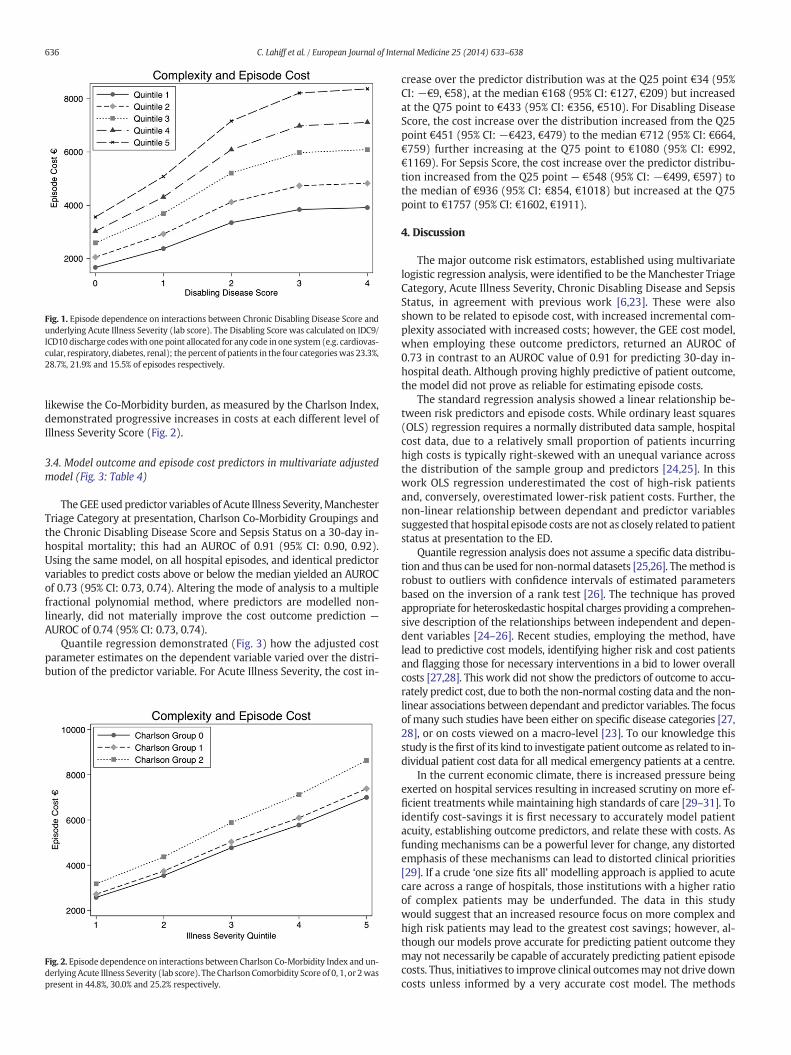
Fig. 1. Episode dependence on interactions between Chronic Disabling Disease Score andunderlying Acute Illness Severity (lab score). The Disabling Score was calculated on IDC9/ICD10 discharge codeswith one point allocated for any code in one system (e.g. cardiovas-cular, respiratory, diabetes, renal); the percent of patients in the four categorieswas 23.3%,28.7%, 21.9% and 15.5% of episodes respectively.
636 C. Lahiff et al. / European Journal of Internal Medicine 25 (2014) 633–638
likewise the Co-Morbidity burden, as measured by the Charlson Index,demonstrated progressive increases in costs at each different level ofIllness Severity Score (Fig. 2).
3.4. Model outcome and episode cost predictors in multivariate adjustedmodel (Fig. 3: Table 4)
TheGEE used predictor variables of Acute Illness Severity,ManchesterTriage Category at presentation, Charlson Co-Morbidity Groupings andthe Chronic Disabling Disease Score and Sepsis Status on a 30-day in-hospital mortality; this had an AUROC of 0.91 (95% CI: 0.90, 0.92).Using the same model, on all hospital episodes, and identical predictorvariables to predict costs above or below the median yielded an AUROCof 0.73 (95% CI: 0.73, 0.74). Altering the mode of analysis to a multiplefractional polynomial method, where predictors are modelled non-linearly, did not materially improve the cost outcome prediction —
AUROC of 0.74 (95% CI: 0.73, 0.74).Quantile regression demonstrated (Fig. 3) how the adjusted cost
parameter estimates on the dependent variable varied over the distri-bution of the predictor variable. For Acute Illness Severity, the cost in-
Fig. 2. Episode dependence on interactions between Charlson Co-Morbidity Index and un-derlyingAcute Illness Severity (lab score). The Charlson Comorbidity Score of 0, 1, or 2waspresent in 44.8%, 30.0% and 25.2% respectively.
crease over the predictor distribution was at the Q25 point €34 (95%CI: −€9, €58), at the median €168 (95% CI: €127, €209) but increasedat the Q75 point to €433 (95% CI: €356, €510). For Disabling DiseaseScore, the cost increase over the distribution increased from the Q25point €451 (95% CI: −€423, €479) to the median €712 (95% CI: €664,€759) further increasing at the Q75 point to €1080 (95% CI: €992,€1169). For Sepsis Score, the cost increase over the predictor distribu-tion increased from the Q25 point — €548 (95% CI: −€499, €597) tothe median of €936 (95% CI: €854, €1018) but increased at the Q75point to €1757 (95% CI: €1602, €1911).
4. Discussion
The major outcome risk estimators, established using multivariatelogistic regression analysis, were identified to be theManchester TriageCategory, Acute Illness Severity, Chronic Disabling Disease and SepsisStatus, in agreement with previous work [6,23]. These were alsoshown to be related to episode cost, with increased incremental com-plexity associated with increased costs; however, the GEE cost model,when employing these outcome predictors, returned an AUROC of0.73 in contrast to an AUROC value of 0.91 for predicting 30-day in-hospital death. Although proving highly predictive of patient outcome,the model did not prove as reliable for estimating episode costs.
The standard regression analysis showed a linear relationship be-tween risk predictors and episode costs. While ordinary least squares(OLS) regression requires a normally distributed data sample, hospitalcost data, due to a relatively small proportion of patients incurringhigh costs is typically right-skewed with an unequal variance acrossthe distribution of the sample group and predictors [24,25]. In thiswork OLS regression underestimated the cost of high-risk patientsand, conversely, overestimated lower-risk patient costs. Further, thenon-linear relationship between dependant and predictor variablessuggested that hospital episode costs are not as closely related to patientstatus at presentation to the ED.
Quantile regression analysis does not assume a specific data distribu-tion and thus can be used for non-normal datasets [25,26]. Themethod isrobust to outliers with confidence intervals of estimated parametersbased on the inversion of a rank test [26]. The technique has provedappropriate for heteroskedastic hospital charges providing a comprehen-sive description of the relationships between independent and depen-dent variables [24–26]. Recent studies, employing the method, havelead to predictive cost models, identifying higher risk and cost patientsand flagging those for necessary interventions in a bid to lower overallcosts [27,28]. This work did not show the predictors of outcome to accu-rately predict cost, due to both the non-normal costing data and the non-linear associations between dependant and predictor variables. The focusof many such studies have been either on specific disease categories [27,28], or on costs viewed on a macro-level [23]. To our knowledge thisstudy is thefirst of its kind to investigate patient outcome as related to in-dividual patient cost data for all medical emergency patients at a centre.
In the current economic climate, there is increased pressure beingexerted on hospital services resulting in increased scrutiny on more ef-ficient treatments while maintaining high standards of care [29–31]. Toidentify cost-savings it is first necessary to accurately model patientacuity, establishing outcome predictors, and relate these with costs. Asfunding mechanisms can be a powerful lever for change, any distortedemphasis of these mechanisms can lead to distorted clinical priorities[29]. If a crude ‘one size fits all’ modelling approach is applied to acutecare across a range of hospitals, those institutions with a higher ratioof complex patients may be underfunded. The data in this studywould suggest that an increased resource focus on more complex andhigh risk patients may lead to the greatest cost savings; however, al-though our models prove accurate for predicting patient outcome theymay not necessarily be capable of accurately predicting patient episodecosts. Thus, initiatives to improve clinical outcomesmay not drive downcosts unless informed by a very accurate cost model. The methods
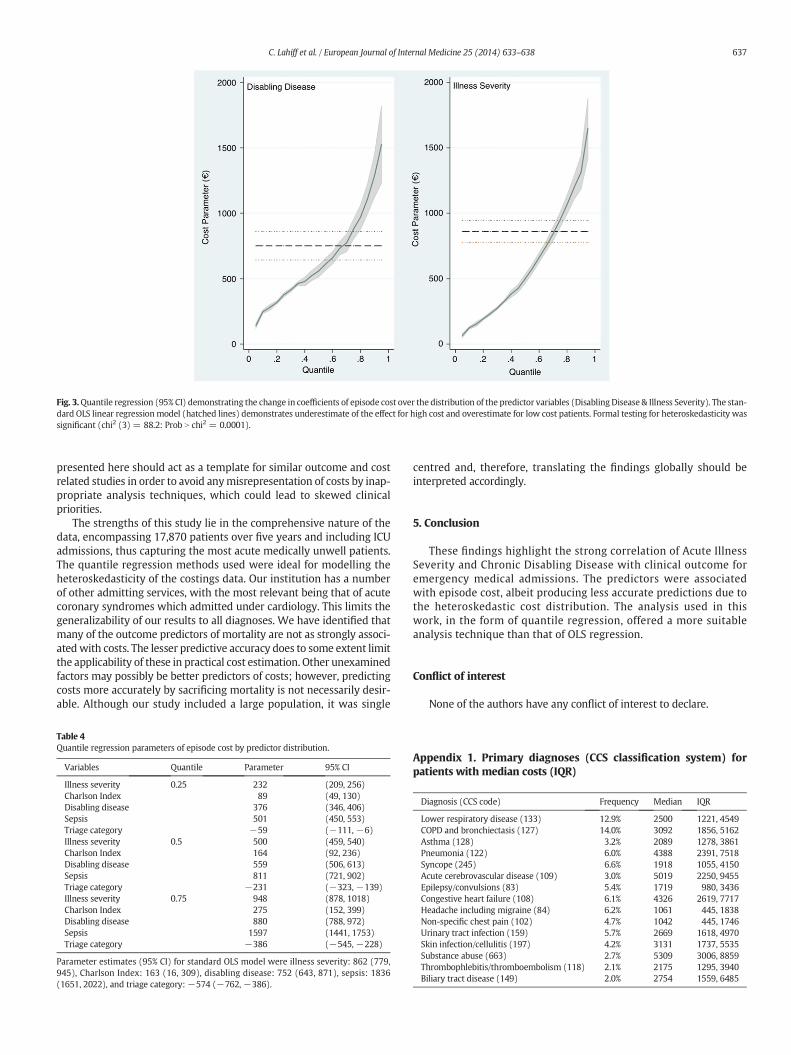
Fig. 3.Quantile regression (95% CI) demonstrating the change in coefficients of episode cost over the distribution of the predictor variables (DisablingDisease & Illness Severity). The stan-dard OLS linear regressionmodel (hatched lines) demonstrates underestimate of the effect for high cost and overestimate for low cost patients. Formal testing for heteroskedasticity wassignificant (chi2 (3) = 88.2: Prob N chi2 = 0.0001).
637C. Lahiff et al. / European Journal of Internal Medicine 25 (2014) 633–638
presented here should act as a template for similar outcome and costrelated studies in order to avoid anymisrepresentation of costs by inap-propriate analysis techniques, which could lead to skewed clinicalpriorities.
The strengths of this study lie in the comprehensive nature of thedata, encompassing 17,870 patients over five years and including ICUadmissions, thus capturing the most acute medically unwell patients.The quantile regression methods used were ideal for modelling theheteroskedasticity of the costings data. Our institution has a numberof other admitting services, with the most relevant being that of acutecoronary syndromes which admitted under cardiology. This limits thegeneralizability of our results to all diagnoses. We have identified thatmany of the outcome predictors of mortality are not as strongly associ-atedwith costs. The lesser predictive accuracy does to some extent limitthe applicability of these in practical cost estimation. Other unexaminedfactors may possibly be better predictors of costs; however, predictingcosts more accurately by sacrificing mortality is not necessarily desir-able. Although our study included a large population, it was single
Table 4Quantile regression parameters of episode cost by predictor distribution.
Variables Quantile Parameter 95% CI
Illness severity 0.25 232 (209, 256)Charlson Index 89 (49, 130)Disabling disease 376 (346, 406)Sepsis 501 (450, 553)Triage category −59 (−111, −6)Illness severity 0.5 500 (459, 540)Charlson Index 164 (92, 236)Disabling disease 559 (506, 613)Sepsis 811 (721, 902)Triage category −231 (−323, −139)Illness severity 0.75 948 (878, 1018)Charlson Index 275 (152, 399)Disabling disease 880 (788, 972)Sepsis 1597 (1441, 1753)Triage category −386 (−545, −228)
Parameter estimates (95% CI) for standard OLS model were illness severity: 862 (779,945), Charlson Index: 163 (16, 309), disabling disease: 752 (643, 871), sepsis: 1836(1651, 2022), and triage category:−574 (−762, −386).
centred and, therefore, translating the findings globally should beinterpreted accordingly.
5. Conclusion
These findings highlight the strong correlation of Acute IllnessSeverity and Chronic Disabling Disease with clinical outcome foremergency medical admissions. The predictors were associatedwith episode cost, albeit producing less accurate predictions due tothe heteroskedastic cost distribution. The analysis used in thiswork, in the form of quantile regression, offered a more suitableanalysis technique than that of OLS regression.
Conflict of interest
None of the authors have any conflict of interest to declare.
Appendix 1. Primary diagnoses (CCS classification system) forpatients with median costs (IQR)
Diagnosis (CCS code) Frequency Median IQR
Lower respiratory disease (133) 12.9% 2500 1221, 4549COPD and bronchiectasis (127) 14.0% 3092 1856, 5162Asthma (128) 3.2% 2089 1278, 3861Pneumonia (122) 6.0% 4388 2391, 7518Syncope (245) 6.6% 1918 1055, 4150Acute cerebrovascular disease (109) 3.0% 5019 2250, 9455Epilepsy/convulsions (83) 5.4% 1719 980, 3436Congestive heart failure (108) 6.1% 4326 2619, 7717Headache including migraine (84) 6.2% 1061 445, 1838Non-specific chest pain (102) 4.7% 1042 445, 1746Urinary tract infection (159) 5.7% 2669 1618, 4970Skin infection/cellulitis (197) 4.2% 3131 1737, 5535Substance abuse (663) 2.7% 5309 3006, 8859Thrombophlebitis/thromboembolism (118) 2.1% 2175 1295, 3940Biliary tract disease (149) 2.0% 2754 1559, 6485
638 C. Lahiff et al. / European Journal of Internal Medicine 25 (2014) 633–638
References
[1] Moses III H, Matheson DH, Dorsey ER, George BP, Sadoff D, Yoshimura S. The anato-my of health care in the United States. JAMA 2013;310:1947–63.
[2] Curfman GD, Morrissey S, Drazen JM. High-value health care— a sustainable propo-sition. N Engl J Med 2013;369:1163–4.
[3] Neumann PJ. What we talk about whenwe talk about health care costs. N Engl J Med2012;366:585–6. http://dx.doi.org/10.1056/NEJMp1200390.
[4] Barry M, Usher C, Tilson L. Public drug expenditure in the Republic of Ireland. ExpertRev Pharmacoecon Outcomes Res 2010;10:239–45.
[5] Rooney T, Moloney ED, Bennett K, O'Riordan D, Silke B. Impact of an acutemedical ad-mission unit on hospitalmortality: a 5-year prospective study. QJM2008;101:457–65.
[6] Conway R, O'Riordan D, Silke B. Long-term outcome of an AMAU—a decade's expe-rience. QJM 2013;107(1):43–9.
[7] Byrne D, Silke B. Acute medical units: review of evidence. Eur J Intern Med 2011:344–7.
[8] Goodacre S, Turner J, Nicholl J. Prediction of mortality among emergency medicaladmissions. Emerg Med J 2006;23:372–5.
[9] Rhee KJ, Fisher Jr CJ, Willitis NH. The rapid acute physiology score. Am J Emerg Med1987;5:278–82.
[10] Smith GB, Prytherch DR. Laboratory risk factors for hospital mortality. QJM2008;101:63-.
[11] Smith GB, Prytherch DR, Schmidt PE, Featherstone PI. Predictive models: the angel isin the details. Crit Care Med 2009;37:2997–8.
[12] Silke B, Kellett J, Rooney T, Bennett K, O'Riordan D. An improvedmedical admissionsrisk system using multivariable fractional polynomial logistic regression modelling.QJM 2010;103:23–32.
[13] Mikulich O, Callaly E, Bennett K, O'Riordan D, Silke B. The increased mortality asso-ciated with a weekend emergency admission is due to increased illness severity andaltered case-mix. Acute Med 2011;10:182–7.
[14] Lynch C, Holman CD, Moorin RE. Use of Western Australian linked hospital morbid-ity and mortality data to explore theories of compression, expansion and dynamicequilibrium. Aust Health Rev 2007;31:571–81.
[15] Ozminkowski Ronald J, Smith Mark W, Coffey Rosanna M, Mark Tami L, NeslusanCheryl A, Drabek John. Private payers serving individuals with disabilities andchronic conditions; 2000.
[16] Zweifel PFM. Is there a Sisyphus syndrome in health care? Kluwer; 1992.
[17] Charlson ME, Pompei P, Ales KL, MacKenzie CR. A new method of classifying prog-nostic comorbidity in longitudinal studies: development and validation. J ChronicDis 1987;40:373–83.
[18] Mackway-Jones K, Marsden J, JWindle J. Emergency triage. Second ed. London:Blackwell Publishing Ltd; 2006.
[19] O'Loughlin R, Allwright S, Barry J, Kelly A, Teljeur C. Using HIPE data as a researchand planning tool: limitations and opportunities. Ir J Med Sci 2005;174:40–5 [dis-cussion 52–7].
[20] Armstrong P. The costs of activity-based management. Accounting, organizationsand society, vol. 27, (1–2); 2002. p. 99–120.
[21] Arnaboldi M, Lapsley I. Modern costing innovations and legitimation: a health carestudy. Abacus 2004;40:1–20.
[22] SauerbreiW,Meier-Hirmer C, Royston P. Multivariable regressionmodel building byusing fractional polynomials: description of SAS, STATA and R programs. ComputStat Data Anal 2006;50:3463–85.
[23] Moloney ED, Bennett K, Silke B. Factors influencing the costs of emergency medicaladmissions to an Irish teaching hospital. Eur J Health Econ 2006;51:123–8.
[24] Stoltzfus JC, Nishijima D, Melnikow J. Why quantile regression makes good sense foranalyzing economic outcomes in medical research. Acad Emerg Med 2012;19:850–1.
[25] Cody CS, Clark AE, Thomas AM, Cook LJ. Comparing least-squares and quantileregression approaches to analyzing median hospital charges. Acad Emerg Med2012;19:866–75.
[26] Koenker RW. Quantile regression. Cambridge Univ Press; 2005 2.[27] Broughton EI, Ip M, Coles CL, Walker DG. Higher hospital costs and lengths of stay
associated with quinolone-resistant Salmonella enterica infections in Hong Kong.J Public Health 2010;32:165–72. http://dx.doi.org/10.1093/pubmed/fdp057 [Epub2009 Jun 14].
[28] Wu CX, TanWS, Toh MPHS, Heng BH. Stratifying healthcare costs using the DiabetesComplication Severity Index. J Diabetes Complications 2012;26:107–12.
[29] Report of Acute Medical Task Force. Acutemedical care: the right person, in the rightsetting — first time. London: Royal College of Physicians; 2007.
[30] Flood KL, MacLennan PA, McGrew D, Green D, Dodd C, Brown CJ. Effects of an acutecare for elders unit on costs and 30-day readmissions. Jama Intern Med 2013;173:981–7.
[31] Report: the benefits of consultant-delivered care. London: Academy of MedicalRoyal colleges; 2012.