factors influencing properties of carbonelectrodes a calcined-anthracite or petroleum coke, the...
TRANSCRIPT

Loughborough UniversityInstitutional Repository
Factors influencingproperties of carbon
electrodes
This item was submitted to Loughborough University's Institutional Repositoryby the/an author.
Additional Information:
• A Master's Thesis. Submitted in partial fulfilment of the requirements forthe award of Master of Philosophy at Loughborough University.
Metadata Record: https://dspace.lboro.ac.uk/2134/28434
Publisher: c© J.R. Farrington
Rights: This work is made available according to the conditions of the CreativeCommons Attribution-NonCommercial-NoDerivatives 2.5 Generic (CC BY-NC-ND 2.5) licence. Full details of this licence are available at: http://creativecommons.org/licenses/by-nc-nd/2.5/
Please cite the published version.

This item was submitted to Loughborough University as an MPhil thesis by the author and is made available in the Institutional Repository
(https://dspace.lboro.ac.uk/) under the following Creative Commons Licence conditions.
For the full text of this licence, please go to: http://creativecommons.org/licenses/by-nc-nd/2.5/

LOUGHBOROUGH UNIVERSITY OF TECHNOLOGY
LIBRARY
AUTHOR/FILING TITLE
___________ E~f.!.!': ~T~_~_.,.----~~-~--------- __ :
ACCESSION/COPY NO. .'
--- _______________ ~~:t.'2:~ L~ ~".. _______________ _ VOL. NO.
28 JUN 1996
27 Jtm 1S97
26 JUN 1998
CLASS MARK
009 '2~1 02 .
. ~IIIIIIIII~I~I~I~I~I~IIIIIII~IIIII~~II~
,~: . '\
::.
~ "'~- , .. ' .. -~;,~


Factors Influencing Properties
of Carbon Electrodes
by
John Robert Farrington
A Master's Thesis
submitted in partial fulfilment of the requirements
for the award of the degree of
Master of Philosophy
of the
Loughborough University of Technology
!" ~
•• J ~
' . .
© J. R. Farrington 1990

- ...
L.ougtIborough UnIIi~ 01 Technology t.Jbmry
DI!II& ...16 't:~
la-
I::: • .r.:
(;f q<.f'2.::!' I I) '\... "

Acknowledgements
I should like to thank my supervisor, Dr. I.W. Patrick, for. his advice and guidance
throughout this project.
I should also like to thank Dr. A. Walker for explaining many technical points to me,
and Mr. D. Hays for his assistance with the experimental work. The method used to
measure electrical resistivity of carbon cores was jointly developed with Mr. G. Ogden.

Abstract
Aluminium is obtained commercially from the Hall-Heroult Process, the electrolytic
reduction of bauxite (aluminium oxide). The electrodes used are made from different
types of carbon; the bulk of the electrode, known as the filler, is typically made from
either a calcined-anthracite or petroleum coke, the particles of which are bonded
together by the binder component of the electrode, which is usually coal-tar pitch.
Large quantities of electrodes are consumed each year; attrition is by a variety of
causes, and since there is no commercially realistic alternative to the Hall-Heroult
Process, any means of reducing loss of electrodes would improve the economics of the
extraction process.
The principal objective of this research project was to examine a range of electrode
materials used in the aluminium industry, investigating the relative contributions of their
pore structural characteristics and the quality of the bond between binder and filler to
their mechanical strength and electrical resistivity, with a view to identifying those raw
materials which contribute to inferior binder-filler bonding. The literature contains a
diversity of views on manufacturing methods for electrodes; this reflects the largely
empirical nature of the process.
Results were obtained for the tensile strength of carbon specimens, SEM fractography
of fractured carbon specimens, image analysis of polished carbon specimens and
electrical resistivity of carbon cores. Some tests were also made of the wettability (the
readiness with which pitch· wets a coke surface) and real density of fillers. Seven
electrode materials were examined, of which two used calcined anthracite as the filler
while the other five used petroleum coke. All used coal-tar pitch as the binder.
The results obtained supported previously-published work by indicating that the choice
of raw materials has a key effect in determining electrode properties, and that the
strength and porosity· characteristics of a carbon can be related using an
empirically-derived equation of the form S.N = k + a.W/p2, where S = tensile strength,
N = number of pores, W = mean wall size (thickness of carbon matrix) and P = mean
pore size. In fractography, a method was successfully developed for identifying and
categorising features observed on fracture surfaces of electrode specimens, and an
attempt was made to relate the data from this work to the image analysis results.

Contents
Page
1 Introduction 1
2 Literature Review 4
2.1 Use of Carbon Electrodes In the Aluminium Industry 4
2.2 Carbonisation 6
2.2.1 Introduction 6
2.2.2 Carbonisation of Coal 7
2.2.3 Carbonisation of Pitch 9
2.2.4 Mesophase Chemistry 11
2.2.5 Factors Affecting Mesophase Properties 14
2.2.6 Pore Development During Carbonisation 16
2.2.7 Effect of Carbonisation Conditions on Binder and Filler Properties 17
2.2.8 Graphitisation 18
2.3 Electrode Manufacture
2.3.1 Raw Materials
2.3.2 Specification of Binders and Fillers
2.3.3 Factors Affecting Electrode Quality
2.3.4 Industrial Scale Manufacturing Methods
2.4 Strength of Brittle Materials
2.4.1 Basic Theory
2.4.2 Fracture of Brittle Materials
2.5 Strength of Carbons and Graphltes
2.5.1 Brittle Fracture Theory and Carbons
2.5.2 Porous Brittle Materials
20
20 21
25
27
33
33
35
41
41
44

3
3.1
3.2
3.3
3.4
3.5
3.6
3.7
4
4.1
4.2
4.3
4.4
4.5
4.6
5
5.1
5.2
5.3
5.4
5.5
5.6
5.7
6
2.6 Electrical Resistivity 01 Carbons and Graphltes
2.6.1 Introduction
2.6.2 Structural Aspects
2.7 Conclusions to LIterature Review
Experimental Procedures
Electrode Materials Used
Tensile Strength Determination
Pore Structural Analysis
Fractography using Scanning Electron Microscope
Determination of Electrical Resistivity
Determination of Real Density
Wettability
Results
Tensile Strength
Pore Structural Analysis
Fractography
Electrical Resistivity
Real Density
Wettability
Discussion and Conclusions
Tensile Strength
Tensile Strength and Porosity Results
Tensile Strength and Fractography Results
Tensile Strength, Porosity and Fractography Results
Resistivity Results
Conclusions
Recommendations for Further Work
References
45
45
45
47
51
51
51
52
53
56
56
57
68
68
71
72
74
74
74
117
118
119
121
123
125
126
128
131

1 Introduction
Carbon and graphite electrodes are used in the manufacture of a variety of materials.
The principal industrial use is in the electrolytic extraction of aluminium from bauxite
by the Hall-Heroult process, the most important industrial process for the production of
this metal. Carbon or graphite electrodes are also used in the production of steel in
electric-arc furnaces, and in the production of sodium, magnesium, lithium and
chlorine. All the electrodes studied in this research project were carbon electrodes used
in the extraction of aluminium from bauxite.
A carbon electrode consists of two solid phases: the large particles which make up the
bulk of the electrode are known as the filler, while the component of the electrode
which is used to cement the filler particles together, and which also makes its own
contribution to the mechanical and electrical properties of the electrode, is known as the
binder. The filler in electrodes used in aluminium extraction may be petroleum coke (the
most common) or a calcined anthracite; the binder is usually coal-tar pitch.The
properties of the finished product, especially its mechanical strength and electrical
resistivity, depend to a large extent on the quality of the bond achieved between the
binder and the filler during the manufacture of the electrode; it is therefore as important
to specify the details of the manufacturing process, as well as the raw materials used, to
produce electrodes of consistent quality.
Whatever application they are used in, carbon or graphite electrodes must be
mechanically strong, in order to maintain structural integrity when they are moved.
Electrodes must also be able to carry a high electrical current without undergoing
excessive Joule (resistive) heating, and should therefore be oflow electrical resistivity.
They must show adequately high thermal conductivity, to be able to dissipate heat
effectively. They must be able to withstand the maximum temperature likely to be
reached in the operation of the plant; for example, in electrodes made with
electro-calcined anthracite, an irreversible reduction in strength can take place at high
temperatures, probably because of shrinkage of the binder component away from the
filler particles. Electrodes must also be resistant to thermal stresses, that is, large and
perhaps rapid temperature fluctuations caused by a need to shut down the plant at short
notice, or because of fluctuations in the current. They must be resistant to chemical
attack by, for example, electrolytes or evolved gases; they must be capable of being
fabricated reliably and on a repeatable basis; and they must be capable of being
produced and used on an economic basis. If the electrode is so badly made that it fails
on a gross scale, not only will a new electrode be needed, but there is likely to be a high
cost because of the lost production which will ensue. It is therefore essential to be
1

confident that the process used to manufacture the electrodes will result in electrodes of
consistently adequate quality. This is of particular importance in the aluminium
industry, because of the large numbers of electrodes used, and the fact that the
electrodes are gradually used up in the electrolytic reaction. Some of these requirements
are mutually exclusive, and a compromise is usually necessary.
The structure of carbon and graphite electrodes is closely related to their required
properties. A key feature is the two-phase structure; the properties of the binder and
fJ.!ler on their own are significant, and so is the quality of the interface between them. A
mechanically strong electrode of low electrical resistivity must be fabricated from
suitable binder and filler materials, and be well-bonded at the binder-filler interface.
The other major structural feature which determines the properties of the electrode is
porosity. Pores are present in all types of manufactured carbon and coke-based
material, and play a key role in determining the strength of the artifact; it is likely that
they correspond to the Griffith critical cracks which play a vital role in the fracture of
brittle materials.
The objectives of this research project were (1) to examine a range of
commercially-available electrode materials used in the aluminium industry,
investigating the relative contributions of their pore structural characteristics and
binder-filler bond quality to their strength and electrical resistivity, and (2) to identify
those raw materials which contribute to inferior binder-filler bonding.
The experimental techniques used were: measurement of the tensile strength of carbon
specimens, which also provided specimens for SEM fractography; polarised light
microscopy, which was used in conjunction with the scanning electron microscope
(SEM) to identify constituents of the carbons, such as electro-caIcined anthracite (ECA)
and petroleum coke; SEM fractography, which involved developing and using a
point-counting method to determine the mode or modes of failure of fracture specimens;
image analysis, which was used in conjunction with reflected light microscopy to
obtain pore structural data on the carbons; wettability, which involved studying the
readiness with which pitch wets a coke surface; and real density, which was used in
conjunction with apparent density to obtain values for the porosity of the carbons, as an
alternative method to the use of the image analysis system.
Some of the techniques used were developed for this research project, while others
were modified versions of existing techniques used for other materials. Seven different
electrode materials were examined.
2

This thesis is divided into a review of the relevant literature. a description of the
experimental techniques. a results section and a discussion.
3

2 Literature Review
2.1 Use of Carbon Electrodes in the Aluminium Industry
In tenns of the amount of carbon used, the principal industrial use of carbon electrodes
is the electrolytic extraction of aluminium from bauxite. The aluminium industry
worldwide requires approximately eight million tons a year of carbon for use in anodes
[1].
The principal ore is bauxite, hydrated aluminium oxide, which also contains impurities
in the fonn of silica, iron oxide and titanium oxide. These impurities must be removed
before the aluminium can be extracted. The purification process, invented by Bayer in
1890, depends on the fact that hydrated aluminium oxide dissolves in heated caustic
soda (sodium hydtOxide), but the impurities do not, enabling almost pure aluminium
oxide (alumina) to be separated. In the Bayer process, the bauxite is pulverised,
washed and calcined until it is a powder. The powder is then mixed into a hot solution
of sodium hydroxide and pumped into large tanks containing caustic soda, which
dissolves out the aluminium hydroxide, fonning sodium aluminate. Crystals of
aluminium hydroxide are fonned when the sodium aluminate solution is seeded with
crystals of aluminium hydtOxide. After cleansing, the aluminium hydroxide crytals are
calcined to drive off the water, and the resulting alumina, is ready to be used for the
extraction of aluminium.
Alumina can be electrolysed into aluminium metal and oxygen by a high-amperage
current, but it cannot easily be liquified as it has a melting point of greater than 2000°C.
However, if the alumina is dissolved in cryolite (sodium aluminium fluoride), in the
ratio of 5% alumina, the mixture will melt at about 900°C. without appreciable
decomposition of the cryolite. This step is an integral part of the Hall-Heroult process.
Calcium fluoride may be added to the mixture to reduce the melting point further.
Unlike steel, aluminium is not made in bulk in a large furnace, but is produced in a
fairly large number of comparatively small units known as pots. A modem reduction
furnace consists of a shallow rectangular steel container lined with refractory bricks,
with an inner lining of carbon serving as the cathode. Direct current enters the cell
through the anodes, which are bulky carbon blocks suspended from above and dipping
into the molten solution of alumina in cryolite. (See Figure 2.1). A modem lOO,OODA
furnace is about IOm long and 5m wide, and produces up to 750kg of aluminium every
24 hours. Such cells typically work in a series of 150-200 called a pot line, rated at
about 75MW and using about 15kWh of electricity for every kilogram of aluminium
4

produced. The anodes are gradually oxidised to carbon dioxide (as well as being
subject to other losses, described below), and must therefore be replaced as they wear
out.
Another type of furnace uses anodes baked as the reduction proceeds: these are known
as Soderberg anodes, in which carbon paste is fed into a steel tube above the
electrolyte, the paste becoming hardened as it descends towards the pot.
Since aluminium is more dense than the molten solution of alumina in cryolite, the
aluminium produced sinks to the bottom of the cell, whence it is periodically extracted
as a liquid either by siphoning or by being tapped from the bottom of the cell. It may be
cast into ingots of the required shapes and sizes, or it may be re-smelted for further
purification.
The oxygen liberated at the anodes reacts with the carbon to form carbon monoxide,
which burns at the top of the furnace to form carbon dioxide. This is the principal
means by which anode material is lost, other losses being by reaction with the cryolite
and sloughing off. Because of the scale of aluminium production, it is uneconomic to
use the more expensive graphite anodes, although these have lower resistance and
hence lead to smaller Joule heating losses.
The economic production of aluminium depends largely on the availability of low-cost
electricity. The stoichiometry of the reaction requires a minimum of 0.33kg of carbon to
be consumed for the production of lkg of aluminium. A larger amount is always
required in practice, the efficiency of Hall-Heroult cells typically being 75-80%.
Excessive carbon consumption occurs because of losses through re-formation of
aluminium oxide, air oxidation of the anode (air burn), reaction of the anode carbon
with carbon dioxide, and dusting (small-scale crumbling of the anode which results in
small particles of carbon falling into the electrolyte). Some of these effects are
inter-related; for example, in the areas where reaction with carbon dioxide takes place,
the surface of the anode is likely to become pitted and fissured, which will promote
dusting. Similarly, an area of the surface which becomes pitted will be more prone to
reaction with carbon dioxide [2]. Thermal shock on start-up also acts to reduce the life
of the electrode. Since anode costs form approximately 20% of the total cost of
aluminium production, ways of minimising excessive carbon consumption are
potentially of considerable economic benefit. About 12 kWh of electricity, 1 kg of
bauxite and 0.5 kg of carbon anode are required to produce 0.5 kg of approximately
95% pure aluminium [3].
5

2.2 Carbonisation
2.2.1 Introduction
Carbonisation may be defined as the destructive distillation of organic material out of
contact with air, accompanied by the formation of carbon, plus liquid and gaseous
products. Carbonisation of coal yields coke; carbonisation of wood, sugar and other
materials yields charcoal.
Chemically, carbonisation is essentially an aromatic growth and polymerisation
process, in which a small aromatic structure is polymerised to an aromatic polymer,
which may then become three-dimensionally ordered to form graphite.
6

2.2.2 Carbonisation of Coal
Coal became widely used as a metallurgical fuel in the seventeenth century. after
supplies of wood for charcoal-making became inadequate (mainly because of the use of
wood for ship-building). The hearth process of heating coal in rounded heaps. known
as beehive ovens. predominated for almost a century. until more sophisticated
nineteenth-century ovens enabled by-products to be recovered.
Identifying the physical and chemical principles behind carbonisation has been a slow
process; for several hundred years. carbonisation was carried out on an empirical basis.
Details of the mechanisms involved have only been worked out this century. using
modern analytical techniques.
As coal is heated. it undergoes chemical changes which result in the evolution of gases.
leaving a solid carbon residue. Not all coals can form coke; those which can (coking
coals). soften and become plastic in the temperature range 400-500°C. The coal
particles coalesce. then the resulting mass swells and subsequently resolidifies. forming
a porous solid. With a further increase in temperature. the solid undergoes non-uniform
contraction at a rate which partly depends on the amount of volatile matter in the coal.
Factors affecting the quality of the resulting coke include the type of coal. rate of
heating. coal particle size and pressure used.
The study of carbonisation of a coal· resulted in the discovery of the carbonaceous
mesopluise. which was discovered during work on one of the principal uses of coals.
namely coke production. Polarised light microscopy was used extensively for this
work. Working with samples of coal from a seam which had been modified by a
geological source of heat. Taylor observed a loss of optical anistropy as the vitrinite
component became plastic in samples from points successively nearer the source of
heat; subsequently. he noticed the formation and growth of small spherical bodies [4].
When these bodies reached a size when they started to interfere with each other's
growth. a mosaic-like structure began to form. Completion of this structure coincided
with the resolidification point of the coal.
Efforts to observe mesophase formation in coals in the laboratory have been almost
totally unsuccessful; nearly all subsequent work has not been carried out on coal. but
on pitch and related substances. The formation of a liquid-crystalline phase during
carbonisation of certain organic materials such as coal-tar pitch and petroleum pitch was
fust described by Brooks and Taylor [5]. The formation of mesophase usually takes
7
place between 350-450°C. As described above. small spherules emerge from an
optically isotropic matrix. The spherules subsequently grow (at the expense of the
matrix material). and coalesce into large anisotropic regions which show the properties.
especially long-range order. of nematic liquid crystals. With increasing temperature. the
mesophase begins to predominate and becomes viscous. and eventually freezes to form
coke. Any mesophase structures remaining are frozen in place. Various chemical and
mechanical factors affect the degree to which the microstructure features are present in
the resulting coke; these features play a part in determining the theImal and electrical
properties of the graphite.
There are two types of coking coal [6]:
Prime quality - these coals have a volatile matter content of between 19.6 and 32 wt
% (measured on a dry. mineral-free matter basis). Only a small amount of intra granular
swelling takes place. because the plastic phase is too viscous and the rate of
devolatilisisation too low. However. adjacent particles adhere to each other. and the
resulting coke has numerous small-diameter pores with thick walls. which enhances its
mechanical strength.
Lower quality - these coals have a volatile matter content of greater than 32 wt %.
Considerable intragranular swelling may take place. and the whole mass may foam.
The resulting coke haspores of various sizes. with thin walls. and is of relatively low
mechanical strength.
8

2.2.3 Carbonisation of Pitch
In general, pitches will, upon heating to the appropriate temperature, pass through an
optically isotropic plastic or liquid phase, and then form the optically anisotropic
mesophase. Selective area electron diffraction has revealed [5] that the mesophase
consists of aggregations of planar liquid crystal-like structures, as described below,
which form spheres as a compromise between the tendency of the liquid crystals to
form two-dimensional arrays, and the need to minimise surface energy. The mesophase
spheres have properties which resemble those of nematic liquid crystals [7].
Mesophase Development and Liquid Crystals
Liquid crystal systems were discovered in 1888. They were noticed as being systems
with unusual fluid properties, namely being more highly ordered than ordinary liquids
but without actually being crystalline. The term "liquid crystal" is actually a misnomer,
but one that has become generally accepted. Liquid crystal systems may be divided into
two categories: nematic (thread-like) and smectic or cholesteric (soap-like). The
mesophase spheres which are produced in pitch carbonisation resemble nematic liquid
crystals, with the important difference that the transformation is irreversible.
Mesophase formation is observed as the separation out of spherical droplets from the
isotropic liquid, and their subsequent coalescence to give a molecular arrangement
which may be likened to a shoal of fish [8].
Factors which assist molecules to form nematic liquid crystals include [7]:
- Rigidity along their principal molecular axis.
- The presence of benzene rings, producing flat portions in the molecule.
- The existence of strong dipoles and easily polarisable groups.
- A structure extended either linearly, two-dimensionally, or both.
In the carbonisation of aromatic hydrocarbons, petroleum pitches and coal-tar pitches,
pyrolysis of the isotropic liquid results in a complex series of reactions detailed in the
section on mesophase chemistry (2.2.4). In the absence of agitation, the liquid crystals
produced tend to stack extensively. This continues as the liquid crystals are modified by
increasing heat treatment temperatures (HIT) to form semi-coke and then coke. This
mechanism produces a stacked lattice structure, which can then undergo further
changes to form graphite.
9

Growth of Mesophase Spheres
As suitable precursors of the liquid crystals are formed, they encounter similar
molecules in the initially isotropic liquid, and form planar aggregations by means of
dipole effects and Van der Waals forces. To minimise surface energy, the aggregates of
liquid crystal-like molecules form spheres, in which the planar structures are observed
as lamellae, mostly stacked parallel to the equatorial plane of the sphere but with some
aligned at right angles to the interface between the sphere and the liquid phase [9].
Insoluble material is never found in the spheres; some of it may be present in the
starting material, but most or all is produced during carbonisation. Insoluble particles
introduced into the starting substance are found to behave in the same way as
naturally-occurring insoluble material [8].
The spheres grow with increasing temperature, until eventually they coalesce and the
liquid phase disappears. The spheres grow to between 10 and 100~m in diameter; they
usually reach a maximum size in the temperature range 400-500°C. Subsequent
coalescence of the liquid crystal structures to form semi-coke leads to the anisotropic
structures observed under the optical microscope under polarised light. Four categories
of sphere growth and coalescence have been described [7]:
(1) Spheres originate at approximately the same time thoughout the mixture (Le. at
the same HTT), and so coalescence occurs over large volumes at the same time.
This behaviour is seen during carbonisation of coal-tar pitch, which contains
relatively small amounts of QI.
(2) Spheres originate at different times and grow at different rates, resulting in a large
range of sizes. Coalescence is non-uniform. This behaviour is observed in the
carbonisation of petroleum pitch [10].
(3) Spheres originate at the same time throughout the mixture but do not grow
beyond a relatively small size. The anisotropic units produced on coalescence are
much smaller than those produced in (1) or (2) - approximately 2J.lm in diameter
as opposed to about 25~. This behaviour is observed with Gi1sonite pitch and
carbons from heterocyclic compounds [11].
(4) The sphere growth pattern is affected by the presence of solids within the liquid
phase. In such cases, sphere coalescence is severely restricted by small particles,
approximately 20nm in diameter, such as carbon black [12]. However, larger
particles may produce an increase in the size of the so-called domains, by
providing a surface on which further growth can take place [13].
10

2.2.4 Mesophase Chemistry
The degree to which a carbonaceous material undergoes transformation to mesophase,
and subsequently graphitisation, depends on its chemical makeup. The following
substances show a transition to pitch (if they are not pitches already), then to
mesophase, then to a semi-coke [14].
Substance Temperature at which
mesophase forms eC)
Coke-oven pitch 425
Vertical-reton pitch 425
Petroleum bitumen 425
Vitrinites from bituminous coals 460
Naphthalene, anthracene and other 400
polynuclear aromatic hydrocarbons
Under the conditions in which carbonisation takes place, it is likely that the more
reactive hydrocarbons in the pitch phase undergo dehydrogenation and condensation to
form larger, planar species, which separate out from the pitch as the mesophase, in
partially-ordered molecular assemblages. For example, dibenzanthrone, a 7 -ring
polynuclear quinone, was found to form a coke-like material at 520°C [5].
The chemistry of mesophase, and hence of carbonisation, is extremely complex,
involving many different types of chemical reaction including bond cleavage,
polymerisation, molecular rearrangement, and hydrogen transfer. The diagram below
shows a generalised scheme for the transformation of an aromatic hydrocarbon to
carbon and graphite.
11
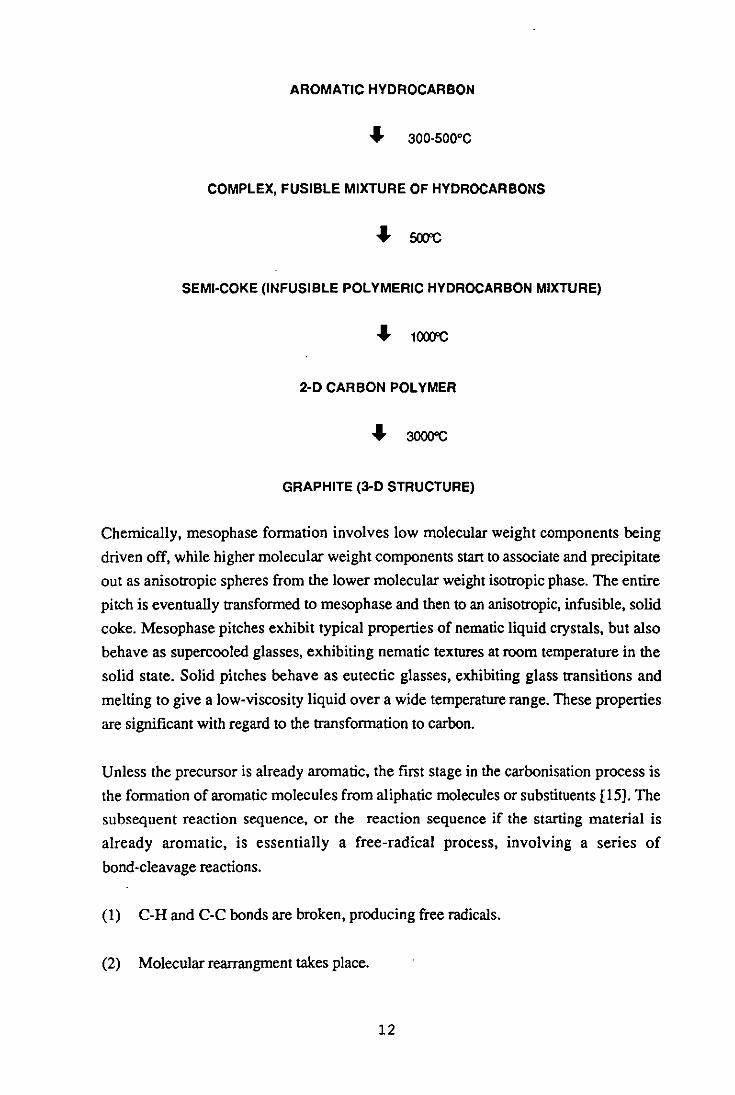
AROMATIC HYDROCARBON
.... 300-500°C
COMPLEX, FUSIBLE MIXTURE OF HYDROCARBONS
SEMI-COKE (INFUSIBLE POLYMERIC HYDROCARBON MIXTURE)
.... 1000'C
2-D CARBON POLYMER
.... 3000"C
GRAPHITE (3-~ STRUCTURE)
Chemically, mesophase formation involves low molecular weight components being
driven off, while higher molecular weight components start to associate and precipitate
out as anisotropic spheres from the lower molecular weight isotropic phase. The entire
pitch is eventually transformed to mesophase and then to an anisotropic, infusible, solid
coke. Mesophase pitches exhibit typical properties of nematic liquid crystals, but also
behave as supercooled glasses, exhibiting nematic textures at room temperature in the
solid state. Solid pitches behave as eutectic glasses, exhibiting glass transitions and
melting to give a low-viscosity liquid over a wide temperature range. These properties
are significant with regard to the transformation to carbon.
Unless the precursor is already aromatic, the first stage in the carbonisation process is
the formation of aromatic molecules from aliphatic molecules or substituents [15]. The
subsequent reaction sequence, or the reaction sequence if the starting material is
already aromatic, is essentially a free-radical process, involving a series of
bond-cleavage reactions.
(1) C-H and C-C bonds are broken, producing free radicals.
(2) Molecular rearrangment takes place.
12

(3) Polymerisation occurs, in two stages, with free-radical intermediates being
involved in both:
(i) Polymerisation through a reactive radical produced by hydrogen
dissasociation, or by a disproportionation reaction.
(ii) Formation of stable radicals from naphthalene oligomers by the loss of a
single hydrogen atom in a second-stage condensation process.
(4) Large aromatic molecules undergo condensation.
(5) Side chains are eliminated.
Production of large aromatic molecules does not necessarily mean that a graphite-like
structure will be formed. Before this can happen, the aromatic molecules must have the
correct shape and reactivity to be able to form a two-dimensional structure which can
provide the basis for the formation of graphite.
13

2.2.5 Factors Affecting Mesophase Properties
As described previously, certain carbonaceous compounds show the development of
anisotropic structures upon heating to the appropriate temperature. This section will
consider which substances fall into this category, with specific reference to the factors
which influence anisotropy development.
The structure (or lack of structure) established upon the coalescence of the liquid
crystals is largely carried through to the semi-coke and graphite. The structure formed
. depends on several factors:
- The chemical composition of the pyrolysing system
- The presence and size of solids.
- The rate of heating.
- Presence of factors such as convection currents and gas evolution.
Since it is observed that solid surfaces provide a nucleation site for mesophase growth
[8], insoluble particles probably provide such sites but are subsequently excluded from
the mesophase spheres.
If a pitch which contains solids, and a pitch which does not contain solids are
carbonised under the same conditions, the pitch with the solids tends to contain more
but smaller mesophase spheres than the pitch without the solids. There is, however,
little difference in the proponion of mesophase present
If the carbonaceous compound is not agitated when it is being heated, the mesophase
spheres tend to be larger, as there are fewer nuclei available.
Mesophase formation and properties are influenced by the kind of pitch used, that is,
whether it was derived from coal (coal-tar or coal-liquids), from components of
petroleum such as naphtha-tar pitch or decant-oil pitch), or from organic materials [16].
Another factor which influences mesophase formation is the type (if any) of
pre-treatment used, such as solvent fractionation or hydrogenation. Finally, the
heat-treatment conditions are significant; these include temperature, residence time,
heating rate, gas-blowing rate and stirring rate.
The most important factors influencing the rate of growth of mesophase spheres are
temperature and time. Generally speaking, the slower the rate of carbonisation, the
fewer and larger will be the spheres. Below a limiting temperature (400°C in the case of
many coke-oven pitches), no sphere formation occurs, even when a large period of
14

time is allowed. At a temperature slightly above the limiting temperature, sphere
formation starts. The longer the time allowed, the greater the proportion of pitch will
be converted to mesophase; the increase with time is apparently asymptotic.
A t temperatures well above the the limiting temperature, prolonged heating leads to
complete conversion to mesophase. The longer the time allowed, the more complete the
conversion. Agitation, and presence of insoluble particles, seem to assist mesophase
formation; the insoluble particles presumably act as nucleation centres. Surfaces act in a
similar way. If the mesophase is not agitated by stirring or bubble formation, the
available nuclei for sphere growth are removed, and the result is fewer but larger
spheres compared to the case when agitation does take place [8].
Before the spheres begin to interfere with each other's growth, their profiles are
circular. When the mesophase spheres form the dominant phase, distortions are seen in
the shape of the spheres, usually on a local basis at first, before becoming more
widespread.
Mesophase properties play the main part in the establishment of the structure and
properties of carbons and graphites formed by the process of carbonisation.
Petroleum-derived precursors yield a wide range of mesophase morphologies ranging
from fIne-textured and isotropic cokes to the fibrous structure of needle-coke.
15

2.2.6 Pore Development During Carbonisation
It has been reponed [17] that the pore structure of coke is largely determined during the
plastic stage. Pore fOl1llation can be divided up into four stages:
(1) Pore nucleation within larger coke panicles.
(2) Intraparticulate pore growth, with consequent swelling of the particles leading to
fusion.
(3) Continued growth of pores, reaching a maximum size after fusion.
(4) A decrease in pore size, leading to compaction of the structure near the
resolidification temperature.
It has been demonstrated that pore formation within single particles of coal is dependent
on particle size. Although fusion can only take place when pore growth causes the
particles to swell and fill the inter-particular voids, softening is still the principal
requirement for fusion, since pore growth is dependent both on the amount of volatile
matter in the pores, and on the surface tension, which decreases with increasing
fluidity. Since pores in coke are highly interconnected, it is likely that compaction of the
coke is associated with their partial deflation.
16

2.2.7 The Effect of Carbonisation Conditions on Binder
and Filler Properties
The propenies of the pitch used as the binder in pre-baked carbon anodes in the
aluminium industry have a significant effect on the propenies of the anode. Coal-tar
pitches are usually preferred to petroleum pitches, as they give a more effective binder
coke in the finished (baked) electrode [18]. This occurs because growth and
coalescence of the mesophase spheres are inhibited by the presence of
quinolene-insoluble material (QI) in the early stages of carbonisation, with the result
that the flow texture of carbon does not develop very well [7, 8, 19]. In order to obtain
a pitch with the optimum amount ofQI, various methods of removing QI from coal-tar
pitch, or of negating its effects, have been proposed [20], including the use of
additives, and co-carbonisation with QI-free coal-tar pitch.
The size and shape of the structural units in the resulting coke is a direct consequence of
the formation, growth and coalescence of spherical mesophase units, which are
themselves formed from large planar molecules produced by pyrolysis of the pitch
constituents (see Section 2.2.4) The pre-graphite structures are developed during the
lifetime of the mesophase, and an extensive lamelliform morphology results if the
conditions are favourable for sphere coalescence. Poor sphere coalescence may occur if
the pitch has low aromaticity [21], a high fluid-phase viscosity, or ifforeign atoms or
inen particles are present in significant quantities [8]. In such cases, examination of the
resultant carbon under polarised light reveals small, isochromatic, randomly-orientated
areas.
Considering cokes used as fillers in electrodes, some work has been done on needle
coke, which is used in applications where a highly-ordered structure is required.
Studies on decant oil [22] indicated that (1) a significant proponion of the feedstock
evolved at an early stage of carbonisation, and hence had little effect on the resulting
coke structure, and that (2) the structure of the resulting coke was determined partly in a
similar way to the structure of binder coke, as described above, and partly by the
manner in which gases were evolved, the latter factor being the chief determinant of the
axial textural arrangement which gives rise to the large scale needle-type structures.
Feedstocks used to produce needle coke must be chosen carefully; they must have a
high transformation temperature, in order to form a very fluid mesophase which can
easily be deformed by bubble percolation to produce a fine, fibrous microstructure
[23]. Extensive mechanical deformation as the mesophase hardens is essential for the
formation of a good needle coke.
17

2.2.8 Graphitisation
Graphite occurs naturally, but can also be manufactured by heating cenain forms of
carbon to temperatures of over 2000°C. These carbons are known as graphitising
carbons, and are generally those carbons which pass through the liquid stage involving
mesophase. Examples of precursors of graphitising carbons are high-temperature
coal-tar pitches, petroleum bitumen, polymers such as PVC and aromatic hydrocarbons
such as naphthacene [8]. Such precursors are usually rich in hydrogen and deficient in
oxygen.
Graphitising carbons are usually coke-like in appearance and exhibit optical anisotropy
under the polarising microscope. They have a compact structure, with a nearly parallel
arrangement of crystallites, little cross-linking between crystallites and small pores.
Consequently, the crystallites retain a high degree of mobility; with increasing
temperature, adjacent crystallites become aligned in parallel, eventually producing a
large-scale graphite structure. By contrast, non-graphitising carbons do not form a
well-ordered graphite structure even on heating to 3000oC. They have
randomly-orientated crystallites, much cross-linking of crystallites and large pores.
Precursors of non-graphitising carbons include coals with a high percentage of volatile
matter (little hydrogen and large amounts of oxygen). Upon heating, they do not pass
through a mesophase stage, and a rigid cross-linked structure is fonned even at low
temperatures, so a graphite-like structure cannot subsequently form.
The process of graphitisation (th.e movement of atoms to produce a three-dimensional
graphite lattice) commences at'approximately 17000 C and is complete by approximately
3000°C. The rate of graphitisation increases greatly with temperature, and is more rapid
in carbons which already show some degree of graphite-like structure.
The usual method of heating is electrical, in which case the graphite formed is known
as electrographite. Graphitisable carbons may also be formed by deposition from the
vapour phase, by passing an organic gas over a surface at a temperature of
800-1200°C. Such carbons are known as pyrolytic carbons. Ifthe surface is at 2000°C
or a higher temperature, graphite of a very high degree of perfection is formed directly;
this is known as pyrographite. If the surface temperature is between 1200-2000°C,
graphite may form, but there will be a tendency for soot to be incorporated in the
deposit, which will hinder further graphitisation.
On a crystallographic basis, graphitisation may be considered to be the development of
an ordered crystallographic structure from an initial partially-organised graphitisable
carbon. Modern concepts of the process indicate an increase in crystallographic
18

ordering as a result of elimination of side chains. between 400-70QoC. followed by
elimination of non-carbon atoms such as hydrogen and sulphur. and annealing of
inter-layer defects between 700-27OQ°C.
Since industrial graphitisation does not produce single-crystal graphite. the properties
of the binder and filler developed before graphitisation remain after the process is
complete. and therefore largely determine the properties of the fmished product
19

2.3 Electrode Manufacture
2.3.1 Raw Materials
Pre-baked anodes for use in the extraction of aluminium are produced by the slow
carbonisation of a pitch-coated, calcined, compacted aggregate of filler particles.
Several materials may be used as the fIller, the most common being petroleum coke
produced by the delayed coking process. Calcined anthracites are used in some cases
for aluminium electrodes, while needle coke may be used in specialised applications.
The binder is usually a coal-tar pitch obtained from the COking industry. Petroleum
pitches can also be used as binders, but coal-tar pitches are generally preferred, as the
highly disordered microstructure of the binder coke formed during baking results in a
high proportion of edge carbon atoms available for chemical bonding and consequently
a stronger anode. By contrast, highly aromatic petroleum pitches have extensively
aligned carbon basal layers, and so exhibit poor bonding characteristics at right angles
to these layers [18].
20

2.3.2 Specification of Binders and Fillers
Binders Used In the Aluminium Industry
The most widely-used binder for aluminium electrodes is coal-tar pitch from the high
temperature destructive distillation of coking (bituminous) coal. Pitch is the residue
obtained from the distillation of coal tar after all the light oils, intermediate fractions,
and heavy oils such as creosotes and anthracene have been distilled off. Pitches are
classified according to the carbonising temperature of the ovens or retons used in
preparing the tar, such as coke-oven tar, horizontal-reton tar and low-temperature tar.
Tars made by high-temperature carbonisation are generally more suitable for use as
electrode binders, because a high carbonising temperature corresponds to a high coking
value and carbon/hydrogen ratio, which is associated with high electrode strength.
Binder Properties
The functions of the binder are:
(1) To plasticise the coke powder, allowing the correct shape of electrode to be
formed.
(2) To provide, by carbonisation, a dense body of baked carbon in the electrode.
(3) To bind the filler particles together to provide a mechanically strong artifact.
The binder must lose its fluidity and produce an irregular macromolecular structure
which penetrates into the irregularities on the filler panicle surface. As the pitch
solidifies, it must transform successfully into a binder coke with the required propenies
of high mechanical strength and low electrical resistivity.
Clearly, it is imponant to identify the factors which affect the quality of the bonding
achieved between binder and filler. Because a number of inter-related factors affect the
propenies of the pitch, there are diverse views in the literature regarding the optimum
raw materials and conditions used in pitch production and electrode manufacture. This
reflects the empirical nature of the process.
Binder Specifications
Binders for carbon and graphite electrodes must meet the following requirements:
21

(l) High carbon yield, usually 50-60 wt % of pitch.
(2) Good wetting and adhesion properties to bind filler particles together.
(3) Suitable softening behaviour at the mixing temperature.
(4) Minimal amounts of impurities.
(5) Low cost, wide availability, consistent from batch to batch.
Attempts have been made, by adding carbon black or mesophase to the pitch, to
increase the QI levels and coke yield [24], but such modified pitches have not proved to
be satisfactory binders because the additives do not wet the filler particles and hence
contribute nothing to the binding ability of the pitch. The carbon yield can be increased
by the addition of sulphur or nitro-aromatic compounds, but binder graphitisability is
decreased.
Although coal-tar is still the main source of binder pitch (from carbonisation of coal in a
coke-oven), other sources, chiefly petroleum pitches, have been used. Synthetic resins
such as furfuryl alcohol may be used as binders for special-grade graphites, but are
unsuitable for use in electrode production because they increase resistivity [25].
Coal-tar pitches with a high quinolene insoluble (QI) content produce highly-ordered
lamellar coke whether carbonised alone or in an anode mix [26]. There may be
considerably less effective bonding between binder and filler, and hence a reduction in
anode strength, if thin layers of mesophase are allowed to form around the ftller
particles [27].
Commonly employed tests used to characterise pitches used as binders in anodes for
aluminium production by the Hall process include softening point, ash content, coking
value and QI and toluene insoluble (TI) materials content [28]. Other tests are for
carbon yield, molecular weight, spectra of various kinds, elemental analysis, viscosity
and purity [27]. Some of these tests are concerned with the practical side of the
extraction process; for example, softening point determines the minimum mixing
temperature of the coke/pitch blend (usually 140-16O°C), while ash content affects the
purity of the aluminium. The aromaticity of pitch is an important consideration for
anode production; as described in the section on carbonisation, aromatic compounds
form coke more easily than non-aromatic compounds, so coking value can be used as a
measure of aromaticity.
22

There have been several attempts to correlate the properties of the binders and fillers
used in the manufacture of carbon and graphite electrodes with the properties of the
actual electrodes. with a view to achieving the ability to tailor electrode properties
precisely. The amount of primary and secondary QI. and B-resins (TI - QI) has a
significant effect [29]; an increase in primary QI at the expense of gamma-resins (the
toluene-soluble fraction) gives higher bulk density and strength. and lower resistivity.
than an increase in B-resins. while a higher content of B-resins results in a higher pitch
softening point. but lowers the binder pitch requiremenl However. an increase in the
amount of secondary QI increases the binder pitch requirement. with only a small
negative effect on other pitch properties.
Effect of QI Content on Pitch Properties
Since the presence of QI is beneficial in reducing exudation. but detrimental to the
formation of a good interface between binder and filler. a suitable pitch should contain
the optimum amount of QI. which has been reported as being about 10 wt % [30].
When co-carbonisation takes place within the restricted space of the interstices between
the filler particles in an anode mix. the QI particles tend to form areas of optically
isotropic material surrounded by lamellar carbon [21].
In summary. a binder pitch should have as high a coke yield and atomic C/H ratio as
possible. to give the artefact the highest bulk density and mechanical strength. whereas
a high B-resin content helps to give a lower electrical resistivity in graphite-based
artifacts. A pitch with a high primary QI content results in a hard. isotropic binder pitch
coke. with high thermal conductivity. high electrical resistivity and low thermal
conductivity.
Filler Properties
A considerable amount of work has been done on pitch properties. but less appears to
have been done on the influence of the filler particles. However. it has been shown that
the nature of the filler surface may play an important part in influencing the quality of
binder-filler bonding [31].
Filler properties which affect the quality of the resulting electrode include [32]:
(1) Roughness of the surface of the coke filler particles. This is important in
determining the degree to which the binder will wet the filler; if the binder cannot
penetrate the small irregularities of the filler surface. inferior bonding between
binder and filler may resull
23

(2) Chemical reactivity of the coke, which will be influenced by the presence of
surface groups such as 0, H, S and N.
(3) The degree of perfection of stacking of the graphite-like components of the coke.
The more highly graphitised the filler, greater the requirement for a high
proportion of non-polar pitch components.
(4) The rate of carbonisation of the fIller.
(5) Resistance to oxidation. The reactivity of the filler coke is important, especially at
the high temperatures of the Hall-Heroult cell.
(6) Porosity; whereas metallurgical cokes are almost impermeable to gases, carbon
anodes have a predominantly open porosity, which increases the area available
for oxidation.
24
2.3.3 Factors Affecting Electrode Quality
Importance of the Blnder·Flller Interface
The quality of the manufactured electrode cannot be specified simply by specifying the
qualities of the binder and filler; a key feature which influences the electrode propenies
is the interface between the binder and the filler. Desirable electrode propenies -
mechanically strong, compact and dense, low electrical resistivity and low chemical
reactivity - are more likely to be obtained if there is good contact between the binder and
the ftIler.
Binder-Filler Interface Quality
Several factors influence the quality of the binder-filler interface. If pitch containing
mesophase spheres is used as the binder, this may wet the coke more effectively than
just pitch [27], but the mesophase may go on to form shells round the filler particles
and prevent good contact with the binder [33]. It is therefore desirable to ensure that the
optimum amount of mesophase is present in the binder, as discussed in Section 2.3.2.
The viscosity of the pitch also affects the binder-ftller interface; if it is too viscous (a
rheological consideration), it will not be able to penetrate the surface of the filler'
particles, whilst if it is unable to wet the surface (a thermodynamic consideration) it will
not make good contact even if the viscosity is satisfactory [34, 35, 36,37].
When a pitch is carbonised alone, anisotropic liquid crystal-like spherical mesophase
units are formed, as described in Section 2.2.3. The manner of mesophase growth and
coalescence has been shown to play a key role in determining the size and shape of the
basic structural units in the resulting carbon; the growth and coalescence processes are
themselves dependent on the characteristic of the pitch and the conditions of
carbonisation [31].
If a petroleum pitch is both highly aromatic and carbonised with minimum agitation, the
result is a well-ordered, highly anisotropic carbon, with extensively aligned basal layers
arranged into lamellar structural units. However, the use of such pitches in electrode
manufacture is likely to lead to cracking, because of poor bonding between the binder
andftller.
The carbon in cokes from high-rank vitrinites is composed of lamellar components, the
lamellae being aligned circumferentially around devolatilisation pore surfaces. Cokes
25

from low-rank vitrinites are granular, and may be considered to be composed of
compressed mesophase units which have undergone complete carbonisation [38, 39].
Examination of fracture surfaces of coal-derived filler cokes using ion-etching and SEM
fractography indicate that parts of the surface may be regarded as being composed of
nodular structures 0.2-2Ilm in diameter, which may correspond to non-coalesced
mesophase units [40]. By contrast, the pore surfaces are observed to be quite smooth;
it may be that they are coated with a thin film of carbon deposited during coal pyrolysis,
the carbon forming lamellae aligned parallel to the pore surface.
Little or no bonding occurs between the lamellae of lamellar binder coke and the pore
surfaces of filler coke particles, or between granular binder coke and the pore surfaces.
However, strong bonding occurs between fractured filler coke surfaces and both
granular and suitably aligned lamellar binder cokes.
26

2.3.4 Industrial Scale Manufacturing· Methods
Synthetic graphites which are manufactured for use as aluminium electrodes are usually
made using a petroleum coke filler and coal tar pitch binder which are mixed and then
moulded or extruded into shape before being graphitised. The chemistry involved is
described elsewhere in this literature review; the whole process, from preparation of the
raw materials to despatch of the finished graphite, typically takes up to four months
[41).
The principal steps in the manufacturing process are [42]:
.J
(1) Preparation of raw materials.
(2) Mixing of materials
(3) Forming into green shapes
(4) Baking
(5) Impregnation
(6) Optional re-bake
(7) Graphitisation
(8) Finishing (cutting to correct shape)·
The Delayed Coking Process
This is the principal method of manufacture of the petroleum coke used as filler in
synthetic graphites. World production by this method was recorded as sixteen million
tons per annum in 1981 [43]. A wide variety offeedstocks is used, principally thermal
tar, decant oil, catalytic cracker slurry, coal tar pitch and ethylene cracker tar. This
ability to use a range of feedstocks is one of the reasons why the delayed coking
process is so popular.
The delayed coker feed is fed hot to the heater of the coker and heated to about 500°C.
The feedstock then flows into one of two coke drums where it thermally cracks to gas,
petrol, gas oil and coke. Over a period of hours, the coke accumulates in the drum,
while the light products pass back to the combination tower. When the first drum is
full, the feed is switched to the second drum and quenching of the lust drum
commences, l?"st by steam and then by water. Mter the water has been removed, the
now-cool coke is drilled from the drum using high-pressure water jets. (See Figure
2.2).
In the drum, coke formation takes place by polymerisation and homogeneous
nucleation of the feedstock molecules, to produce lamellar nematic liquid crystals. At
27

first, the system is highly fluid, and spheres may coalesce to form larger spheres, but
eventually, a fully-coalesced structure known as bulk mesophase is formed, beacause
increasing temperature or time leads to further polymerisation of the constituent
molecules. The bulk mesophase still shows plastic properties, and will undergo further
polymerisation before becoming a rigid semi-coke (with a heat-treatment temperature
of less than 500°C) or a green coke (with a heat-treatment temperature of greater than
500°C ).
Raw Materials
The chemical composition of the feedstock used in the delayed coking process largely
determines the quality of the coke. Feedstock constituents are usually divided into
asphaltenes, resins and aromatics. Asphaltenes are colloidal dispersions of hydrocarbon
molecules made up of C, H, 0, N, S, V and Ni; typical molecular masses are
3000-5000 amu [44]. Resins are similar, but with molecular masses 200-300 amu less
than the corresponding asphaltenes. Aromatics are composed of unsaturated but very
stable polycyclic six-carbon rings. Although different chemically, paraffinic and
naphthenic molecules are often included in this category.
Feedstocks with high asphaltene and resin contents are generally unsuitable for coke
maufacture because they produce a highly cross-linked coke with a large concentration
of impurities. Feedstocks with about 50 wt % aromatic constituents are suitable for the
production of coke for electrodes used in aluminium extraction. Feedstocks with greater
than 70 wt % of aromatic constituen.ts are suitable for the production of the
high-quality, easily graphitised coke known as needle coke, which is used in electrodes
for steel production and in certain electrolyic processes.
Cokes to be used in the manufacture of aluminium electrodes must have a low ash
content, because V, Ni, Fe and Si reduce the quality of the aluminium A relati,vely high
sulphur content is less important. Conversely, graphite electrodes must be made with
low-sulphur needle coke, because a filler with higher than 0.8 wt % sulphur is likely to
swell as the sulphur is eliminated as a gas. This swelling, known as puffing, at least
degrades artifact properties (decrease in bulk density, mechanical strength, electrical
conductivity and thermal conductivity) and may even result in gross failure of the
artifact.
So far, properties of filler coke have been considered, but the properties of the binder
are also important. As described in the section on binder and filler properties, the binder
must plasticise the filler to allow the artifact to be formed into the correct shape, and
subsequently carbonise to form a coke linking the filler particles, to provide both a
28

strong and dense artifact with the required thennal and elecoical conductivities.
Calcination
In general, green coke (that is, coke which has not been heat-treated and which contains
a high proportion of volatile matter) is not suitable for use as a filler coke because it
tends to shrink on heat treatment to a degree dependent on its volatile matter content
[45]. Because of this, green coke is generally heat-treated before being used as filler;
the heat treatment process is called calcination.
During calcination to 1400°C, the volatile matter content of the coke is reduced from
about 5-15 wt % to about 0.5 wt %, the volatiles mainly being released as gases,
including CH4, C2H6, H2, H2S and CH3SH. The C/H ratio of the material is
increased from about 20 to greater than 1000 [46]. The volatile matter content decreases
with increasing calcination temperature. Calcination is necessary because:
(1) Green materials cannot easily be bound to produce an electrode of the correct
density.
(2) They are difficult to mould or extrude.
(3) They emit volatiles during baking, resulting in a very porous electrode.
(4) They have a much higher elecoical resistivity than calcined materials.
Three types of calciners are in general use for cokes: rotary kiln, rotary hearth and
vertical shaft, the first being the most widely used.
Calcination usually results in coke filler particles 5-8cm in diameter. Particles about
1.3cm in size are required for aluminium anodes. Three opposing principles act when
the size of filler particles is decided. It is desirable to reduce porosity (and increase
strength) by packing small particles between large particles, but it is also desirable to
provide adequate voidage to enable the volatile pyrolysis products from the binder
phase to escaping during the subsequent baking operation, to avoid structural damage.
Also, the sizes of pores may need to be controlled.
Mixing
Manufacturing commences with mixing of the pitch and filler, which improves the
29

likelihood of obtaining a strong product. Mixing must be done at a sufficiently high
temperature to keep the binder fluid, and gently enough to avoid breakage of the filler
particles. The amount of binder must also be chosen carefully; there must be enough to
exclude air from the voids between the filler particles, taking into account that some
binder will penetrate some of the pores in filler particles. Following the mixing
operation, the hot mix is cooled to slightly above the softening point of the pitch, to
ensure its rheological properties are suitable for the forming operation. Total time for
mixing and cooling is typically 1.25 hours.
FormIng
The next stage is the forming process, which increases the density of the mix, resulting
in close contact between the binder-coated filler particles, a low porosity and a size and
shape of the so-called "green" artifact as close as possible to the finished product. The
two principal methods of forming are extrusion and moulding. Extrusion is the newer
and more widely used of the two methods. There are several types of extrusion
equipment, but all involve the use of a hollow cylinder known as a mud chamber, into
which the mix is placed; pressure is then used to force the mix through a die of the
correct shape. The extruded material is then cut to the correct length and cooled slowly
to avoid cracking.
The extrusion process produces a bulk anisotropy in the product; the filler particles
become aligned with their long axis parallel to the direction of extrusion. The degree to
which this takes place depends on the type of fIller and the details of the extrusion
process, and is more pronounced for needle-coke fillers. A consequence is that
extruded products have higher strength, Young's modulus and thermal conductivity in
the direction of the grain, while the electrical resistivity is smaller.
BakIng
The green artifact is subsequently baked, by being heated from 800°C to lOOO°C. This
stage has two functions: to convert the binder into solid coke and to remove shrinkage
in the artifacllfbaking is carried out too rapidly, the fmished product is likely to be of
poor quality; since the green artifact is almost impermeable, the gradual development of
a venting porosity early in the bake is essential to avoid a highly porous or cracked
structure. Also, too high a rate of heating will result in differential shrinkage, leading to
cracking of the artifact. A particular problem in this stage is the complete loss of
mechanical strength between 200-400oC because the binder is liquid. To avoid
slumping and distortion of the artifact, it must be packed in coke or sand which must
not only provide mechanical support but must be sufficiently permeable to allow
30

volatiles from the pitch to escape. Aluminium electrodes generally require two weeks to
fIre and fIve days to cool. while speciality graphite may require six weeks to fIre and
four weeks to cool [42).
Cleaning and Impregnation
A cleaning stage may constitute the conclusion of the manufacturing process for
aluminium electrodes and blast furnace refractories. For artifacts that are to be
graphitised. the next stage is impregnation. which reduces the porosity and increases
the density of the finished graphite. If the impregnant has large concentrations (greater
than about 3 wt %) of QI materials. it may not reach the centre of the product and a
so-called dry core will result. which may lead to cracking or gross failure of the
artifact. Commonly used impregnants are low melting point coal-tar or petroleum
pitches with less than 3 wt % QI [42).
Graphltlsatlon
The artifact is now ready for the actual graphitisation process. an electrical heat
treatment to about 3000°C. (See Section 2.2.6 for details of the chemistry and physics
of graphitisation.) The Acheson furnace. invented in 1895. is capable of heating several
tons of charge to temperatures approaching 3000oC. The furnace bed consists of
refractory tiles. The furnace ends are made of concrete; through them project several
water-cooled graphite electrodes which are connected to the secondary of a transformer.
The product is placed on a layer of metallurgical coke; its long axis may be placed
parallel to. or at 90° to the direction of current flow. depending on the manufacturer. A
coarse-sized metallurgical coke. called resistor pack. is used to fill the gaps between the
pieces to be graphitised. The furnace is then covered with a blend of fmer metallurgical
coke. sand and silicon carbide to provide thermal and electrical insulation.
A furnace of this type usually requires a day to pack. uses a heating rate of 4O-60°C per
hour. a total firing time.of about three days and a fInal graphitising temperature of
2700°C [47). Cooling and unloading takes eight to ten days; the resistor pack must not
be removed while the product is at a high temperature. to prevent oxidation taking
place.
Recent Developments
Demands for graphite with isotropic bulk properties. and for more rapid production.
have led to the development of more modem techniques such as isostatic hot pressing
31

(IHP), artifact densification and high pressure impregnation [48].
Isostatic hot pressing is a high-temperature, high-pressure compaction process, in
which the binder/filler mixture is put in a hermetically sealed metal container, which is
then placed in an autoclave. At high temperatures, the container becomes plastic and
and the pressure in the autoclave is transmitted to the mix.
Anifact densification is similar to IHP, except that the charge is a pre-fonned solid.
Very high temperatures (greater than 2200°C) are required to produce plastic
deformation of the solid carbon.
High pressure impregnation/baking is again similar to IHP, and incorporates the
impregnation and baking stages into the same operation. The impregnation stage takes
place at atmospheric pressure and the baking stage at approximately lOOMPa.
So-called "binderless" graphites may be used where very high strength and high
density are required; these are manufactured at very high temperatures and pressures,
typically 1700-2700°C and lOO-120MPa. The highest strength graphites are obtained
using the higher temperatures.
32

2.4 Strength of Brittle Materials
2.4.1 Basic Theory
Deformation of most solids occurs by the atoms or molecules of which the substance is
composed moving further apart or closer together, against the resistance of their
chemical bonds, which acts to keep the atoms at the most energetically favourable
distance apart. This distance is determined by the relative strengths of attractive and
repulsive forces between atoms.
Since the bonds between atoms are very strong, it requires considerable force to
compress (or extend) a block of steel in this way; even then, the movement of the block
is on a microscopic scale. There are special cases, such as rubber, where the molecules
are arranged in large-scale helical structures, which are deformed when the material is
compressed or stretched. Elastic materials (those which recover their original shape
when the applied load is removed) include not only rubber, but steel, concrete and
many other substances to which the word elastic is not generally applied.
Some substances, however, are not elastic; they do not recover fully (if at all) after
being deformed. These substances are termed plastic, and include examples such as
putty and plasticine.
Surface Energy
Surface energy in a solid is analogous to the surface tension in a liquid; energy is
required to create new surfaces, because chemical bonds are broken during the process.
Surface energy may be considered to be a measure of the resistance of the material to
crack propagation, or the toughness of the material. For materials with high surface
energies, the terms fracture energy or work of fracture are sometimes used. For most
materials, theoretical surface energies are approximately 1 Jm-2. It is found in practice
that surface energies from fracture stuclies vary widely:
Material Surface Energy, J m· l
Glass 1-10
Brick 3-40
Nylon 1000
Wood 10,000
Steel 100,000
33

The large values result from the consumption of energy in processes other than those
directly involved in failure; the low values are observed for brittle materials where
deformation of the StruCTure is only encountered over a few atomic layers.
34

2.4.2 Fracture of Brittle Materials
An application of the principles of brittle fracture theory is necessary in both the
traditional type of engineering structure, and in new materials of various types. The
latter category includes carbon used in load-bearing structures or in applications such as
aluminium electrodes where the size of the structure means it must bear a load as a
consequence of its size.
When a force is applied to a structure, it will deform to some extent, depending on
certain properties of the material of which the structure is composed. The terms which
describe the amount by which a substance defonns are stress and strain.
Stress is the load on a structure, typically measured in meganewtons per square metre
(MNm-2). The stress in a solid is analogous to the pressure of a gas, that is, it is a
measure of the external forces on the atoms of the material. When the material is not
subjected to a stress, the atoms are at their neutral or strain-free position [49].
Strain is the amount by which a structure will defonn under a load, per unit length of
the structure, that is, the fractional extension:
e = amQunt of stretch
original length
Strain can therefore be considered as a measure of how far the atoms in a solid have
been pulled away from their most thermodynamically stable positions.
If the material is stretched, the amount of stress increases. Eventually the bonds will
be unable to withstand any more stress, and will break; this is seen on a large scale as
the structure failing. Some of the energy released in the process of breaking bonds is
released as heat, hence the fractured ends of an object are often felt to be warm to the
touch. Some energy may also be released as sound, hence the snapping noise which is
heard when a brittle material breaks.
In 1807, Young realised that a consideration of the material of which a so:ucture was
composed, rather than the structure itself, led to the concept of stiffness.
Young arrived at the relationship:
at ress
strain
constant (stiffness of the material)
35

This constant for a material is known as Young's modulus for that material, and has
the units of stress (since strain is a dimensionless quantity). The initial region of the line
obtained by plotting stress against strain is straight; in this region, materials behave
elastically, and the gradient of the line gives the value of Young's modulus for that
material, which may be considered as the stress needed to produce 100% strain, or as a
measure of the stiffness of the material. The area under the line gives the strain energy
stored in the piece of material being tested. For a brittle material, the stress/strain curve
is virtually linear up to the point of fracture; this is not the case for other classes of
material.
Much of the pioneering work in this field was done by Inglis, whose first major
contribution to this field was to realise that although a material might appear to be
strong enough, the structure of which it was constructed could fail if there were locally
high concentrations of stress.
In a classic paper [50] Inglis showed that if, for example, a third of a structure was
removed, the stress at the edge of the gap such as a hatch cover in a ship was not
simply 4/3 the average but could be many times as high. The situation was worsened if
the gap formed a sharp re-entrant (that is, a square opening would be worse than a
circular one), and if the material was brittle.
Stress concentration at the tip of a crack approximates to:
s = -h/r
where 1 = crack length
r ::. tip radius
Inglis used the example of an elliptical hole in a flat plate in his calculations, and
showed that small, even SUbmicroscopic, flaws might be sources of weakness, since
the limiting case of an infinitesimally narrow ellipse is a crack. Inglis also realised that
the amount by which the stress is concentrated depends on the shape of the hole rather
than its size.
Inglis had shown that tough materials (those which can withstand relatively high tensile
stresses without fracturing) should be used when the structure of which they were
made was to be in tension. Brittle materials could be used .in situations where they
would be in compression; in tension, the defects present could spread, with failure of
the structure.
36

This work had provided a much clearer picture of what happened when a fracture
occurred, but not how it happened. Several important questions were left unanswered,
including why large cracks were found to propagate more easily than small ones, and
the effect of the radius of curvature of the crack tip.
The classic work of Griffith extended these ideas and described them more formally, by
introducing the energy-balance concept of fracture, which applies to fracture in general,
not just to brittle fracture.
Until Griffith's work, it was generally thought that all materials fractured at a critical
stress level which was characteristic of the material in question. The inadequacy of this
theory was shown by the observations that the fracture strength of a given material
often varied with the temperature, rate of loading or other factors.
Griffith's view was that an applied load causes strain energy to be stored within a
material; whether the structure breaks depends on whether or not it is energetically
favourable for the strain energy to create new crack surfaces.
From a consideration of the case of an isolated crack in a solid which was subjected to
an applied stress, Griffith suggested that brittle fracture occurs by the rapid growth of
such a crack through the material. However, this did not explain why the crack
extended, rather than the material deforming elastically or plastically.
Griffith formulated a critical crack criterion for the conditions, in terms of classical
mechanics and thermodynamics, under which the crack would extend. He suggested
that a body with an internal crack simply sought the lowest free energy configuration,
which would leave the crack in equilibrium and hence on the point of extension. A
small applied load would then supply the necessary energy for rapid crack propagation
to occur [51]. The equilibrium would be between the mechanical energy of the system
(work done by the applied load + strain potential energy of the medium + the energy
required to create new fracture surfaces) and the surface energy. The mechanical energy
must decrease as the crack extends; if this was not the case, the crack would stop.
Conversely, the surface energy must increase as the crack extends, as more bonds are
being broken.
Griffith's criterion is that the surface energy in the total areas formed by crack
propagation must be equal to the elastic strain energy which was stored in the region
before the crack spread. A surface crack therefore acts as a stress concentrator, so the
stress in the material near the tip of the crack is much greater than the applied stress.
37

The ~eeper the crack, the lower the stress needed for for the crack to propagate. Hence
the very high strength of carbon fibres and glass fibres is explained in terms of their
small surface area, which precludes the existence of very deep cracks.
According to Griffith, the stress concentration effect described by Inglis is simply a
mechanism for converting strain energy into fracture energy; fracture only takes place if
there is enough strain energy available. The basis of the Griffith critical crack criterion
is that while the energy debt of a crack increases linearly with the crack length, its
energy credit increases with the square of the crack length, since (to a reasonable
approximation) two triangular areas on either side of the crack will give up strain
energy. Up to the critical point, there is a net absorption of energy. Beyond that point,
energy is released at an increasing rate.
A crack or other defect may therefore exhibit a local stress concentration which is much
higher than the nominal tensile strength of the material, but failure will not occur
provided that no crack is longer than the critical length. In practice, however, all cracks
must start as being short, and subsequently extend.
Griffith formulated the critical condition for fracture as:
6f = (2"(E / ltc) 1/2
where 6f = failure stress
y = surface energy (Jrn-2 )
E Young's modulus (units of stress~ Nm-2 )
2c = critical crack size
This assumes a constant load rate and stress in one plane only.
Hence the critical crack length is both a necessary and sufficient criterion for fracture.
Griffith realised that the maximum stress at the tip of a crack at equilibrium must
correspond to the theoretical strength of the solid, that is, the strength of the chemical
bonds between the atoms or molecules of the material. It had been noted by previous
workers that solids always fell short or"their theoretical strengths by up to two orders of
magnitUde, and that when fracture occurred, it did not do so by an explosive separation
of all the constituent atoms, but along one plane. From these observations, Griffith
deduced that microscopic or submicroscopic flaws were present in all materials, and
38

that a thin specimen would be stronger than a thick one made of the same material
because it would have less room for defects.
It is found in practice that:
c = l/X . Work of fractUre per unit area of crack surface
where
Strain energy stored per unit volume of material
c = zm;
1t52
2c length
W work of
E Young's
5 = Average
of Griffith critical crack (m)
fracture (Jm-2 )
modulus (Nm-2 )
tensile stress in material near crack (Nm- 2 )
On the basis of the Griffith theory. the main safeguard against the occurrence of
brittle fracture is a high work of fracture. The work of fracture of a material is the
quantity of energy required to break a piece of material (of a set shape), by breaking
all the bonds in a plane and thus creating two new surfaces. Hence a material which is
tough has a high work of fracture, whilst a material which is brittle has a low work of
fracture; it is not brittle because it does not take much force to break it, but because it
does not take much energy. Materials may have similar tensile strengths, but may
differ greatly in values for work of fracture.
Summary of Grifflths' Treatment of Brittle Fracture
Griffiths recognised the imponance of the stress-raising capacity of existing flaws in
a material, and deduced that crack propagation occurred when the strain energy
available exceeded the surface energy of the two freshly-created surfaces. Since, for a
crack in the centre of a flat plate, the strain energy is proportional to the square of the
crack length while the surface energy is directly proportional to it, it follows that
above a critical crack size more strain energy is available than is required for the
creation of fresh surface. Therefore, the propagation of a critically-sized flaw leads
directly and inevitably to failure. In real materials, a considerably greater amount of
mechanical energy may be needed because the material exhibits some non-brittle
behaviour.
39

Stress Intensity Factors
An alternative approach to the theory of fracture of brittle materials involves
consideration of stress intensity factors, where fracture is characterised by a stress
intensity factor attaining a critical value. This approach leads to the conclusion that a
test piece with large cracks will fail at low stress levels, while a test piece with high
stress levels will fail at higher stress levels. If the applied stress does not exceed a
threshold value, crack propagation will not occur. If the critical value for the stress
. intensity factor is reached, failure ensues directly. For stress intensity factors between
the threshold and critical values, crack growth occurs until the critical value is
exceeded and fracture takes place.
Crack Stopping
A propagating crack may be stopped if it encounters conditions where the stress
concentration is reduced. In materials such as a carbon electrode, or composite, this is
most likely to occur at an interface. Because the interface adhesive strength will be
much less (perhaps 1/5) of the cohesive strength of the solid, an interface lying ahead
of a propagating crack will be broken before the crack reaches it. When the crack
does reach it, the crack tip radius will be greatly increased, and propagation is likely
to stop. In anode/cathode blocks, weak binder-filler interfaces may act as crack
stoppers and also act to lower the surface energy.
40

2.5 Strength of Carbons and Graphites
2.5.1 Brittle Fracture Theory and Carbons
Although it is convenient to consider the tensile failure of carbons in terms of Griffith's
theory, such materials do not strictly conform to classical brittle fracture theory. It has
been found that for metallurgical cokes, microcracks are developed at pores at low
stress levels [52]. Such cracks become stabilised, usually by being blunted on entering
another pore (see earlier). Eventually, however, a critically-sized flaw is formed and
failure ensues. A similar mechanism has been suggested for the failure of graphites
[53]. The detection of acoustic emissions from graphites at pre-failure stress levels [54]
has been associated with the generation of stable microcracks. Consequently, the
fracture energy is greater than the energy required to create the fracture surface.
Numerous factors influence the strength of cokes. One is the development of pores
during the carbonisation process; it has been stated that the key to understanding and
controlling the strength of metallurgical cokes lies in characterisation of the coke
porosity, since the pores are several orders of magnitude larger than any of the features
associated with carbon matrix, and are thus likely to correspond to the Griffith critical
cracks which may cause fracture of the material [55]. On this basis, any characterisation
of the porous structure from a strength point of view must take into account the size of
the larger pores and an indication of their shape, to enable the effects of stress
concentration to be determined. From the work of Griffith, the strength of the coke
should be related to maximum pore size by an inverse square root relationship. Patrick
and Stacey considered that to increase the strength of the coke, it is necessary to lower
the maximum diameter of the larger pores, and the volume porosity. Also, pores should
be as nearly spherical as possible.
For metallurgical and other cokes, the use of an equation of the form S.N = k +a.Wtp2
has been suggested [56], where S = tensile strength of the material in MPa, N = number of pores per mm2, W = mean wall size (thickness of carbon matrix) in ~m, and
P = mean pore size in ~m. The values of the constant k and coefficient a depend on
the raw materials used.
Recent work suggests that the same principles may be applied to electrodes made using
dectro-calcined anthracite as a filler [57]. Also, volume porosity and pore size
increased markedly with increasing heat-treatment temperature from lOOO°C to 2500°C.
The results suggested that pore structural data can be used to predict the tensile strength
of the material, and that HIT above lOOO°C led to a change in the mode of breakage.
41

Further work done in this area [58] indicated that the porosity of ECA or GCA
(gas-calcined anthracite) increased with an increase in HIT to 2500°C, and that
ECA-based materials differ somewhat in their characteristics from graphite and
GCA-based materials. Fractography using the SEM provided further indications that
this was the case; ECA-based materials showed a high incidence of interfacial failure,
while the other materials appeared to be well bonded, failure occurring predominantly
by a transgranular mode, implying that different parameters control the different modes
of failure.
Subcrltical Crack Growth In Carbons and Graphites
Subcritical crack growth is frequently found to precede mechanical failure in graphites
used in structural, that is, load-bearing, applications [59]. The easiest direction for slow
crack growth to occur is along the plane of the lamellae, while the most difficult is
perpendicular to the plane of the lamellae. Primary crack extension has been modelled
to occur by crack propagation along lamellae or fissures in filler particles. Secondary
cracks may form in advance of the main crack, perhaps initiating at pores.
Extensive SEM fractography [59] indicates some general micromechanical features
common to a variety of graphite materials:
(1) Although the fracture path intersects pores of all sizes, it does not go out of its
way to intersect pores.
(2) Microcrack density increases, due to the crack tip stress field, appear to be
minimal.
(3) The cracks and fissures observed in some petroleum coke fIller particles are
structural features which probably result from thermaL stresses during the
heating and subsequent cooling processes.
In the longitudinal direction of petroleum coke based artefacts, the fracture crack
frequently appears to be diverted around ususually-orientated filler particles, and
propagates through the binder phase. In the transverse direction, however, fractures of
filler particles are observed to be fairly numerous. Also, the tortuous crack path
indicates that the crack makes frequent detours around filler particles. Whether the crack
goes through or round a particle appears to depend on both energy considerations and
particle orientation.
42

--------
Toughness of Particles
The least tough fonn of solid carbon is the single-phase. glassy type. The most tough is
the single-phase. highly-crystalline pyrolytic graphite. in the direction perpendicular to
the basal planes. Two-phase graphites show intennediate toughness. depending on the
relative proportions of the two phases. the degree of anisotropy seen. and the porosity.
A further significant factor is the relative crystallinity of the two phases. the filler being
crystalline and the binder less so.
43

2.5.2 Porous Brittle Materials
The porosity of brittle materials such as carbon must be taken into account when
considering their strength. Early work in this area was done on ceramics, as stated by
the Ryshkewitch-Duckworth equation:
5 = 50 exp(-bp)
where 5 strength of a porous body
50 = strength of a similar non-porous body
p = fractional porosity
b constant
Knudsen [60) undertook a theoretical consideration of a material composed of sintered
spheres, assuming that the variation of strength with porosity reflected changes in the
load-bearing area within the specimen, the critical area being that traversed by an
irregular cross-section passing through the areas of contact between the spheres.
Knudsen continued his work by combining the Ryshkewitch-Duckworth equation with
an equation derived by Orowan [61):
5 = kG -1/2
where G = grain size
to derive an equation which took into account both grain size and porosity:
5 = 50G-1/2 exp(-bp)
where b is a factor which decreases as pores become more rounded.
It is possible to combine this equation with Griffith's equation to derive a more general
form of equation for the strength and porosity of porous brittle materials:
5 (2EY Iltc) 1/2. exp (-bp)
Simplified versions of this equation have been successfully used, which indicates that
some factors in it remain constant between different materials.
44

2.6 Electrical Resistivity of Carbons and Graphites
2.6.1 Introduction
It has been demonstrated that carbon powders are ohmic resistors [62], and that a
strong dependency exists in the range resistivity and pressure, such that only at fixed
and constant pressures is a comparison in the range resistivity values meaningful. A
series of straight lines were obtained by plotting a graph of m V against mA for different
pressures. Resistivities were found to range over three orders of magnitude, in the
order:
Electrographite < Petroleum coke < Acetylene black < Carbon black
Although carbon films are not intrinsic semiconductors, it has been observed that films
50nm thick can show the propenies of a semiconductor in the temperature range
277-397 cC, where electrons can be excited across the forbidden band and thus produce
non-localised electronic conduction [63]. At low temperatures, thermally-assisted
tunnelling through potential barriers may take place.
2.6.2 Structural Aspects
With heat-treatment temperatures in the range 400-500°C, it has been observed that
there is a decrease of resistivity and Young's modulus [64]. The reasons for the former
are unclear, but may reflect changes in the binder such as coalescence of the spherical
liquid crystals into bulk mesophase. The corresponding changes in Young's modulus
are more difficuitto account for.
A sharp decrease observed in the electrical resistivities of coals and a charcoal at
temperatures in the range 500-800°C may be accounted for in terms of the volume
fraction of the graphitic panicles distributed among microvoids [65]. Between
200-300°C, there appeared to be a small increase in resistivity, possibly due to the
formation of voids as volatile compounds are removed. With HITs in the range
500-800°C, resistivity decreased by twelve orders of magnitude. A coal with a higher
inorganic content showed a more gradual decrease in resistivity.
It has been noted [66] that for pitches at temperatures in the range 60-l60°C, electrical
conductivity and temperature susceptibility both changed with a change in temperature.
45

fonnation at 450°C is accompanied by a rapid increase in pitch resistivity. which
subsequently levels off and remains nearly constant until coalescence takes place. After
colaescence takes place. there are indications that current flow takes place at least partly
by solid state semi conduction.
46
..

2.7 Literature Review - Conclusions
This literature review has attempted to show that a number of factors play a part in
determining electrode properties, and that several of these factors are inter-related
Although the carbonisation process is well understood in general terms for
laboratory-scale experiments using simple precursors, there are still many aspects
which are poorly understood when considering the process on a large scale, using
complex precursors. An alternative, and complementary, method of studying
carbonisation is to note that a particular substance, or conditions used, gives an
electrode with desirable properties, and use this data both as a basis for electrode
manufacture and to advance the theory involved. The relative lack of detailed
knowledge of carbonisation on a large scale is reflected in the methods used in
industrial-scale electrode production, which work well most of the time, but may not
always give consistent results from batch to batch. It would be preferable to be able to
be confident that electrodes with the correct properties could be manufactured
repeatably, on the basis of a better theoretical understanding of the process. Since the
porous structure of electrodes plays an important part in determining their strength,
further understanding of pore development is a particular aspect of carbonisation which
would be likely to be useful in designing methods for producing mechanically strong
electrodes on a repeatable basis.
A reasonable amount of work has been done on the pore structural characteristics of
polished electrode surfaces, but there is scope for further work in this area, possibly
using more sophisticated image analysis techniques.
SEM study of fractured electrode surfaces has yielded a considerable amount of data on
modes of fracture of electrodes, but there is scope for further work in improving the
techniques used.
Although much work has been done on the electronic properties of carbon and graphite,
very little work has been done on the electrical properties of carbons used as electrodes,
in relation to their microscopic structure. It is likely that such investigation would be
rewarding both from a theoretical point of view and from the point of view of helping
to determine what factors affected the resistivity of the electrode.
The most significant deficiency in studying the diverse factors which influence the
mechanical and electrical properties of carbon electrodes has been the lack of relevant
data to enable the inter-relation of the factors to be understood. For example, as
47

mentioned above, a considerable amount of work has been done both on the pore
structural characteristics of electrode materials and their modes of fracture, but little
work has been done on relating these two groups of data for the same electrode
material. This research project was intended to obtain data for tensile strength, pore
structural parameters, modes of fracture and values of electrical resistivity for several
carbon electrode materials, and relate them to the overall properties of the electrodes.
Also, a method of detennining the wetting temperature of a particular combination of
binder and filler was to be designed, to provide an indication of the readiness with
which the binder will wet the filler during the initial mixing stage in electrode
manufacture.
48

." IQ c: ... CD I
!'l .....
en ()
:::T T CD
3 L III
o Siphon adle ...
()
~ C '" III
IQ ... III 3
.-~
-
~ r--
0 «"" ',". ". -::I: III
I
::I: CD ... 0 c: ... 0 CD
- - - -
f-- f-- r--
'. . --:~ "
. ..... '"
Carbon Cathode Lining
Insulation
-a
B
Anode Conductor
aked Carbon ode An
M
,i~1 El
olten uminium
olten ectro Iyte
,/~
a
V~
Cathode Conductor
teel asing

"'11 ca c ... (1)
N N
en o =r (1)
3 III -o
C III ca ... III 3 o -c (1)
III '< (1)
Co
o o 7:" (1) ... o
"C (1) ... III -o ::::I
Closed
0> >
:;::: o I'll c
700K
Vapour valves
Coke drums
0> > .... o «
Open Combination
tower
Vapour line
Coking heater
Top reflux
645K
Residual feed
Wet gas
310K
Compressor
Wild gasoline
475K
Light coker gas oil
575K
Heavy coker gas oil

3 Experimental Procedures
3.1 Electrode Materials Used
The seven carbons examined all used coal-tar pitch as a binder. Five used petroleum
coke as a filler, one used gas-calcined anthracite and graphite and one used
electro-calcined anthracite.
Carbon A4 was a carbon used for the refractory lining of blast furnaces. The fIller was
a mixture of gas-calcined anthracite (GCA) and graphite, and the binder was coal-tar
pitch.
Carbon C was another carbon refractory; the filler was electro-calcined anthracite
(ECA), and the binder was again coal-tar pitch.
Carbon P was a low-ash chemical-resistant carbon. The filler was petroleum coke and
the binder was coal-tar pitch.
Carbon AL6 and Carbon ALS were anode carbons from the aluminium industry. The
fIller in both was petroleum coke and the binder was coal-tar pitch. These carbons were
selected from a batch of electrode carbons which had been manufactured in the same
way but which differed in mean tensile strength.
Carbon Y was an ordinary aluminium anode carbon.
Carbon Z was an aluminium anode carbon which was baked at a higher temperature
than usual.
3.2 Tensile Strength Determination
The tensile strength of the electrode carbons was determined using the
diametral-compression test, in which the compressive load required to break a
cylindrical specimen across a diameter was measured [68]. Cores approximately J.5cm
in diameter were drilled from blocks of the carbons to be examined. The cores were
then sliced into specimens approximately lcm in length. These specimens were
washed, cleaned ultrasonically and dried. They were then inspected visually and any
damaged ones were rejected. 50 specimens for each carbon (except where there was
insufficient material) were weighed and used in the determination of tensile strengths,
which was carried out using an Instron Universal Testing Machine. The load required
51

to break each specimen at a cross-head speed of 5mm min-J was recorded, and the
mean tensile strength, standard deviation and standard error for each carbon were
calculated. The apparent density of each carbon was also calculated from core weight
and dimensions.
3.3 Pore Structural Analysis
Pore structural analysis was carried out using a Cambridge Instruments Quantimet
Q800 system, in which a television image obtained from a polished, resin-impregnated
carbon surface is viewed under reflected light. The individual dots of which the image
is composed are allocated to one of 64 grey levels, according to their brightness. The
image is then converted into a black and white image in which all pixels are allocated to
be black or white respectively, depending on whether their grey level is above or
below a threshold brightness. This detection level is set manually, such that the dark
pores in the detected image correspond to those seeri in the TV image.
Six specimens were selected from the tensile strength fracture specimens in such a way
as to use specimens covering as wide a range of tensile strengths as possible, to try to
find evidence of pore structural differences between specimens of differing tensile
strengths.
The selected specimens were embedded in araldite and polished using successively
finer grades of pad and abrasive; a1umina was used as the abrasive for the initial stages,
and diamond paste was used for the fine polishing. The objective was to attain a
scratch-free and relief-free flat-polished surface. They were checked for scratches under
an optical microscope between each stage of the polishing process, and polished further
as necessary.
The field parameters of interest are the volume porosity, number of pores, pore size and
wall size. These are known to be significant factors in determining the properties of the
carbon artifact. The volume porosity is'obtained by expressing as a percentage the ratio
of the black area to the total area of the measuring frame. The number of pores is the
count of features whose lowest point lies within the frame. Wall and pore sizes are
obtained using the number of intersections of the scan lines with the trailing edges of
pores. The pore size is then obtained from the ratio of the black area to the product of
the number of intersections and the pixel size, while the wall size is obtained in a
similar manner, but using the white area. The process is repeated for vertical scan lines,
and the mean of the values obtained in two directions used.
52

lava rl/N
where Iav = average intercept
r I a total intercept
N = number of features
I represents the number of intersections of scan lines or columns of the picture matrix
with image detail. Pore size is obtained from the total lengths of horizontal and vertical
intersections of scan lines with image detail.
Chord length (pore size) petected area (Equation 3.3.1)
r I
Closest approach Total area - Detected area (Equation 3.3.2)
r I
To determine the number of fields to be used for each specimen, measurements were
taken from each of the two halves. It was found that the accumulated mean value for
each parameter levelled out at about 40 fields; consequently, it was decided to use fifty
fields for each specimen, divided into groups of ten for convenience.
Three of the groups of ten were taken from one half-specimen, and two from the other.
To set the detection level, the detection level was determined for five fields for a
half-specimen, and the mean value calculated. This value was used as the detection
level in the accumulation of data for ten fields, then the procedure was repeated for each
subsequent group of ten fields. Although more accurate, it would have been too
time-consuming to set the detection level for each field.
At the start of each session, the instrument was calibrated using a microscope slide on
which were a group of circles of known size. If their size (measured along horizontal
and vertical diameters) corresponded well to the known size, the carbon specimens
were then exanlined.
3.4 Fractography Using Scanning Electron Microscope
A method of examining fracture surfaces from tensile strength experiments was
developed to enable the predominant mode or modes of failure of the carbons to be
determined. It involved use of a scanning electron microscope (SEM) to identify and
subsequently categorise features observed on fracture surfaces, calculating how many
53
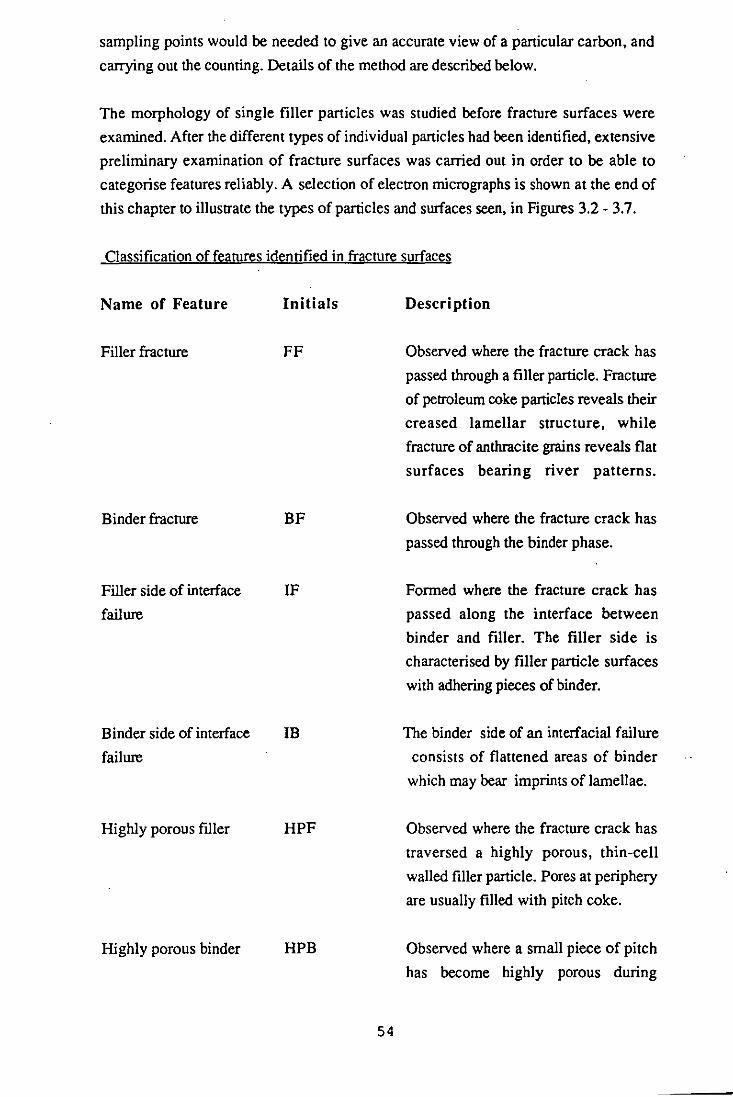
sampling points would be needed to give an accurate view of a panicular carbon, and
carrying out the counting. Details of the method are described below.
The morphology of single filler particles was studied before fracture surfaces were
examined. After the different types of individual panicles had been identified, extensive
preliminary examination of fracture surfaces was carried out in order to be able to
categorise features reliably. A selection of electron micrographs is shown at the end of
this chapter to illustrate the types of particles and surfaces seen, in Figures 3.2 - 3.7.
Classification offeatures identified in fracture surfaces
Name of Feature
Filler fracture
Binder fracture
Filler side of interface
failure
Binder side of interface
failure
Highly porous ftller
Highly porous binder
Initials
FF
BF
IF
IB
HPF
HPB
54
Description
Observed where the fracture crack has
passed through a filler particle. Fracture
of petroleum coke particles reveals their
creased lamellar structure, while
fracture of anthracite grains reveals flat
surfaces bearing river patterns.
Observed where the fracture crack has
passed through the binder phase.
Formed where the fracture crack has
passed along the interface between
binder and filler. The filler side is
characterised by filler particle surfaces
with adhering pieces of binder.
The binder side of an interfacial failure
consists of flattened areas of binder
which may bear imprints of lamellae.
Observed where the fracture crack has
traversed a highly porous, thin-cell
walled filler particle. Pores at periphery
are usually filled with pitch coke.
Observed where a small piece of pitch
has become highly porous during

Pore surface
Interparticular fissure
Devolatilisation pore
Interlamellar fissure
Gross fissure
PS
IPF
DP
ILF
GF
binder carbonisation. Similar in
appearance to HPF, but no pores are
filled with coke.
Observed where the fracture crack has
passed through a pore. The pore
surface is covered by a thin film of
pitch coke in which primary QI
particles are evident.
A narrow void between two filler
particles.
A small, spherical pore in a filler
panicle, formed during original
carbonisation or calcination.
A fissure between lamellae of a
petroleum coke filler particle.
A large fissure traversing areas of filler
and binder.
Figure 3.1 illustrates the progression of a fracture crack and the origin of the observed
features. Some of the features arise from the passage of the fracture crack through
different components of the solid carbon matrix, such as fIller particles, while others
arise from the passage of the fracture crack through various types of voids in the
carbon such as pores.
It was decided to use five specimens for each carbon, to enable a reliable determination
of the characteristics of the particular material to be made. The five specimens were
chosen to be as close as possible to the mean tensile strength of the material, and to
±O.5 and ±1 standard deviations from the mean. The rationale behind this was to select
specimens which were representative of the material, rather than looking at them as
individual samples (as was the case with the image analysis work).!t was calculated that
a sampling target of 500 points would be adequate to give reproducibility at the 95%
probability level.
55

Having decided to use five samples and 500 sampling points per carbon, it was clearly
sensible to use lOO points per specimen and 50 points per half specimen. The points
were separated by 0.5mm in the X and Y directions, this being adequate to give
coverage of most of the fracture surface available, and also being easily accomplished
by turning the X and Y movement controls on the SEM through half a turn.
Prior to examination in the SEM, the specimens were gold-coated in a sputter-coater, to
prevent charge building up on their surfaces by the action of the electron beam. The
specimens were then mounted on stubs, and silver paint was applied to electrically
ground them. They were then examined in a Cambridge Instruments S604 scanning
electron microscope.
3.5 Determination of Electrical Resistivity
Five cores, measuring approximately 7cm in length by 1.5cm in diameter, were drilled
from a block of the carbon to be tested, then cleaned ultrasonically and dried. The
apparatus used to measure the resistance of a core consisted of a wooden base with two
plastic clips to support the core. A screw clip was slid over each end of the core, and
tightened to a constant torque. The distance between the inner edges of the clips was
measured using a pair of vernier calipers. For each core, at least eight measurements of
resistance were taken, for a range of lengths between the clips. The measurements were
used to plot graphs of length against resistance. The resistivity of the material was then
calculated.
3.6 Determination of Real Density
Principle
The method used to determine the real density of the carbons depended on comparing
the weight of the carbon and the weight of the same volume of water. Knowing the
density of water (1000 kgm-3), the density of the carbon could then be calculated using
equation 3.6.1.
Method
A density bottle was dried and weighed (weight = P), filled with distilled water and
reweighed (weight = W I), then dried again. A sample of the carbon to be examined
was ground to pass through a 150jlffi sieve. Approximately 1.5cm3 was transferred to
the density bottle, and the weight of the bottle plus carbon was measured (weight = W).
56

The density bottle was filled to between 1/4-1/2 of its capacity with distilled water,
which was boiled for ten minutes under reduced pressure. It was allowed to cool for
five minutes, then a drop of dispersive agent was added to reduce the surface tension
and allow all the fme carbon particles to sink. It was considered that the different
density of the dispersive agent would be negligible for the purposes of this test. The
density bottle was then filled with distilled water, and placed in a beaker of water at
room temperature for at least one hour, to allow the temperature of the contents to reach
equilibrium with the extemal temperature. More distilled water was added as necessary,
then the stopper inserted and the outside of the bottle was dried. The bottle was then
weighed again (weight = W2).
Calculation
Real density was calculated as follows.
Real density = (W P) (Equation 3.6.1)
(W1 - P) - (W2 - W)
Tests were carried out in duplicate, and the mean result taken.
3.7 Wettability
Introduction
One of the factors influencing the quality of the interface between the binder and filler in
a manufactured carbon artefact is the readiness with which the binder wets the filler
during the initial mixing stage. The flow of a liquid into a porous medium depends
mainly on two physicaVchemical properties: the viscosity of the binder (a rheological
property) and the contact angle the binder makes with the filler (a thermodynamic
propeny). Both of these properties are important: a pitch may show good wetting
properties but be so viscous that its use is impractical, whilst if the pitch does not wet
the coke adequately, it will be unable to penetrate it, however low the pitch viscosity.
The type of study described here is therefore important in providing further data to
characterise a pitch, in addition to the usual properties such as density, softening point,
QI content and TI content.
57

Non-wetting Wetting Spreading
Apparatus
The apparatus used consists of the following components:
A Variac power controller, connected to a hot-plate. on which was placed a
specially-designed circular steel block with four cylindrical cavities in the top, each
approximately 3cm deep by 1.5cm wide. A glass cylinder was placed over the top of
the central part of the steel block, and a glass connector over the top of the cylinder. A
rubber bung was placed in the neck of the connector, the bung had a 2mm diameter hole
drilled through its centre, and a longitudinal incision along a radius. The wire of a
hypodermic thermocouple probe was fed through the hole in the centre of the bung.
(See Figure 3.8).
The method is based upon that described by Heintz [36] but includes several
improvements: using a thermocouple to measure the temperature of the coke is both
more sensitive and more accurate than a thermometer, and the use of a steel block
assists in smoothing out fluctuations in the rate of temperatUre rise.
The experimental materials used were Alcan petroleum coke and coal-tar pitch. Coke
particles O.18-0.425mm in size were used; this size range was chosen because too large
a particle size would allow the binder particles to drop into inter-particular gaps, whilst
too small a particle size would bear little relation to the coarse-grained formulations
typically used in electric-furnace carbon electrodes.
Pitch particles 1.4-1. 7mm in size were used. Too small a size of pitch particle would be
difficult to observe, whilst pitch particles that were too large would tend to sag under
their own weight upon softening, making wetting temperature difficult to observe.
Upon softening, particles with sizes in this range formed spherical droplets on the coke
surface (until wetting took place).
The experiment was carried out as follows. The four cavities in the metal block were
filled with coke particles of the size range indicated, and the coke surfaces were
58

levelled. A pitch particle was placed close to the centre of three of the circular coke
surfaces, and the tip of the hypodermic thennocouple probe was insened into the coke
in the fourth cavity.
Preliminary experiments to determine the optimum operating conditions for the Variac
and hot-plate were carried out, to obtain a temperature rise rate of 5°C per minute over
the range BO-1BO°C. It was found that the best way of achieving this was to set the
Variac to 190, heat the block from ambient temperature to approximately BO°C, then let
the temperature stabilise at this value. The Variac and hot-plate were then switched on
again, at the same Variac setting, and the temperature reading noted when the
temperature started to rise. The temperature was checked every minute, to ensure the
rise rate was acceptable. The mean rise rate at the end of the experiment was was also
calculated.
The pitch particles were observed at frequent intervals: the temperature at which the
pitch fonned spheres was noted, and then the temperature at which wetting took place
was recorded. The wetting temperature was taken as the temperature at which there was
a clear flattening of the pitch spheres, as they started to wet the coke surface.
The experiment was repeated, a total of six specimens being used. This was to give
consistency both within a run and between runs.
The chief advantage of this apparatus is its simplicity; its chief disadvantage is the
subjective nature of the measurements. This could be overcome by using an optical
device to observe the moment at which wetting took place. The apparatus could be
used with solid pieces of coke, providing they were small enough to fit into the cavities
in the metal block; the hypodermic probe would be pressed against, or into, the solid
surface of the coke. The pieces of coke would have to fit into the cavities closely, to
ensure even heating took place.
59
FRACTURE CRACK THROUGH
Filler Particle
Binder
Interface Between Binder and Filler
Highly Porous Filler
Highly Porous Binder
Pore
Interparticular Fissure
Devolatilisation Pore
Interlamellar Fissure
FEATURE IDENTIFIER
FF
SF
IF .. 18 .. HPF
HPB
PS
IPF
DPF
ILF
Figure 3.1 - Diagrammatic Representation of Path of Fracture Crack Throug h Electrode
60

Figure 3.2 - ECA Particle Showing Conchoidal Fracture
Surface and River Patterns
61

Figure 3.3 - Petroleum Coke Particle Showing Lamellae
62

· lOlL
Figure 3.4 - Petroleum Coke Particle Showing
Pore Surface
63

Figure 3.5 - Filler Fracture in Petroleum Coke
64

Figure 3.6 - Binder Fracture in Petroleum Coke
65

Figure 3.7 - Filler Side of Interfacial Failure in Anode
Carbon made with Petroleum Coke
66

Thermocouple
Hypodermic Probe
Steel Block
Hot -.. Plate
Thermocouple Wire
Bung
• Glass Cylinder
Pitch Sphere (not to scale)
~---Coke
Sample
Figure 3.8 - Wettability Apparatus
67

4 Results
Results were obtained for seven carbon electrode materials. The results obtained using
each experimental technique will be described under the appropriate headings, and the
findings discussed in the next section.
4.1 Tensile Strength Measurements
Calcined-Anthracite Based Carbons
Summ;uy of Results for Carbon A4
11ean tensile strength = 4.89 11Pa
Standard deviation = 0.74
Standard error = 0.1
11ean apparent density = 1470 kgm·3
Standard deviation = 13
Standard error = 1
Summ;uy of Results for Carbon C
11ean tensile strength = 3.3811Pa
Standard deviation = 0.52
Standard error = 0.07
11ean apparent density = 1505 kgm-3
Standard deviation = 20
Standard error = 2
68

Petroleum-Coke Based Carbons
Summary of Results for Carbon P
Mean tensile strength = 6.32 MPa
Standard deviation = 0.61
Standard error = 0.09
Mean apparent density -. 1596 kgm·3
Standard deviation = 19
Standard error = 2
Summary of Results for Carbon AL6
Mean tensile strength = 6.36 MPa
Standard deviation = 0.65
Standard error = 0.14
Mean apparent density = 1564 kgm·3
Standard deviation = 17
Standard error = 3
Summary of Results for Carbon AL8
Mean tensile strength = 5.71MPa
Standard deviation = 0.75
Standard error = 0.16
Mean apparent density = 1570 kgm·3
Standard deviation = 27
Standard error = 5
69

Summary of Results for Carbon Y
Mean tensile strength = 6.62 MPa
Standard deviation = 1.01
Standard error = 0.14
Mean apparent density = 1550 kgm·3
Standard deviation = 13
Standard error = 1
Summary of Results for Carbon Z
Mean tensile strength = 5.82 MPa
Standard deviation = 0.88
Standard error = 0.14
Mean apparent density = 1537 kgm-3
Standard deviation = 17
Standard error = 2
Results for the tensile strengths of all the samples for a particular carbon showed an
approximatelY normal distribution, within the limits of the sample size. The two
calcined-anthracite based carbons had mean tensile strengths which were significantly
lower than those of the petroleum-coke based carbons. The latter group showed a wide
range of mean tensile strengths, although it is possible that this would also have been
observed if a larger number of calcined-anthracite carbons had been studied.
The real densities of the two calcined-anthracite carbons were similar. The real densities
of the petroleum-coke based carbons showed a much smaller range than the range of
their mean tensile strengths, and were slightly higher than those for the
calcined-anthracite group.
70

4.2 Pore Structural Analysis
Results from computerised image analysis are shown below; the data are the
cumulative data for all the specimens for a particular carbon. More detailed results are
shown in the tables at the end of this chapter.
Carbons are shown in increasing order of mean tensile strength.
Carbon Mean Tensile Porosity No. Pores Pore size Wall size
Strength (MPa) (%) per mm2 (Ilm) (Ilm)
C 3.38 26 2455 25.18 77.26
A4 4.89 32 1681 27.08 58.10
AL8 5.71 24 6344 14.99 49.52
Z 5.82 23 5247 20.80 68.40
P 6.32 23 4972 16.31 55.40
AL6 6.36 23 6461 15.70 54.16
Y 6.62 22 5716 19.45 70.77
These results indicate a clear difference between the two groups of carbons. The
porosity in both calcined anthracite-based carbons is distributed as a relatively small
number of large pores. whereas the petroleum coke-based carbons have a much larger
number of smaller pores. The calcined-anthracite carbons are more porous and have
lower tensile strengths than the petroleum coke based carbons.
71

4.3 SEM Fractography
Summary of Fractographic Data (Number of Observations per
Category)
Carbons are shown in increasing order of mean tensile strength.
Carbon Tensile Number of Observations per Category
Strength
FF BF IFF IFB HPF HPB PS IPF GF
C 3.38 83 157 31 25 0 1 200 3 0
A4 4.89 161 154 29 23 0 0 124 9 0
AL8 5.71 93 112 78 47 3 1 150 15 1
Z 5.82 171 110 120 20 0 0 59 18 0
P 6.32 149 187 3 21 3 3 79 25 0
AL6 6.36 178 142 18 13 1 5 123 11 5
Y 6.62 165 107 68 48 1 2 99 10 0
72

Summary of Fractographlc Data (Percentage of Observations per
Category)
Carbons are shown in increasing order of mean tensile strength.
Carbon Tensile Percentage of Observations per Category
Strength
FF BF IFF IFB HPF HPH PS IPF GF
C 3.38 16.6 31.4 6.2 5 o 0.2 40 0.6 0
A4 4.89 32.2 30.8 5.8 4.6 0 o 24.8 1.8 0
AL8 5.71 18.6 22.4 15.6 9.4 0.6 0.2 30 3 0.2
z 5.82 34.2 22 24 4 0 o 11.8 3.6 0
P 6.32 29.8 37.4 6.4 4.2 0.6 0.6 15.8 5 0
AL6 6.36 35.6 28.4 3.6 2.6 0.2 I 24.6 2.2 1
y 6.62 33 21.4 13.6 9.6 0.2 0.4 19.8 2 o
These results indicate some differences both between the two groups of carbons (calcined
anthracite-based and petroleum coke-based) and within the groups. The weaker of the two
calcined anthracite-based carbons (C) shows a much smaller percentage of filler fracture
than the stronger of the two (A4). The three strongest petroleum coke-based carbons, P,
AL6 and Y, all show comparable percentages of filler fracture. Although Z is only slightly
weaker than these, it too shows a high percentage of filler fracture, but also shows a very
high percentage of interfacial failure (filler side). AL8, the weakest of this group, shows a
much smaller percentage of filler filler fracture.
73

4.4 Electrical Resistivity
Results for the different cores for each carbon are shown in Figures 4.1-4.5.
Insufficient raw material was available to enable resistivity tests to be carried out on
carbons AL6 and AL8.
The calcined-anthracite based carbons showed lower electrical resisitivity than the
petroleum-coke based carbons; the range of values for the first group was 4.15 to 6.78
mQ cm-I, while for the second group it was 5.63 to 6.78 mf.l cm-I.
4.5 Real Density
The results show good agreement between two real density runs for each carbon, and
between the real density method of measuring porosity and the image analysis method,
except in the case of carbon A4. Because of the discrepancy, two funher real density
runs were carried out for this carbon, which confirmed the results for the first two
runs.
4.6 Wettability
Results were obtained for two successive runs; the average temperature rise rate was
4.7°C per minute. It was found that the size of pitch particles used was adequate to
allow sphere formation, wetting' and spreading to be observed. The temperatures at
which all these events took place were found to be consistent between the two runs.
The mean wetting temperature was found to be 157.5°C.
74

Table 4.1 Tensile Strength Measurements for Carbon A4
Specimen Weight Diameter Length Load Tensile Apparent No. (g) (mm) (mm) (divs.) Strength Density
(MPa) (kgm·3)
1 2.7556 14.89 10.60 78.7 6.22 1492 2 2.6030 14.90 10.42 66.9 5.37 1432 3 2.8640 14.89 11.06 61.9 4.69 1486 4 2.6422 14.88 10.35 38.8 3.14 1467 5 2.6596 14.88 10.50 49.5 3.95 1456 6 2.6792 14.89 10.40 55.5 4.47 1479 7 2.7600 14.89 10.75 25.8 2.01 1474
8 2.7036 14.90 10.75 67.2 5.23 1444 9 2.6878 14.87 10.57 58.5 4.64 1463 10 2.7636 14.90 10.76 63.3 4.92 1472 11 2.7733 14.89 . 11.00 67.5 5.14 1447 12 2.7643 14.90 10.70 55.2 4.32 1481 13 2.7798 14.86 10.95 60.5 4.64 1463 14 2.7092 14.90 10.52 49.0 3.90 1476 15 2.6718 14.88 10.45 64.0 5.13 1469 16 2.7700 14.89 10.68 56.3 4.42 1489 17 2.6390 14.88 10.50 66.2 5.28 1445 18 2.6447 1489 10.26 62.4 5.09 1480 19 2.7532 14.89 10.65 66.2 5.21 1484 20 2.6381 14.91 10.35 60.4 4.88 1459 21 2.6966 14.88 10.60 67.9 5.37 1462 22 2.7206 14.88 10.70 61.0 4.78 1461 23 2.7105 14.91 10.60 64.8 5.11 1464 24 2.6852 14.88 10.65 62.1 4.89 1449 25 2.7425 14.91 10.76 66.6 5.18 1459 26 2.6819 14.90 10.62 67.7 5.34 1448
27 2.7013 14.90 10.60 67.4 5~32 1461 28 2.8272 14.88 10.95 60.8 4.65 1484 29 2.7413 14.90 10.60 53.9 4.26 1482
30 2.7442 14.89 10.70 70.4 5.51 1472 31 2.6767 14.88 10.55 67.1 5.33 1458 32 2.7410 14.91 10.65 65.8 5.17 1473
33 2.7868 14.90 10.92 61.9 4.74 1463
34 2.8327 i4.88 10.95 76.9 5.89 1487
75

[Table 4.1 continued]
35 2.7154 14.87 10.68 70.2 5.51 1463 36 2.6650 14.89 10.37 53.1 4.29 1475 37 2.7033 17.89 10.57 66.1 5.24 1468 38 2.7824 14.89 10.81 69.6 5.39 1477 39 2.7690 14.88 10.72 51.6 4.03 1485 40 2.8332 14.90 11.10 53.5 4.03 1463 41 2.6709 14.89 10.41 74.0 5.96 1473 42 2.6726 14.89 10.41 54.2 4.36 1474 43 2.7654 14.91 10.71 60.8 4.75 1478 44 2.7683 14.89 10.72 68.8 5.38 1482 45 2.8099 14.90 10.95 64.1 4.90 1471 46 2.7122 14.92 10.60 73.3 5.78 1463 47 2.8132 14.87 10.91 67.9 5.22 1484 48 2.7581 14.89 10.63 78.2 6.16 1489 49 2.7755 14.92 10.78 57.8 4.48 1472 50 2.7727 14.92 10.70 59.9 4.68 1481
76

Table 4.2 Tensile Strength Measurements for Carbon C
Specimen
No.
1
2
3
4
5
6
7
8
9
10
11
12
13
14
15
16
17
18
19
20
21
22
23
24
25
26
27
28
29
30
Weight
(g)
2.7702
2.8522
2.7316
2.8858
2.8353
2.8186
2.8502
2.8582
2.7904
2.8308
2.8503
2.8730
2.8892
2.7724
2.8476
2.7960
2.8867
2.8844
2.7702
2.8632
2.8437
2.8457
2.8887
2.9353
2.7746
2.8534
2.9191
2.8811
2.8101
2.7738
Diameter
(mm)
14.87
14.91
14.90
14.92
14.92
14.90
14.92
14.91
14.88
14.92
14.94
14.92
14.93
14.93
14.87
14.93
14.93
14.92
14.92
14.91
14.92
14.89
14.90
14.91
14.85
14.93
14.92
14.92·
14.92
14.90
Length (mm)
10.62
10.70
10.58
10.82
10.74
10.75
10.75
10.91
10.56
10.96
10.74
10.82
10.91
10.61
10.75
10.68
10.94
10.95
10.63
10.87
10.72
10.80
10.90
11.17
10.60
10.88
10.86
10.84
10.67
10.64
77
Load
(divs.)
42.3
43.3
24.5
39.0
48.1
46.7
48.1
49.5
36.3
42.8
48.2
38.5
42.4
44.6
37.7
42.3
49.7
40.6
34.0
58.8
48.6
40.6
43.8
42.0
44.0
52.0
53.0
40.0
51.5
46.1
Tensile
Strength
(MPa)
3.34
3.38
1.94
3.01
3.74
3.64
3.74
3.79
2.88
3.26
3.75
2.97
3.24
3.51
2.94
3.31
3.79
3.10
2.67
4.52
3.79
3.15
3.36
3.14
3.48
3.99
4.08
3.08
4.03
3.63
Apparent
Density (kgm-3)
1501
1526
1480
1525
1509
1503
1516
1500
1519
1477
1513
1518
1512
1492
1525
1495
1506
1506
1490
1508
1516
1512
1519
1504
1511
1497
1537
1519
1506
1494

[Table 4.2 continued)
31 2.8580 14.90 10.82 53.3 4.12 1514
32 2.7847 14.90 10.70 36.5 2.85 1492
33 2.8586 14.921 10.86 48.3 3.72 1505
34 2.6488 14.91 10.83 29.7 2.29 1400
35 2.8950 14.92 10.97 34.3 2.61 1509
36 2.8238 14.90 10.76 36.4 2.83 1504
37 2.8742 14.85 11.31 37.4 2.78 1466
38 2.9648 14.90 11.28 41.3 3.06 1507
39 2.8736 14.92 10.94 50.3 3.84 1502
40 2.8584 14.92 10.80 44.0 3.40 1513 41 2.8298 14.92 10.85 33.8 2.60 1491
42 2.7658 14.80 10.63 41.6 3.30 1512
43 2.7682 14.90 10.48 46.4 3.70 1524
44 2.8488 14.85 10.85 46.5 3.60 1515
45 2.9112 14.92 10.95 56.5 4.31 1520
46 2.7774 14.88 10.70 40.4 3.16 1492
47 2.8488 14.92 10.84 42.0 3.24 1502
48 2.8558 14.92 10.83 50.8 3.92 1507
49 2.8057 14.88 10.67 48.9 3.84 1511
50 2.8133 14.91 10.68 43.8 3.43 1508
78

Table 4.3 Tensile Strength Measurements for Carbon P
Specimen Weight Diameter Length Load Tensile Apparent
No. (g) (mm) (mm) (divs.) Strength Density
(MPa) (kgm·3)
1 3.0176 14.88 10.88 82.8 6.38 1594
2 3.0546 14.89 10.92 93.0 7.14 1606
3 3.0752 l4.90 11.02 81.0 6.15 1600
4 3.1049 14.90 11.14 72.9 5.48 1598
5 3.1260 14.89 11.17 93.0 6.98 1606
6 3.0389 14.90 10.95 83.7 6.40 1591
7 3.1008 14.89 11.28 95.8 7.12 1578
8 3.0465 14.89 10.92 88.2 6.77 1601
9 3.0761 14.90 11.05 83.0 6.29 1596
10 3.0402 14.88 11.00 83.3 6.35 1589
11 3.0096 14.89 10.83 84.0 6.50 1595
12 3.0767 14.90 11.07 92.8 7.02 1593
13 3.0207 14.90 11.02 81.2 6.17 1571
14 3.0157 14.89 10.82 87.5 6.78 1600
15 3.0278 14.88 10.90 79.8 6.14 1597
16 3.0085 14.90 10.80 85.8 6.65 1594 17 3.0577 14.90 10.98 73.0 5.57 1596
18 3.0232 14.89 11.02 80.0 6.08 1575
19 3.0726 14.89 11.04 94.5 7.17 1597
20 3.0365 14.90 10.85 71.8 5.54 1604
21 2.9958 14.89 10.74 83.8 6.54 1601
22 3.1071 14.89 11.21 78.8 5.89 1591
23 3.0090 14.90 10.88 76.0 5.85 1585
24 3.0476 14.90 10.92 91.8 7.04 1600
25 3.0911 14.88 11.16 83.8 6.30 1592
26 3.0300 14.89 10.90 83.8 6.44 1596
27 3.0682 14.89 10.95 92.0 7.04 1608
28 3.0305 14.89 11.01 81.3 6.19 1580
29 3.1068 14.90 10.86 88.0 6.78 1640
30 2.9850 14.90 11.14 72.5 5.45 1536
31 3.0040 14.90 10.85 84.5 6.52 1587
32 3.0081 14.91 10.80 59.0 4.57 1594
33 3.1288 14.89 10.80 82.0 6.36 1663
34 3.0460 14.89 11.28 86.3 6.41 1550
79
[Table 4.3 continued]
35 3.0701 14.91 11.00 75.5 5.74 1598
36 3.1516 14.89 11.05 91.3 6.92 1637
37 3.0950 14.89 11.32 96.3 7.13 1569
38 3.0842 14.88 11.04 58.0 4.40 1606
39 3.0493 14.90 11.10 76.3 5.75 1575
40 3.0928 14.90 11.04 87.8 6.66 1606
41 3.0742 14.89 11.08 82.5 6.24 1593
42 2.9611 14.87 10.70 75.0 5.88 1593
43 2.9357 14.89 10.61 89.2 7.05 1588
44 3.0308 14.89 10.84 78.0 6.03 1605
45 2.9290 14.87 10.49 79.5 6.36 1607
46 2.9846 14.89 10.70 77.0 6.03 i601
47 3.0380 14.90 10.84 83.8 6.47 1606
48 3.0200 14.90 10.80 78.3 6.07 1603
49 3.0580 14.89 . 10.97 87.5 6.68 1600
80

Table 4.4 Tensile Strength Measurements for Carbon AL6
Specimen Weight Diameter Length Load Tensile Apparent No. (g) (mm). (mm) (divs.) Strength Density
(MPa) (kgm·3)
1 2.5376 14.85 9.36 69.0 6.19 1565
2 2.6003 14.88 9.72 77.9 6.72 1538
3 2.4992 14.87 9.19 65.8 6.01 1565
4 2.5798 14.90 9.45 74.4 6.59 1565
5 2.5043 14.87 9.35 71.0 6.37 1541
6 2.5527 14.87 9.28 77.5 7.01 1583
7 2.5499 14.87 9.28 70.4 6.36 1581
8 2.5496 14.89 9.28 85.4 7.71 1577
9 2.5558 14.88 9.42 83.7 7.45 1559
10 2.5669 14.86 9.42 63.8 5.69 1570
11 3.6438 14.90 9.95 59.9 5.04 1523
12 2.4884 14.85 9.18 68.5 6.27 1564
13 2.6103 14.88 9.52 75.5 6.65 1576 14 2.6103 14.98 9.69 65.1 5.59 1528 15 2.5422 14.88 9.31 66.5 5.99 1569
16 2.5678 14.86 9.42 73.5 6.55 1571
17 2.5675 14.85 9.33 80.0 7.20 1588 18 2.5892 14.85 9.52 61.0 5.38 1570
19 2.5171 14.83 9.32 68.7 6.20 1563
20 2.6405 14.86 9.63 77.8 6.78 1580
21 2.5007 14.87 9.32 62.5 5.63 1544
22 2.5569 14.87 9.29 73.2 6.61 1584
23 2.5956 14.86 9.54 70.7 6.22 1568
81

Table 4.5 Tensile Strength Measurements for Carbon AL8
Specimen Weight Diameter Length Load' Tensile Apparent No. (g) (mm) (mm) (divs.) Strength Density
(MPa) (kgm·3)
1 2.4819 14.81 9,36 65.6 5,90 1538 2 2,6119 14.91 9,51 76.7 6.75 1572 3 2.5742 14.76 9,59 65.1 5.74 1568 4 2.5520 14.88 9,33 70.6 6.34 1572 5 2.4998 14.74 9,51 56.3 5.01 1540
6 2.5296 14,87 9.45 63.8 5.66 1541
7 2.5589 14,85 9.45 47.5 4.22 1563
8 2.5640 14,80 9,51 56.2 4.98 1566
9 2.5923 14,86 9,52 79.9 7.05 1569
10 2.5243 14,89 9.37 53.2 4.76 1546 11 2.7426 14.87 9.52 50.7 4.47 1658 12 2.5809 14.33 9.32 64.2 5.79 1602
13 2.6260 14.90 9.51 64.9 5.71 1583 14 2.6670 14.89 9.58 63.0 5.51 1598 15 2.6078 14.88 9.52 73.3 6.46 1574 16 2.6610 14.88 10.04 73.1 6.10 1523 17 2.4882 14.65 9.49 56.7 5.09 1555 18 2.6006 14.88 9.48 62.0 5.48 1577 19 2.5843 14.85 9.58 70.8 6.21 1557 20 2.6135 14.89 9.46 75.8 6.71 1586 21 2.6312 14.88 9.59 71.0 6.21 1577 22 2.5973 14.86 9.52. 61.4 5.41 1572
82

Table 4.6 Tensile Strength Measurements for Carbon Y
Specimen Weight Diameter Length Load Tensile Apparent
No. (g) (mm) (mm) (divs.) Strength Density (MPa) (kgm·3)
1 2.7264 14.85 10.19 95.6 7.88 1544
2 2.7825 14.90 10.33 91.9 7.45 1544
3 2.7934 14.89 . 10.29 81.3 6.62 1558
4 2.7727 14.90 10.23 99.8 8.17 1554
5 2.8058 14.90 10.24 92.7 7.58 1571
6 2.7833 14.93 10.19 83.7 6.86 1559
7 2.7635 14.92 10.20 80.8 6.62 1549
8 2.7729 14.92 10.30 62.3 5.06 1539
9 2.7750 14.88 10.20 74.7 6.14 1564
10 2.7758 14.90 10.25 78.9 6.44 1552
11 2.7651 14.90 10.25 99.0 8.09 1546
12 2.7781 14.90 10.26 82.7 6.75 1552
13 2.8142 14.93 10.31 82.1 6.65 1558
14 2.7657 14.88 10.24 81.2 6.65 1552
15 2.7532 14.89 10.22 78.6 6.44 1546
16 2.7805 14.90 10.25 80.7 6.59 1555
17 2.7652 14.93 10.19 100.3 8.23 1549
18 2.7878 14.90 10.22 68.7 5.63 1564
19 2.7337 14.91 10.18 77.7 6.39 1537
20 2.8981 14.87 10.80 86.3 6.70 1544
21 2.7289 14.89 10.09 75.0 6.23 1552
22 2.7488 14.89 10.22 81.3 6.67 1544
23 2.8078 14.86 10.36 64.9 5.26 1562
24 2.7824 14.92 10.24 89.0 7.27 1553
25 2.8231 14.90 10.30 84.5 6.87 1571
26 2.7773 14.91 10.25 62.6 5.11 1551
27 2.7052 14.90 10.28 67.0 5.46 1508
28 2.7812 14.39 10.27 84.5 6.89 1554
29 2.8157 14.89 10.25 89.3 7.30 1577
30 2.7752 14.91 10.24 98.7 8.07 1551
31 2.7736 14.88 10.17 95.6 7.88 1567
32 2.7575 14.91 10.27 47.7 3.88 1537
33 2.7556 14.86 . 10.60 81.5 6.45 1498
83

[Table 4.6 continued]
34 2.7670 14.89 10.18 87.4 7.19 1560
35 2.7819 14.91 10.25 91.3 7.45 1554
36 2.7619 14.90· 10.19 49.0 4.02 1554
37 2.7858 14.92 10.20 89.0 7.30 1561 38 2.7845 14.89 10.25 91.0 7.44 1559 39 2.8268 14.90 10.35 74.9 6.06 1566 40 2.7464 14.89 10.22 83.0 6.80 1542 41 2.7552 14.90 10.21 91.7 7.52 1547 42 2.7986 14.92 10.23 91.1 7.45 1564 43 2.7333 14.90 10.22 86.9 7.12 1533 44 2.7782 14.90 10.26 62.3 5.08 1552 45 2.8200 14.88 10.47 86.2 6.90 1548 46 2.7843 14.90 10.30 85.0 6.91 1550 47 2.7735 14.90 10.28 77.4 6.30 1547 48 2.7256 14.86 10.24 80.3 6.58 1534 49 2.7624 14.90 10.28 60.7 4.94 1540
50 2.7708 14.92 10.25 63.9 5.21 1545
84

Table 4.7 Tensile Strength Measurements for Carbon Z
Specimen
No.
1
2
3
4
5
6
7
8
9
10
11
12
13
14
15
16
17
18
19
20
21
22
23
24
25
26
27
28
29
30
31
32
Weight
(g)
2.7753
2.6889
2.700
2.6886
2.7465
2.7336
2.7342
2.6993
2.7655
2.7706
2.7273
2.7281
2.8056
2.7716
2.7704
2.7723
2.7272
2.7691
2.7474
2.7899
2.7336
2.7661
2.7342
2.7984
2.7741
2.7346
2.6941
2.7775
2.7392
2.7115
2.7199
2.7412
Diameter
(mm)
14.90
14.92
14.91
14.91
14.90
14.90
14.90
14.90
14.91
14.90
14.90
14.92
14.91
14.90
14.91
14.90
14.90
14.89
14.90
14.91
14.99
14.90.
14.92
14.90
14.91
14.92
14.90
14.92
14.91
14.90
14.89
14.91
Length
(mm)
10.26
10.23
10.22
10.26
10.22
10.24
10.27
10.23
10.20
10.32
10.20
10.21
10.23
10.27
10.32
10.22
10.24
10.24
10.25
10.25
10.22
10.17
10.27
10.26
10.27
10.18
10.30
10.25
10.22
10.22
10.18
10.23
85
Load
(divs.)
71.8
60.0
61.5
44.3
74.2
65.4
53.0
61.4
69.0
76.9
55.6
66.6
77.2
78.1
82.0
79.5
85.7
76.5
85.0
95.1
62.3
87.1
72.9
74.7
71.0
75.0
66.8
76.0
78.2
69.5
62.9
51.8
Tensile
Strength
(MPa)
5.86
4.90
5.03
3.61
6.08
5.35
4.32
5.02
5.66
6.24
4.56
5.45
6.31
6.37
6.65
6.51
7.01
6.26
6.94
7.76
5.07
7.17
5.93
6.10
5.78
6.16
5.43
6.20
6.40
5.69
5.18
4.23
Apparent
Density
tkgm·3)
1551
1503
1512
1500
1540
1530
1526
1512
1552
1539
1533
1528
1570
1547
1537
1555
1527
1552
1536
1558
1515
1559
1522
1563
1546
1536
1499
1549
1534
1521
1534
1534

[Table 4.7 continued)
33 2.7761 14.90 10.24 86.3 7.06 1554 34 2.7471 14.92 10.18 65.2 5.35 1543
35 2.7750 14.89 10.22 76.5 6.27 1559
36 2.7568 14.91 10.20 61.0 5.00 1547
37 2.7157 14.90 10.27 63.7 5.19 1516
38 2.7851 14.91 10.26 79.4 6.48 1554
39 2.7623 14.89 10.29 74.8 6.09 1541
86

Table 4.8 Detailed Pore Structural Results for Carbon A4
Specimen Tensile Detected Count Chord Length Closest
No. Strength Area [No. of [Pore size] Approach
(MPa) [Porosity] pores] (Ilm) [Wall size] (%) (Ilm)
7 2.01 26.9 2932 23.4 63.8
30.5 1911 26.5 60.6
32.5 2772 23.9 50.0
24.3 4362 19.4 60.4
29.8 3233 22.9 54.0
4 3.14 28.7 1861 29.5 73.5
30.5 3570 23.5 53.7
35.2 2096 26.1 48.0
31.5 3225 22.2 48.4
30.9 2392 25.9 58.0
29 4.26 37.5 1924 27.5 45.9
34.9 2777 24.8 46.2
37.8 794 35.0 57.7
28.6 1872 26.1 71.3
36.7 1020 31.4 54.0
21 5.37 43.7 1205 36.5 47.2
33.3 2006 23.9 48.0
34.3 1478 26.8 51.4
34.8 1567 26.0 48.7
37.0 1208 29.8 50.8
1 6.22 33.3 1549 30.7 61.3
23.3 1279 33.3 109.5
28.0 2835 23.1 59.4
26.7 2865 25.9 68.7
34.9 888 33.1 61.9
87

Overall means 32.2 2145 27.1 58.1
Standard deviation 4.7 921 4.3 13.3
Standard error 0.9 184 0.9 2.7
Compared to the other electrode materials examined. carbon A4 shows a very high
porosity. and a fairly small number of pores. The mean wall size is twice the mean pore
size.
88

Table 4.9 Detailed Pore Structural Results for Carbon C
Specimen Tensile Detected Count Chord Length Closest
No. Strength Area [No. of [Pore size] Approach
(MPa) [Porosity] pores] (Il m ) [Wall size]
(%) (Il m )
3 1.94 34.2 1876 35.4 68.1
30.5 1108 34.5 78.6
21.8 3368 22.3 80.1
30.8 3004 25.9 58.3
23.0 3158 22.3 74.7
37 2.78 37.1 2992 28.1 47.7
22.9 3094 23.0 77.4
21.1 3694 21.6 81.0
31.4 2724 25.8 56.3
26.9 3526 23.6 64.1
46 3.16 16.8 3929 18.4 91.3
22.6 5331 18.0 61.5
21.4 3870 20.2 74.3
19.8 3467 22.9 92.6
21.6 2988 25.5 92.6
14 3.51 26.1 2443 35.9 101.6
28.1 2045 42.0 107.6
24.4 3949 22.7 .. 70.1
23.9 3051 26.4 83.8
26.5 3417 24.6 68.2
27 4.08 20.1 1830 25.0 99.3 26.4 2292 25.5 71.1
20.8 2574 26.6 101.6
26.0 4230 21.1 60.3
17.2 2488 25.1 120.6
89

[Table 4.9 continued)
20 4.52 25.0 3705 22.1 66.1
20.2 3567 22.1 87.1
24.2 4660 19.7 61.5
28.9 3821 21.6 53.0
29.7 1795 28.5 67.4
Overall means 26.2 3133 25.2 77.3
Standard deviation 4.8 918 5.5 17.6
Standard error 0.9 168 1.0 3.2
Carbon C shows fairly high porosity, with relatively thick walls (carbon matrix).
90

Table 4.10 Detailed Pore Structural Results for Carbon P
Specimen Tensile N.Area Count Chord Length Closest
No. Strength [Porosity] [No. of [Pore size] Approach
(MPa) (%) pores] (~m) [Wall size]
(~m)
38 4.40 21.0 7361 14.6 55.1
15.4 2540 14.3 78.5
19.9 7238 14.7 58.9
22.6 6398 16.8 57.4
19.9 6481 16.0 64.4
20 5.54 22.8 7897 14.7 50.0 25.0 9595 15.7 47.0
29.2 8219 17.5 42.3
21.5 6951 16.0 58.4
16.8 5282 15.5 76.8
46 6.03 24.5 6081 15.9 48.9
32.8 4572 20.0 40.9
30.5 5868 18.3 41.8
31.8 6330 17.5 37.6 25.7 6790 16.6 47.9
41 6.24 23.4 6023 16.1 52.7
26.7 6851 15.9 43.8
14.6 3484 16.7 97.9 25.0 5356 17.4 52.3
21.4 5416 15.6 57.5
16 6.65 28.2 6892 16.2 41.4
23.6 5820 17.9 57.8
30.2 7618 16.7 38.7 26.0 6497 15.9 43.6 24.0 6053 16.8 53.2
91

[Table 4. IO continued]
37 7.13 19.9 5070 16.6 66.7
18.5 5329 16.4 72.7
22.3 6834 15.8 55.1
18.1 5920 15.3 69.0
23.2 6250 16.2 53.8
Overall means 23.5 6344 16.3 55.4
Standard deviation 4.7 1356 1.2 13.6
Standard error 0.9 248 0.2 2.5
Carbon P is not very porous. The pores are numerous, but relatively small.
92

Table 4.11 Detailed Pore Structural Results for Carbon AL6
Specimen Tensile N.Area Count Chord Length Closest No. Strength [Porosity] [No. of [Pore size] Approach
(MPa) (%) pores] (jJ.m) [Wall size]
(jJ.m)
11 5.04 20.0 7235 16.9 67.4 20.3 7861 15.7 61.7 19.6 7369 14.8 60.7 22.2 7519 16.8 58.7 30.2 8769 16.4 37.8
10 5.69 16.4 7068 14.8 75.6
20.9 8654 15.0 56.7 21.7 8354 16.6 58.5 22.4 9532 15.4 53.2 17.7 6007 17.2 79.8
12 6.27 26.0 9879 15.1 42.9
22.0 9646 13.4 47.6
26.6 9004 14.7 40.6'
22.9 13683 13.4 45.2
30.2 8769 16.4 37.8
20 6.78 20.5 7335 15.6 92.9 25.6 7458 16.1 46.8
23.1 8342 15.1 50.3 28.5 7489 16.4 41.2
20.5 7866 14.9 57.6
17 7.20 23.0 7682 16.2 54.4
22.7 8650 14.1 48.0
16.9 7044 14.0 68.7 23.5 7286 15.5 50.6 22.9 7679 15.6 52.6
93

[Table 4.11 continued]
8 7.71 28.9 7342 16.0 39.3
26.7 8218 14.9 40.7
19.4 6613 23.3 62.7
25.4 8298 14.9 43.8
26.2 6940 16.6 46.7
Overall means 22.9 8244 15.7 54.2
Standard deviation 3.7 1391 1.7 13.2
Standard error 0.7 254 0.3 2.4
Carbon AL6 is not very porous. It has a large number of particularly small pores.
94

Table 4.12 Detailed Pore Structural Results for Carbon AL8
Specimen Tensile N.Area Count Chord Length Closest
No. Strength [Porosity] [No. of [Pore size] Approach
(MPa) (%) pores] (I1m ) [Wall size]
(I1m )
7 4.22 20.0 10093 12.2 48.5
18.7 7493 13.9 60.1
21.4 8656 14.3 52.3
20.5 8228 14.2 55.1
20.4 8014 13.6 53.0
10 4.76 27.3 8658 16.0 46.6
31.2 7712 16.8 37.1
29.9 7484 15.8 37.0
33.4 7299 17.2 34.4
33.5 9662 14.4 28.7
22 5.41 25.3 9903 13.8 40.7
21.2 9108 12.8 47.5
24.3 9036 14.4 44.7
24.8 9874 13.5 41.1
24.5 9535 13.4 41.4
12 5.79 22.8 8138 15.4 52.2
28.8 7306 15.9 39.5
21.0 7786 14.9 55.8
22.4 8638 13.8 47.8
23.8 9466 13.9 44.5
21 6.21 18.7 6992 15.2 65.8
24.2 6760 16.0 50.0
19.3 7740 13.7 57.3
25.3 7736 16.2 47.9
19.8 7077 15.5 62.9
95

[Table 4.12 continued]
2 6.75 22.4 6346 17.7 61.2
20.4 7061 15.5 60.5
19.1 6463 15.6 66.3 24.0 7944 15.8 49.9
23.3 8145 18.5 66.3
Overall means 23.7 8145 15.0 49.9
Standard deviation 4.2 1066 1.5 10.0
Standard error 0.8 195 0.3 1.8
Carbon AL8 is not particularly porous. It has a large number of small pores.
96

Table 4.13 Detailed Pore Structural Results for Carbon Y
Specimen Tensile N.Area Count Chord Length Closest
No. Strength [Porosity] [No. of [Pore size] Approach
(MPa) (%) pores] (Jlm) [Wall size]
(Jlm)
32 3.88 24.3 5679 26.0 80.9
21.0 7300 18.1 68.1
18.4 6131 20.4 90.5
18.4 5118 23.2 99.9
17.5 3572 24.0 112.9
49 4.94 22.2 7016 18.6 65.2
24.2 7257 19.1 59.9
24.0 8643 17.9 56.7
23.1 8434 18.3 61.0
23.7 11889 16.4 52.6
27 5.46 19.3 5956 20.2 84.5
19.9 7022 19.1 76.9
19.8 6311 18.3 74.3
18.8 6226 18.8 81.2
17.7 5763 20.1 95.5
47 6.30 22.4 6513 20.3 70.1
23.0 5889 19.6 65.9
26.5 7464 21.2 58.7
21.5 7281 17.8 65.0
22.1 8279 17.4 61.4
34 7.19 19.7 9507 16.6 67.8 22.1 8830 17.7 62.3
25.0 7663 19.2 57.7
21.1 6766 19.4 72.5
22.4 6612 20.1 69.3
97

[Table 4.13 continued]
1 7.88 26.6 8990 19.8 54.5
25.2 10772 17.8 52.9
19.6 7613 17.4 71.7
26.2 6187 22.7 64.2
20.8 8135 18.1 69.3
Overall means 21.9 7294 19.5 70.8
Standard deviation 2.6 1681 2.2 14.4
Standard error 0.5 307 0.4 2.6
Carbon Y has quite a large number of fairly small pores.
98
Table 4.14 Detailed Pore Structural Results for Carbon Z
Specimen Tensile N.Area Count Chord Length Closest
No. Strength [Porosity] [No. of [Pore size] Approach
(MPa) (%) pores] (Il-m) [Wall size]
(Il-m)
4 3.61 30.3 7902 21.3 49.1
25.0 8775 18.6 55.8 21.5 7614 19.8 72.3 21.0 7884 17.5 66.0 23.8 8055 19.2 61.6
7 4.32 22.5 7889 21.0 72.3
22.6 6913 20.6 70.5 24.9 5873 21.3 64.2 22.1 7088 18.6 65.8 25.2 6967 20.8 62.0
37 5.19 18.7 4229 20.8 90.6 22.5 7406 20.1 69.3
24.6 6513 23.3 71.1 26.2 6821 23.0 64.6
24.2 6680 20.4 63.9
5 6.08 22.6 6657 20.3 69.6 24.0 7028 21.4 67.9 23.1 6809 20.8 69.5
21.3 5772 20.8 77.0 21.7 6028 20.7 74.9
19 6.94 26.0 5903 24.1 69.6 26.1 5393 27.0 76.4
18.6 4443 21.4 94.0
22.4 6522 20.3 70.3
19.2 6009 18.9 79.4
99

[Table 4.14 continued)
20 7.76 21.5 7805 18.4 67.2
23.6 6948 20.2 65.4
20.6 6725 18.1 69.5
24.7 5721 22.7 69.2
26.0 6474 22.3 63.3
Overall means 23.0 6695 20.8 68.4
Standard deviation 2.5 1026 1.9 8.7
Standard error 0.5 187 0.4 1.6
Carbon Z has quite a large number of fairly small pores.
100

Table 4.15 - Detailed Fractographlc Data for Carbon A4
(Number of Observations per Category)
Specimen! No. of Observations in Each Category
half
FF BF IFF IFB HPF HPB PS IPF
8 14 12 0 1 0 0 23 0
22 21 3 0 0 0 3 I
10 15 19 3 1 0 0 11 1
13 15 4 2 0 0 15 I
35 11 16 2 6 0 0 14 1
13 13 4 2 0 0 15 3
16 21 17 3 0 0 0 9 0
15 19 1 2 0 0 13 0
36 22 7 7 6 0 0 6 2
15 15 2 3 0 0 15 0
TOTALS 161 154 29 23 0 0 124 9
GF
0
0
0
0
0
0
0
0
0
0
0
Carbon A4 shows a large number of binder and ftller fractures, and a relatively small
number of interfacial failures, indicating that it is well-bonded.
101

Table 4.16 - Detailed Fractographic Data for Carbon C
(Number of Observations per Category)
Specimenl No. of Observations in Each Category
half
FF BF IFF IFB HPF HPB PS IPF
12 8 4 5 5 0 0 28 0
14 12 7 2 0 0 15 0
18 6 19 4 0 0 0 19 2
9 20 3 3 0 0 15 0
25 6 13 3 1 0 0 27 0
6 17 1 2 0 0 24 0
43 4 20 3 2 0 1 20 0
10 21 3 6 0 0 10 0
48 13 11 2 1 0 0 22 1
7 20 0 3 0 0 20 0
TOTALS 83 157 31 25 0 1 200 3·
GF
0
0
0
0
0
0
0
0
0
0
0
Carbon C shows a large number of pore surfaces. and less filler particle fractures.
102

Table 4.17 • Detailed Fractographlc Data for Carbon P
(Number of Observations per Category)
Specimen! No. of Observations in Each Category
half
FF BF IFF IFB HPF HPB PS IPF
5 13 25 4 0 0 0 5 3 21 21 3 1 0 0 2 2
22 19 15 4 2 0 0 10 0 9 24 5 2 0 0 8 2
25 15 17 2 2 0 2 7 4 20 8 2 1 0 1 16 2
35 12 18 4 4 2 0 7 3 11 22 4 4 0 0 3 6
49 14 22 1 2 0 0 9 2
15 15 3 3 1 0 12 1
TOTALS 149 187 32 21 3 3 79 25
GF
0
0
0 0
0
0
0 0
0 0
0
Carbon P shows a very large number of binder and filler fractures, indicating that it is
very well-bonded and may therefore be expected to be of relatively high tensile
strength.
103

Table 4.18 - Detailed Fractographlc Data for Carbon AL6
(Number of Observations per Category)
Specimenl No. of Observations in Each Category
half
FF BF IFF IFB HPF HPB PS IPF
3 21 16 0 0 0 0 11 2
17 14 1 5 0 I 12 0
6 21 10 3 1 3 0 11 1
20 15 1 0 I 0 18 3
7 19 20 1 0 0 0 IQ 0
13 11 3 2 0 0 19 0
10 21 15 1 1 0 0 9 0
17 14 3 0 0 0 14 0
13 16 14 2 1 1 0 14 2
13 13 3 3 0 0 15 3
TOTALS 178 142 18 13 1 5 123 11
GF
0
0
0
2
0
2
0
1
0
0
5
Carbon AL6 shows a large number of binder and filler fractures. It would therefore be
expected to be of high tensile strength.
104
Table 4.19 - Detailed Fractographlc Data for Carbon AL8
(Number of Observations per Category)
Specimen! No. of Observations in Each Category
half
FF BF IFF IFB UPF UPB PS IPF
3 16 13 1 1 0 1 17 1
10 11 1 0 0 0 27 1
4 9 19 2 1 0 0 18 1
8 14 6 2 2 0 16 1
17 15 6 3 4 0 0 21 1
12 10 5 10 0 0 11 2
18 5 14 18 10 0 0 2 1
6 7 16 5 I 0 13 2
20 7 7 12 6 0 0 14 4
5 11 14 8 0 0 11 1
TOTALS 93 112 78 47 3 1 150 15
GF
0
0
0
1
0
0
0
0
0
0
1
Carbon AL8 shows a smaller number of binder and a much smaller number of filler
fractures than Carbon AL6. It would therefore be expected to be of lower tensile
strength.
105

Table 4.20 - Detailed Fractographlc Data for Carbon V
(Number of Observations per Category)
Specimenl No. of Observations in Each Category
half
FF BF IFF IFB HPF HPB PS IPF
3 20 11 4 0 0 0 13 1 18 12 4 2 0 0 12 0
5 10 15 10 5 0 0 10 0 13 12 8 8 0 0 9 0
9 16 5 10 3 0 0 16 0 16 9 2 17 0 0 5 1
18 20 12 2 4 0 0 11 1 16 13 7 1 0 2 10 1
43 16 10 12 5 0 0 6 2 20 8 7 3 1 0 7 4
TOTALS 165 107 66 48 1 2 99 10
GF
0 0
0
0
0
0
0
0
0
0
0
Carbon Y has a larger number of interface failures than carbons P, AI6 and ALS, and
would therefore be expected to be of lower tensile strength.
106

Table 4.21 • Detailed Fractographlc Data for Carbon Z
(Number of. Observations per Category)
Specimen! No. of Observations in Each Category
half
FF BF IFF IFB HPF HPB PS IPF
1 24 11 9 3 0 0 1 2 •
22 12 11 0 0 0 5 0
2 12 10 15 3 0 0 8 2
18 9 14 2 0 0 4 3
6 19 10 9 2 0 0 8 2
22 14 8 4 0 0 10 2
15 18 9 12 1 0 0 8 2
10 14 16 3 0 0 6 1
18 12 12 15 1 0 0 5 5 24 9 11 1 0 0 4 1
TOTALS 181 110 120 20 0 0 58 20
GF
0
0
0
0
0
0
0
0
0
0
0
Carbon Z shows a very large percentage of interface failures, especially filler side. It
would therefore be expected to be of relatively low tensile strength.
107

Table 4.22 - Results for Electrical Resistivity
Carbon
A4
C
P
AL6
AL8
Y
Z
Mean Resistivity (mn cm· l )
5.08
4.15
6.78
5.63
6.12
108

Table 4.23 - Results for Real Density/Porosity
Carbon
A4
C
P
AL6
AL8
Y
Z
Apparent Real
Density
(kgm·3)
1470
1505
1596
1564
1570
1546
1537
Density
(kgm·3)
1848
1853
1950
1889
1974
2025
1949
2058
2150
2171
2062
2038
2011
2098
Calculated Mean
Porosity
(%)
20
21
23
20
19
21
20
24
27
28
24
25
24
27
Calculated
Porosity (%)
20.5
21.5
20
22
27.5
24.5
25.5
Q800
Porosity
(%)
32
26
23
23
24
22
23
There is good agreement between the values for porosity obtained from the image
analysis data and calculated from the real density results, except in the case of carbon
A4 and possibly carbon C. Since these were the two carbons based on calcined
anthracite, it is possible either that the image analysis results for these materials are less
accurate than those for the petroleum coke· based carbons, or that the method for
measuring real density is unsuitable for use with these materials. It is considered that
the former is the more likely, since the accuracy of the method for real density should
not depend on the type of material used.
109

Table 4.24 - Results for Wettability Tests
Run 1
Time (min.) Coke Temperature (OC) Comments
0 82 1 87 2 92 3 97 4 103 5 109 6 115 7 121 Spheres start to fonn
8 127 9 132 Spheres fully fonned
10 138 11 143 12 148 13 153 14 158 Wetting temperature
15 163 Spreading temperature
16 167 17 171 Pitch almost disappeared
18 175 Penetration complete
Average temperature rise rate = S.2°C per minute.
110

----- --- -----
Run 2
Time (min.) Coke Temperature (OC) Comments
0 85
1 89
2 93
3 97
4 102
5 107
6 112 Pitch softening
7 117 Spheres StaIt to form
8 122
9 127 Spheres fully fonned
10 132
11 137
12 142
13 147
14 152
15 157 Wetting temperature
16 162
17 167
18 171 Spreading temperature
19 174 Penetration complete
Average temperature rise rate = 4.7°C per nlinute.
111

Figure 4.1 - Resistivity Results for Carbon A4
28
0 27- 6
26 0 0
6" • 25
0
24 0
C --S 23 0 <D
~ () s::: 0 0 - 22 (I)
·iii <D ~ 0 ~
21 0
6 .. 20 0
ca Legend
• • Core 1 19 6 0 Core 2
• Core 3 18- 60 0
• o Core 4
17 • 6 Core 5
1 1.5 2 2.5 3 3.5 4 4.5 5 5.5
Length (cm)
112

Figure 4.2 - Resistivity Results for Carbon C
28T-----------------------------------~
26 •
113

Figure 4.3 - Resistivity Results for Carbon P
27 0
26- • ~
25 0
• • 24-
0 .L1 L1 0
C 23-
g 0 ., • 0 22- • c:
00 -E • VI .iij • .,
21- 0 a::
• 20 L1 0
~o Legend 19 •• 0 • Core 1 . ~
0 Core 2 0 18 • Core 3
0 0 Core 4
L1 Core 5 17 , , , , ,
1.5 2 2.5 :3 3.5 4
Length (cm)
114

Figure 4.4 - Resistivity Results for Carbon Y
27
~ 26 D'V
25 +
24
~'V 23 ill
C +iI -.S 22
Q) 0 c 0 ..... 21-VI
"iii Q)
>+ c::: 20 M> Legend
0 • Core 1
19 0 Core 2
• Core 3
18 0 Core 4
.t /:;. Core 5
X Core 6 17 -
'V Core 7 0 + Core 8
16 , , , , 1 1.5 2 2.5 3 3.5 4 4.5 5
Length (cm)
115

Figure 4.5 - Resistivity Results for Carbon Z
26,-----------------------------------~
o 24
116

5 Discussion and Conclusions
The principal objective of this research project was to examine a range of different
electrode materials used in the aluminium industry, investigating the relative
contributions of their pore structural characteristics and binder-ftller bond quality to
their mechanical strength and electrical resistivity. As described in the literature review,
although metallurgical cokes do not strictly conform to classical brittle fracture theory,
the Griffiths theory may be applied successfully; recent work by Patrick, Walker,
S~rlie and others [57, 58] suggests that this may also be the case with baked electrode
carbons. On the basis of the Griffiths theory of fracture, the strength of a structure is
determined by the number and size of flaws (cracks) present; if a crack reaches its
critical length, it will extend rapidly and failure of the structure will ensue. Since the
largest flaws in a coke are associated wi th its porous structure, it is not unreasonable to
suggest that the pores may correspond to the Griffith critical cracks. This hypothesis
has been applied with some success to metallurgical cokes, but does not take into
account the two-phase structure of electrodes used in the aluminium industry. For such
materials it may be necessary to consider the effect of the quality of the interface
between the two phases (binder and filler) of the electrode; for example, a
poorly-bonded electrode may fail at the binder-filler interface before failure due to the
pore structural characteristics can take place. Hence the two main experimental
procedures of pore structural analysis and fractography were used in conjunction with
each other, on the same carbon electrode materials, with the intention of relating the
results from the two procedures. Results could have fallen into one of several
categories:
(1) Finding that there was no relationship between tensile strength and pore structural
factors would indicate that the experimental procedure used was unsuitable, the
wrong parameters were being examined, or the pore structural factors are of little
or no importance in a two-phase material such as an aluminium electrode. On the
basis of previous work, this would have been an unexpected result.
(2) Finding that the observed tensile strengths of the electrode materials could be
satisfactorily accounted for by the pore structural data would indicate that the
two-phase structure of the electrode material was irrelevant to its strength. This
would have meant that electrodes had similar tensile strength properties to
metallurgical cokes.
(3) Finding that the pore structural results were unrelated to the tensile strengths of the
electrodes, but that the fractography results satisfactorily accounted for the
117

observed strengths, would inclicate that the tensile strength of aluminium electrodes
was completely accounted for by the efficiency of the binder-filler interface, the
experimental procedure used was unsuitable, or the wrong parameters were being
examined.
(4) Fincling that the tensile strengths could be accounted for by a combination of the
pore structural results and fractography results would indicate that both the pore
characteristics and the efficiency of the interface between binder and filler
contributed to the mechanical strength of the electrode. If this were found to be the
case, it would remain to be determined what the relative contributions of the two
factors were in electrodes fabricated from different materials.
(5) Finding that the tensile strengths were unrelated either to the pore structural results
or the fractography results would indicate that the procedures used were
insufficiently sensitive to differentiate between the materials or were unsuitable
because they were provicling data about features of the carbons which were not
significant in influencing the properties being investigated here.
Which of these categories is correct will be discussed below. The first three
sub-sections of this cliscussion consider the results for tensile strength, tensile strength
and porosity, and tensile strength and fractography respectively. The next section
attempts to relate the results for tensile strength, porosity and fractography. The
following section considers the results for resistivity, and the final section draws some
overall conclusions.
5.1 Tensile Strength
The tensile strengths of the group of specimens for each carbon were found to follow
an approximately normal distribution. The tensile strengths of the two calcined
anthracite-based carbons were significantly clifferent, at 4.89 and 3.38 MPa, while their
mean apparent densities were similar, at 1470 and 1505 kgm-3 respectively. The mean
tensile strengths of the petroleum coke-based carbons were all higher than those of the
calcined anthracite-based carbons; the values ranged from 5.71 MPa (for carbon AL8)
to 6.62 MPa (carbon Y). This is a smaller range than that for the calcined
anthracite-based carbons, and indicates that less variation is likely to occur in the tensile
strengths of electrodes made- with a petroleum coke filler. Since only two calcined
anthracite-based carbons were available, it is clifficult to draw definite conclusions, but
on the basis of these results, petroleum coke is the preferred material for use as the
filler, where mechanical strength of the electrode is important
118

A considerable amount of work has been done on tensile strengths of metallurgical and
other cokes; for example, Patrick and Stacey [55] examined cokes with strengths from
2-6 MPa. This is smaller than the range for the petroleum coke-based materials
examined in this project. Less has been published on strengths of calcined
anthracite-based electrode materials, but recently some work has been done on such
materials with strengths ranging from 1-5 MPa [57, 58]. This range covers the
strengths of the two calcined anthracite-based carbons examined in this project.
However, the different pieces of work cannot be compared directly because different
specimen sizes were used in tensile strength testing; larger specimens will have lower
tensile strengths than smaller specimens made of the same material, because there is an
increased probability of a critically-sized flaw being present.
5.2 Strength/Porosity Results
The pore structural characteristics indicate significant differences between the calcined
anthracite-based and petroleum coke-based carbons. The latter all have much higher
mean tensile strengths than the former, and also have a much larger number of smaller
pores. The total porosity is also somewhat lower. Given that there is a greater disparity
between the pore sizes and number of pores than between the total porosities, it is a
reasonable assumption that the number of pores and size of the pores are more
significant parameters than the total volume porosity.
It is possible to draw some general conclusions about the relationship between the
strength of the carbons and their pore structural characteristics. For the materials used
in this work, those based on calcined anthracite as the filler resulted in relatively weak
electrodes with a coarse structure, with relatively large filler particles and pores (mean
pore size around 25J.Lm). This coarse structure is easily seen under polarised light or
using the image analysis system. For the materials used in this work, the use of
petroleum coke resulted in stronger electrodes with a much more fine-grained structure,
with relatively small filler particles and pores (mean pore size aroundI5-2DJ.Lm)_ Within
the group of petroleum coke-based electrodes, increasing tensile strength was asociated
with decreasing porosity, and to some extent with decreasing pore size. The latter
supports the view that the pores are the source of Griffith critical cracks; on this basis,
the smaller the pores, the more difficult will be the propagation of a critically-sized
crack, and the stronger will be the carbon.
For metallurgical cokes and some baked carbon electrode materials, the tensile strength,
number of pores, pore size and wall size have been related using an equation of the
form S.N = k + a.W/p2, with the values of the constant k and coefficient a depending
on the raw materials used [56, 57,58]. It was reasonable to try to determine if this
119

relationship was applicable to the materials being examined here.
Regression analysis of the pore sttuctural data yielded the equation:
S.N = -12209.W/p2 + 233630
R-sq 84.2%
S.E.E = 5992
This indicates a strong correlation between the quantities S.N and W/p2, which is
shown in Figure 5.1, using a single point to represent the data for all the specimens of
each carbon. The result shows that the pore sttuctural data obtained for the carbon
materials examined here can be successfully related to the tensile strengths of the
materials, using an equation of the form S.N = k + a.W/p2. Examination of the
distribution of points on the graph confirms that there are significant differences
between the two groups of electrodes, and that the raw materials used have a major
effect on the properties of the finished electrode.
On the basis of previous work, it was reasonable to suggest that plotting the values for
S.N against those for W /p2 for the individual specimens of the different carbons would
produce a series of straight lines, with a different gradient for each carbon. As shown
by Figure 5.2, this did not prove possible. The reason for not being able to obtain the
regression lines may be that a much larger number of specimens would be needed, the
error associated with a single specimen being considerable. An alternative explanation
is that the procedure used is insufficiently sensitive to differentiate between the
materials, possibly because of the difficulty of adequately reducing the level of human
error in the image analysis work.
Overall, it may therefore be concluded that the tensile strengths of the carbons examined
can be accounted for to a large extent by their pore sttuctural characteristics, but that
the strengths cannot be accounted for completely in this way.
120

5.3 Strength and Fractography
Carbon Tensile Percentage of Observations per Category
Strength
(MPa)
FF BF IFF PS
C 3.38 16.6 31.4 6.2 40
A4 4.89 32.2 30.8 5.8 24.8
AL8 5.71 18.6 22.4 15.6 30
Z 5.82 34.2 22 24 11.8
P 6.32 29.8 37.4 6.4 15.8
AL6 6.36 35.6 28.4 3.6 24.6
Y 6.62 33 21.4 13.6 19.8
Of the two calcined-anthracite based carbons, the one based on GCNgraphite (carbon
A4) shows higher tensile strength and a relatively large percentage of filler fracture,
indicating good binder-filler bonding, while the one based on ECA (carbon C) shows
a much lower percentage of filler fracture and a slightly higher percentage of interfacial
failure (fIller side); the relative weakness of this carbon may be partly due to the higher
percentage of interfacial failure and also panly to the higher percentage of pore
surface. It is possible that the shape of the pores is significant here; a material with
very flattened or elongated pores would be likely to show more pore surface on a
fracture than would a material with spherical pores .
. Of the five petroleum coke-based carbons, strength defmitely appears to be related to
the percentage of fIller fracture. The three strongest carbons, P, AL6 and Y, all show a
high percentage of fIller fracture, indicating good binder-filler bonding (since the filler
has failed, and not the binder-filler interface). Carbon Z is weaker than these carbons,
although it shows a comparable percentage of filler fracture; this may be accounted for
by the very large percentage of interfacial failure, so that binder-filler bonding is less
121

effective than in carbons P, AL6 and Y. The weakest petroleum coke-based carbon,
AL8, shows both a relatively low percentage of filler fracture and a high percentage of
interfacial failure. These data indicate that the percentages of filler fracture and
interfacial failure are the most important factors in correlating tensile strength and
fracto graphic features in carbon electrodes, since the other types of feature observed
show no significant correlation with the strengths of the different carbons. This may
be due to the difficulty of categorising some features; for example, it is often difficult
to distinguish between binder fracture and interfacial failure (binder side).
Looking at the results for both sets of carbons, the results for the calcined
anthracite-based carbons are largely explicable in terms of the percentages of filler
fracture and pore surface. This is because the calcined anthracite-based carbons are
relatively well-bonded at the binder-filler interface, so the controlling factors for
fracture are the strength of the filler particles and the amount of porosity. A high value
for the former clearly contributes to a strong electrode, while a high value for the latter
will tend to result in a weaker electrode, since however strong the filler particles are,
the electrode will be weak if much of its volume is made up of pores.
The results for the petroleum coke-based carbons are largely explicable in terms of the
percentages of filler fracture and interfacial failure. This is because the petroleum
coke-based carbons show less effective binder-filler bonding, so the controlling
factors for fracture are the strength of the mler particles (for the same reason as
described above) and the percentage of interfacial failure, which reflects the quality of
the binder-filler bonding. The smaller pore size and lower total porosity of the
petroleum coke-based carbons indicates that these factors have a less dominant effect
in determining the tensile strength.
122

5.4 Strength/Porosity Results and Fractography
Filler fracture was chosen as the single most reliable indicator of quality of
binder-filler interface bonding, a low percentage of filler fracture being observed in
poorly-bonded materials.
A table summarising tensile strength, fractographic and pore structural data is shown
below.
Carbon Mean Tensile % Filler % No. Pores Pore
Strength Fracture Porosity per mm1 Size
(Mh) (~m)
C 3.38 17 26 2455 25.18
A4 4.89 32 32 1681 27.08
AL8 5.71 19 24 6344 14.99
Z 5.82 34 23 5247 20.80
P 6.32 30 23 4972 16.31
AL6 6.36 36 23 6461 15.7
Y 6.62 33 22 5716 19.45
It is difficult to relate the results from strength/porosity measurements and fractography
on a simple basis, because many factors are involved, some of them mutually
dependent. However, some conclusions can be drawn by treating the carbons on the
basis of the type of filler used. The stronger of the calcined anthracite-based carbons
(A4) had a larger percentage of filler fracture and a larger total porosity; the pores were
larger and less numerous. These results indicate opposing effects of the propenies of
the carbon matrix and the pore strucrural characteristics on the strength of the material,
since it would be expected on the basis of previous work, and on other results in this
study, that higher strength would be associated with a larger number of smaller pores.
This may be observed where a larger number of carbons are used; the fact that only two
123

electrode materials made with calcined anthracite as filler were available makes it difficult to draw definite conclusions. For the petroleum coke-based carbons, higher
strengths are associated with a larger amount of filler fracTUre. The former is what
would be expected in a range of materials with progressively increasing tensile
strengths (provided that porosity of all the materials was comparable).
124

5.5 Comments on Resistivity
Of the five carbons tested. the resistivities of the GCA/graphite-based and ECA-based
materials were comparable. and lower than the values obtained for the petroleum
coke-based carbons. This may be because although ECA is associated with poor quality
bonding. this factor may be offset by the larger size of the filler particles. which
reduces the total area of interfaces. and thus enhances conductivity. The presence of the
graphite in carbon A4 may enhance conductivity. because of the good conductivity
along the graphite planes. It is also possible that the fillers in the anthracite-based
carbons may have been heated to higher temperatures. which may have lead to panial
graphitisation and consequently lower electrical resistivity.
The mean electrical resistivity for each carbon was compared with its mean tensile
strength. to see if low resistivity was associated with high strength. on the basis that a
well-bonded material might be expected to exhibit low resistivity. The strongest carbon
(Y) did show the lowest resistivity of the petroleum coke-based materials. but it is very
difficult to draw any definite conclusions because of the small number of different
materials available (two calcined-anthracite based and three petroleum coked-based) for
this test. However. on the basis of the results obtained. calcined anthracite materials
would appear to be the most suitable fIllers.
125

5.6 Conclusions
The results which have been obtained are encouraging in terms of relating the strength
of the electrode materials to aspects of the porous structure and fractographic features.
The results for the image analysis carried out appear to be fairly satisfactory, in giving
results for calculated strengths. Considering all the carbons together, attempts to relate
individual specimens for a particular carbon on the basis of an S.N against Wtp2 type
of equation were not very successful. This may have been due to the procedure used
being insufficiently sensitive to differentiate between the specimens. However, there
are clear differences between the carbons, and using the data for each carbon to produce
a single point supports the previously-reported work which suggests the general
applicability of an equation of the form S.N = k + a. W tp2.
In fractography, the number of sampling points used appears to give an adequate
number of points in the key categories ofmler fracture and interfacial failure. Also, the
number of cores looked at seems to be adequate, with little difference between results
for each core. The main means of producing accurate results using this method is
careful allocation of each sampling point.
The procedures for determination of electrical resistivity, wettability and real density
appear to be sound, and are ready for use on further carbon materials (although the
wettability test can only be used on materials where both the binder and filler are
available).
It has been demonstrated that different raw materials result in electrodes with widely
differing mechanical. pore structural and electrical properties. The differences in
strength between the different electrodes cannot be accounted for solely in terms of
either pore structural characteristics or fractography results. As described in the
literature review, a strong case has been made out for the pores in cokes being the
source of the Griffith critical cracks which lead to mechanical failure of the coke. This
may hold true for electrodes as well, but the present work has indicated that the
two-phase nature of electrode carbons has a significant effect on the mechanical
properties of the electrode. The results from this project suggest that in electrodes
which have a high volume porosity and large mean pore size, the porosity effects are
dominant, with the interfacial characteristics playing a less important role in determining
the electrode's strength. In other words, the electrode fails by pore structural weakness
before any interfacial weakness can have an effect Evidence for this conclusion may be
seen in the fractography results for the two calcined anthracite-based carbons; the
126

percentage of filler fracture in these materials is not greatly different to the values
obtained for the petroleum coke-based materials, but these electrodes are more porous
and considerably weaker than any of the petroleum coke-based electrodes.
Conversely, in electrode materials where the volume porosity is low and the mean pore
size is small, it is suggested by the present work that the interfacial effects play the
dominant role in determining the strength of the electrode; the electrode fails because of
a poor quality binder-filler interface before Griffith critical cracks can develop.
Evidence for this conclusion may be seen in the fractography results for the petroleum
coke-based electrodes, where the weakest showed the lowest percentage of interfacial
failures, while the strongest showed better interfacial bonding.
In practice, in nearly all commercial electrode materials it is difficult to distinguish
clearly between pore s~ctural and binder-filler bond quality effects. However,
experiments can be envisaged to study the two effects separately, as described below.
127

5.7 Recommendations for Further Work
The image analysis procedure should be examined critically, with a view to increasing
the reliability of setting the detection level. Also it may be necessary to use a larger
number of specimens, or further refine the procedure used, to increase the reliability of
the results.
In fractography, the procedure used appears to produce reliable results. More carbons,
especially calcined anthracite-based, need to be looked at
The effects of interfacial bond quality could be examined by fabricating electrodes with
a very low volume porosity and very small pores, to enable differences in bond quality
to be studied without having to take into account porosity effects. Similarly, effon
could be put into producing an electrode material with very high quality interfacial
bonding, so that the porosity effects could be studied. The overall plan would be to
reduce the number of variables involved.
The procedures for resistivity, wettability and real density appear to be sound, and are
ready for use on further carbon materials (although the wettability test can only be used
on materials where both the binder and filler are available). The area of relating
electrical resistivity to the microscopic structural characteristics of carbons appears to be
one in which very little work has been done; given that low resistivity is a desirable
feature of an electrode, further investigation in this field should be of both theoretical
interest and practical value.
Ultimately, it is likely that further work of the type undenaken in this project could lead
to the development of a more reliable means of manufacturing electrodes with both high
mechanical strength and low electrical resistivity, following further acquisition of data
about the microscopic structural features of electrode carbons.
128
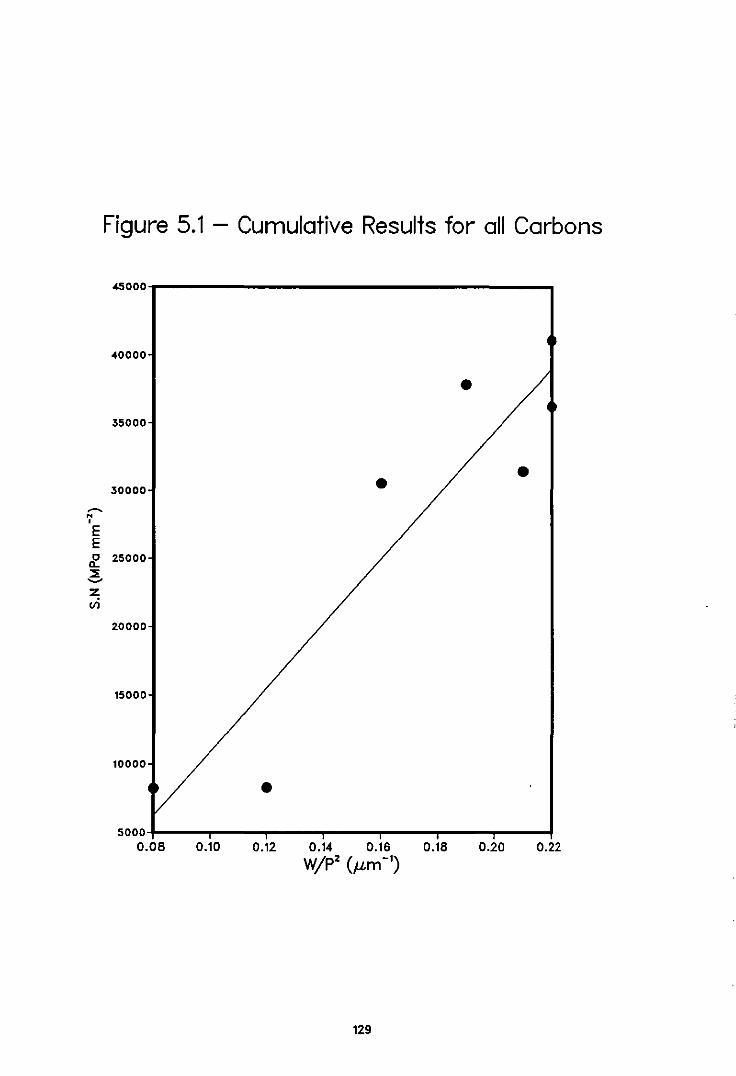
~ N , E E
Figure 5.1 - Cumulative Results for all Carbons
45000-r---------------------.
40000
• 35000
• 30000 •
~ 25000
~ Z vi
20000
'5000
'0000
• 50001+---~-~--~--~-~--_r-~
0.08 0.10 0.12 0.14 0.16 0.18 Wjp2 (J.Lm -')
129
0.20 0.22

Figure 5.2 - Cumulative Results for all Specimens
70000 0
X
60000
0 X 0
/::,. 50000
f ~X
/::"0
• • ~ 40000 N
/::,.W 0 , E E • " "- X
:::E \l ~
~ 30000 'V • x Legend
20000 -A4
o C
• P
~ 0
10000 0 0 AL6 ... -0 /::,. ALB
o- X y
\l Z 0 , .
0.05 0.10 0.15 0.20 0.25 0.30
W/p2 Cum -')
130

6 References
1. lones, S.S., Anode Usage in the Aluminium Industry, in 'Petroleum-derived
Carbons', eds. 1.0. Bocha, I.W. Newman and 1.L. White, ACS Symposium
Series No. 303, ACS, Washington, USA, 1986, p234.
2. Ragan, S. and Marsh, H., Carbon, 1986,1, pI.
3. Marsh, H., 'The Production of Liquid Aluminium', 25th Annual Conference of
Metallurgists, 1986.
4. Taylor, G.H., Fuel, 1961, 40, p465.
5. Brooks,I.D. and Taylor, G.H., Carbon, 1965,2., p183.
6. Gibson, 1. and Gregory, D.H., 'The Carbonisation of Coal', Mills and Boon
Monographs in Chemical Engineering, London, 1971.
7. Marsh, H., Fuel, 1973,ll. p206.
8. Brooks, 1.0. and Taylor, G.H., 'The Chemistry and Physics of Carbon', Vol. 4,
Ed. P.L. Walker, Marcel Dekker, New York, 1968, pp243-272.
9. Brooks, 1.0. and Taylor, G.H, Nature, 1965,1Q2, p697.
10. Whittaker, M.P. and Grindstaff, L.I., Carbon, 1972,.ill, p165.
11. Ihnatowicz, M. ~ ai, Carbon, 1966, 1, p41.
12. Bradford, DJ. et ai, Proceedings of the Third Conference on Carbons and
Graphites, Society of the Chemical Industry, London, 1971, p520.
13. Dubois et aI, Metallography, 1970,2., p337.
14. Brooks, 1.0. and Taylor, G.H., 'The Chemistry and Physics of Carbon', Vol. 4,
Ed. P.L. Walker, Marcel Dekker, New York, 1968, p52.
15. Lewis, I.C., Carbon, 1982,20,.2, p519.
131

16. Honda. H .• Carbon. 1988. 26.~. p139.
17. Hays. D .• Patrick. I.W. and Walker. A .• Fuel. 1976.~. p299.
18 lones. S.S and Hildebrandt. R.D .• 'Light Metals 1975'. AlME. p291.
19. Honda. H. et al. Carbon. 1970. R. p 181.
20. Mochida. I.. Fuel. 1981. QQ. p405.
21. White. I.L.. 'Petroleum-derived Carbons'. American Chemical Symposium
Series. 1976. 21. p282.
22. Mochida. I.. Oyama. T. and Korai. Y .• Carbon. 1988. 26. 1. p49.
23. White. J.L. and Price. RJ .• Carbon. 1974.ll. p321.
24. Mason. C.R .• Proceedings of the Fifth London Carbon Conference. London.
1978. p344.
25. Wagner. P. and Dauelsberg. L.B .• Carbon. 1969. L p273.
26. Hays. D .• Patrick. I.W. and Walker. A.. Fuel. 1983.~. p946.
27. Auguie. D .• Oberlin. M. and Oberlin. A .• Carbon. 1981. 19.1. p277.
28. Dell. M.B .• Fuel. 1959 • .la. pl83.
29. Wagner. P. et al. Fuel. 1988.~. p946.
30. Briggs. D.K.H .• Fuel. 1980. ~. p201.
31. Hays. D .• Patrick. I.W. and Walker. A .• Fuel. 1983. 62. p1145,
32. Marsh, H. and Sherlock. I .• Fuel. 1981. 60. p434.
33. Greenhalgh. E. and Moyse. M.E .• Proceedings of the Third Conference on
Carbons and Graphites. Society of the Chemical Industry. London. 1971. p539.
34. Ehrburger. P. and Lahaye. J,. Fuel. 1984. 63. pI677.
132

35. Couderc, P., Hyvennet, P. and Lemarchand, J.L., Fuel, 1986,~, p281.
36. Heintz, E.A., Carbon, 1986, 24, ~, P 131.
37. Lahaye, J. and Ehrburger, P., Fuel, 1985, 64, p1187.
38. Hays, D., Patrick, J.W. and Walker, A., Fuel, 1982, ~ p232.
39. Marsh, H., Forrest, M. and Pacheco, L.A., Fuel, 1981, 2Q, p423.
40. Patrick, J.W., Shaw, F.S. and Wilmers, R. R., Fuel, 1977, ~,p8I.
41. Lewis, I.C. and Singer, L.S., The Chemistry and Physics of Carbon', Arnold,
London, 1968, Volume 17, pI.
42. Meers, lM., Encyclopaedia of Chemical Technology, Third Edition, John WHey
and Sons, New York, 1978, Vol. 4, p589.
43. Stadelhofer, J.W., Marrett, R. and Gemmeke, W., Fuel, 1981, @, p877.
44. Lang, I and Vaurecka, P., Fuel, 1981, QU, p1176.
45. Rallouch, R.W. and Fair, F.V., Carbon, 1980, il, p147.
46. Mantell, c.L.. Carbon and Graphite Handbook, WHey Interscience, New York,
1968, p156.
47. Ragan, S. and Marsh, H., Journal of Materials Science, 1983, ll., p3161.
48. Chard, W., Con away, M. and Niez, D., 'Petroleum-derived Carbons', in
American Chemical Society Symposia Series No. 21. Eds. M.L. Deviney and
T.M. O'Grady, ACS, Chapter 14, Washington, USA, 1976.
49. Gordon, J.E., 'The New Science of Strong Materials', Second Edition. Penguin,
London, 1974.
50. Inglis, C.E., Trans. Naval Archit., 1913,~, p219.
51. Griffiths, A.A., Phil. Trans. R. Soc. London. 1920, A221, p163.
133

52. Patrick, J.W. and Walker, A., J. Mat. Sci., 1987, 22, p3589.
53. Smith, M.C., USAEC Conference Report No.70115, 1972, p475.
54. Gilchrist, K.E. and Wells, D., Carbon, 1969,1, p627.
55. Patrick, J.W. and Stacey, A.E., Fuel, 1972, January,.ll, p81.
56. Patrick, J.W. and Stacey, A.E., ISS Transactions, 1983, J, pI.
57. Larsen, B., Patrick, J.W., Sprlie, M. and Walker, A, Proceedings Carbon '87,
p393.
58. Patrick, J.W., Sprlie, M. and Walker, A, Proceedings Carbon '88, p461.
59. Wood, J.L., Bradt, R.C. and Walker, P.L., Carbon, 1980, ll, p169.
60. Knudsen, F.P., J. Amer. Ceram. Soc., 1959, 42, p376.
61. Orowan, E., Progress in Physics, 1949,.ll, p185.
62. Espinola et aI, Carbon, 1986, 24, p337.
63. Kupperman, D.S., Chau, C.K. and Winstock, H., Carbon, 1973, ll, p171.
64. Huttinger, KJ., Carbon, 1971,2, p809.
65. Hemandez Sll J!!, Carbon, 1982, 2Q, p201.
66. Sakai, M., Hirota, S. and Nagaki, M., Carbon, 1984, 22, 187
67. Sharp, J.A, Fuel, 1987, November, 66, p1487.
68. Blayden, H.E., Yearbook of the Coke-Oven Managers' Association, 1966, p197.
134
