factbook - bilfinger se · 2014 concessions construction ... in € million q3/16 q3/15 Δ% q3/16...
TRANSCRIPT

Factbook
Contents / Pages
1. COMPANY PROFILE
The Engineering and Services Group…..............
Overview Business Segments…………….……...
Executive Board ……………………………..........
Supervisory Board …………………………..........
Corporate History ……………………………........
Major Acquisitions …………………………….......
Major Divestments…………………………………
3
4
5
6
7
8
9
2. KEY FIGURES
Overview..............................................................
Profit and Loss Statement & Reconciliation to
adjusted Earnings .……………………………….
Cash Flow Statement …………………………….
Valuation Net Debt ..............................................
10-year-overview Balance Sheet…………….......
10-year-overview Business Development….......
10
11
12
13
14
15
3. DATA SHEET PER SEGMENT
Industrial …………………………….....................
Power ……………………………..………………..
16
19
4. BILFINGER SHARE
Master Data, Share Price Development ......
10-year-overview Key Figures ……………..
Shareholder Structure, Treasury stock…….
21
22
23
Development of Dividend and
Market Capitalization ……………….…...…
Analysts‘ Coverage …………………….…..
Analysts‘ Recommendation
Development…..………………………….….
24
25
26
6. BILFINGER BOND
Master Data, Rating ……………………….. 27
7. FINANCIAL CALENDAR
IR Events …………………………….…….… 28
8. IR CONTACT
Contact Details …………………………...... 28
December 14, 2016 Page 2 Bilfinger SE Investor Relations Factbook
1. Company Profile
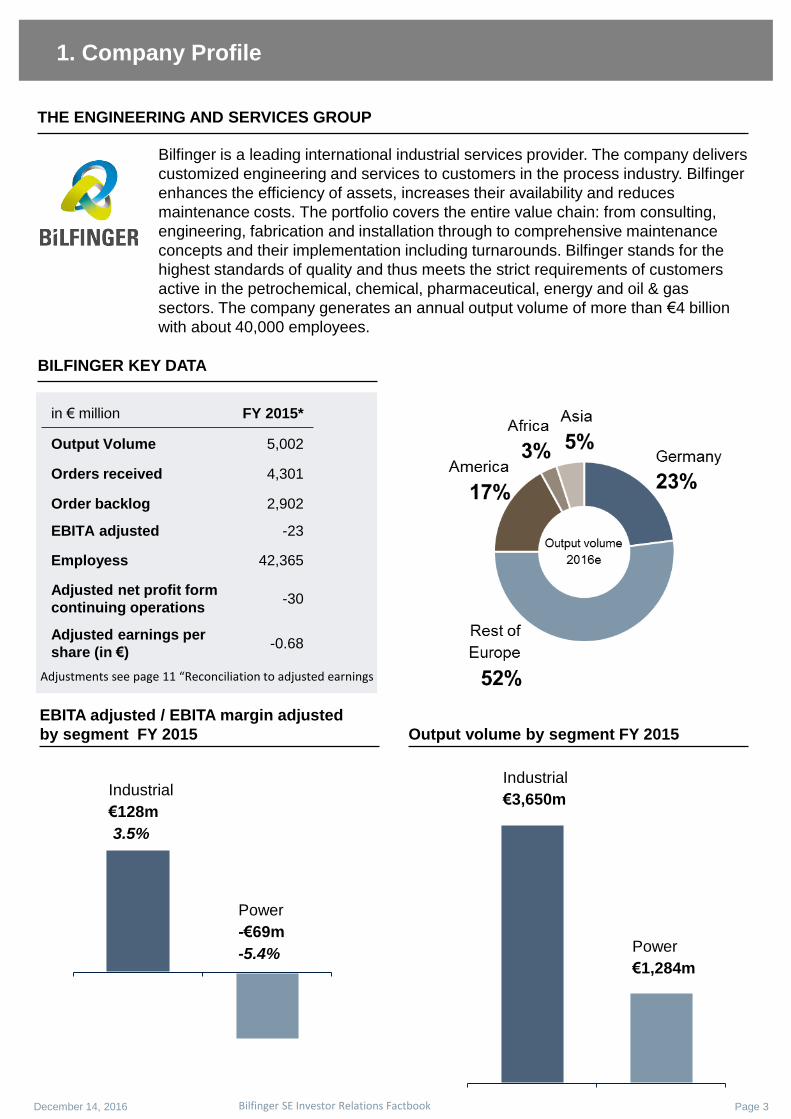
Bilfinger is a leading international industrial services provider. The company delivers
customized engineering and services to customers in the process industry. Bilfinger
enhances the efficiency of assets, increases their availability and reduces
maintenance costs. The portfolio covers the entire value chain: from consulting,
engineering, fabrication and installation through to comprehensive maintenance
concepts and their implementation including turnarounds. Bilfinger stands for the
highest standards of quality and thus meets the strict requirements of customers
active in the petrochemical, chemical, pharmaceutical, energy and oil & gas
sectors. The company generates an annual output volume of more than €4 billion
with about 40,000 employees.
THE ENGINEERING AND SERVICES GROUP
BILFINGER KEY DATA
in € million FY 2015*
Output Volume 5,002
Orders received 4,301
Order backlog 2,902
EBITA adjusted -23
Employess 42,365
Adjusted net profit form
continuing operations -30
Adjusted earnings per
share (in €) -0.68
December 14, 2016 Page 3 Bilfinger SE Investor Relations Factbook
Adjustments see page 11 “Reconciliation to adjusted earnings
Output volume by segment FY 2015
EBITA adjusted / EBITA margin adjusted
by segment FY 2015
Industrial
€3,650m
Power
€1,284m
Power
-€69m
-5.4%
Industrial
€128m
3.5%
Services for Energy Sector Services for Process Industry
1. Company Profile
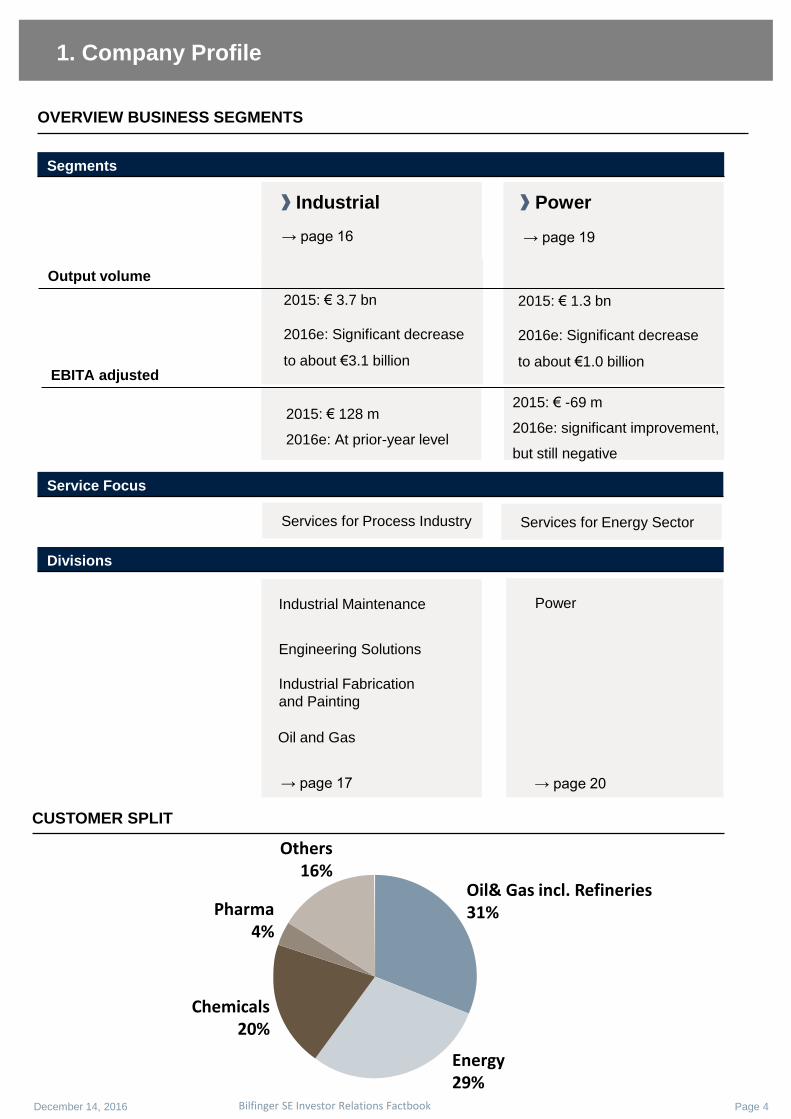
Power
Service Focus
Divisions
2015: € 3.7 bn
2016e: Significant decrease
to about €3.1 billion
→ page 19
→ page 20
Output volume
December 14, 2016 Page 4
OVERVIEW BUSINESS SEGMENTS
Bilfinger SE Investor Relations Factbook
Segments
Industrial Power
→ page 16
2015: € -69 m
2016e: significant improvement,
but still negative
2015: € 128 m
2016e: At prior-year level
Industrial Maintenance
Industrial Fabrication
and Painting
Engineering Solutions
Oil and Gas
→ page 17
2015: € 1.3 bn
2016e: Significant decrease
to about €1.0 billion
CUSTOMER SPLIT
Oil& Gas incl. Refineries 31%
Others 16%
Chemicals 20%
Energy 29%
Pharma 4%
EBITA adjusted

1. Company Profile
December 14, 2016 Page 5
EXECUTIVE BOARD
Bilfinger SE Investor Relations Factbook
Dr. Klaus Patzak, CFO
Born 1965 in Munich. He earned an MBA and a PhD in Economics from
Ludwig-Maximilians-University in Munich. Dr. Patzak worked in various
management positions at Siemens AG including Corporate Vice
President and Chief Accounting Officer & Controller and as CFO at
Osram AG. He joined the Executive Board of the Bilfinger Group as CFO
in October 2016.
Tom Blades, CEO
Born 1956 in Hamburg. He obtained a degree in Electrical Engineering
in Salford and Lyon and started his career at Schlumberger. After
varoius management positions e.g. at Halliburton and Siemens he was
member of the exectuive board at Linde. He joined Bilfinger as
chairman of the executive board in July 2016.
Michael Bernhardt
Born 1967 in Lank-Latum. He obtained a degree in law from the Albert-
Ludwigs University in Freiburg and the McGeorge School of Law,
University of Pacific, USA. He held various positions within Human
Resources at Hydro Aluminium Deutschland GmbH in Cologne and Oslo.
At Bayer Material Science AG he was member of the Executive Board
and Labor Director. He joined Bilfinger in November 2015 as member of
the Executive Board.
1. Company Profile
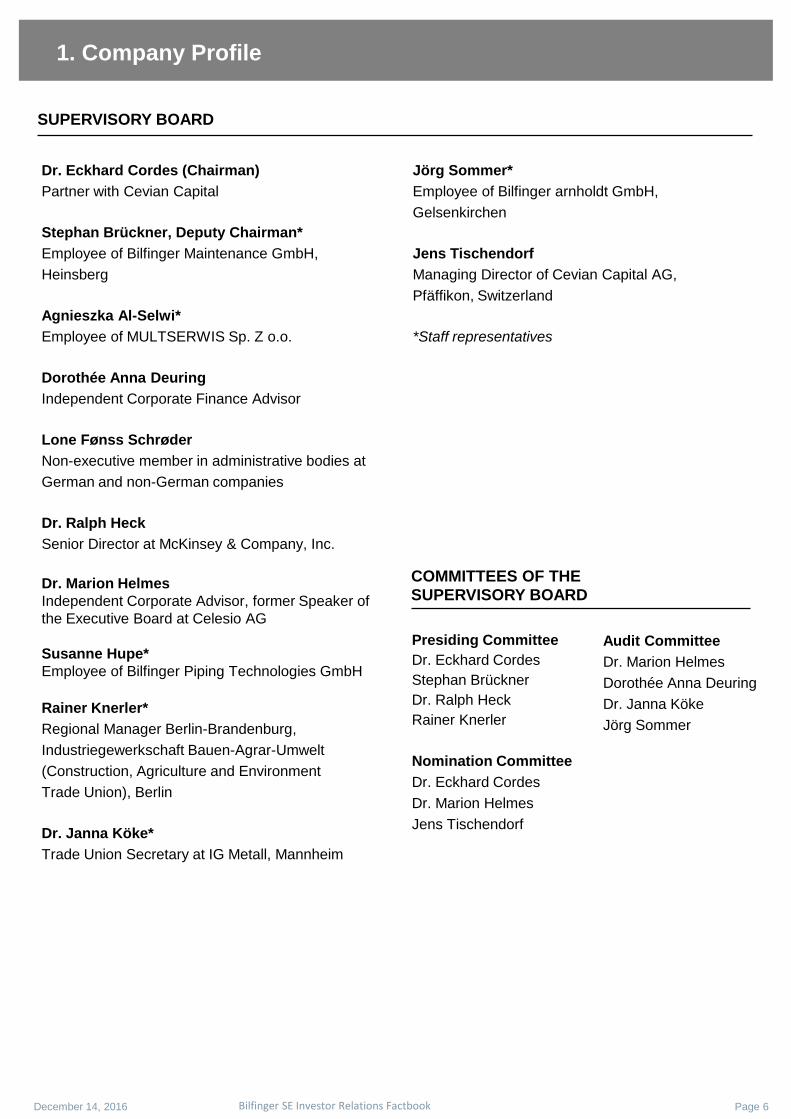
Dr. Eckhard Cordes (Chairman)
Partner with Cevian Capital
Stephan Brückner, Deputy Chairman*
Employee of Bilfinger Maintenance GmbH,
Heinsberg
Agnieszka Al-Selwi*
Employee of MULTSERWIS Sp. Z o.o.
Dorothée Anna Deuring
Independent Corporate Finance Advisor
Lone Fønss Schrøder
Non-executive member in administrative bodies at
German and non-German companies
Dr. Ralph Heck
Senior Director at McKinsey & Company, Inc.
Dr. Marion Helmes
Independent Corporate Advisor, former Speaker of
the Executive Board at Celesio AG
Susanne Hupe*
Employee of Bilfinger Piping Technologies GmbH
Rainer Knerler*
Regional Manager Berlin-Brandenburg,
Industriegewerkschaft Bauen-Agrar-Umwelt
(Construction, Agriculture and Environment
Trade Union), Berlin
Dr. Janna Köke*
Trade Union Secretary at IG Metall, Mannheim
Jörg Sommer*
Employee of Bilfinger arnholdt GmbH,
Gelsenkirchen
Jens Tischendorf
Managing Director of Cevian Capital AG,
Pfäffikon, Switzerland
*Staff representatives
Audit Committee
Dr. Marion Helmes
Dorothée Anna Deuring
Dr. Janna Köke
Jörg Sommer
Presiding Committee
Dr. Eckhard Cordes
Stephan Brückner
Dr. Ralph Heck
Rainer Knerler
Nomination Committee
Dr. Eckhard Cordes
Dr. Marion Helmes
Jens Tischendorf
COMMITTEES OF THE
SUPERVISORY BOARD
December 14, 2016 Page 6
SUPERVISORY BOARD
Bilfinger SE Investor Relations Factbook
1880 Hydraulic Engineering business Weis &
Bernatz in Lorraine
1883 Hydraulic Engineering business August
Bernatz in Mannheim
1886 Bernatz & Grün OHG in Mannheim
1892 Grün & Bilfinger OHG
1906 Transformation to Grün & Bilfinger AG
1912 Stock market launch of the Grün & Bilfinger
share
1890 Start of Julius Berger construction business
in Zempelburg / West Prussia
1895 Julius Berger OHG in Bromberg/Posen
1905 Transformation to Julius Berger Tiefbau AG
1910 Corporate headquarters moves to Berlin
1948 Corporate headquarters moves to
Wiesbaden
1890 Berlinische Boden-Gesellschaft
1951 Corporate headquarters moves
to Düsseldorf
1954 Renamed Bau- und Boden
aaaaaaiAktiengesellschaft (Bauboag)
1969 Merger of Julius Berger AG with
Bauboag to form Julius Berger –
Bauboag AG
1970 Majority interest of Grün & Bilfinger AG
in Julius Berger–Bauboag AG
1975 Merger of Grün & Bilfinger AG with
Julius Berger–Bauboag AG to form
Bilfinger + Berger Bauaktiengesellschaft
2001 Renamed Bilfinger Berger AG
2010 Transformation to Bilfinger Berger SE
2012 Renamed Bilfinger SE
CORPORATE HISTORY – THREE HISTORICAL ROOTS
1. Company Profile
December 14, 2016 Page 7 Bilfinger SE Investor Relations Factbook
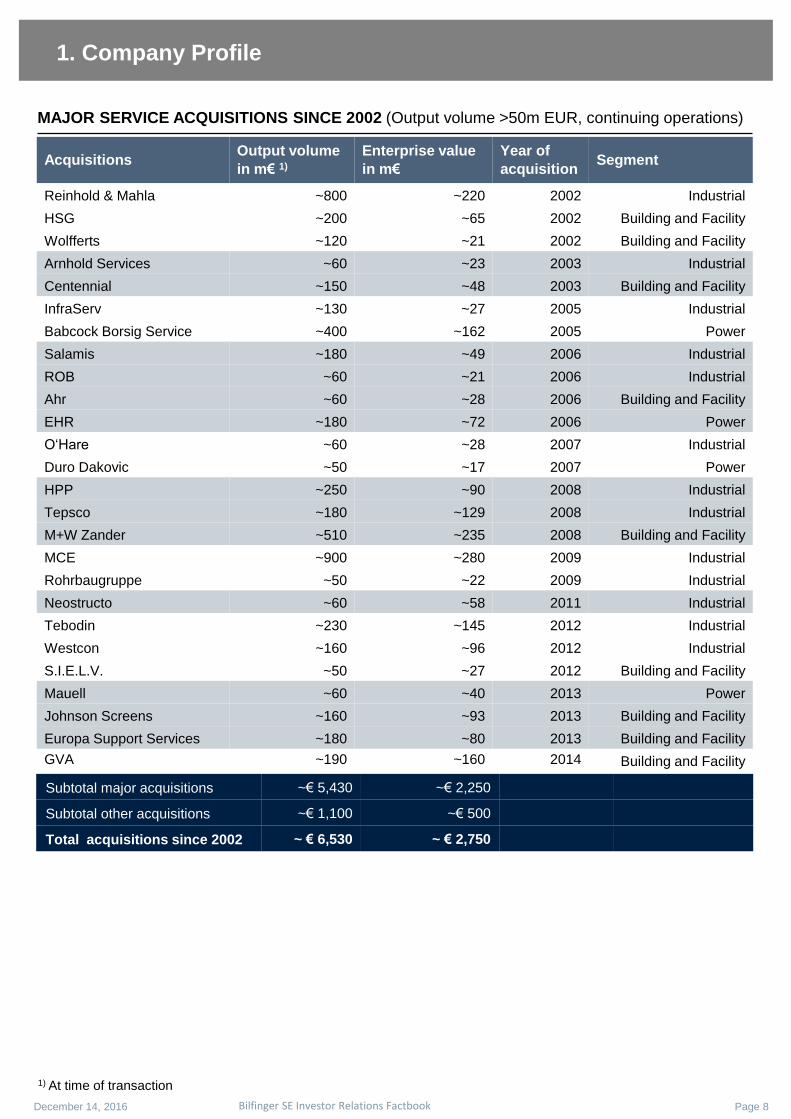
Acquisitions Output volume
in m€ 1)
Enterprise value
in m€
Year of
acquisition Segment
Reinhold & Mahla ~800 ~220 2002 Industrial
HSG ~200 ~65 2002 Building and Facility
Wolfferts ~120 ~21 2002 Building and Facility
Arnhold Services ~60 ~23 2003 Industrial
Centennial ~150 ~48 2003 Building and Facility
InfraServ ~130 ~27 2005 Industrial
Babcock Borsig Service ~400 ~162 2005 Power
Salamis ~180 ~49 2006 Industrial
ROB ~60 ~21 2006 Industrial
Ahr ~60 ~28 2006 Building and Facility
EHR ~180 ~72 2006 Power
O‘Hare ~60 ~28 2007 Industrial
Duro Dakovic ~50 ~17 2007 Power
HPP ~250 ~90 2008 Industrial
Tepsco ~180 ~129 2008 Industrial
M+W Zander ~510 ~235 2008 Building and Facility
MCE ~900 ~280 2009 Industrial
Rohrbaugruppe ~50 ~22 2009 Industrial
Neostructo ~60 ~58 2011 Industrial
Tebodin ~230 ~145 2012 Industrial
Westcon ~160 ~96 2012 Industrial
S.I.E.L.V. ~50 ~27 2012 Building and Facility
Mauell ~60 ~40 2013 Power
Johnson Screens ~160 ~93 2013 Building and Facility
Europa Support Services ~180 ~80 2013 Building and Facility
GVA ~190 ~160 2014 Building and Facility
1. Company Profile
1) At time of transaction
December 14, 2016 Page 8
MAJOR SERVICE ACQUISITIONS SINCE 2002 (Output volume >50m EUR, continuing operations)
Bilfinger SE Investor Relations Factbook
Subtotal major acquisitions ~€ 5,430 ~€ 2,250
Subtotal other acquisitions ~€ 1,100 ~€ 500
Total acquisitions since 2002 ~ € 6,530 ~ € 2,750
1. Company Profile
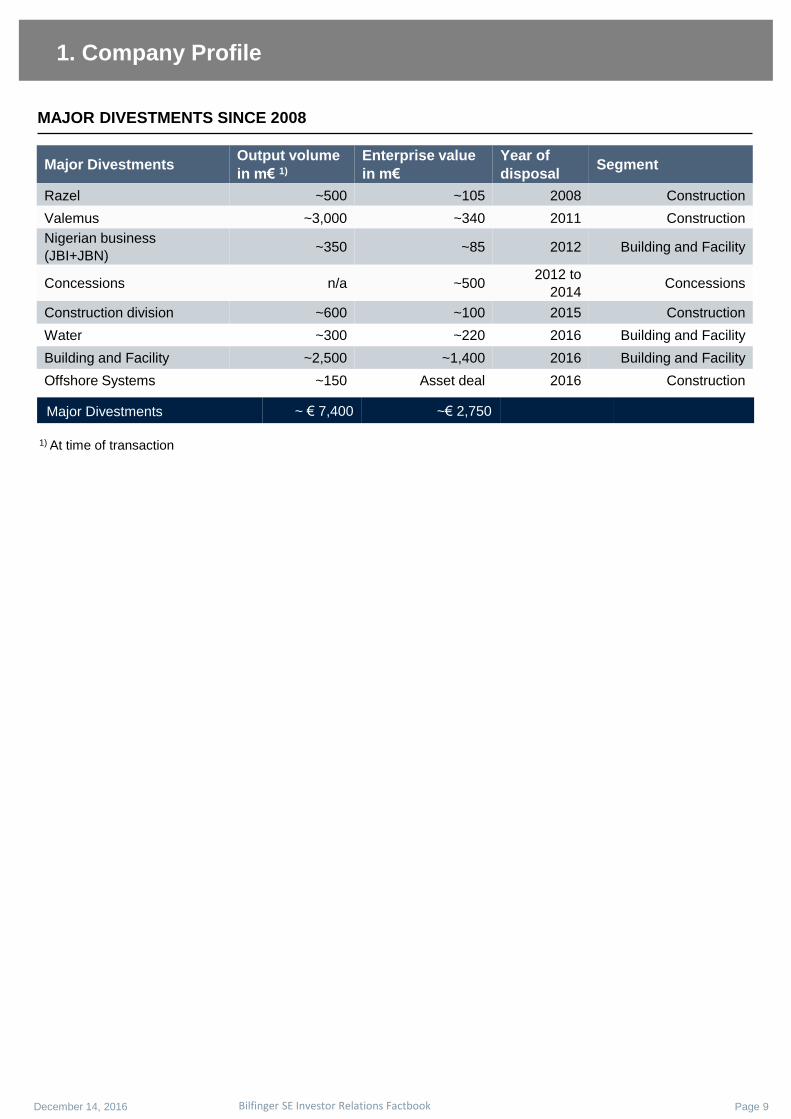
1) At time of transaction
Major Divestments ~ € 7,400 ~€ 2,750
December 14, 2016 Page 9
MAJOR DIVESTMENTS SINCE 2008
Bilfinger SE Investor Relations Factbook
Major Divestments Output volume
in m€ 1)
Enterprise value
in m€
Year of
disposal Segment
Razel ~500 ~105 2008 Construction
Valemus ~3,000 ~340 2011 Construction
Nigerian business
(JBI+JBN) ~350 ~85 2012 Building and Facility
Concessions n/a ~500 2012 to
2014 Concessions
Construction division ~600 ~100 2015 Construction
Water ~300 ~220 2016 Building and Facility
Building and Facility ~2,500 ~1,400 2016 Building and Facility
Offshore Systems ~150 Asset deal 2016 Construction
2. Key Figures
December 14, 2016 Page 10
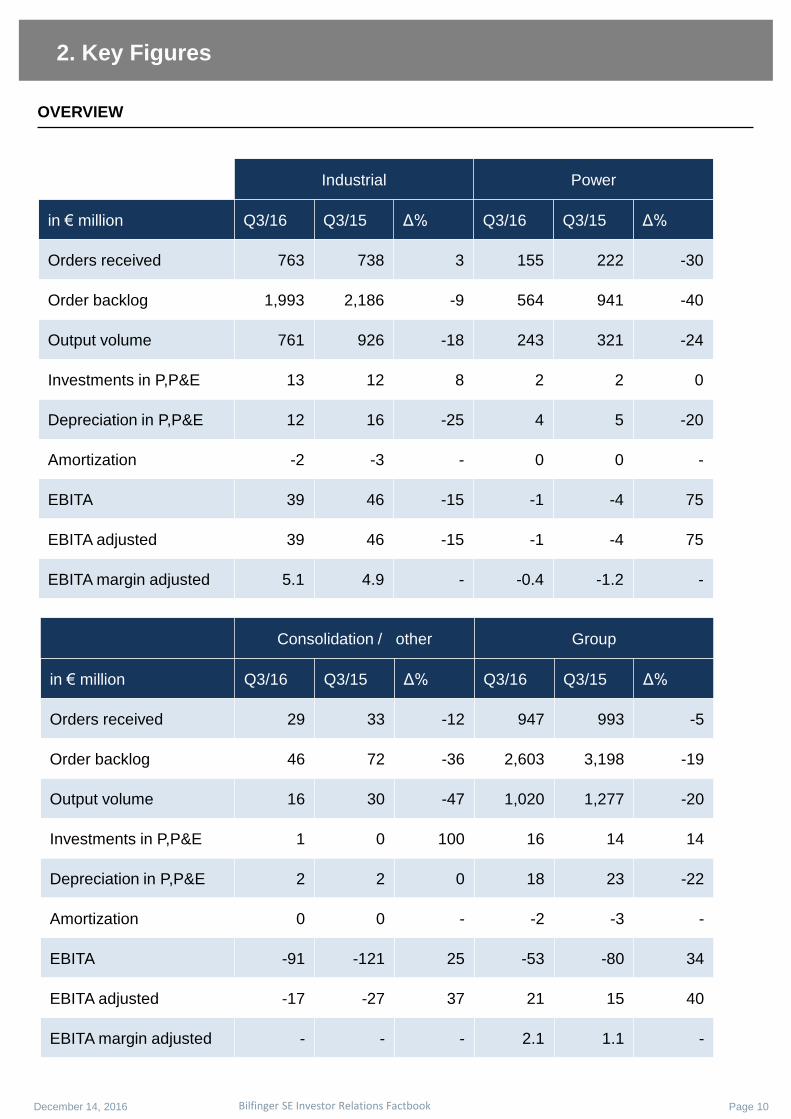
OVERVIEW
Bilfinger SE Investor Relations Factbook
Industrial Power
in € million Q3/16 Q3/15 Δ% Q3/16 Q3/15 Δ%
Orders received 763 738 3 155 222 -30
Order backlog 1,993 2,186 -9 564 941 -40
Output volume 761 926 -18 243 321 -24
Investments in P,P&E 13 12 8 2 2 0
Depreciation in P,P&E 12 16 -25 4 5 -20
Amortization -2 -3 - 0 0 -
EBITA 39 46 -15 -1 -4 75
EBITA adjusted 39 46 -15 -1 -4 75
EBITA margin adjusted 5.1 4.9 - -0.4 -1.2 -
Consolidation / other Group
in € million Q3/16 Q3/15 Δ% Q3/16 Q3/15 Δ%
Orders received 29 33 -12 947 993 -5
Order backlog 46 72 -36 2,603 3,198 -19
Output volume 16 30 -47 1,020 1,277 -20
Investments in P,P&E 1 0 100 16 14 14
Depreciation in P,P&E 2 2 0 18 23 -22
Amortization 0 0 - -2 -3 -
EBITA -91 -121 25 -53 -80 34
EBITA adjusted -17 -27 37 21 15 40
EBITA margin adjusted - - - 2.1 1.1 -
December 14, 2016 Page 11 Bilfinger SE Investor Relations Factbook
2. Key Figures
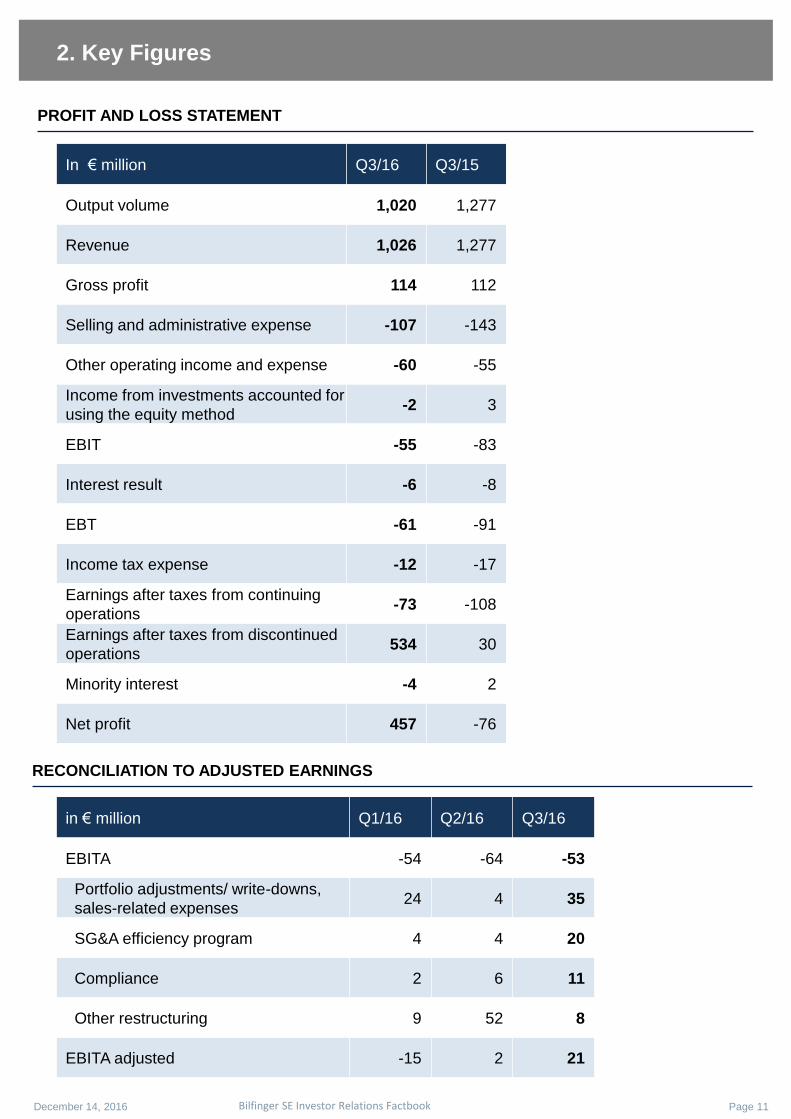
PROFIT AND LOSS STATEMENT
RECONCILIATION TO ADJUSTED EARNINGS
In € million Q3/16 Q3/15
Output volume 1,020 1,277
Revenue 1,026 1,277
Gross profit 114 112
Selling and administrative expense -107 -143
Other operating income and expense -60 -55
Income from investments accounted for
using the equity method -2 3
EBIT -55 -83
Interest result -6 -8
EBT -61 -91
Income tax expense -12 -17
Earnings after taxes from continuing
operations -73 -108
Earnings after taxes from discontinued
operations 534 30
Minority interest -4 2
Net profit 457 -76
in € million Q1/16 Q2/16 Q3/16
EBITA -54 -64 -53
Portfolio adjustments/ write-downs,
sales-related expenses 24 4 35
SG&A efficiency program 4 4 20
Compliance 2 6 11
Other restructuring 9 52 8
EBITA adjusted -15 2 21
Page 12 Bilfinger SE Investor Relations Factbook
2. Key Figures
December 14, 2016
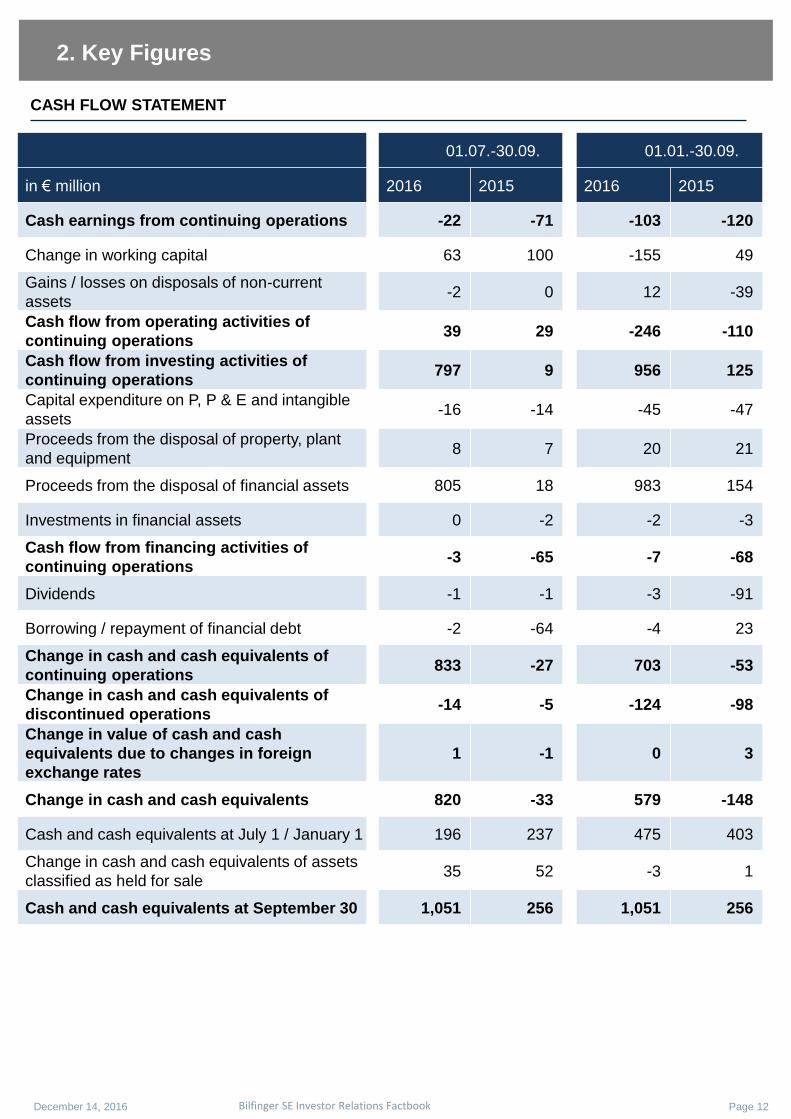
CASH FLOW STATEMENT
01.07.-30.09. 01.01.-30.09.
in € million 2016 2015 2016 2015
Cash earnings from continuing operations -22 -71 -103 -120
Change in working capital 63 100 -155 49
Gains / losses on disposals of non-current
assets -2 0 12 -39
Cash flow from operating activities of
continuing operations 39 29 -246 -110
Cash flow from investing activities of
continuing operations 797 9 956 125
Capital expenditure on P, P & E and intangible
assets -16 -14 -45 -47
Proceeds from the disposal of property, plant
and equipment 8 7 20 21
Proceeds from the disposal of financial assets 805 18 983 154
Investments in financial assets 0 -2 -2 -3
Cash flow from financing activities of
continuing operations -3 -65 -7 -68
Dividends -1 -1 -3 -91
Borrowing / repayment of financial debt -2 -64 -4 23
Change in cash and cash equivalents of
continuing operations 833 -27 703 -53
Change in cash and cash equivalents of
discontinued operations -14 -5 -124 -98
Change in value of cash and cash
equivalents due to changes in foreign
exchange rates
1 -1 0 3
Change in cash and cash equivalents 820 -33 579 -148
Cash and cash equivalents at July 1 / January 1 196 237 475 403
Change in cash and cash equivalents of assets
classified as held for sale 35 52 -3 1
Cash and cash equivalents at September 30 1,051 256 1,051 256
Page 13 Bilfinger SE Investor Relations Factbook
2. Key Figures
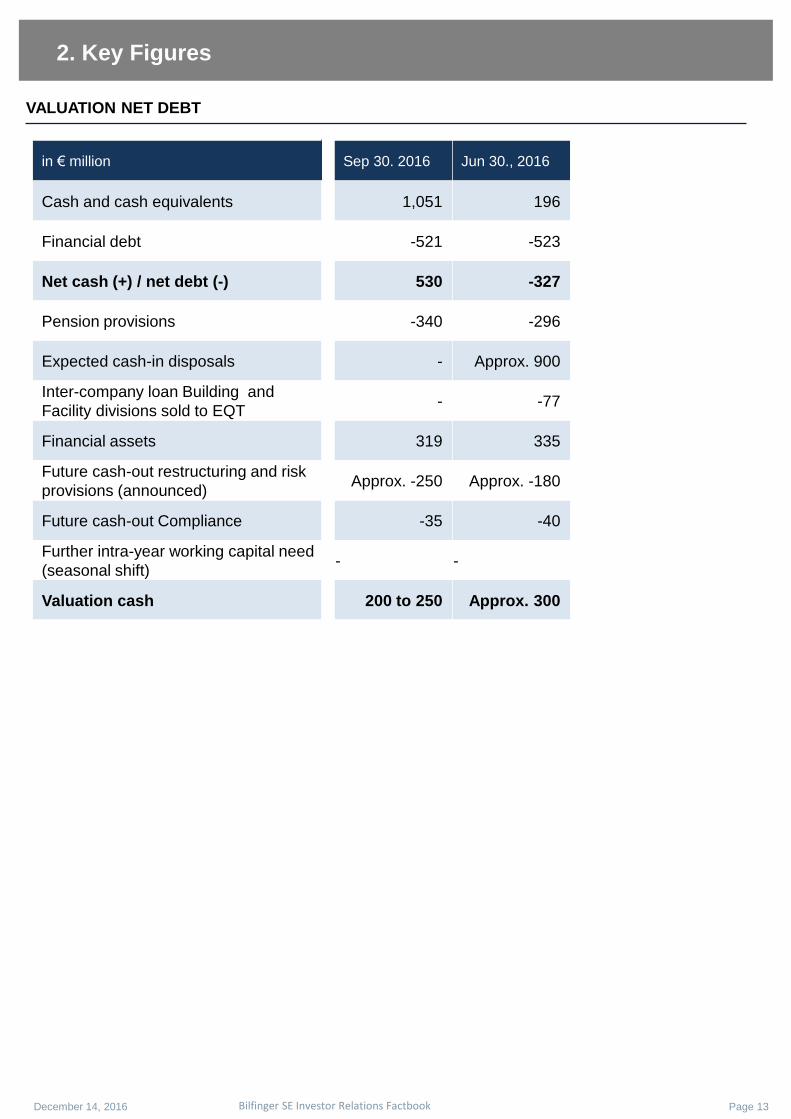
VALUATION NET DEBT
December 14, 2016
in € million Sep 30. 2016 Jun 30., 2016
Cash and cash equivalents 1,051 196
Financial debt -521 -523
Net cash (+) / net debt (-) 530 -327
Pension provisions -340 -296
Expected cash-in disposals - Approx. 900
Inter-company loan Building and
Facility divisions sold to EQT - -77
Financial assets 319 335
Future cash-out restructuring and risk
provisions (announced) Approx. -250 Approx. -180
Future cash-out Compliance -35 -40
Further intra-year working capital need
(seasonal shift) - -
Valuation cash 200 to 250 Approx. 300
2. Key Figures
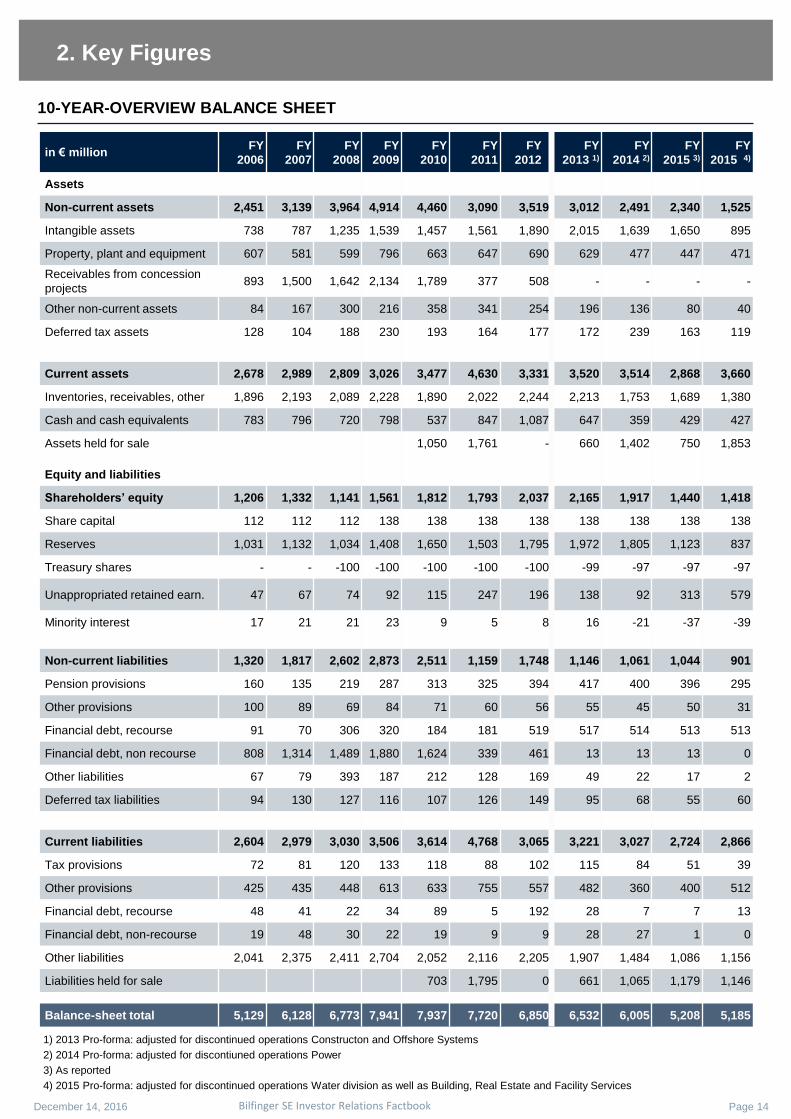
in € million FY
2006
FY
2007
FY
2008
FY
2009
FY
2010
FY
2011
FY
2012
FY
2013 1)
FY
2014 2)
FY
2015 3)
FY
2015 4)
Assets
Non-current assets 2,451 3,139 3,964 4,914 4,460 3,090 3,519 3,012 2,491 2,340 1,525
Intangible assets 738 787 1,235 1,539 1,457 1,561 1,890 2,015 1,639 1,650 895
Property, plant and equipment 607 581 599 796 663 647 690 629 477 447 471
Receivables from concession
projects 893 1,500 1,642 2,134 1,789 377 508 - - - -
Other non-current assets 84 167 300 216 358 341 254 196 136 80 40
Deferred tax assets 128 104 188 230 193 164 177 172 239 163 119
Current assets 2,678 2,989 2,809 3,026 3,477 4,630 3,331 3,520 3,514 2,868 3,660
Inventories, receivables, other 1,896 2,193 2,089 2,228 1,890 2,022 2,244 2,213 1,753 1,689 1,380
Cash and cash equivalents 783 796 720 798 537 847 1,087 647 359 429 427
Assets held for sale 1,050 1,761 - 660 1,402 750 1,853
Equity and liabilities
Shareholders’ equity 1,206 1,332 1,141 1,561 1,812 1,793 2,037 2,165 1,917 1,440 1,418
Share capital 112 112 112 138 138 138 138 138 138 138 138
Reserves 1,031 1,132 1,034 1,408 1,650 1,503 1,795 1,972 1,805 1,123 837
Treasury shares - - -100 -100 -100 -100 -100 -99 -97 -97 -97
Unappropriated retained earn. 47 67 74 92 115 247 196 138 92 313 579
Minority interest 17 21 21 23 9 5 8 16 -21 -37 -39
Non-current liabilities 1,320 1,817 2,602 2,873 2,511 1,159 1,748 1,146 1,061 1,044 901
Pension provisions 160 135 219 287 313 325 394 417 400 396 295
Other provisions 100 89 69 84 71 60 56 55 45 50 31
Financial debt, recourse 91 70 306 320 184 181 519 517 514 513 513
Financial debt, non recourse 808 1,314 1,489 1,880 1,624 339 461 13 13 13 0
Other liabilities 67 79 393 187 212 128 169 49 22 17 2
Deferred tax liabilities 94 130 127 116 107 126 149 95 68 55 60
Current liabilities 2,604 2,979 3,030 3,506 3,614 4,768 3,065 3,221 3,027 2,724 2,866
Tax provisions 72 81 120 133 118 88 102 115 84 51 39
Other provisions 425 435 448 613 633 755 557 482 360 400 512
Financial debt, recourse 48 41 22 34 89 5 192 28 7 7 13
Financial debt, non-recourse 19 48 30 22 19 9 9 28 27 1 0
Other liabilities 2,041 2,375 2,411 2,704 2,052 2,116 2,205 1,907 1,484 1,086 1,156
Liabilities held for sale 703 1,795 0 661 1,065 1,179 1,146
Balance-sheet total 5,129 6,128 6,773 7,941 7,937 7,720 6,850 6,532 6,005 5,208 5,185
December 14, 2016 Page 14 Bilfinger SE Investor Relations Factbook
10-YEAR-OVERVIEW BALANCE SHEET
1) 2013 Pro-forma: adjusted for discontinued operations Constructon and Offshore Systems
2) 2014 Pro-forma: adjusted for discontiuned operations Power
3) As reported
4) 2015 Pro-forma: adjusted for discontinued operations Water division as well as Building, Real Estate and Facility Services
2. Key Figures
in € million
FY
2006
FY
2007
FY
2008
FY
2009
FY
2010 FY
2011
FY
2012 FY
2013
FY
2014
FY
2015 reported
FY
2015 restated
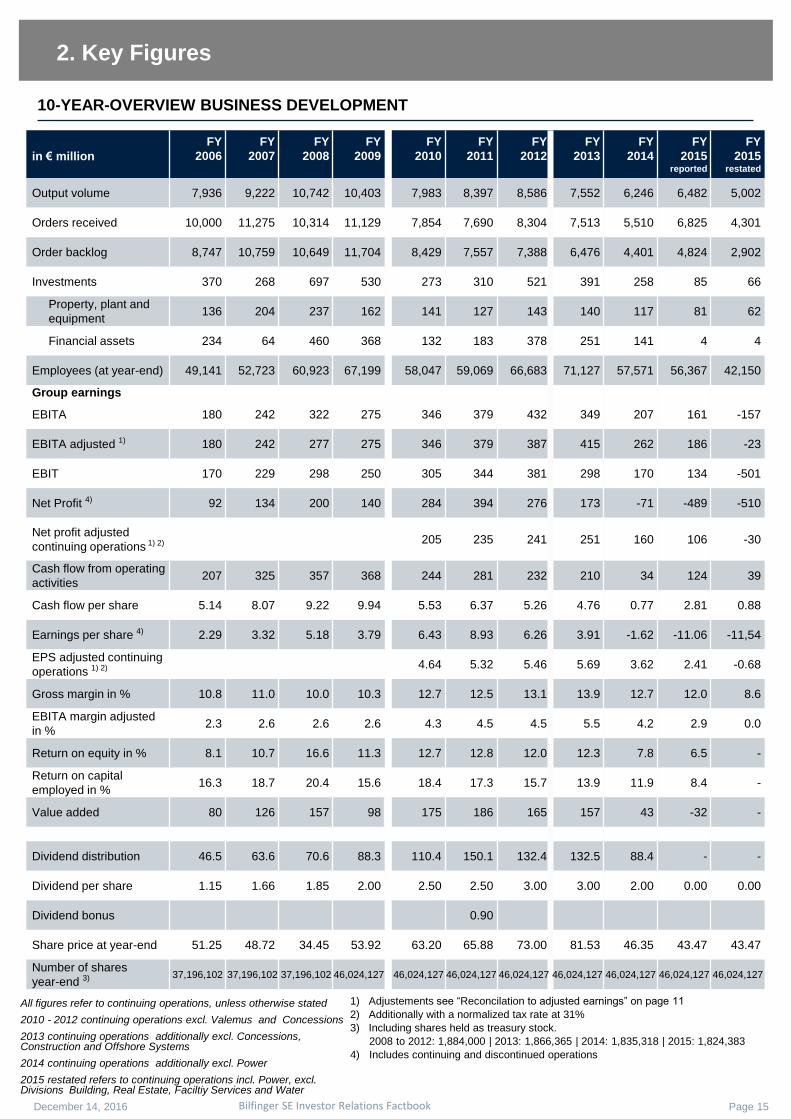
Output volume 7,936 9,222 10,742 10,403 7,983 8,397 8,586 7,552 6,246 6,482 5,002
Orders received 10,000 11,275 10,314 11,129 7,854 7,690 8,304 7,513 5,510 6,825 4,301
Order backlog 8,747 10,759 10,649 11,704 8,429 7,557 7,388 6,476 4,401 4,824 2,902
Investments 370 268 697 530 273 310 521 391 258 85 66
Property, plant and
equipment 136 204 237 162 141 127 143 140 117 81 62
Financial assets 234 64 460 368 132 183 378 251 141 4 4
Employees (at year-end) 49,141 52,723 60,923 67,199 58,047 59,069 66,683 71,127 57,571 56,367 42,150
Group earnings
EBITA 180 242 322 275 346 379 432 349 207 161 -157
EBITA adjusted 1) 180 242 277 275 346 379 387 415 262 186 -23
EBIT 170 229 298 250 305 344 381 298 170 134 -501
Net Profit 4) 92 134 200 140 284 394 276 173 -71 -489 -510
Net profit adjusted
continuing operations 1) 2) 205 235 241 251 160 106 -30
Cash flow from operating
activities 207 325 357 368 244 281 232 210 34 124 39
Cash flow per share 5.14 8.07 9.22 9.94 5.53 6.37 5.26 4.76 0.77 2.81 0.88
Earnings per share 4) 2.29 3.32 5.18 3.79 6.43 8.93 6.26 3.91 -1.62 -11.06 -11,54
EPS adjusted continuing
operations 1) 2) 4.64 5.32 5.46 5.69 3.62 2.41 -0.68
Gross margin in % 10.8 11.0 10.0 10.3 12.7 12.5 13.1 13.9 12.7 12.0 8.6
EBITA margin adjusted
in % 2.3 2.6 2.6 2.6 4.3 4.5 4.5 5.5 4.2 2.9 0.0
Return on equity in % 8.1 10.7 16.6 11.3 12.7 12.8 12.0 12.3 7.8 6.5 -
Return on capital
employed in % 16.3 18.7 20.4 15.6 18.4 17.3 15.7 13.9 11.9 8.4 -
Value added 80 126 157 98 175 186 165 157 43 -32 -
Dividend distribution 46.5 63.6 70.6 88.3 110.4 150.1 132.4 132.5 88.4 - -
Dividend per share 1.15 1.66 1.85 2.00 2.50 2.50 3.00 3.00 2.00 0.00 0.00
Dividend bonus 0.90
Share price at year-end 51.25 48.72 34.45 53.92 63.20 65.88 73.00 81.53 46.35 43.47 43.47
Number of shares
year-end 3) 37,196,102 37,196,102 37,196,102 46,024,127 46,024,127 46,024,127 46,024,127 46,024,127 46,024,127 46,024,127 46,024,127
1) Adjustements see “Reconcilation to adjusted earnings” on page 11
2) Additionally with a normalized tax rate at 31%
3) Including shares held as treasury stock.
2008 to 2012: 1,884,000 | 2013: 1,866,365 | 2014: 1,835,318 | 2015: 1,824,383
4) Includes continuing and discontinued operations
December 14, 2016 Page 15 Bilfinger SE Investor Relations Factbook
10-YEAR-OVERVIEW BUSINESS DEVELOPMENT
All figures refer to continuing operations, unless otherwise stated
2010 - 2012 continuing operations excl. Valemus and Concessions
2013 continuing operations additionally excl. Concessions, Construction and Offshore Systems
2014 continuing operations additionally excl. Power
2015 restated refers to continuing operations incl. Power, excl. Divisions Building, Real Estate, Faciltiy Services and Water
3. Data sheet per segment
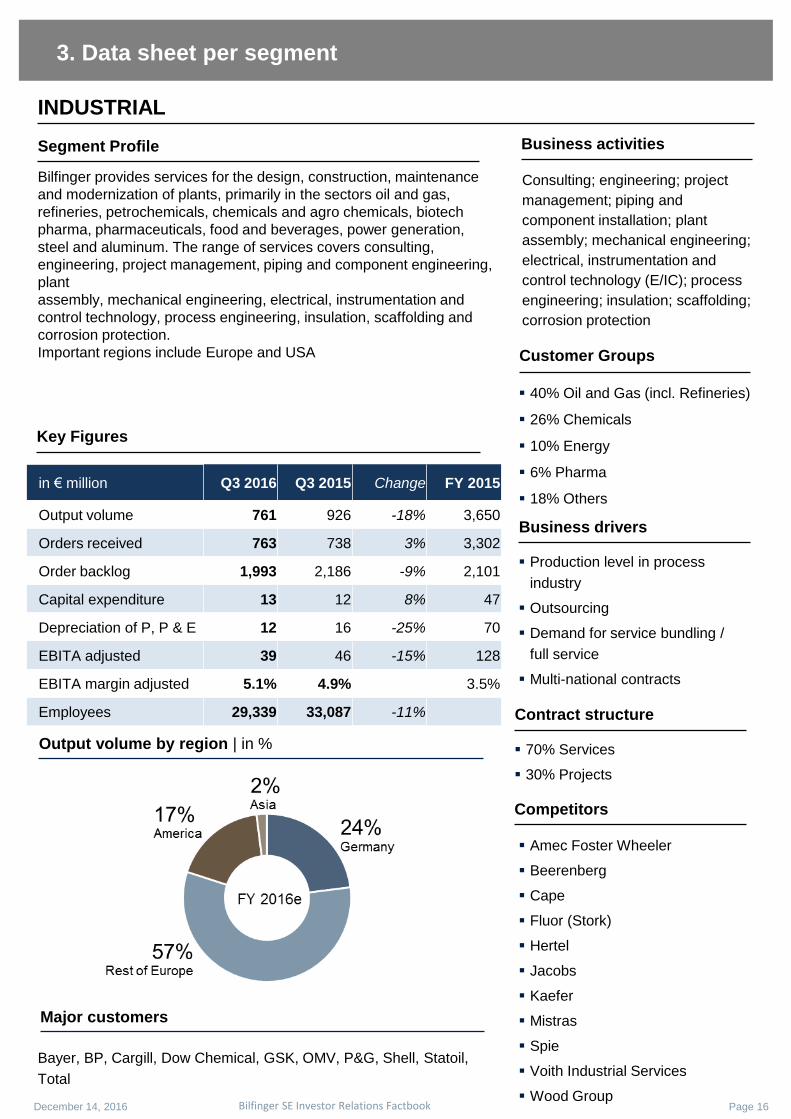
INDUSTRIAL
Bilfinger provides services for the design, construction, maintenance
and modernization of plants, primarily in the sectors oil and gas,
refineries, petrochemicals, chemicals and agro chemicals, biotech
pharma, pharmaceuticals, food and beverages, power generation,
steel and aluminum. The range of services covers consulting,
engineering, project management, piping and component engineering,
plant
assembly, mechanical engineering, electrical, instrumentation and
control technology, process engineering, insulation, scaffolding and
corrosion protection.
Important regions include Europe and USA
Key Figures
Output volume by region | in %
40% Oil and Gas (incl. Refineries)
26% Chemicals
10% Energy
6% Pharma
18% Others
Amec Foster Wheeler
Beerenberg
Cape
Fluor (Stork)
Hertel
Jacobs
Kaefer
Mistras
Spie
Voith Industrial Services
Wood Group
Consulting; engineering; project
management; piping and
component installation; plant
assembly; mechanical engineering;
electrical, instrumentation and
control technology (E/IC); process
engineering; insulation; scaffolding;
corrosion protection
Production level in process
industry
Outsourcing
Demand for service bundling /
full service
Multi-national contracts
Competitors
Customer Groups
Business activities
Contract structure
Business drivers
70% Services
30% Projects
Segment Profile
December 14, 2016 Page 16 Bilfinger SE Investor Relations Factbook
Major customers
Bayer, BP, Cargill, Dow Chemical, GSK, OMV, P&G, Shell, Statoil,
Total
in € million Q3 2016 Q3 2015 Change FY 2015
Output volume 761 926 -18% 3,650
Orders received 763 738 3% 3,302
Order backlog 1,993 2,186 -9% 2,101
Capital expenditure 13 12 8% 47
Depreciation of P, P & E 12 16 -25% 70
EBITA adjusted 39 46 -15% 128
EBITA margin adjusted 5.1% 4.9% 3.5%
Employees 29,339 33,087 -11%
Leuna
3. Data sheet per segment
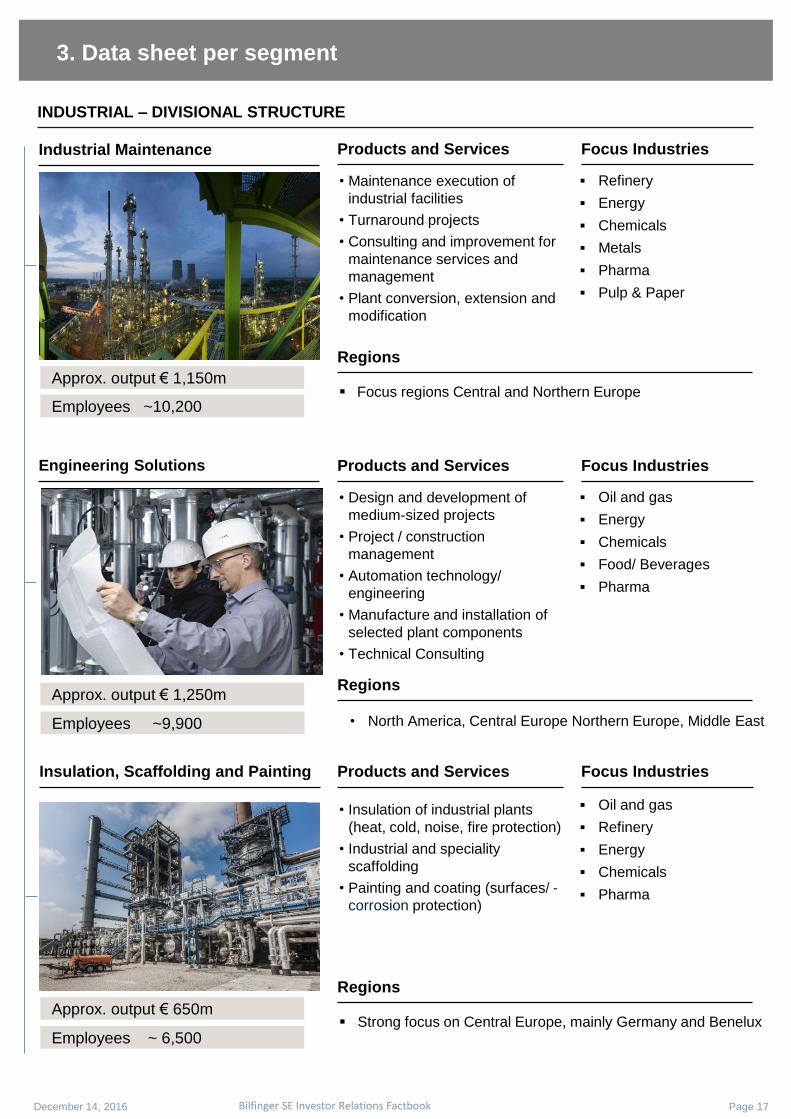
• Maintenance execution of
industrial facilities
• Turnaround projects
• Consulting and improvement for
maintenance services and
management
• Plant conversion, extension and
modification
Refinery
Energy
Chemicals
Metals
Pharma
Pulp & Paper
Approx. output € 1,150m
Employees ~10,200
Regions
Focus regions Central and Northern Europe
December 14, 2016 Page 17 Bilfinger SE Investor Relations Factbook
INDUSTRIAL – DIVISIONAL STRUCTURE
Products and Services Focus Industries Industrial Maintenance
Engineering Solutions
• Design and development of
medium-sized projects
• Project / construction
management
• Automation technology/
engineering
• Manufacture and installation of
selected plant components
• Technical Consulting
Oil and gas
Energy
Chemicals
Food/ Beverages
Pharma
Approx. output € 1,250m
Products and Services Focus Industries
Regions
• North America, Central Europe Northern Europe, Middle East
• Insulation of industrial plants
(heat, cold, noise, fire protection)
• Industrial and speciality
scaffolding
• Painting and coating (surfaces/ -
corrosion protection)
Oil and gas
Refinery
Energy
Chemicals
Pharma
Strong focus on Central Europe, mainly Germany and Benelux
Miro Mineralölraffinerie Oberrhein GmbH & Co KG, Karlsruhe
Approx. output € 650m
Employees ~ 6,500
Insulation, Scaffolding and Painting Products and Services Focus Industries
Regions
Employees ~9,900
3. Data sheet per segment
December 14, 2016 Page 18 Bilfinger SE Investor Relations Factbook
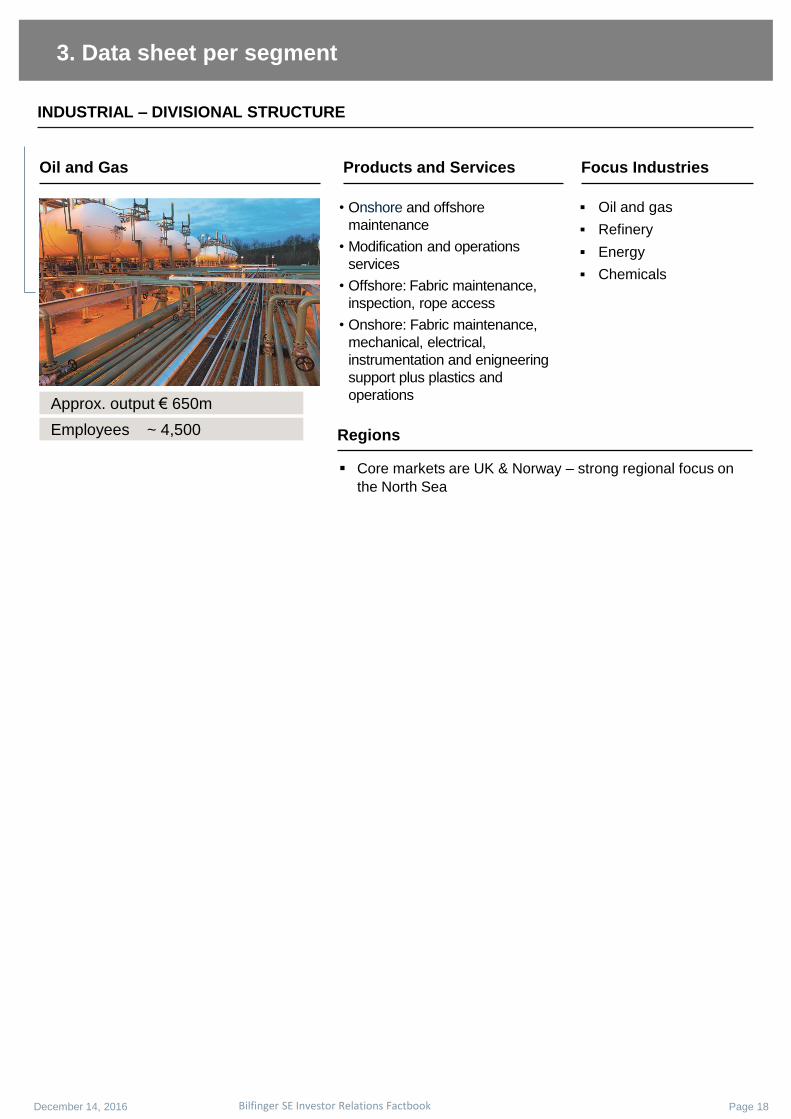
INDUSTRIAL – DIVISIONAL STRUCTURE
Bilfinger profitiert vom Schiefergasboom in den USA. In Scio, Ohio baut der Konzern eine Anlage zur Herstellung von Flüssiggasen.
• Onshore and offshore
maintenance
• Modification and operations
services
• Offshore: Fabric maintenance,
inspection, rope access
• Onshore: Fabric maintenance,
mechanical, electrical,
instrumentation and enigneering
support plus plastics and
operations
Oil and gas
Refinery
Energy
Chemicals
Core markets are UK & Norway – strong regional focus on
the North Sea
Approx. output € 650m
Employees ~ 4,500
Oil and Gas Products and Services Focus Industries
Regions
3. Data sheet per segment
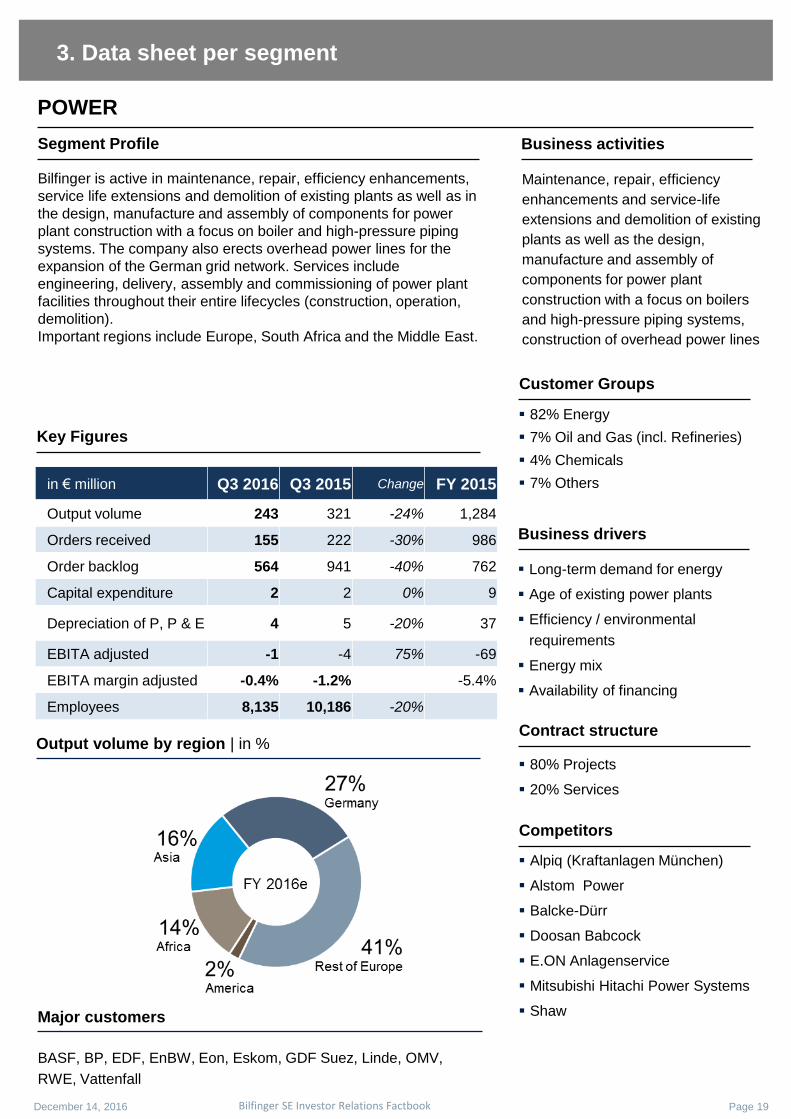
POWER
Bilfinger is active in maintenance, repair, efficiency enhancements,
service life extensions and demolition of existing plants as well as in
the design, manufacture and assembly of components for power
plant construction with a focus on boiler and high-pressure piping
systems. The company also erects overhead power lines for the
expansion of the German grid network. Services include
engineering, delivery, assembly and commissioning of power plant
facilities throughout their entire lifecycles (construction, operation,
demolition).
Important regions include Europe, South Africa and the Middle East.
82% Energy
7% Oil and Gas (incl. Refineries)
4% Chemicals
7% Others
Alpiq (Kraftanlagen München)
Alstom Power
Balcke-Dürr
Doosan Babcock
E.ON Anlagenservice
Mitsubishi Hitachi Power Systems
Shaw
Maintenance, repair, efficiency
enhancements and service-life
extensions and demolition of existing
plants as well as the design,
manufacture and assembly of
components for power plant
construction with a focus on boilers
and high-pressure piping systems,
construction of overhead power lines
80% Projects
20% Services
Long-term demand for energy
Age of existing power plants
Efficiency / environmental
requirements
Energy mix
Availability of financing
Competitors
Customer Groups
Contract structure
Business drivers
December 14, 2016
Page 19 Bilfinger SE Investor Relations Factbook
Business activities Segment Profile
Key Figures
Output volume by region | in %
Major customers
BASF, BP, EDF, EnBW, Eon, Eskom, GDF Suez, Linde, OMV,
RWE, Vattenfall
in € million Q3 2016 Q3 2015 Change FY 2015
Output volume 243 321 -24% 1,284
Orders received 155 222 -30% 986
Order backlog 564 941 -40% 762
Capital expenditure 2 2 0% 9
Depreciation of P, P & E 4 5 -20% 37
EBITA adjusted -1 -4 75% -69
EBITA margin adjusted -0.4% -1.2% -5.4%
Employees 8,135 10,186 -20%
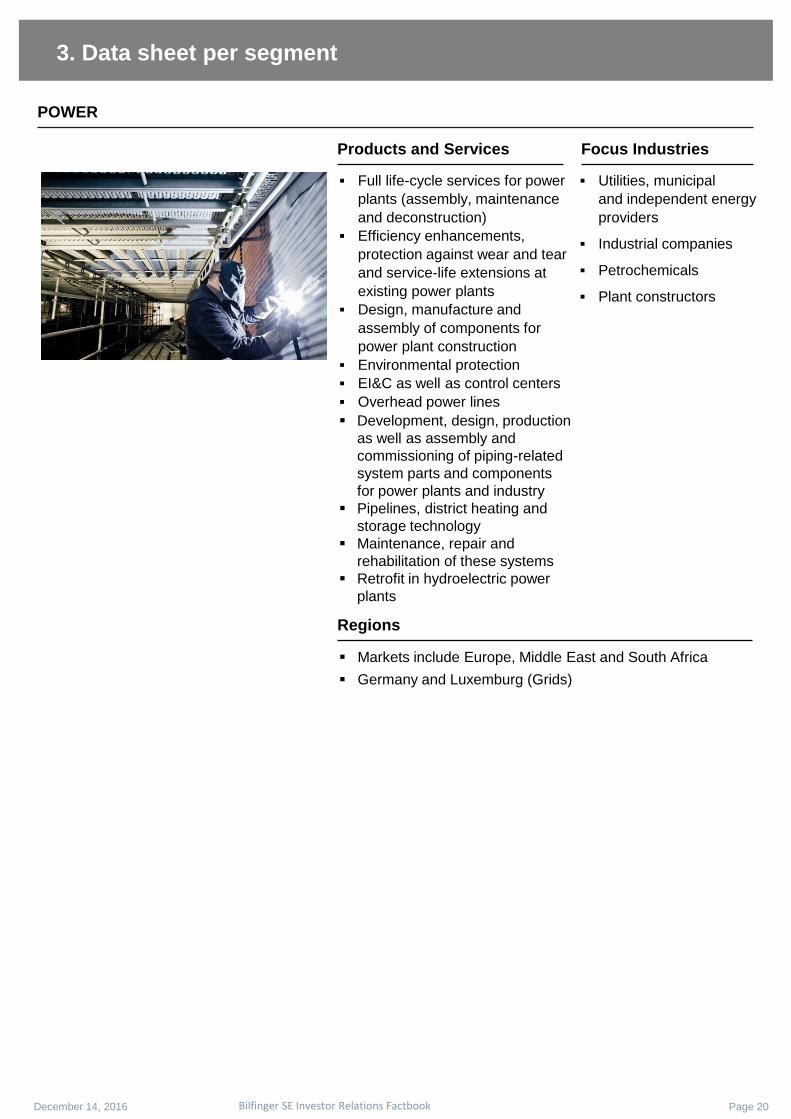
3. Data sheet per segment
Full life-cycle services for power
plants (assembly, maintenance
and deconstruction)
Efficiency enhancements,
protection against wear and tear
and service-life extensions at
existing power plants
Design, manufacture and
assembly of components for
power plant construction
Environmental protection
EI&C as well as control centers
Overhead power lines
Development, design, production
as well as assembly and
commissioning of piping-related
system parts and components
for power plants and industry
Pipelines, district heating and
storage technology
Maintenance, repair and
rehabilitation of these systems
Retrofit in hydroelectric power
plants
Utilities, municipal
and independent energy
providers
Industrial companies
Petrochemicals
Plant constructors
Regions
Markets include Europe, Middle East and South Africa
Germany and Luxemburg (Grids)
December 14, 2016 Page 20 Bilfinger SE Investor Relations Factbook
POWER
Products and Services Focus Industries
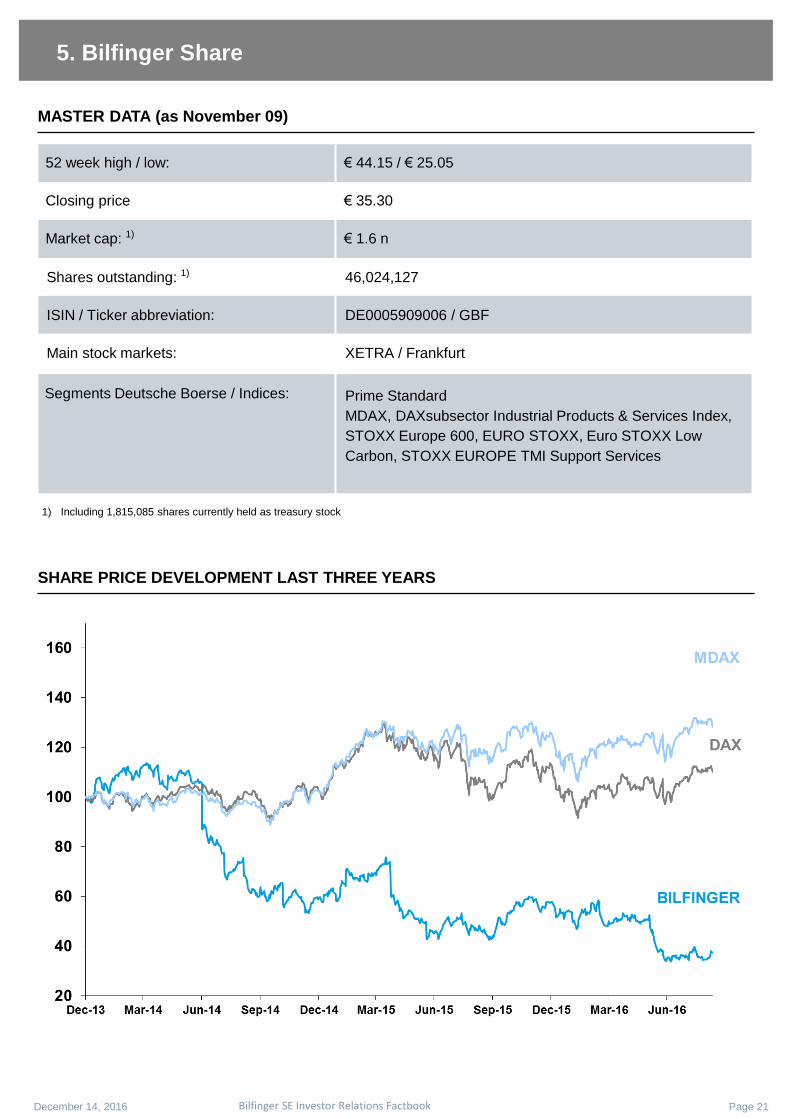
SHARE PRICE DEVELOPMENT LAST THREE YEARS
5. Bilfinger Share
MASTER DATA (as November 09)
52 week high / low: € 44.15 / € 25.05
Closing price € 35.30
Market cap: 1) € 1.6 n
Shares outstanding: 1) 46,024,127
ISIN / Ticker abbreviation: DE0005909006 / GBF
Main stock markets: XETRA / Frankfurt
Segments Deutsche Boerse / Indices:
Prime Standard
MDAX, DAXsubsector Industrial Products & Services Index,
STOXX Europe 600, EURO STOXX, Euro STOXX Low
Carbon, STOXX EUROPE TMI Support Services
1) Including 1,815,085 shares currently held as treasury stock
December 14, 2016 Page 21 Bilfinger SE Investor Relations Factbook
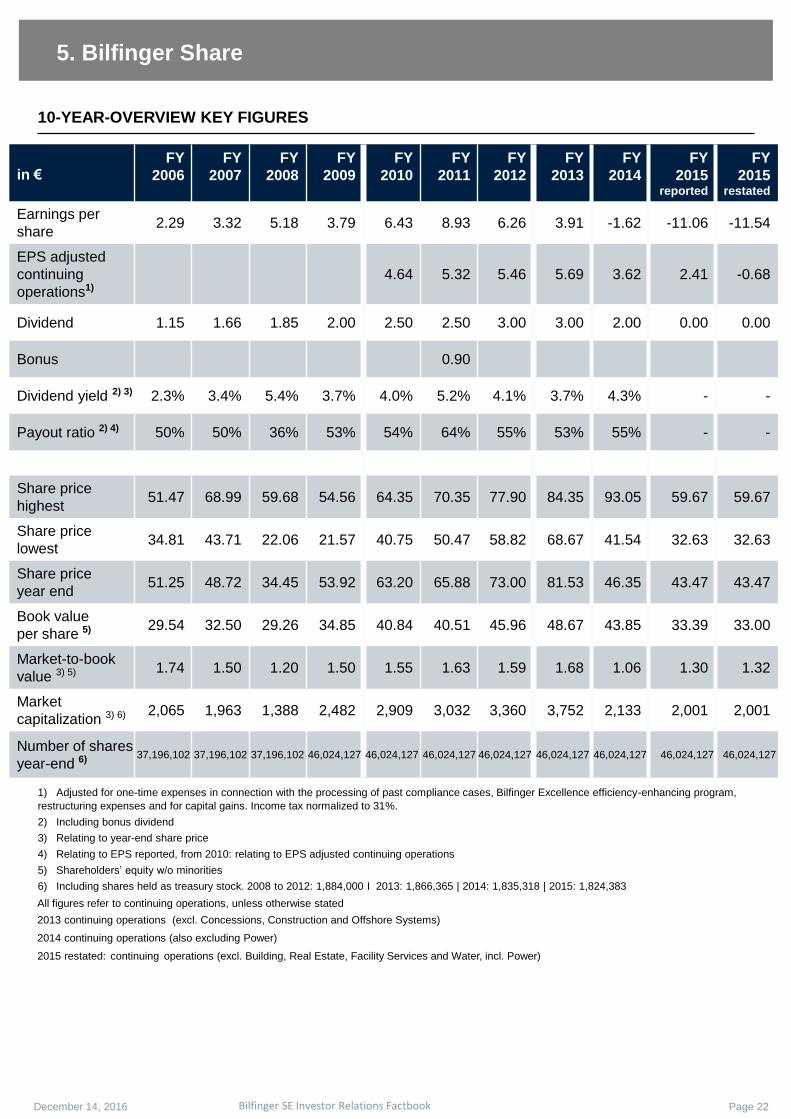
5. Bilfinger Share
10-YEAR-OVERVIEW KEY FIGURES
1) Adjusted for one-time expenses in connection with the processing of past compliance cases, Bilfinger Excellence efficiency-enhancing program,
restructuring expenses and for capital gains. Income tax normalized to 31%.
2) Including bonus dividend
3) Relating to year-end share price
4) Relating to EPS reported, from 2010: relating to EPS adjusted continuing operations
5) Shareholders’ equity w/o minorities
6) Including shares held as treasury stock. 2008 to 2012: 1,884,000 I 2013: 1,866,365 | 2014: 1,835,318 | 2015: 1,824,383
in € FY
2006
FY
2007
FY
2008
FY
2009
FY
2010
FY
2011
FY
2012
FY
2013
FY
2014
FY
2015 reported
FY
2015 restated
Earnings per
share 2.29 3.32 5.18 3.79 6.43 8.93 6.26 3.91 -1.62 -11.06 -11.54
EPS adjusted
continuing
operations1)
4.64 5.32 5.46 5.69 3.62 2.41 -0.68
Dividend 1.15 1.66 1.85 2.00 2.50 2.50 3.00 3.00 2.00 0.00 0.00
Bonus 0.90
Dividend yield 2) 3) 2.3% 3.4% 5.4% 3.7% 4.0% 5.2% 4.1% 3.7% 4.3% - -
Payout ratio 2) 4) 50% 50% 36% 53% 54% 64% 55% 53% 55% - -
Share price
highest 51.47 68.99 59.68 54.56 64.35 70.35 77.90 84.35 93.05 59.67 59.67
Share price
lowest 34.81 43.71 22.06 21.57 40.75 50.47 58.82 68.67 41.54 32.63 32.63
Share price
year end 51.25 48.72 34.45 53.92 63.20 65.88 73.00 81.53 46.35 43.47 43.47
Book value
per share 5) 29.54 32.50 29.26 34.85 40.84 40.51 45.96 48.67 43.85 33.39 33.00
Market-to-book
value 3) 5) 1.74 1.50 1.20 1.50 1.55 1.63 1.59 1.68 1.06 1.30 1.32
Market
capitalization 3) 6) 2,065 1,963 1,388 2,482 2,909 3,032 3,360 3,752 2,133 2,001 2,001
Number of shares
year-end 6) 37,196,102 37,196,102 37,196,102 46,024,127 46,024,127 46,024,127 46,024,127 46,024,127 46,024,127 46,024,127 46,024,127
December 14, 2016 Page 22 Bilfinger SE Investor Relations Factbook
All figures refer to continuing operations, unless otherwise stated
2013 continuing operations (excl. Concessions, Construction and Offshore Systems)
2014 continuing operations (also excluding Power)
2015 restated: continuing operations (excl. Building, Real Estate, Facility Services and Water, incl. Power)
5. Bilfinger Share
December 14, 2016 Page 23 Bilfinger SE Investor Relations Factbook
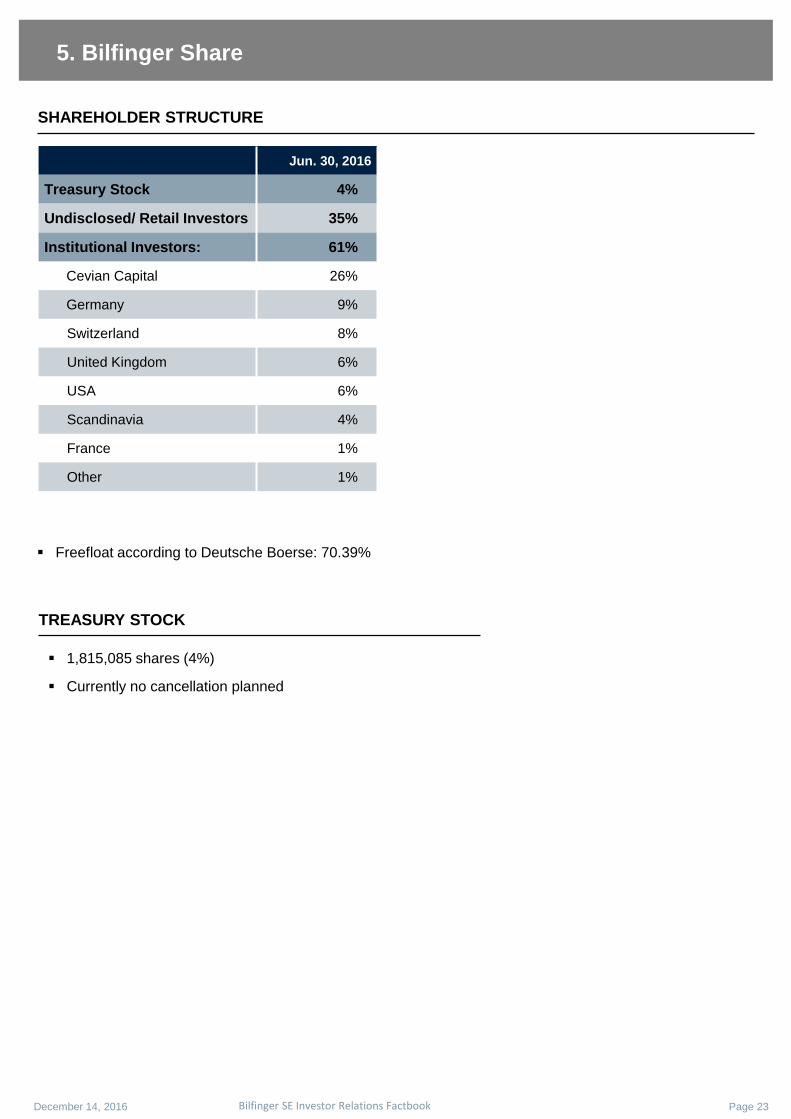
SHAREHOLDER STRUCTURE
TREASURY STOCK
1,815,085 shares (4%)
Currently no cancellation planned
Freefloat according to Deutsche Boerse: 70.39%
Jun. 30, 2016
Treasury Stock 4%
Undisclosed/ Retail Investors 35%
Institutional Investors: 61%
Cevian Capital 26%
Germany 9%
Switzerland 8%
United Kingdom 6%
USA 6%
Scandinavia 4%
France 1%
Other 1%
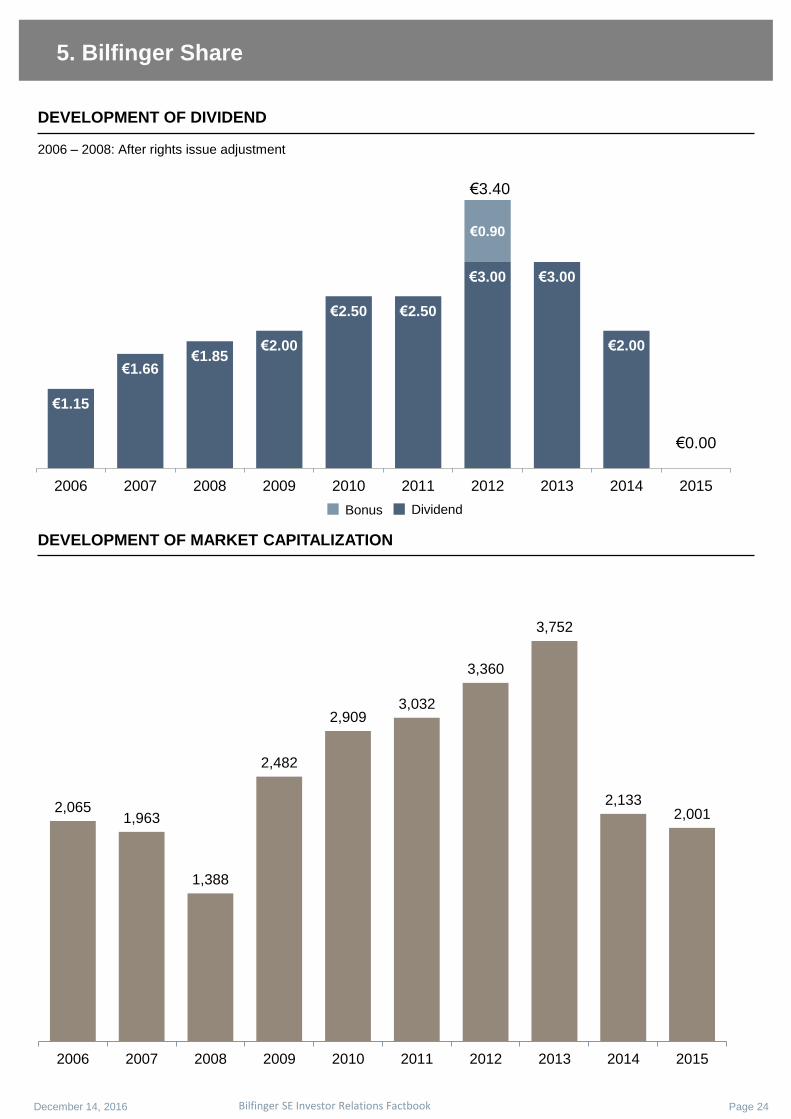
€1.15
€1.66 €1.85
€2.00
€2.50 €2.50
€3.00 €3.00
€2.00
€0.00
€0.90
2006 2007 2008 2009 2010 2011 2012 2013 2014 2015
5. Bilfinger Share
DEVELOPMENT OF MARKET CAPITALIZATION
2006 – 2008: After rights issue adjustment
€3.40
December 14, 2016 Page 24 Bilfinger SE Investor Relations Factbook
DEVELOPMENT OF DIVIDEND
Bonus Dividend
2,065 1,963
1,388
2,482
2,909 3,032
3,360
3,752
2,133 2,001
2006 2007 2008 2009 2010 2011 2012 2013 2014 2015
€0.00
5. Bilfinger Share
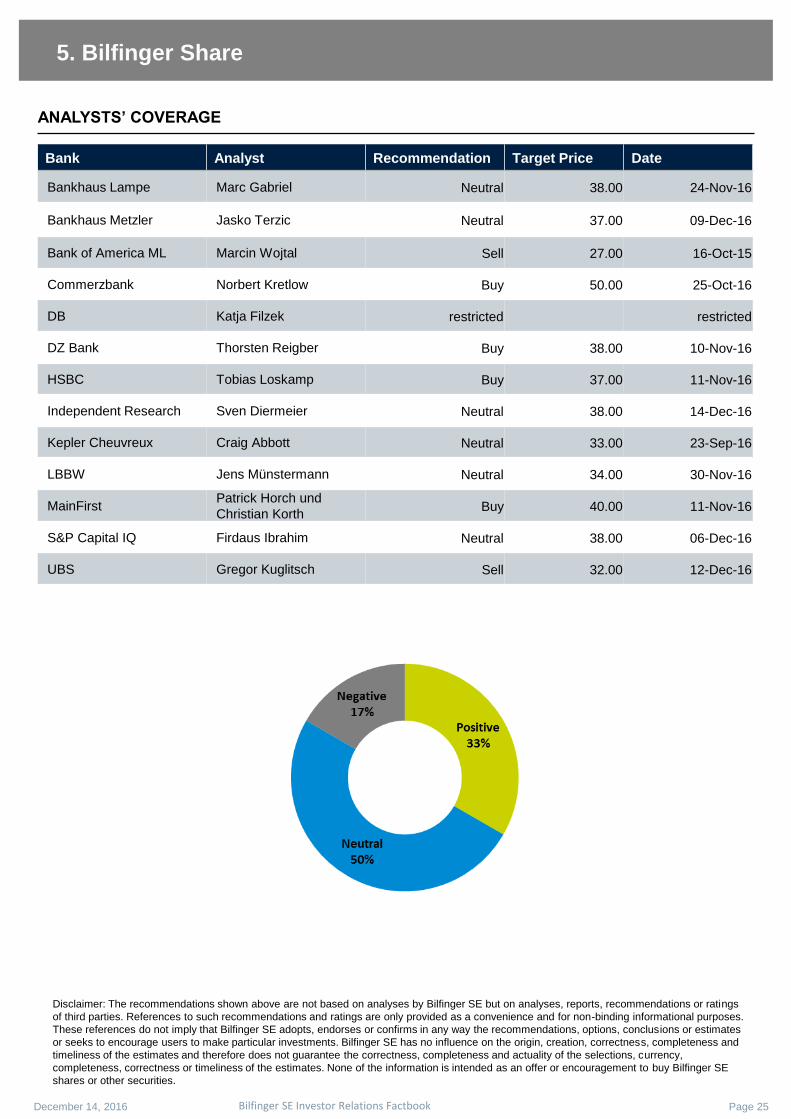
Bank Analyst Recommendation Target Price Date
Bankhaus Lampe Marc Gabriel Neutral 38.00 24-Nov-16
Bankhaus Metzler Jasko Terzic Neutral 37.00 09-Dec-16
Bank of America ML Marcin Wojtal Sell 27.00 16-Oct-15
Commerzbank Norbert Kretlow Buy 50.00 25-Oct-16
DB Katja Filzek restricted restricted
DZ Bank Thorsten Reigber Buy 38.00 10-Nov-16
HSBC Tobias Loskamp Buy 37.00 11-Nov-16
Independent Research Sven Diermeier Neutral 38.00 14-Dec-16
Kepler Cheuvreux Craig Abbott Neutral 33.00 23-Sep-16
LBBW Jens Münstermann Neutral 34.00 30-Nov-16
MainFirst Patrick Horch und
Christian Korth Buy 40.00 11-Nov-16
S&P Capital IQ Firdaus Ibrahim Neutral 38.00 06-Dec-16
UBS Gregor Kuglitsch Sell 32.00 12-Dec-16
December 14, 2016 Page 25 Bilfinger SE Investor Relations Factbook
ANALYSTS’ COVERAGE
Disclaimer: The recommendations shown above are not based on analyses by Bilfinger SE but on analyses, reports, recommendations or ratings
of third parties. References to such recommendations and ratings are only provided as a convenience and for non-binding informational purposes.
These references do not imply that Bilfinger SE adopts, endorses or confirms in any way the recommendations, options, conclusions or estimates
or seeks to encourage users to make particular investments. Bilfinger SE has no influence on the origin, creation, correctness, completeness and
timeliness of the estimates and therefore does not guarantee the correctness, completeness and actuality of the selections, currency,
completeness, correctness or timeliness of the estimates. None of the information is intended as an offer or encouragement to buy Bilfinger SE
shares or other securities.
5. Bilfinger Share
December 14, 2016 Page 26 Bilfinger SE Investor Relations Factbook
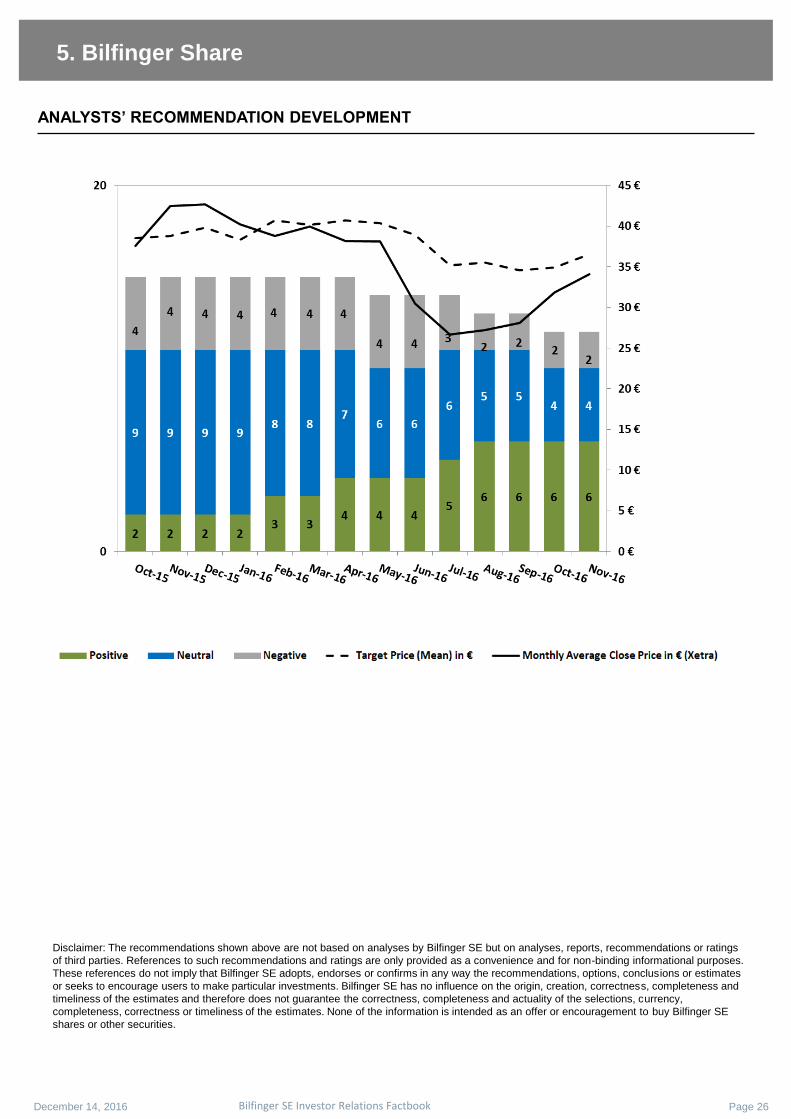
ANALYSTS’ RECOMMENDATION DEVELOPMENT
Disclaimer: The recommendations shown above are not based on analyses by Bilfinger SE but on analyses, reports, recommendations or ratings
of third parties. References to such recommendations and ratings are only provided as a convenience and for non-binding informational purposes.
These references do not imply that Bilfinger SE adopts, endorses or confirms in any way the recommendations, options, conclusions or estimates
or seeks to encourage users to make particular investments. Bilfinger SE has no influence on the origin, creation, correctness, completeness and
timeliness of the estimates and therefore does not guarantee the correctness, completeness and actuality of the selections, currency,
completeness, correctness or timeliness of the estimates. None of the information is intended as an offer or encouragement to buy Bilfinger SE
shares or other securities.
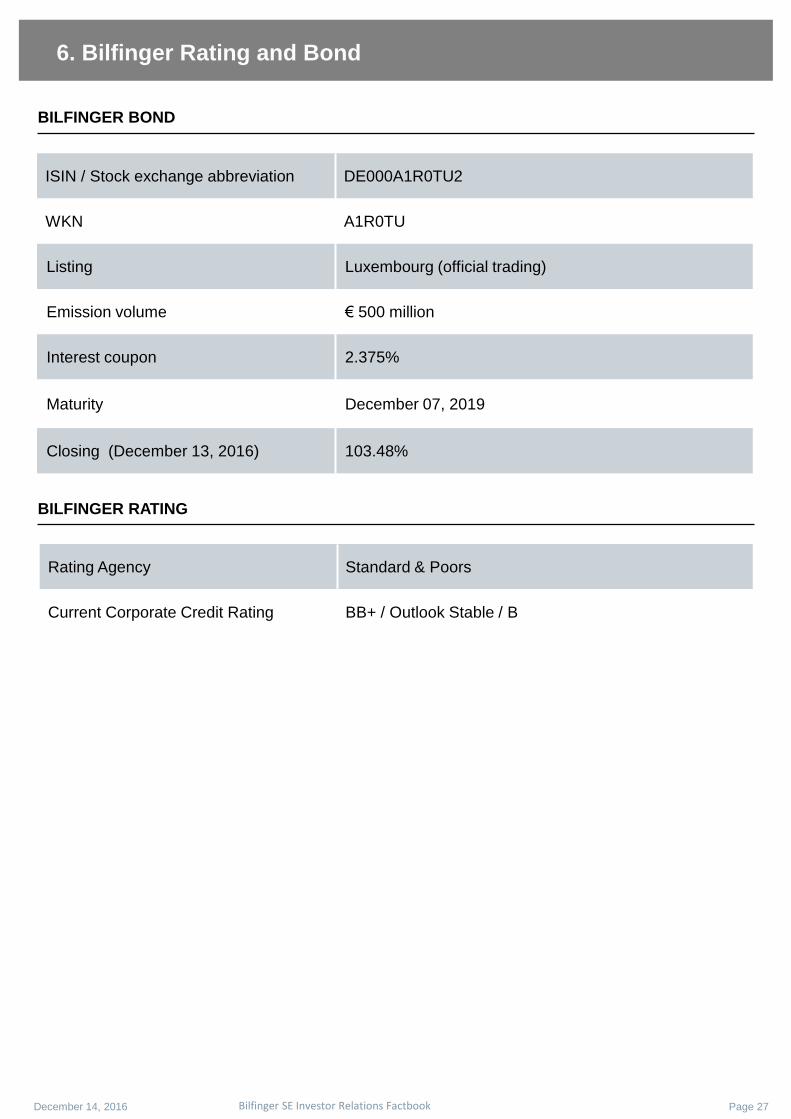
ISIN / Stock exchange abbreviation DE000A1R0TU2
WKN A1R0TU
Listing Luxembourg (official trading)
Emission volume € 500 million
Interest coupon 2.375%
Maturity December 07, 2019
Closing (December 13, 2016) 103.48%
BILFINGER RATING
6. Bilfinger Rating and Bond
Rating Agency Standard & Poors
Current Corporate Credit Rating BB+ / Outlook Stable / B
December 14, 2016 Page 27 Bilfinger SE Investor Relations Factbook
BILFINGER BOND

7. IR contact
CONTACT DETAILS
Bettina Schneider
Head of Investor Relations
Phone: +49 (0) 621 / 459-2377
Facsimile: +49 (0) 621 / 459-2968
Bilfinger SE
Corporate Headquarters
Carl-Reiß-Platz 1- 5
D- 68165 Mannheim
Germany
www.bilfinger.com
December 14, 2016 Page 28 Bilfinger SE Investor Relations Factbook
2017
February 14 Preliminary Report FY 2016 and
Capital Markets Day: Presentation of strategy and implementation plan
March 15 Press conference on financial statements
May 15 Interim Report Q1 2017
May 24 Annual General Meeting
August 14 Interim Report Q2 2017
November 14 Interim Report Q3 2017
IR EVENTS
Karl Kompe
Manager Investor Relations
Phone: +49 (0) 621 / 459-2362
Facsimile: +49 (0) 621 / 459-2968
Stefan Heinz
Manager Investor Relations
Phone: +49 (0) 621 / 459-2357
Facsimile: +49 (0) 621 / 459-2968