fact book 2019
TRANSCRIPT
Orangeburg-Calhoun Technical College
Fact Book
2019 3250 St. Matthews Road, Orangeburg, SC 29118
(803) 536-0311 1 800-813-6519
Institutional Effectiveness
www.octech.edu
October15, 2019

11/06/2019 cbh
2
PREFACE
The 2019 Fact Book is published to provide relevant facts and figures about Orangeburg-Calhoun Technical College’s enrollment, financial aid programs, and academic curriculums. Information concerning the College’s faculty and staff, the Learning Resource Center, financial data, the OCtech Foundation and continuing education programs are also included. Information for this publication was gathered from College records and reports, the State Board for Technical and Comprehensive Education, and the South Carolina Commission on Higher Education. College personnel participated in the data gathering effort, and the data was compiled by the staff of the Office of Planning and Development. Reader comments, suggestions and contributions for future editions are welcomed. Please share your ideas for making this
document a more useful tool. Cleveland Wilson, Jr. Director of IE, IR and Academic Support Orangeburg-Calhoun Technical College 3250 St. Matthews Road Orangeburg, SC 29118-8299 (803) 536-0311 (Telephone) (800) 813-6519 (Toll Free) (803) 535-1388 (Fax) www.octech.edu
GENERAL INFORMATION
LOCATION Orangeburg-Calhoun Technical College maintains 250,000 square feet of instructional and support space on 100 acres in the heart of the service area. The 18-building campus complex is located along a retail, health care, and industrial growth corridor on Interstate26/US Highway 601, adjacent to the Regional Medical Center and the Carolina Regional Business Park – a setting that offers innovative partnership opportunities with employers. GOVERNANCE South Carolina has an integrated system of higher education featuring four types of institutions: teaching universities, research universities, independent colleges, and technical colleges. These institutions are overseen by the South Carolina Commission on Higher Education. The South Carolina Technical College System is composed of 16 technical colleges. Each college serves a specific geographical area of the state. South Carolina’s technical colleges range in size from those located in metropolitan areas with annualizes unduplicated enrollments of over 24,000 curriculum students to smaller technical colleges located in more rural areas with enrollments of approximately 1, 000 curriculum students. The State Board for Technical and Comprehensive Education is responsible for the state-level development, implementation and coordination of postsecondary occupational and technical training and education for these sixteen technical colleges. Section 59-53-52 of the Code establishes an Area Commission for each of South Carolina’s technical colleges. Each Area Commission has responsibilities for college oversight and management. Orangeburg-Calhoun Technical College’s
Commission is composed of seven individuals, five from Orangeburg County and two from Calhoun County. ACCREDITATION Orangeburg-Calhoun Technical College is accredited by the Commission on Colleges of the Southern Association of Colleges and Schools (SACS) to award Associate in Arts, Associate in Science and Associate in Applied Science degrees. In addition, the Paralegal, Engineering Technology, Business and Computer Technology, Automotive Technology, Associate Degree Nursing, Practical Nursing, Medical Assisting, Respiratory Technology, Radiological Technology, and Physical Therapy Assistant programs are eligible for and accredited by national organizations. The College is committed to seeking accreditation for other programs as they become eligible. MISSION The mission of OCtech is to provide relevant training and education in a flexible environment that promotes success and self-reliance for students, and fosters economic development for the region (Last Revised: March 18, 2014).
11/06/2019 cbh
3
Orangeburg-Calhoun Technical College is an associate degree-awarding two-year public institution. As an open admissions institution, we serve students with diverse backgrounds and ability levels from a primarily rural region, enrolling approximately 4,000 – 4,600 credit students and 2,500 non-credit students annually. Orangeburg-Calhoun Technical College values the quality and effectiveness of our programs, promoting ethical standards in all aspects of the College’s operation. We seek success of each student in an environment that provides opportunity for lifelong learning in a complex, global society.
The College serves our community and our students by meeting the community’s need for a literate and technically-competent workforce via the following goals:
1. Deliver student centered programs and services that maximize intellectual and economic growth.
2. Align enrollment management processes that promote growth and improve our ability to meet the needs of employers and prepare students for transfer.
3. Create an organizational environment that is effective, efficient, and committed to future growth.
ORANGEBURG-CALHOUN TECHNICAL COLLEGE AREA COMMISSION The OCtech Area Commission is composed of seven members, five from Orangeburg County and two from Calhoun County. Commission members are appointed by the Governor upon recommendation of the legislative delegation of each county. Members serve four-year terms and may be reappointed. The Commission meets regularly at least eight (8) times per year on the third Tuesday afternoon of the month. Meetings are advertised in the local newspaper.
Representing Orangeburg County:
John F. Shuler, Chair
Leroy Morant
Jacqueline S. Shaw
Lawrence L. Weathers
Dr. Margaret Felder Wilson
Representing Calhoun County:
Mr. David Rickenbaker
Katie Hane
HISTORY The history of technical education in Orangeburg and Calhoun Counties began many years before Orangeburg-Calhoun Technical College officially opened in 1968. Previous to this date, many citizens were concerned about the future of Orangeburg and Calhoun Counties and felt the need to take action to ensure the counties’ growth. At that time, the two principal economies in the state were textiles and agriculture - both of which were having problems. South Carolina was losing her most valuable resource - her young people - who were taking jobs out of state. Then Governor Ernest F. Hollings signed legislation in 1961 creating the technical education system. Its purpose was to help encourage economic growth in South Carolina by attracting more industries to the state and to provide job training for South Carolinians who would be employed by those industries. The South Carolina General Assembly passed legislation in May 1966 creating the Orangeburg-Calhoun Area Commission for Technical Education. This commission was charged with the responsibility of developing and implementing an adequate training program at the post-secondary level. On October 25, 1967, state officials, all of whom had a hand in making the new Technical Education Center a reality, participated in officially breaking ground for the facility, which today is known as Orangeburg-Calhoun Technical College. On September 16, 1968, Orangeburg-Calhoun Technical Education Center registered its first students, becoming the eleventh South Carolina Center in operation. During the official dedication ceremonies held on May 16, 1969, the late Senator Marshall B. Williams stated that this new education facility “represents the dreams and work of many people in the area”. An important milestone in the development of how the College is recognized today was marked on December 2, 1970, when Orangeburg-Calhoun Technical Education Center Director Charles P. Weber announced that the institution had become fully accredited by the Southern Association of Colleges and Schools Commission on Colleges (SACSCOC). Today, OCtech is also fully accredited by SACSCOC to award Associate in Arts, Associate in Science and Associate in Applied Science degrees. This

11/06/2019 cbh
4
recognition was particularly notable in that it was the first time that a technical college had received accreditation in its first two years of operation. Upon recommendation by the Orangeburg-Calhoun Area Technical Education Commission and approved by the State Board for Technical and Comprehensive Education, the Center’s name was changed in May 1974 to Orangeburg-Calhoun Technical College. The purpose of this change was to more accurately reflect the College’s post-secondary education mission. The director’s title was changed to that of president at the same time. The campus, built on land that had previously been a dairy farm, included 84,232 square feet of classrooms, labs and administrative offices. In early 1974, an expansion program, estimated to add 140,000 square feet of usable space, was begun. The new additions housed administrative offices, student personnel services and a learning resource center. These buildings were dedicated in 1978 to two men recognized for the vital roles they played in the success of technical education. The Gressette Learning Resource Center was named in honor of Senator L. Marion Gressette of St. Matthews, and the Williams Administration Building in honor of Senator Marshall B. Williams of Orangeburg. Since its inception, Orangeburg-Calhoun Technical College has continued to seek new avenues for growth both academically and technically; and in 1988 the College marked its 20th anniversary with the opening of the Health Sciences Building. After 11 years in the planning stage, this 32,430 square foot, $3.3 million symbol of continuous commitment to quality health care training began holding its first classes in September 1988. In January 1993, the College dedicated buildings to its three OCtech Area Commission charter members. In a ceremony marking the occasion, the Industrial/Technology, Business/Computer Technology and Faculty Administration buildings were named in honor of Joe K. Fairey II, John O. Wesner, Jr. and Ben R. Wetenhall, respectively. The Distance Learning Center brought video conferencing capabilities to the OCtech campus in 1996. This interactive center is connected to all 16 colleges in the South Carolina Technical Education System, giving them the technological ability to work with one another by providing additional services and educational programs, not heretofore available to their respective communities. The system-wide video conferencing capability also allowed the 16 colleges in the System to offer a more comprehensive selection of educational opportunities in a cost-effective manner while avoiding duplication within their service areas. After receiving full approval to proceed with its distance learning initiatives by SACS in early 1998, OCtech began optimizing use of its new technology by pioneering a program, which offered college credit courses over the Internet. In taking this bold new step, OCtech opened up limitless educational opportunities to the community. In 2002, the College developed a comprehensive five-year strategic plan to continue to move the College forward in educating and training the community. Strategic planning continues on a five-year cycle with annual updates. In January 2002, OCtech broke ground for a 37,000 square foot, $5.2 million Student Services Building. In April 2003, OCtech cut the ribbon on its new Student and Community Life Center. Located here are Student Services, Marketing, and Development offices, and the president’s office. This building also features the Tourville Learning Lab and meeting rooms, all of which are open to the public.
Orangeburg-Calhoun Technical College completed extensive renovations to both the Gressette and the Williams buildings in 2004. The Math and Science Center was formally opened in December 2006 with needed laboratories, classrooms, lecture halls and a 400 seat auditorium. The Anne S. Crook Transportation and Logistics Center, named in honor of the former president, opened on May 10, 2010. This state of the art 25,000 square foot building houses classroom and laboratory space for welding, mechatronics, truck driver training and logistics programs. The College opened the Orangeburg-Calhoun Technical College QuickJobs Development Center in the summer of 2010 in St. Matthews. Located strategically in the Global Logistics Triangle of I-26, I-95, and Highway 301, Orangeburg-Calhoun Technical College is moving forward to provide leadership and training in Advanced Manufacturing, Transportation, and Logistics. The College continues to strive to fulfill the mission of the College by providing opportunities and services for the citizens of Orangeburg and Calhoun Counties.
11/06/2019 cbh
5
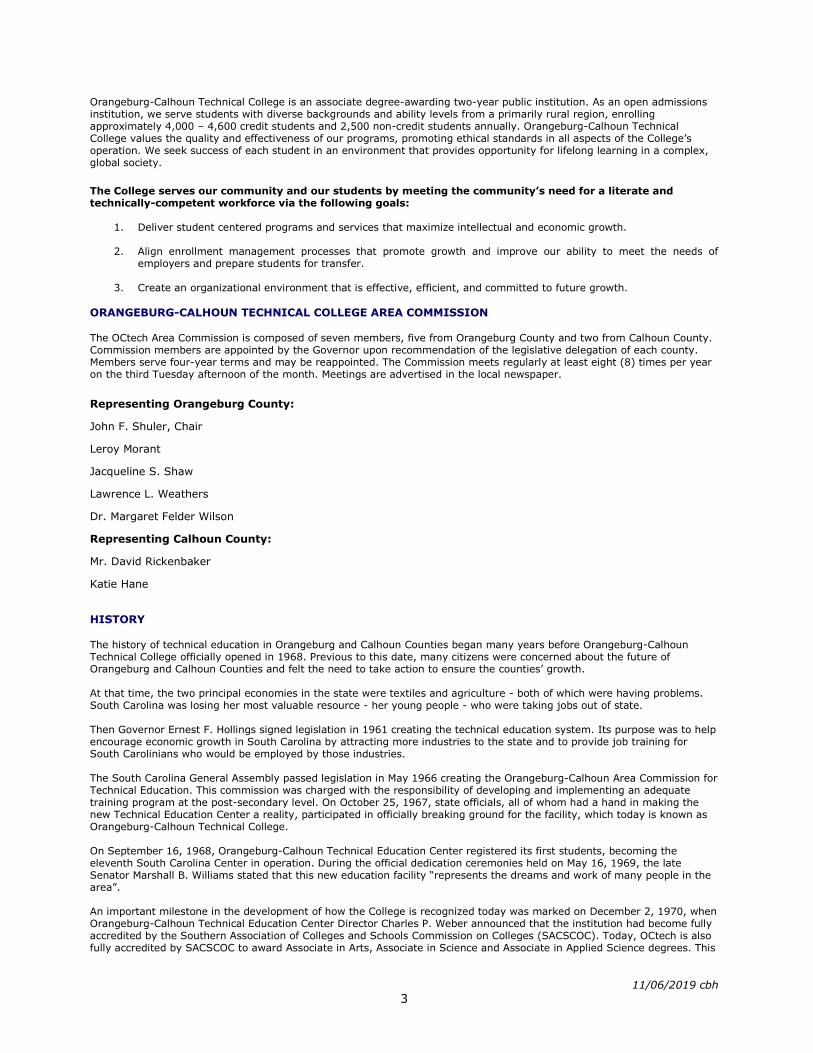
SOURCE: OCtech HR Department
11/06/2019 cbh
6
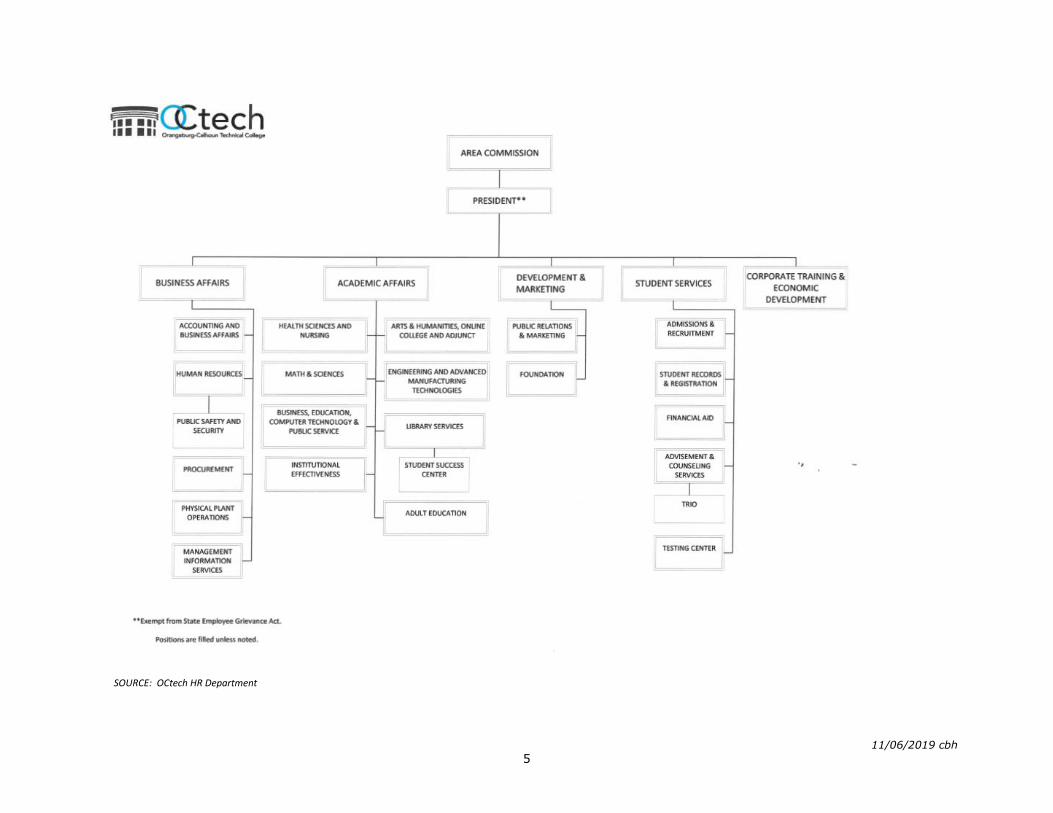
ENROLLMENT
HISTORICAL ENROLLMENT TRENDS
Fall Enrollment History
*Note: Updated data for 2011FA from college moving to a new IT software platform. SOURCE: EDSS/IPEDS Closing Data (CERS)
0
500
1,000
1,500
2,000
2,500
3,000
3,500
Fall 2013 Fall 2014 Fall 2015 Fall 2016 Fall 2017 Fall 2018
3,013 3,0552,762 2,632 2,449 2,383
6 Year Enrollment Comparison
11/06/2019 cbh
7
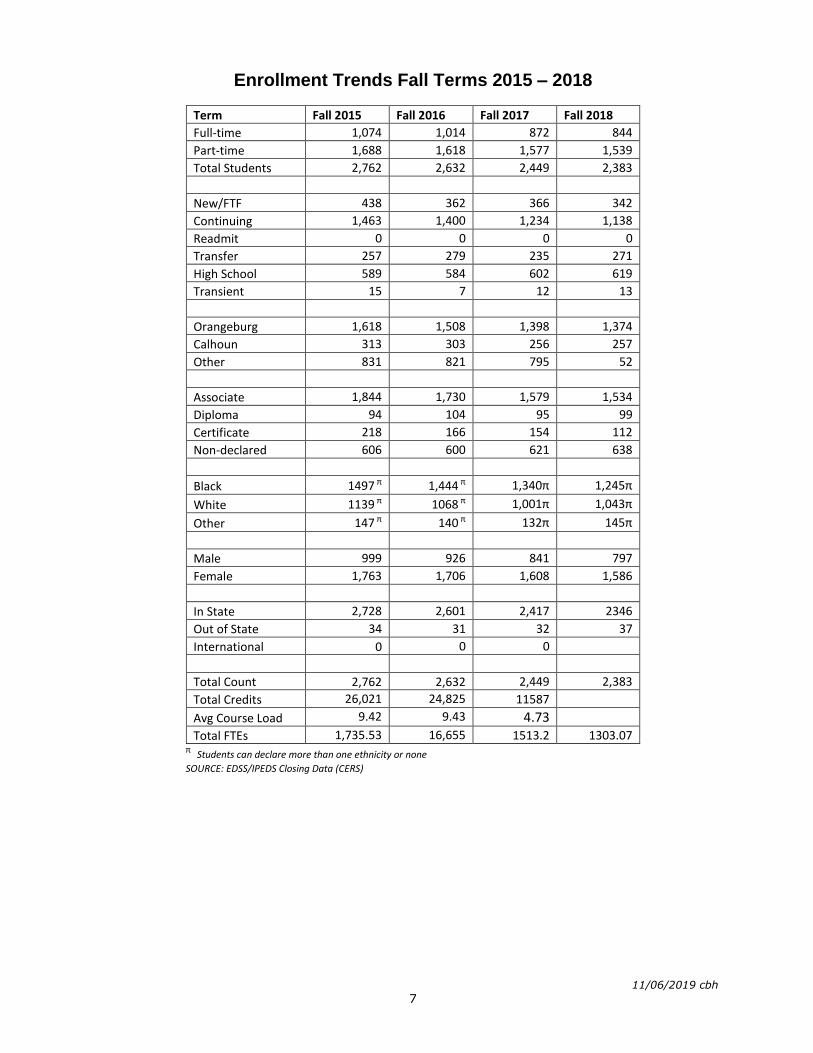
Enrollment Trends Fall Terms 2015 – 2018
Term Fall 2015 Fall 2016 Fall 2017 Fall 2018
Full-time 1,074 1,014 872 844
Part-time 1,688 1,618 1,577 1,539
Total Students 2,762 2,632 2,449 2,383
New/FTF 438 362 366 342
Continuing 1,463 1,400 1,234 1,138
Readmit 0 0 0 0
Transfer 257 279 235 271
High School 589 584 602 619
Transient 15 7 12 13
Orangeburg 1,618 1,508 1,398 1,374
Calhoun 313 303 256 257
Other 831 821 795 52
Associate 1,844 1,730 1,579 1,534
Diploma 94 104 95 99
Certificate 218 166 154 112
Non-declared 606 600 621 638
Black 1497 π 1,444 π 1,340π 1,245π
White 1139 π 1068 π 1,001π 1,043π
Other 147 π 140 π 132π 145π
Male 999 926 841 797
Female 1,763 1,706 1,608 1,586
In State 2,728 2,601 2,417 2346
Out of State 34 31 32 37
International 0 0 0
Total Count 2,762 2,632 2,449 2,383
Total Credits 26,021 24,825 11587
Avg Course Load 9.42 9.43 4.73 Total FTEs 1,735.53 16,655 1513.2 1303.07
π Students can declare more than one ethnicity or none
SOURCE: EDSS/IPEDS Closing Data (CERS)
11/06/2019 cbh
8
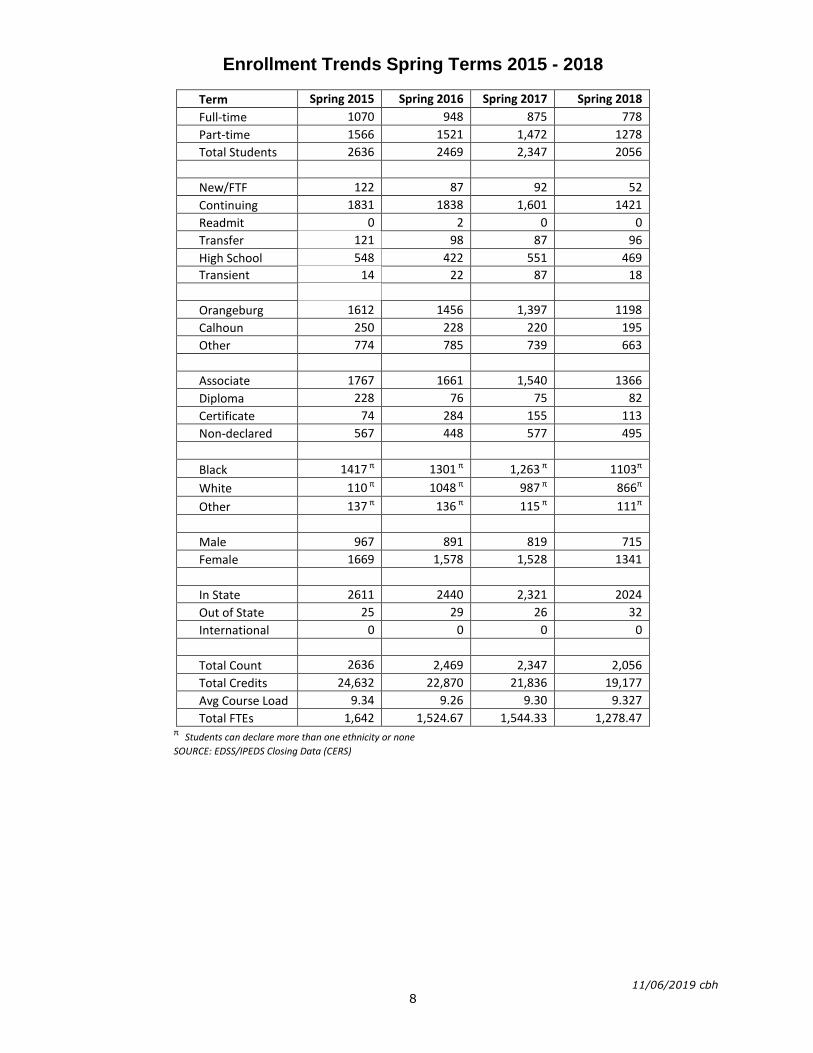
Enrollment Trends Spring Terms 2015 - 2018
Term Spring 2015 Spring 2016 Spring 2017 Spring 2018
Full-time 1070 948 875 778
Part-time 1566 1521 1,472 1278
Total Students 2636 2469 2,347 2056
New/FTF 122 87 92 52
Continuing 1831 1838 1,601 1421
Readmit 0 2 0 0
Transfer 121 98 87 96
High School 548 422 551 469
Transient 14 22 87 18
Orangeburg 1612 1456 1,397 1198
Calhoun 250 228 220 195
Other 774 785 739 663
Associate 1767 1661 1,540 1366
Diploma 228 76 75 82
Certificate 74 284 155 113
Non-declared 567 448 577 495
Black 1417 π 1301 π 1,263 π 1103π
White 110 π 1048 π 987 π 866π
Other 137 π 136 π 115 π 111π
Male 967 891 819 715
Female 1669 1,578 1,528 1341
In State 2611 2440 2,321 2024
Out of State 25 29 26 32
International 0 0 0 0
Total Count 2636 2,469 2,347 2,056
Total Credits 24,632 22,870 21,836 19,177
Avg Course Load 9.34 9.26 9.30 9.327
Total FTEs 1,642 1,524.67 1,544.33 1,278.47 π Students can declare more than one ethnicity or none
SOURCE: EDSS/IPEDS Closing Data (CERS)
11/06/2019 cbh
9
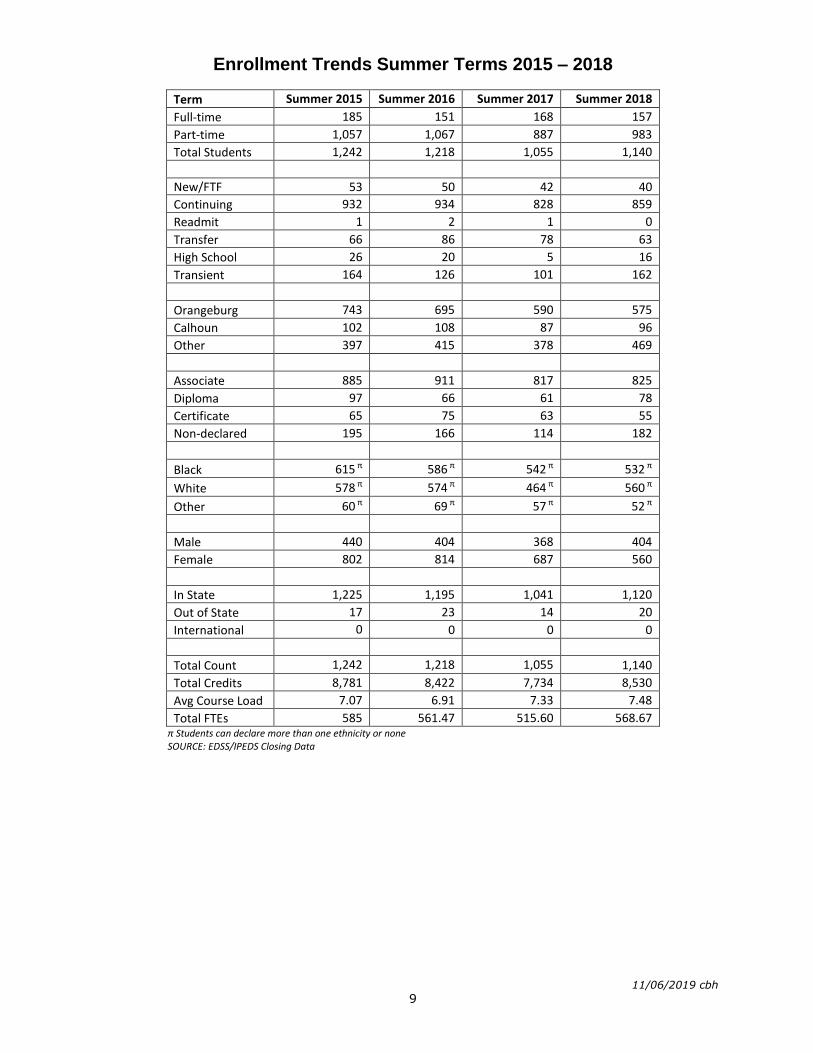
Enrollment Trends Summer Terms 2015 – 2018
Term Summer 2015 Summer 2016 Summer 2017 Summer 2018
Full-time 185 151 168 157
Part-time 1,057 1,067 887 983
Total Students 1,242 1,218 1,055 1,140
New/FTF 53 50 42 40
Continuing 932 934 828 859
Readmit 1 2 1 0
Transfer 66 86 78 63
High School 26 20 5 16
Transient 164 126 101 162
Orangeburg 743 695 590 575
Calhoun 102 108 87 96
Other 397 415 378 469
Associate 885 911 817 825
Diploma 97 66 61 78
Certificate 65 75 63 55
Non-declared 195 166 114 182
Black 615 π 586 π 542 π 532 π
White 578 π 574 π 464 π 560 π
Other 60 π 69 π 57 π 52 π
Male 440 404 368 404
Female 802 814 687 560
In State 1,225 1,195 1,041 1,120
Out of State 17 23 14 20
International 0 0 0 0
Total Count 1,242 1,218 1,055 1,140
Total Credits 8,781 8,422 7,734 8,530
Avg Course Load 7.07 6.91 7.33 7.48
Total FTEs 585 561.47 515.60 568.67 π Students can declare more than one ethnicity or none SOURCE: EDSS/IPEDS Closing Data
11/06/2019 cbh
10
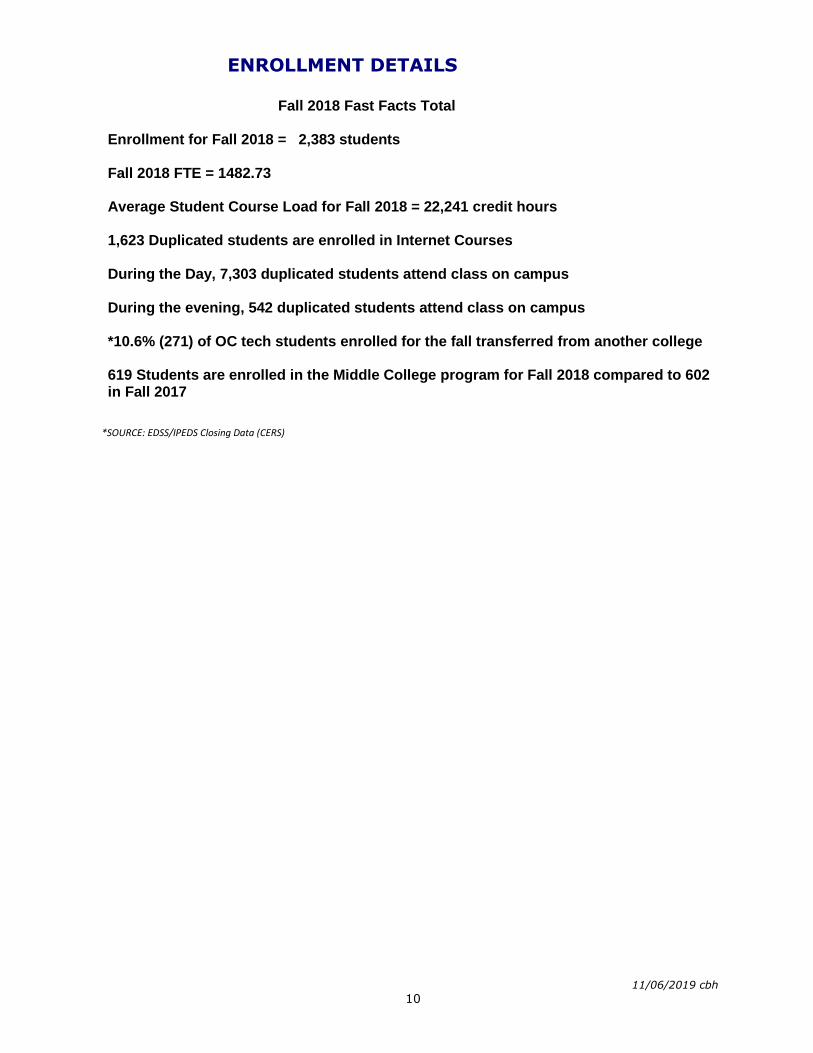
ENROLLMENT DETAILS
Fall 2018 Fast Facts Total Enrollment for Fall 2018 = 2,383 students Fall 2018 FTE = 1482.73 Average Student Course Load for Fall 2018 = 22,241 credit hours 1,623 Duplicated students are enrolled in Internet Courses During the Day, 7,303 duplicated students attend class on campus During the evening, 542 duplicated students attend class on campus *10.6% (271) of OC tech students enrolled for the fall transferred from another college 619 Students are enrolled in the Middle College program for Fall 2018 compared to 602 in Fall 2017
*SOURCE: EDSS/IPEDS Closing Data (CERS)

11/06/2019 cbh
11
Enrollment Trends by Active Academic Program Fall 2015 – Fall 2018
Academic Program Fall Headcount Fall FTE
2015 2016 2017 2018 2015 2016 2017 2018
Associate in Arts 215 172 150 144 145.54 118.8 99.53 114.16
Associate in Arts-Bridge- USC 4 - 5 2 3 - 3.93 2
Associate in Arts-Bridge- SCS 1 - - 1 0.6 - - 1
Associate in Applied Science in Accounting 29 29 9 3 21.4 20.47 6 2.75
*Associate in Applied Science in Business Administration/Accounting - - 19 35 - - 12.8 28.5
*Associate in Applied Science in Business Administration/ENTMGT - - 44 70 - - 31.20 57
Associate in Applied Science in General Business 88 81 44 17 60.8 57.07 61.47 11.25
Associate in Applied Science in Administrative Office Technology 24 31 21 22 15 21.33 13.2 15
Associate in Applied Science in Computer Technology 91 96 78 84 69.07 34.01 58.2 74.42
*Associate in Applied Science in Engineering Design Technology - - 9 21 - - 6.27 17.58
Associate in Applied Science in Engineering Technology/ Electronic Instrumentation
83 72 54 66 70.87 63.67 44.67 55.93
Associate in Applied Science in Engineering Technology/CE 6 6 3 - 5 4.07 2.27 -
*Associate in Applied Science in Engineering Technology/ Programming - - 5 1 - - 3.53 0.5
*Associate in Applied Science in Engineering Technology/ Programming - Transfer
- - 4 4 - - 2.67 3.5
Associate in Applied Science in Nursing 118 135 102 88 72.07 81.94 61.47 64.5
Associate in Applied Science in Nursing-FLEX - 9 9 8 6.07 6.6 7.33
Associate in Applied Science in Nursing-Transition 4 0 3 16 2.93 0 1.8 11.5
Associate in Applied Science in Physical Therapy Assistant 15 19 15 13 18.6 19.53 14.6 13
Associate in Applied Science in Radiologic Technology 20 22 25 26 15.27 17 19.87 23.92
Associate in Applied Science in Respiratory Therapy 20 18 21 8 15.93 13.8 18.6 8
Associate in Applied Science in Automotive Technology 40 38 26 27 30.13 26.33 20.4 22.25
Associate in Applied Science in Industrial Electronics Tech. 19 20 24 34 15.53 16.33 18.53 26.73
Associate in Applied Science in Machine Tool Technology 25 19 27 23 21.27 17.4 25.2 20.67
Associate in Applied Science -Mechatronics 36 26.73
Associate in Applied Science in General Technology 153 174 151 57 115.86 122.66 102.60 47.4
Associate in Applied Science in Criminal Justice 100 79 56 60 73.67 56.6 40.8 53.5
Associate in Applied Science in Early Childhood Education 60 53 37 31 39.27 35.6 25.67A 20.47
Associate in Applied Science in Paralegal/Legal Assistant 29 33 30 23 21.8 23.47 22.27 18
*Associate in Science - Food Science Program - - 1 - - - 0.93 -
Associate in Science 86 83 75 67 60.21 58.99 53.81 44.99
Associate in Science -Prep 600 557 505 530 376.39 360.95 307.13 332.67
Associate in Science Degree - Sc State Bridge Program - 1 - - - 0.53 - -
Associate in Science Degree Usc Bridge Program 5 5 3 3 4.13 3.47 2.07 1.93
Associate in Science - Nursing - Usc Upstate Adn to Bsn 13 29 23 8 7.4 17.07 13 4.92
Associate in Science - Nursing - Clemson - ADN to BSN 1 0.93
Certificate in Basic Accounting 7 4 6 5 3.4 2.4 2.4 3.25
Entrepreneurship Certificate 5 6 - - 2.2 2.53 0.80 -
Certificate in Logistics 3 5 1 2 1.6 2.6 0.40 2
Certificate in Database & Programming 1 6 1 - 08 5.4 0.40 -
Certificate in Network Engineering/MCSE 2 4 - 1 05 3.4 - 0.75
Certificate in Internetworking/CISCO - 4 - 1 3.6 - 1
Certificate in Network Specialist 5 5 1 1 3.8 4 0.40 1

11/06/2019 cbh
12
Academic Program Fall Headcount Fall FTE
2015 2016 2017 2018 2015 2016 2017 2018
Certificate in Web Master 2 2 - - 1.2 1.2 - -
Health Physics Certificate I - - - 1 - - - 1
Certificate in Computer-Aided Design 1 1 2 - - .6 .67 - -
Certificate in Computer-Aided Design II - 2 - - - .67 - -
Certificate in Computer-Aided Design III - 2 - - - .67 - -
Certificate in Health Science in Nursing Assistant - - 2 - - - 0.80 -
Certificate in Emergency Medical Technician 13 14 12 11 6.27 7.47 4.67 6.67
Cert. in Health Science in Patient Care Tech 110 72 68 47 60.6 39.8 41.07 31
Certificate in Magnetic Resonance Imaging 7 9 9 8 8.4 10.47 10.73 8
Certificate in Mammography 9 12 5 5 5.07 12.93 5.33 4.08
Certificate in Computed Tomography 4 - - - 2.4 - - -
Advanced Certificate in Industrial Maintenance - - - - - - - -
Certificate in Basic Industrial Maintenance 1 3 2 1 .87 1.47 0.80 0.25
Certificate in Basic Diesel Maintenance - 1 - 1 0.93 - 0.25
Certificate in Basic Electrician 2 1 8 2 1.07 0.27 4.80 1.42
Certificate in Basic Welding 25 22 10 2 14.93 13.33 5.60 1.33
Certificate in Industrial Electrician - 1 1 - - 0.27 0.47 -
Welding Fundamentals Certificate - 2 - - - 1.13 - -
Intermediate Cert. in Ind. Maintenance - 4 - - - 2.47 - -
Intermediate Welding Certificate - - 1 - - - 0.93 -
Certificate in Mechatronics I 2 2 1 - 1.87 1.6 0.40 -
Certificate in Mechatronics II - 4 - - - 2.8 - -
Certificate in Mechatronics III - 2 - - - 1.2 - -
Certificate in Power Plant Technology I 1 3 - - .93 1.13 - -
Certificate in Power Plant Technology III - - - - - - - -
Certificate in Production Operator - - 3 - - - 3.20 -
Certificate in Radiation Fundamentals - - 1 28 - - 0.87 28
Certificate in Under Car Specialist - 1 - - - 0.53 - -
Certificate in Truck Driver Training 17 28 24 28 13.6 22.4 22.4 29.87
Certificate in Sustainable Agriculture 1 - 1 1 .8 - 0.80 0.75
Certificate in General Studies - 1 - 6 - 1.6 - 4.25
Certificate in Early Childhood Development 2 2 - 2 .6 1.4 - 1.25
Forensics Certificate Program 6 3 2 614 3.53 1.73 1.2 340.92
Certificate in Security 5 2 - 4 2.6 1.4 - 3.25
Certificate in Undergraduate Student Middle College 590 583 601 4 249.13 255.53 260.53 2.5
Diploma in Applied Science in Administrative Support 2 3 3 17 1.2 1.6 1.60 14.5
Diploma in Applied Science in Early Childhood Development 2 2 2 62 1 1.2 1.4 52.75
Diploma in Applied Science in Medical Lab Office Assisting 21 41 18 16 16.87 32.13 14.6 13.33
Diploma in Applied Science in Practical Nursing 55 56 60 - 38.73 45 38.33 -
Diploma in Applied Science in Practical Nursing – FLEX - - 17 1 - - 11 1
Career Development and Non Degree General Education 2 9 7 7 .4 1.87 1.73 2.67
Undecided/Unknown 1 0 4 1 .8 0 1.93 0.83
*New Programs starting in Fall 2017 Unduplicated Totals
SOURCE: XHFR-Datatel

11/06/2019 cbh
13
Fall 2018 Enrollment Demographics
SOURCE: EDSS/IPEDS Closing Data (CERS)
SOURCE: EDSS/IPEDS Closing Data (CERS)
0
500
1000
1500
2000
2500
3000
Fall 2015 Fall 2016 Fall 2017 Fall 2018
part-time 1688 1618 1,577 1,539
full-time 1074 1014 872 844
1074 1014 872 844
16881618
1,577 1,539
Full Time/Part Time Enrollment Fall 2015 vs 2018
64%
4%
5%
27%
Degree Type Fall 2018
Associate Diploma Certificate Non-Declared

11/06/2019 cbh
14
*Note: Detailed enrollment data for Day/Evening Combinations is duplicated. SOURCE: EDSS/IPEDS Closing Data (CERS)
SOURCE: EDSS/IPEDS Closing Data (CERS)
66%
5%
15%
14%
Day/Evening Combination Fall 2018 (Duplicated)
Day Evening Internet Off Campus
33%
67%
Gender Fall 2018
Male Female

11/06/2019 cbh
15
*Note: Due to some students claiming more than one ethnicity there will be some duplication. SOURCE: EDSS/IPEDS Closing Data (CERS)
Fall 2018 Enrollment by Age Category
The under 18 Age Category is comprised of high school students participating in dual enrollment courses through the Middle College program.
SOURCE: EDSS/IPEDS Closing Data (CERS)
Under 18 18-19 20-21 22-25 26-30 31-35 36-40 41-45 46-50 51-55 56-60 >60 Age Unknown Unreported
548 554 321 324 250 129 103 57 45 25 19 7 1
36.72% of students fall into the traditional age (18-21) category SOURCE: EDSS/IPEDS Closing Data (CERS)
51%
43%
6%
Race/Ethnicity Fall 2018
Black White Other
0
100
200
300
400
500
600

11/06/2019 cbh
16
Professional Exam Subset
April 2015 to March 2016 April 2016 to March 2017 April 2017 to March 2018 April 2018 to March 2019
Name of Exam # of
Examinees
# of 1st Time
Examinees
# of 1st Time
Examinees who Passed
Pass Percentag
e # of
Examinees
# of 1st Time
Examinees
# of 1st Time
Examinees who
Passed Pass
Percentage # of
Examinees
# of 1st Time
Examinees
# of 1st Time
Examinees who
Passed Pass
Percentage # of
Examinees
# of 1st Time
Examinees
# of 1st Time
Examinees who
Passed Pass
Percentage
Technical Sector
Certification Examination For Entry Level Respiratory
Therapy Practitioners (CRTT) 9 9 8 89% 6 6 4 67% 9 4 4 100% 6 6 6 100%
Certified Medical Assistant Exam.
17 17 10 59% 13 13 10 77% 18 18 8 44% 14 14 9 64%
Medical Laboratory Technician, ASCP
Emergency Medical Technician - NREMT
6 6 3 50% 10 10 6 67% 12 12 5 42% 13 13 4 31%
National Council Licensure Exam. (NCLEX) - Practical
Nurse 43 42 41 98% 53 53 48 90.5% 47 45 45 100% 60 60 55 91.6%
National Council Licensure Exam. (NCLEX) - Registered
Nurse (ADN) 38 38 38 100% 43 43 43 100% 51 49 45 91.8% 38 38 38 100%
National Physical Therapist Assistant Licensing Exam
(PTA) 12 12 8 67% 14 14 14 100% 14 14 14 100% 14 14 14 100%
Nurse Aid Competency Evaluation Program (NACEP)
70 70 69 99% 97 97 93 96% 100 100 95 95% 77 77 72 93.5%
Radiography Exam., ARRT 9 9 9 100% 8 8 8 100% 9 9 9 100% 11 11 11 100%
Registry Exam. for Advanced Respiratory Therapy
Practitioners (RRT) – Clinical Simulation
8 8 7 88% 4 4 3 75% 5 4 3 75% 6 6 5 83%
Registry Exam. for Advanced Respiratory Therapy
Practitioners (RRT) – Written Registry
9 9 8 89% 4 4 3 75% 9 4 4 100% 6 6 6 100%
College Totals 221 220 201 91.3% 233 233 218 93.56% 247 237 220 92.8% 255 255 229 89.80%
SOURCE: Results of Professional Examinations Report (In-House ONLY)
11/06/2019 cbh
17
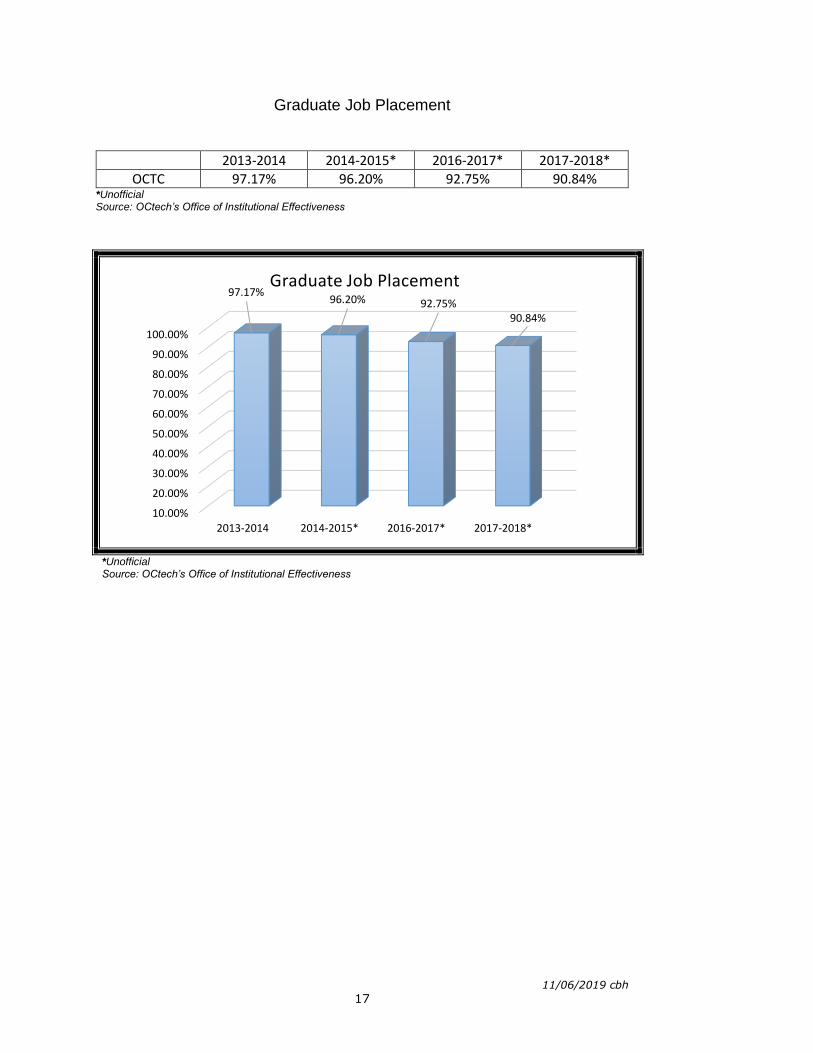
Graduate Job Placement
2013-2014 2014-2015* 2016-2017* 2017-2018*
OCTC 97.17% 96.20% 92.75% 90.84% *Unofficial Source: OCtech’s Office of Institutional Effectiveness
*Unofficial Source: OCtech’s Office of Institutional Effectiveness
10.00%
20.00%
30.00%
40.00%
50.00%
60.00%
70.00%
80.00%
90.00%
100.00%
2013-2014 2014-2015* 2016-2017* 2017-2018*
97.17%96.20% 92.75%
90.84%
Graduate Job Placement

11/06/2019 cbh
18
FACULTY AND STAFF
Full Time Staff by Area of Responsibility
Year
Natural Resources, Construction, and Maintenance Occupations (2.9%)
Office and Administrative Support Occupations (14.4%)
Service Occupations (9.8%)
Community Service, Legal, Arts, and Media Occupations (7.5%)
Computer, Engineering, and Science Occupations (4.6%)
Business and Financial Operations Occupations (4.0%)
Management Occupations (8.0%)
Student and Academic Affairs and Other Education Services (2.9%)
Library Technicians (1.1%)
Librarians (0.6%)
Postsecondary Teachers (44.3%)
Total
2014-2015 6 30 14 27 8 8 15 1 1 82 192
2015-2016 6 25 15 13 9 8 14 5 2 1 82 180
2016-2017 6 25 16 11 9 8 14 5 2 2 80 180
2017-2018 5 25 17 13 8 7 14 5 2 1 77 174
2018-2019
6 21 13 12 9 7 13 5 2 2 72 162
*Modifications made in the Fall 2013 IPEDS SOURCE: EDSS/IPEDS Closing Data (CERS)
11/06/2019 cbh
19
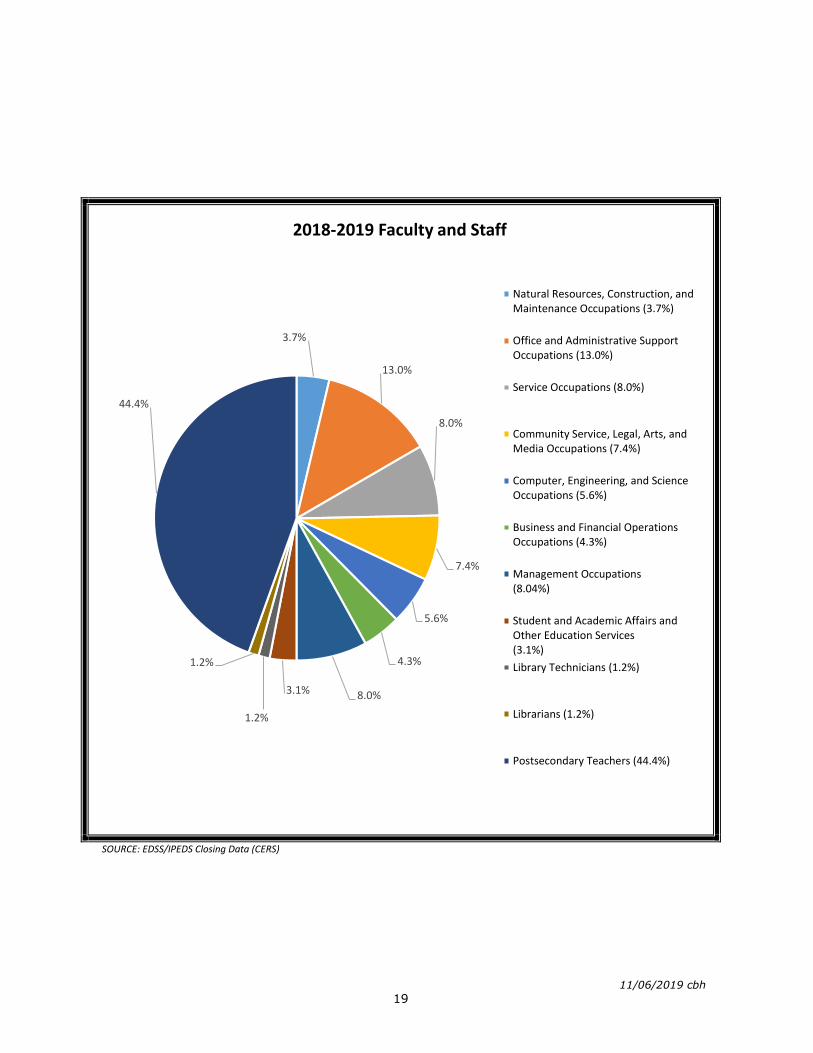
SOURCE: EDSS/IPEDS Closing Data (CERS)
3.7%
13.0%
8.0%
7.4%
5.6%
4.3%
8.0%3.1%
1.2%
1.2%
44.4%
2018-2019 Faculty and Staff
Natural Resources, Construction, andMaintenance Occupations (3.7%)
Office and Administrative SupportOccupations (13.0%)
Service Occupations (8.0%)
Community Service, Legal, Arts, andMedia Occupations (7.4%)
Computer, Engineering, and ScienceOccupations (5.6%)
Business and Financial OperationsOccupations (4.3%)
Management Occupations(8.04%)
Student and Academic Affairs andOther Education Services(3.1%)
Library Technicians (1.2%)
Librarians (1.2%)
Postsecondary Teachers (44.4%)

11/06/2019 cbh
20
Year
Male White (26%)
Male Black (6%)
Male Other (0%)
Female White (51%)
Female Black (16%)
Female Other (1%) Total
2014-15 23 4 0 40 14 1 82
2015-16 21 4 0 40 16 1 82
2016-17 20 4 0 40 15 1 80
2017-18 20 5 0 39 12 1 77
2018-2019 19 5 0 35 12 1 72 SOURCE: EDSS/IPEDS Closing Data (CERS)
SOURCE: EDSS/IPEDS Closing Data (CERS)
26%
7%
0%
49%
17%
1%
2018-2019 Faculty Ethnic and Gender Mix
Male White (26%)
Male Black (7%)
Male Other (0%)
Female White (49%)
Female Black (17%)
Female Other (1%)

11/06/2019 cbh
21
Annual Financial Aid Disbursements
AWARD 2016-17 2016-17 **2017-18 2018-19
PELL $6,299,880.44 $5,734,450.86 $5,616,513.44 $5,665,693
SEOG $141,914.97 $132,109.00 $128,440.96 $238,733
South Carolina Needs Based Grant $273,582.00 $264,807.00 $246,754.00 $224,361
Life Scholarship $613,035.00 $685,800.00 $827,960.00 $1,070,258
Lottery Tuition Assistance $1,957,691.16 $1,944,661.00 $1,555,693.00 $1,630,432
Direct/Stafford Loans $3,238,255.00 $3,359,174.00 $2,379,009.00 $2,184,633
Other State or Campus-Based grants 0 0 0 $588,607
Grand Totals $12,524,358.57 $12,121,001.86 $10,754,370.40 $11,602,717 Lottery Tuition was established in Fall 2002 ** Data is as of Wednesday, December 5, 2018 SOURCE: OCtech’s Financial Aid Office
SOURCE: OCtech’s Financial Aid Office
SOURCE: OCtech’s Financial Aid Office
0
5000000
10000000
15000000
20000000
2015-16 2016-17 **2017-18 2018-19
$12,524,358.57 $12,121,001.86
$10,754,370.40 $11,602,717
Annual Financial Aid Disbursements
48.8%
2.1%1.9%
9.2%
14.1%
18.8%
5.1%
2018-19 Financial Aid DisbursementsPELL
SEOG
South Carolina Needs Based Grant
LIFE Scholarship
Lottery Tuition Assistance
Direct/Stafford Loans
Other Grants (STEP, MAHP, SCAMP,Perkins)
11/06/2019 cbh
22
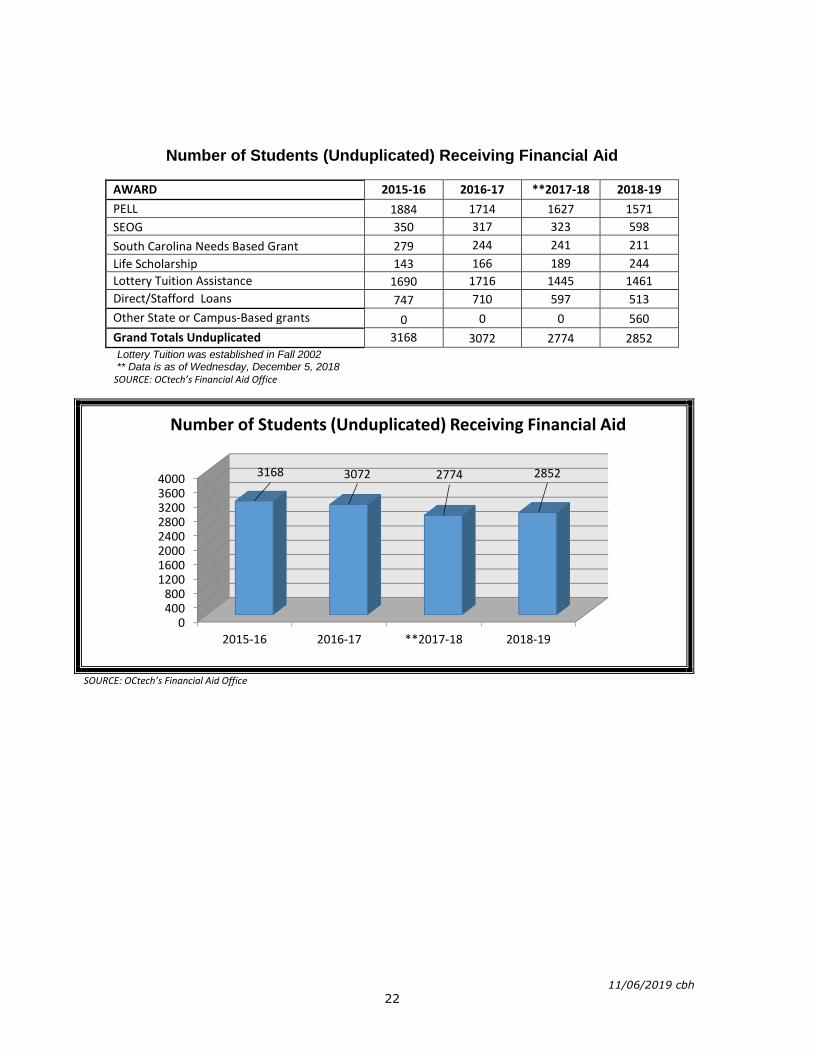
Number of Students (Unduplicated) Receiving Financial Aid
AWARD 2015-16 2016-17 **2017-18 2018-19
PELL 1884 1714 1627 1571
SEOG 350 317 323 598
South Carolina Needs Based Grant 279 244 241 211
Life Scholarship 143 166 189 244
Lottery Tuition Assistance 1690 1716 1445 1461
Direct/Stafford Loans 747 710 597 513
Other State or Campus-Based grants 0 0 0 560
Grand Totals Unduplicated 3168 3072 2774 2852 Lottery Tuition was established in Fall 2002 ** Data is as of Wednesday, December 5, 2018 SOURCE: OCtech’s Financial Aid Office
SOURCE: OCtech’s Financial Aid Office
0400800
12001600200024002800320036004000
2015-16 2016-17 **2017-18 2018-19
3168 3072 2774 2852
Number of Students (Unduplicated) Receiving Financial Aid

11/06/2019 cbh
23
GRESSETTE LEARNING RESOURCES CENTER
Library Operating Expenditures (excluding salaries)
Collections 2015-2016 2016-2017 2017-2018 2018-2019
Printing - 12.28 230.81 339.10
Other Contractual Services - 10,929.67 13,072.06 10,298.58
Office Supplies - 2,542.79 2,137.47 2,740.66
Educational Supplies - 417.48 1,658.07 148.63
Postage - 33.76 40.14 9.38
Other Supplies - 42.62 274.76 1,673.14
Dues and Memberships - 26,811 24,011 24,262
Subscriptions - 1,692 500 177
Travel - 1,518.93 1,047.96 7,290.81
Books (Printed Material for 2013-14, 2014-15, and 2015-16)
10,243.58 10,996.46 14,622.43 15,450.30
Periodicals (Current Serial Subscription for 2013-14, 2014-15, and 2015-16)
3,337.10 3,060.12 3,197.85 3,572.65
Databases 26,167.87 26,911.80 29,730.50 34,589.64
eBooks 1,059.20 0.00 0.00 0
Multimedia Supplies 4,364.95 4,050.84 1,374.80 538.24
Total Expenditures $45,172.70 $89,019.75 $91,897.85 101,090.13 Library operating expenditures As of 2016-2017, expenditures have been adjusted to reflect the same format as detailed in the college’s budget summary (via connect). Audio-Visual has been changed to Multimedia and includes multimedia expenditures from both the operational and material budget sections. Print Materials was changed to Books. Current Serial Subscription was changed to Periodicals. Microforms was removed. Electronic Books was changed to eBooks. New sections include: Printing, Other Contractual Services, Office Supplies, Educational Supplies, Postage, Other Supplies, Dues and Memberships, Subscriptions, and Travel
Library Resource Access, Use, and Transactions
2015-16 2016-17 2017-2018 2018-
2019
Checkouts and Renewals (General Collections for 2013-14, 2014-15, and 2015-16)
2,921 2,750 2,018 1,284
eBooks Collection Access 2,586 2,736 648 725
Database Retrievals 71,123 49,845 40,304
Books Sent out by OCTC (PASCAL/OCLC) (Books Provided for 2013-14, 2014-15, and 2015-16)
82 63 71 53
Books/Articles requested by OCTC (PASCAL/OCLC) (Books/Articles Received for 2013-14, 2014-15, and 2015-16)
348 363 256 90
LibGuide Page Views - 5,211 5,901 26,593
Website Page Views - 1,141 4,173 N/A
Online Catalog Sessions - 2,020 1980 1923
Reference/Questions, interactions - 3,648 841 -
Number of library orientations and presentations 17 19 10 20
Number of persons served in library orientations and presentations
266 547 290 -
Library Resource Access, Use, and Transactions Libguide page views is lower because of the update to the library’s website and libguides, where the landing page is no longer a libguide. Attendance in the library per week changed to reflect average number per day, time of day, and day of week.

11/06/2019 cbh
24
The pages viewed has been changed to number of sessions.
Library Collections (excluding databases, including ebooks)
2015-2016 2016-2017 2017-18 2018-19
Added/Weeded Total Added/Weeded Total Added Discarde
d
Total Held in
Collection Added Discarded
Total Held in
Collection
Books 102 8,075 145 774 171 10 7572 239 3 7778
Audio Visual (484) 2,251 119 66 51 87 2237 69 0 2302
Miscellaneous 5 0 15 1 260 9 2 265
Serial (Electronic) 0 0 3 0 0 0 253 0 0 251
Serial (Print) (1) 35 0 0 34 0 0 34
Electronic Titles (OCTC catalog)
91,203 391,203 868 0 0 1 47,671 0 0 47,663
Ebook Collection (PASCAL)
- - N/A N/A N/A N/A 379,604 N/A N/A 482,244
Total Items 487,434 Library Circulations The Library Circulations heading was changed to Library Resource Access, Use, and Transactions and content was combined with Library Service. Number of presentations was changed to Number of library orientations and presentations. Database Retrievals was changed to Articles Accessed through Databases. Public Service per typical week was removed and is replaced by reference questions/interactions. Online catalog page views was changed to online catalog sessions
Usage of Library Facilities
Number of Times Someone Exited the Library (door counter)
2016-2017 2017-2018 2018-2019
Total Number: 37,619 Number of Days Open: 236 Average Number Per Day: 159
Total Number: 35,174 Number of Days Open: 209 Average Number Per Day: 159
Total Number: 41,651 Number of Days Open: 229 Average Number Per Day: 182
11/06/2019 cbh
25
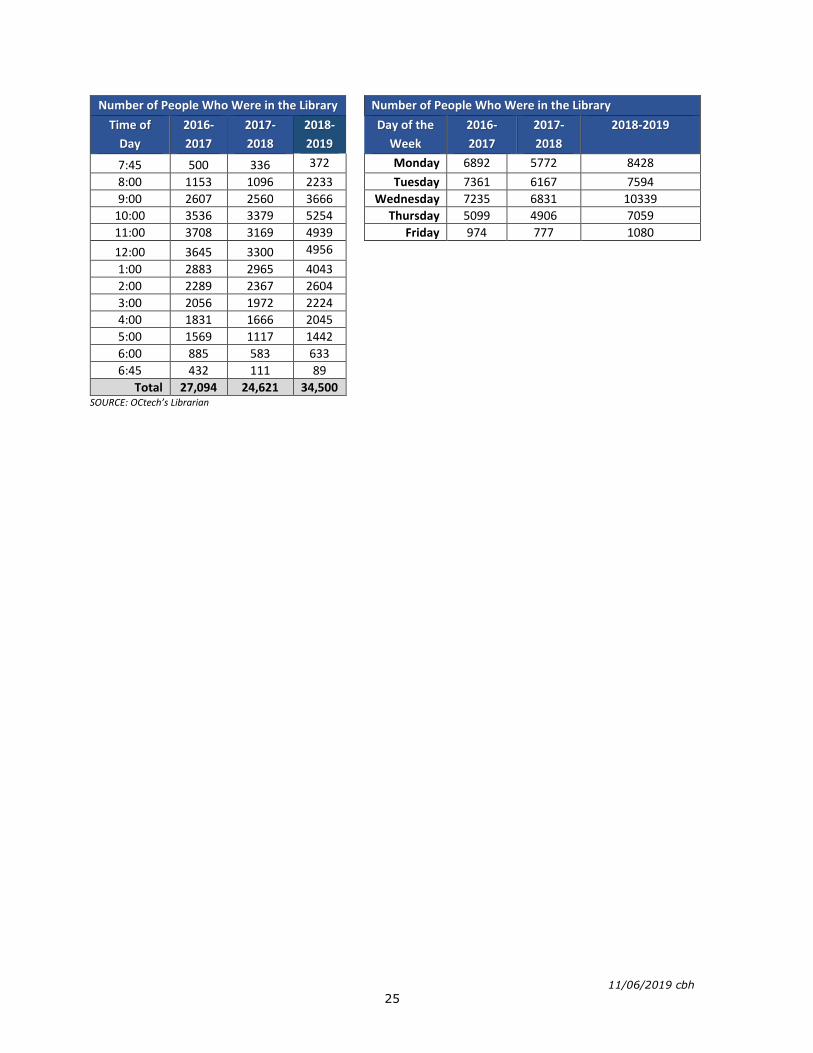
Number of People Who Were in the Library Number of People Who Were in the Library
Time of
Day
2016-
2017
2017-
2018
2018-
2019
Day of the
Week
2016-
2017
2017-
2018
2018-2019
7:45 500 336 372 Monday 6892 5772 8428
8:00 1153 1096 2233 Tuesday 7361 6167 7594
9:00 2607 2560 3666 Wednesday 7235 6831 10339
10:00 3536 3379 5254 Thursday 5099 4906 7059
11:00 3708 3169 4939 Friday 974 777 1080
12:00 3645 3300 4956
1:00 2883 2965 4043
2:00 2289 2367 2604
3:00 2056 1972 2224
4:00 1831 1666 2045
5:00 1569 1117 1442
6:00 885 583 633
6:45 432 111 89
Total 27,094 24,621 34,500 SOURCE: OCtech’s Librarian
11/06/2019 cbh
26
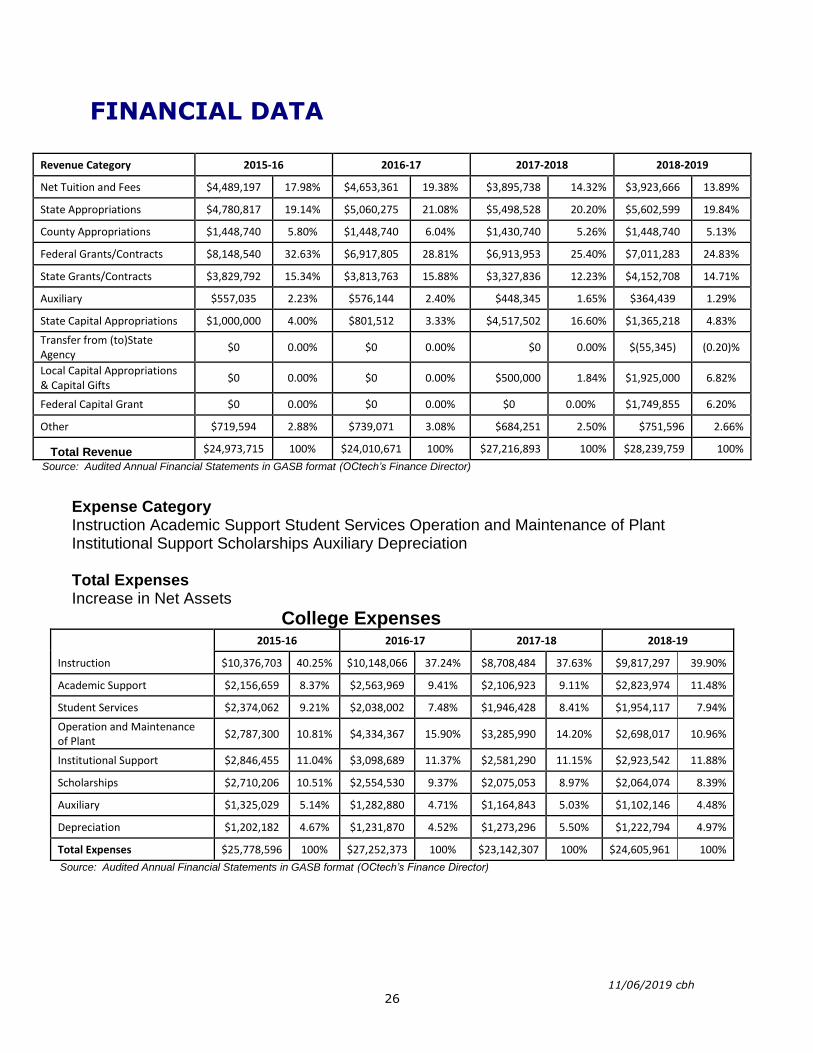
FINANCIAL DATA
Revenue Category 2015-16 2016-17 2017-2018 2018-2019
Net Tuition and Fees $4,489,197 17.98% $4,653,361 19.38% $3,895,738 14.32% $3,923,666 13.89%
State Appropriations $4,780,817 19.14% $5,060,275 21.08% $5,498,528 20.20% $5,602,599 19.84%
County Appropriations $1,448,740 5.80% $1,448,740 6.04% $1,430,740 5.26% $1,448,740 5.13%
Federal Grants/Contracts $8,148,540 32.63% $6,917,805 28.81% $6,913,953 25.40% $7,011,283 24.83%
State Grants/Contracts $3,829,792 15.34% $3,813,763 15.88% $3,327,836 12.23% $4,152,708 14.71%
Auxiliary $557,035 2.23% $576,144 2.40% $448,345 1.65% $364,439 1.29%
State Capital Appropriations $1,000,000 4.00% $801,512 3.33% $4,517,502 16.60% $1,365,218 4.83%
Transfer from (to)State Agency
$0 0.00% $0 0.00% $0 0.00% $(55,345) (0.20)%
Local Capital Appropriations & Capital Gifts
$0 0.00% $0 0.00% $500,000 1.84% $1,925,000 6.82%
Federal Capital Grant $0 0.00% $0 0.00% $0 0.00% $1,749,855 6.20%
Other $719,594 2.88% $739,071 3.08% $684,251 2.50% $751,596 2.66%
Total Revenue $24,973,715 100% $24,010,671 100% $27,216,893 100% $28,239,759 100%
Source: Audited Annual Financial Statements in GASB format (OCtech’s Finance Director)
Expense Category Instruction Academic Support Student Services Operation and Maintenance of Plant Institutional Support Scholarships Auxiliary Depreciation Total Expenses Increase in Net Assets
College Expenses
2015-16 2016-17 2017-18 2018-19
Instruction $10,376,703 40.25% $10,148,066 37.24% $8,708,484 37.63% $9,817,297 39.90%
Academic Support $2,156,659 8.37% $2,563,969 9.41% $2,106,923 9.11% $2,823,974 11.48%
Student Services $2,374,062 9.21% $2,038,002 7.48% $1,946,428 8.41% $1,954,117 7.94%
Operation and Maintenance of Plant
$2,787,300 10.81% $4,334,367 15.90% $3,285,990 14.20% $2,698,017 10.96%
Institutional Support $2,846,455 11.04% $3,098,689 11.37% $2,581,290 11.15% $2,923,542 11.88%
Scholarships $2,710,206 10.51% $2,554,530 9.37% $2,075,053 8.97% $2,064,074 8.39%
Auxiliary $1,325,029 5.14% $1,282,880 4.71% $1,164,843 5.03% $1,102,146 4.48%
Depreciation $1,202,182 4.67% $1,231,870 4.52% $1,273,296 5.50% $1,222,794 4.97%
Total Expenses $25,778,596 100% $27,252,373 100% $23,142,307 100% $24,605,961 100%
Source: Audited Annual Financial Statements in GASB format (OCtech’s Finance Director)

11/06/2019 cbh
27
Source: Audited Annual Financial Statements in GASB format (OCtech’s Finance Director)
Source: Audited Annual Financial Statements in GASB format (OCtech’s Finance Director)
13.89%
19.84%
5.13%
24.83%
14.71%
1.29%
4.83%
-0.20%
6.82% 6.20% 2.66%
2018-2019 College RevenuesNet Tuition and Fees
State Appropriations
County Appropriations
Federal Grants/Contracts
State Grants/Contracts
Auxiliary
State Capital Appropriations
Transfer from (to) State Agency
Local Capital Appropriations &Capital GiftsFederal Capital Grant
Other
$0
$2,000,000
$4,000,000
$6,000,000
$8,000,000
$10,000,000
$12,000,000
2015-2016 2016-17 2017-18 2018-19
College Expenditure Trends
Instruction Academic SupportStudent Services Operation and Maintenance of PlantInstitutional Support Scholarships
11/06/2019 cbh
28
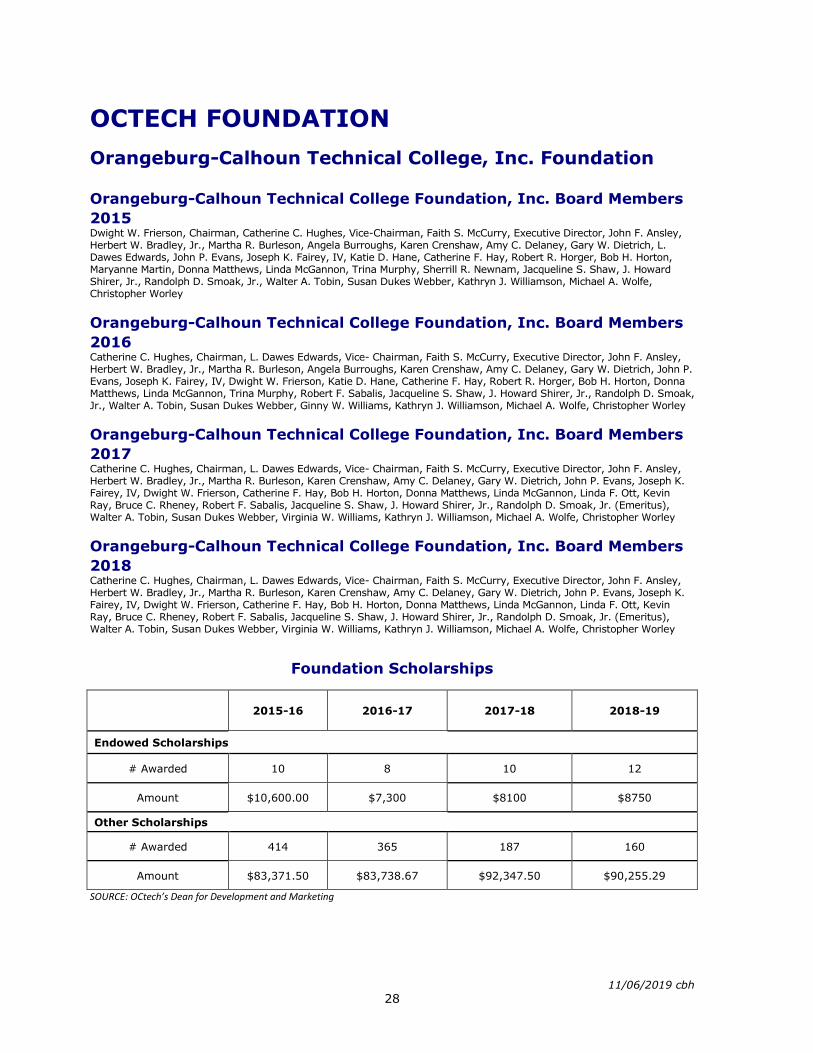
OCTECH FOUNDATION
Orangeburg-Calhoun Technical College, Inc. Foundation
Orangeburg-Calhoun Technical College Foundation, Inc. Board Members
2015 Dwight W. Frierson, Chairman, Catherine C. Hughes, Vice-Chairman, Faith S. McCurry, Executive Director, John F. Ansley, Herbert W. Bradley, Jr., Martha R. Burleson, Angela Burroughs, Karen Crenshaw, Amy C. Delaney, Gary W. Dietrich, L. Dawes Edwards, John P. Evans, Joseph K. Fairey, IV, Katie D. Hane, Catherine F. Hay, Robert R. Horger, Bob H. Horton, Maryanne Martin, Donna Matthews, Linda McGannon, Trina Murphy, Sherrill R. Newnam, Jacqueline S. Shaw, J. Howard Shirer, Jr., Randolph D. Smoak, Jr., Walter A. Tobin, Susan Dukes Webber, Kathryn J. Williamson, Michael A. Wolfe, Christopher Worley
Orangeburg-Calhoun Technical College Foundation, Inc. Board Members
2016 Catherine C. Hughes, Chairman, L. Dawes Edwards, Vice- Chairman, Faith S. McCurry, Executive Director, John F. Ansley, Herbert W. Bradley, Jr., Martha R. Burleson, Angela Burroughs, Karen Crenshaw, Amy C. Delaney, Gary W. Dietrich, John P. Evans, Joseph K. Fairey, IV, Dwight W. Frierson, Katie D. Hane, Catherine F. Hay, Robert R. Horger, Bob H. Horton, Donna Matthews, Linda McGannon, Trina Murphy, Robert F. Sabalis, Jacqueline S. Shaw, J. Howard Shirer, Jr., Randolph D. Smoak, Jr., Walter A. Tobin, Susan Dukes Webber, Ginny W. Williams, Kathryn J. Williamson, Michael A. Wolfe, Christopher Worley
Orangeburg-Calhoun Technical College Foundation, Inc. Board Members
2017 Catherine C. Hughes, Chairman, L. Dawes Edwards, Vice- Chairman, Faith S. McCurry, Executive Director, John F. Ansley, Herbert W. Bradley, Jr., Martha R. Burleson, Karen Crenshaw, Amy C. Delaney, Gary W. Dietrich, John P. Evans, Joseph K. Fairey, IV, Dwight W. Frierson, Catherine F. Hay, Bob H. Horton, Donna Matthews, Linda McGannon, Linda F. Ott, Kevin Ray, Bruce C. Rheney, Robert F. Sabalis, Jacqueline S. Shaw, J. Howard Shirer, Jr., Randolph D. Smoak, Jr. (Emeritus), Walter A. Tobin, Susan Dukes Webber, Virginia W. Williams, Kathryn J. Williamson, Michael A. Wolfe, Christopher Worley
Orangeburg-Calhoun Technical College Foundation, Inc. Board Members
2018 Catherine C. Hughes, Chairman, L. Dawes Edwards, Vice- Chairman, Faith S. McCurry, Executive Director, John F. Ansley, Herbert W. Bradley, Jr., Martha R. Burleson, Karen Crenshaw, Amy C. Delaney, Gary W. Dietrich, John P. Evans, Joseph K. Fairey, IV, Dwight W. Frierson, Catherine F. Hay, Bob H. Horton, Donna Matthews, Linda McGannon, Linda F. Ott, Kevin Ray, Bruce C. Rheney, Robert F. Sabalis, Jacqueline S. Shaw, J. Howard Shirer, Jr., Randolph D. Smoak, Jr. (Emeritus), Walter A. Tobin, Susan Dukes Webber, Virginia W. Williams, Kathryn J. Williamson, Michael A. Wolfe, Christopher Worley
Foundation Scholarships
2015-16 2016-17 2017-18 2018-19
Endowed Scholarships
# Awarded 10 8 10 12
Amount $10,600.00 $7,300 $8100 $8750
Other Scholarships
# Awarded 414 365 187 160
Amount $83,371.50 $83,738.67 $92,347.50 $90,255.29
SOURCE: OCtech’s Dean for Development and Marketing

11/06/2019 cbh
29
SOURCE: OCtech’s Dean for Development and Marketing
SOURCE: OCtech’s Dean for Development and Marketing
10 8 10 12
414
365
187160
0255075
100125150175200225250275300325350375400425450
2015-2016 2016-2017 2017-2018 2018-19
Endowed Scholarships Other Scholarships
OCtech Foundation
$10,600.00 $7,300.00 $8,100.00 $8,750
$83,371.50 $83,738.67
$92,347.50 $90,255.29
$0.00
$20,000.00
$40,000.00
$60,000.00
$80,000.00
$100,000.00
2015-2016 2016-2017 2017-2018 2018-19
Endowed Scholarships Other Scholarships
Foundations Scholarships Awarded (by dollar amount)

11/06/2019 cbh
30
CONTINUING EDUCATION
2014-15 2015-16 2017-18 2018-19
Contact Hours
Contact Hours 14,851 20,286 27,328 25071
Headcount
Headcount 1,242 1,152 1,442 1118
National Certifications Awarded
495 804 348 887
Students Participating in Internships and Apprenticeships
15 8 15 27
Number of Businesses and Industries Served
22 27 25 27
Numbers of Clients Trained (not including assessments)
652 750 673 721
SOURCE: OCtech’s Dean of Corporate Training and Economic Development
Industries/Businesses Served Last Year
1. GKN Aerospace 2. Husqvarna
3. City of Orangeburg 4. DAK Americas 5. Gulbrandsen 6. SCE&G 7. Bimbo Bakeries
8. Zeus Industrial Products 9. Devro 10. The Okonite Company 11. SI Group 12. Santee Cooper 13. South Carolina Department of Employment & Workforce
14. Lower Savannah Council of Governments 15. South Carolina Department of Social Services 16. South Carolina Vocational Rehabilitation Department 17. Zeus
18. South Carolina Department of Education 19. Mayer Industries 20. South Carolina Department of Transportation
21. South Carolina Bar Association 22. Whitman Mold 23. Orangeburg County 24. Starbucks 25. Volvo 26. Telamon Corporation 27. The SEFA Group

11/06/2019 cbh
31
National Certifications (2018 - 2019)
2018FC OSHA 37 MSSC 40
NCCER 80 Total 157 2019SC OSHA 49 MSSC 0 NCCER 4
Total 53 2019SUC OSHA 44 MSSC 20 NCCER 158
Total 222 National Career Readiness Certificates (2018 – 2019):
TABLE 3.4.2-B
Total ACT Career Ready Certificates Earned Through OCtech CTD
Computer Based Testing
in 2014-15 Computer Based Testing in
2015-16 Computer Based Testing in
2018 - 2019
Bronze Career Ready Certificates Earned
104 51 101
Silver Career Ready Certificates Earned
212 141 152
Gold Career Ready Certificates Earned
52 45 125
Platinum Career Ready Certificates Earned
1 0 77
Total CRC Certificates
369 237 455
SOURCE: OCtech’s Dean of Corporate Training and Economic Development