ey - us oil and gas reserves study 2017file/ey-us-oil-and-gas-reserves-study-2017.pdfus oil and gas...
TRANSCRIPT

US oil and gas reserves study2017
2 | US oil and gas reserves study
Table of contentsStudy overview 1
Industry backdrop and study highlights 2
Capital expenditures 4
Revenues and results of operations 5
Oil reserves 7
Gas reserves 9
Performance measures
Provedreserveacquisitioncosts,findinganddevelopment 10 costs and reserve replacement costs
Production replacement rates 11
Production costs 13
Company statistics 14
Peer groups 26
Appendix 27
Contacts 29
1US oil and gas reserves study |
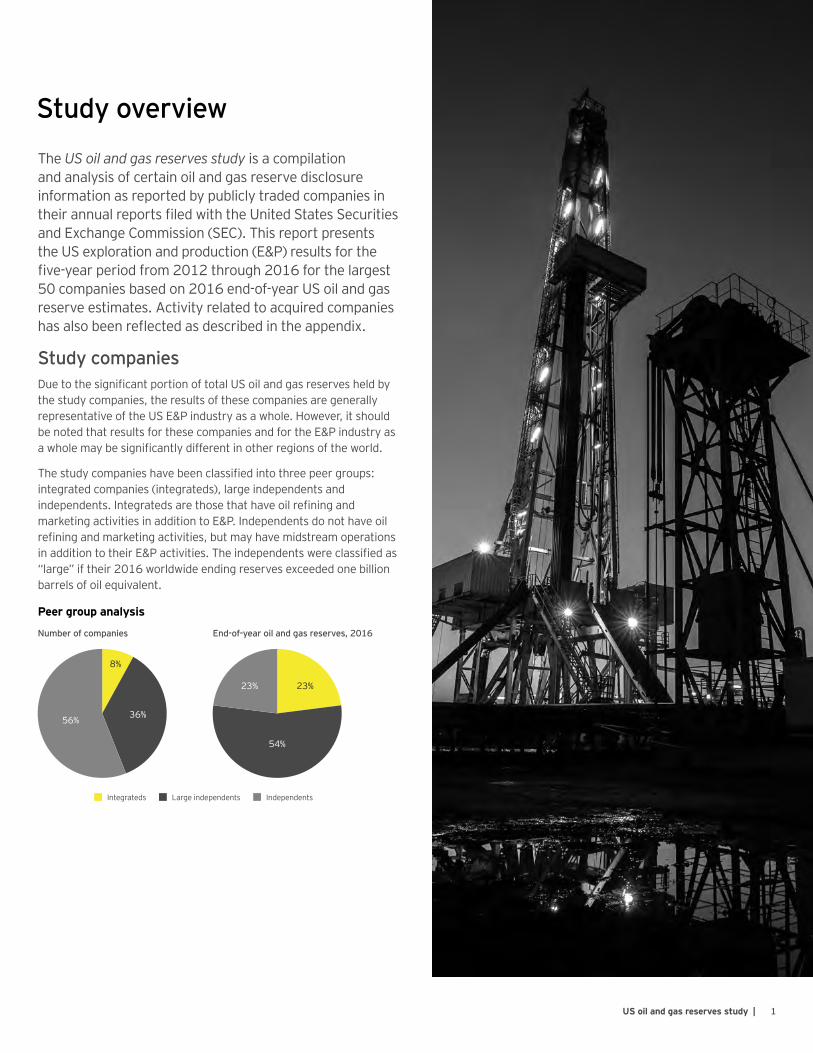
The US oil and gas reserves study is a compilation and analysis of certain oil and gas reserve disclosure information as reported by publicly traded companies in theirannualreportsfiledwiththeUnitedStatesSecuritiesand Exchange Commission (SEC). This report presents theUSexplorationandproduction(E&P)resultsforthefive-yearperiodfrom2012through2016forthelargest50companiesbasedon2016end-of-yearUSoilandgasreserve estimates. Activity related to acquired companies hasalsobeenreflectedasdescribedintheappendix.
Study companiesDuetothesignificantportionoftotalUSoilandgasreservesheldbythe study companies, the results of these companies are generally representativeoftheUSE&Pindustryasawhole.However,itshouldbenotedthatresultsforthesecompaniesandfortheE&Pindustryasawholemaybesignificantlydifferentinotherregionsoftheworld.
Thestudycompanieshavebeenclassifiedintothreepeergroups:integrated companies (integrateds), large independents and independents.IntegratedsarethosethathaveoilrefiningandmarketingactivitiesinadditiontoE&P.Independentsdonothaveoilrefiningandmarketingactivities,butmayhavemidstreamoperationsinadditiontotheirE&Pactivities.Theindependentswereclassifiedas“large”iftheir2016worldwideendingreservesexceededonebillionbarrels of oil equivalent.
Study overview
Peer group analysis
End-of-year oil and gas reserves, 2016
23%23%
54%
Number of companies
8%
36%56%
Integrateds Large independents Independents
2 | US oil and gas reserves study
Industry backdrop and study highlights
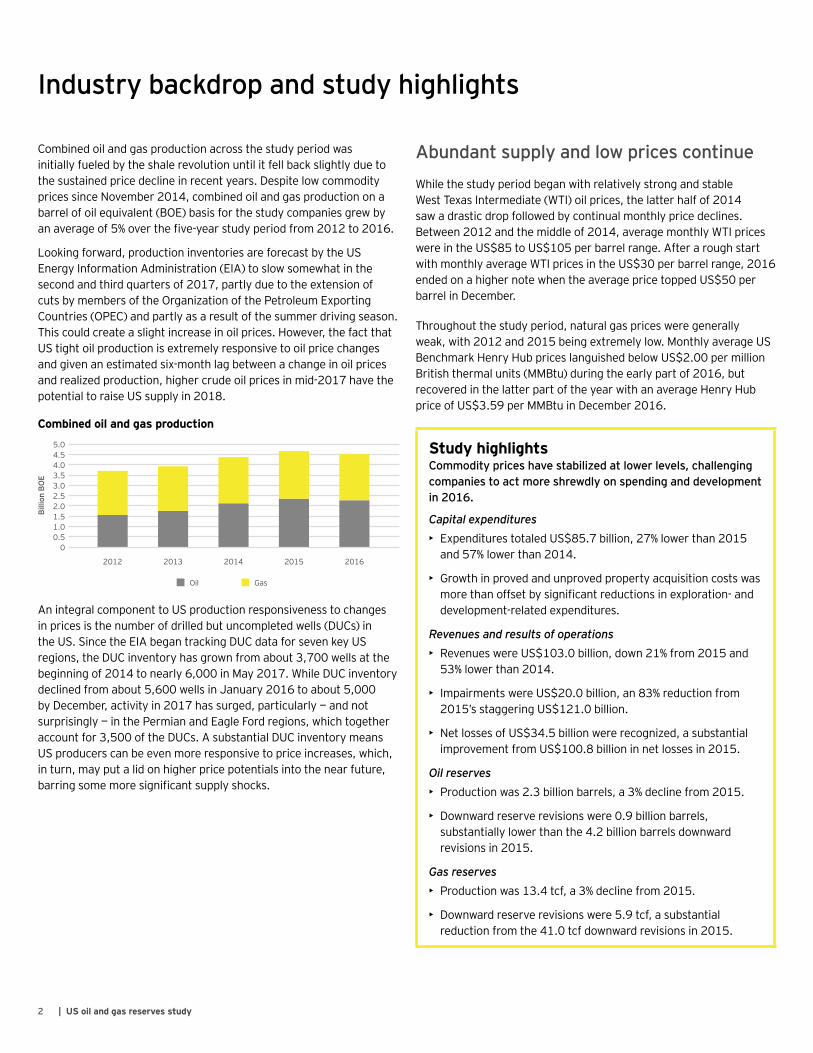
Combined oil and gas production across the study period was initially fueled by the shale revolution until it fell back slightly due to the sustained price decline in recent years. Despite low commodity pricessinceNovember2014,combinedoilandgasproductiononabarrel of oil equivalent (BOE) basis for the study companies grew by anaverageof5%overthefive-yearstudyperiodfrom2012to2016.
Lookingforward,productioninventoriesareforecastbytheUSEnergy Information Administration (EIA) to slow somewhat in the secondandthirdquartersof2017,partlyduetotheextensionofcuts by members of the Organization of the Petroleum Exporting Countries (OPEC) and partly as a result of the summer driving season. Thiscouldcreateaslightincreaseinoilprices.However,thefactthatUStightoilproductionisextremelyresponsivetooilpricechangesandgivenanestimatedsix-monthlagbetweenachangeinoilpricesandrealizedproduction,highercrudeoilpricesinmid-2017havethepotentialtoraiseUSsupplyin2018.
Abundant supply and low prices continue While the study period began with relatively strong and stable WestTexasIntermediate(WTI)oilprices,thelatterhalfof2014saw a drastic drop followed by continual monthly price declines. Between2012andthemiddleof2014,averagemonthlyWTIpriceswereintheUS$85toUS$105perbarrelrange.AfteraroughstartwithmonthlyaverageWTIpricesintheUS$30perbarrelrange,2016endedonahighernotewhentheaveragepricetoppedUS$50perbarrel in December.
Throughout the study period, natural gas prices were generally weak,with2012and2015beingextremelylow.MonthlyaverageUSBenchmarkHenryHubpriceslanguishedbelowUS$2.00permillionBritishthermalunits(MMBtu)duringtheearlypartof2016,butrecoveredinthelatterpartoftheyearwithanaverageHenryHubpriceofUS$3.59perMMBtuinDecember2016.
Study highlights Commodity prices have stabilized at lower levels, challenging companies to act more shrewdly on spending and development in 2016.
Capital expenditures• ExpenditurestotaledUS$85.7billion,27%lowerthan2015
and57%lowerthan2014.
• Growth in proved and unproved property acquisition costs was morethanoffsetbysignificantreductionsinexploration-anddevelopment-relatedexpenditures.
Revenues and results of operations• RevenueswereUS$103.0billion,down21%from2015and
53%lowerthan2014.
• ImpairmentswereUS$20.0billion,an83%reductionfrom2015’sstaggeringUS$121.0billion.
• NetlossesofUS$34.5billionwererecognized,asubstantialimprovementfromUS$100.8billioninnetlossesin2015.
Oil reserves• Productionwas2.3billionbarrels,a3%declinefrom2015.
• Downwardreserverevisionswere0.9billionbarrels,substantially lower than the 4.2 billion barrels downward revisionsin2015.
Gas reserves• Productionwas13.4tcf,a3%declinefrom2015.
• Downward reserve revisions were 5.9 tcf, a substantial reductionfromthe41.0tcfdownwardrevisionsin2015.
Oil Gas
2014 20152013
Combined oil and gas production
Billi
on B
OE
5.04.54.03.53.02.52.01.51.00.5
0
2012 2016
AnintegralcomponenttoUSproductionresponsivenesstochangesinpricesisthenumberofdrilledbutuncompletedwells(DUCs)intheUS.SincetheEIAbegantrackingDUCdataforsevenkeyUSregions,theDUCinventoryhasgrownfromabout3,700wellsatthebeginningof2014tonearly6,000inMay2017.WhileDUCinventorydeclinedfromabout5,600wellsinJanuary2016toabout5,000byDecember,activityin2017hassurged,particularly—andnotsurprisingly—inthePermianandEagleFordregions,whichtogetheraccountfor3,500oftheDUCs.AsubstantialDUCinventorymeansUSproducerscanbeevenmoreresponsivetopriceincreases,which,in turn, may put a lid on higher price potentials into the near future, barringsomemoresignificantsupplyshocks.
3US oil and gas reserves study |
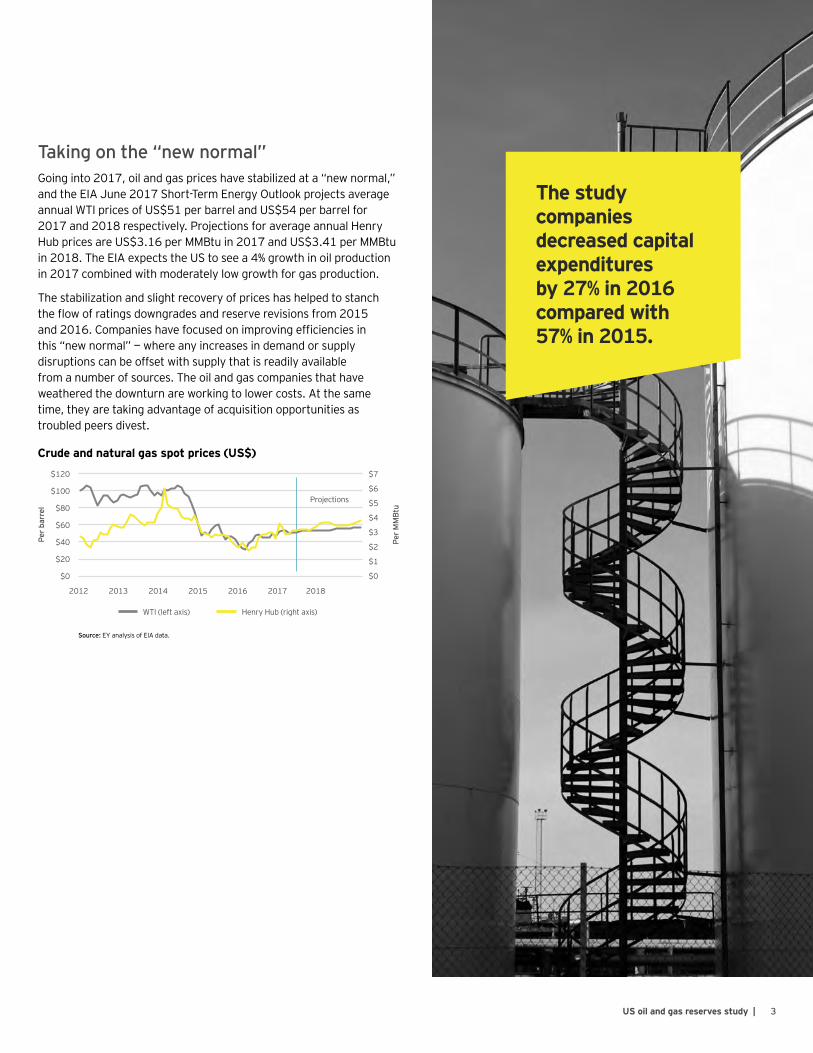
The study companies decreased capital expenditures by 27% in 2016 compared with 57% in 2015.
Taking on the “new normal”Goinginto2017,oilandgaspriceshavestabilizedata“newnormal,”andtheEIAJune2017Short-TermEnergyOutlookprojectsaverageannualWTIpricesofUS$51perbarrelandUS$54perbarrelfor2017and2018respectively.ProjectionsforaverageannualHenryHubpricesareUS$3.16perMMBtuin2017andUS$3.41perMMBtuin2018.TheEIAexpectstheUStoseea4%growthinoilproductionin2017combinedwithmoderatelylowgrowthforgasproduction.
The stabilization and slight recovery of prices has helped to stanch theflowofratingsdowngradesandreserverevisionsfrom2015and2016.Companieshavefocusedonimprovingefficienciesinthis“newnormal”—whereanyincreasesindemandorsupplydisruptions can be offset with supply that is readily available from a number of sources. The oil and gas companies that have weathered the downturn are working to lower costs. At the same time, they are taking advantage of acquisition opportunities as troubled peers divest.
Crude and natural gas spot prices (US$)
Per b
arre
l
$120
$100
$80
$60
$40
$20
$0
2012 2013 2014 20162015 2018
Per M
MBt
u
$3
$4
$5
$6
$7
$2
$1
$0
HenryHub(rightaxis)WTI (left axis)
Source: EY analysis of EIA data.
2017
Projections
4 | US oil and gas reserves study
Capital expenditures
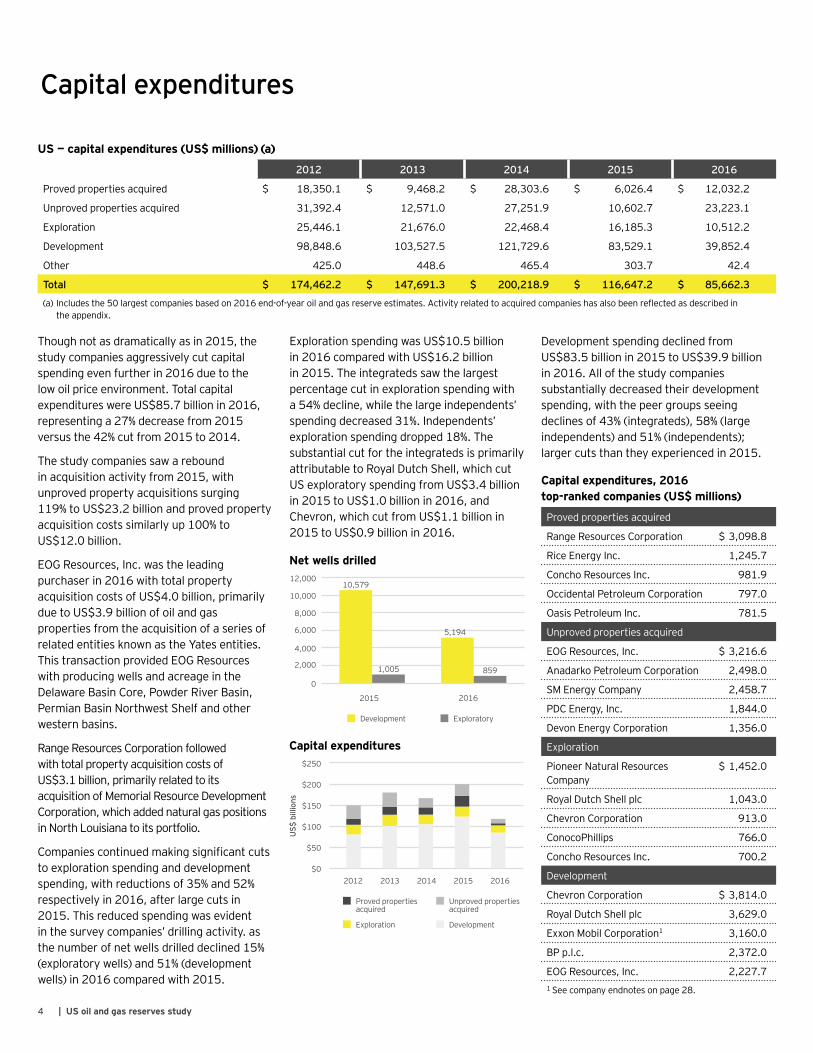
US — capital expenditures (US$ millions) (a)
2012 2013 2014 2015 2016
Proved properties acquired $ 18,350.1 $ 9,468.2 $ 28,303.6 $ 6,026.4 $ 12,032.2
Unprovedpropertiesacquired 31,392.4 12,571.0 27,251.9 10,602.7 23,223.1
Exploration 25,446.1 21,676.0 22,468.4 16,185.3 10,512.2
Development 98,848.6 103,527.5 121,729.6 83,529.1 39,852.4
Other 425.0 448.6 465.4 303.7 42.4
Total $ 174,462.2 $ 147,691.3 $ 200,218.9 $ 116,647.2 $ 85,662.3
(a)Includesthe50largestcompaniesbasedon2016end-of-yearoilandgasreserveestimates.Activityrelatedtoacquiredcompanieshasalsobeenreflectedasdescribedinthe appendix.
Thoughnotasdramaticallyasin2015,thestudy companies aggressively cut capital spendingevenfurtherin2016duetothelow oil price environment. Total capital expenditureswereUS$85.7billionin2016,representinga27%decreasefrom2015versusthe42%cutfrom2015to2014.
The study companies saw a rebound inacquisitionactivityfrom2015,withunproved property acquisitions surging 119%toUS$23.2billionandprovedpropertyacquisitioncostssimilarlyup100%toUS$12.0billion.
EOG Resources, Inc. was the leading purchaserin2016withtotalpropertyacquisitioncostsofUS$4.0billion,primarilyduetoUS$3.9billionofoilandgasproperties from the acquisition of a series of related entities known as the Yates entities. This transaction provided EOG Resources with producing wells and acreage in the Delaware Basin Core, Powder River Basin, Permian Basin Northwest Shelf and other western basins.
Range Resources Corporation followed with total property acquisition costs of US$3.1billion,primarilyrelatedtoitsacquisitionofMemorialResourceDevelopmentCorporation, which added natural gas positions in North Louisiana to its portfolio.
Companiescontinuedmakingsignificantcutsto exploration spending and development spending, with reductions of 35% and 52% respectivelyin2016,afterlargecutsin2015.Thisreducedspendingwasevidentinthesurveycompanies’drillingactivity.asthe number of net wells drilled declined 15% (exploratory wells) and 51% (development wells)in2016comparedwith2015.
ExplorationspendingwasUS$10.5billionin2016comparedwithUS$16.2billionin2015.Theintegratedssawthelargestpercentage cut in exploration spending with a54%decline,whilethelargeindependents’spendingdecreased31%.Independents’exploration spending dropped 18%. The substantial cut for the integrateds is primarily attributable to Royal Dutch Shell, which cut USexploratoryspendingfromUS$3.4billionin2015toUS$1.0billionin2016,andChevron,whichcutfromUS$1.1billionin2015toUS$0.9billionin2016.
Capital expenditures, 2016top-ranked companies (US$ millions)
Proved properties acquired
Range Resources Corporation $3,098.8
Rice Energy Inc. 1,245.7
Concho Resources Inc. 981.9
Occidental Petroleum Corporation 797.0
Oasis Petroleum Inc. 781.5
Unprovedpropertiesacquired
EOG Resources, Inc. $3,216.6
Anadarko Petroleum Corporation 2,498.0
SMEnergyCompany 2,458.7
PDC Energy, Inc. 1,844.0
Devon Energy Corporation 1,356.0
Exploration
Pioneer Natural Resources Company
$1,452.0
Royal Dutch Shell plc 1,043.0
Chevron Corporation 913.0
ConocoPhillips 766.0
Concho Resources Inc. 700.2
Development
Chevron Corporation $3,814.0
Royal Dutch Shell plc 3,629.0
ExxonMobilCorporation1 3,160.0
BP p.l.c. 2,372.0
EOG Resources, Inc. 2,227.7 1 See company endnotes on page 28.
Development spending declined from US$83.5billionin2015toUS$39.9billionin2016.Allofthestudycompaniessubstantially decreased their development spending, with the peer groups seeing declines of 43% (integrateds), 58% (large independents) and 51% (independents); largercutsthantheyexperiencedin2015.
Capital expenditures
US$
bill
ions
$0
$50
$100
$150
$250
$200
Proved properties acquired
Exploration
Unprovedpropertiesacquired
Development
2015 20162012 2013 2014
Development Exploratory
Net wells drilled
2015
0
4,000
2,000
6,000
8,000
10,000
12,00010,579
2016
5,194
8591,005
5US oil and gas reserves study |
Revenues and results of operations
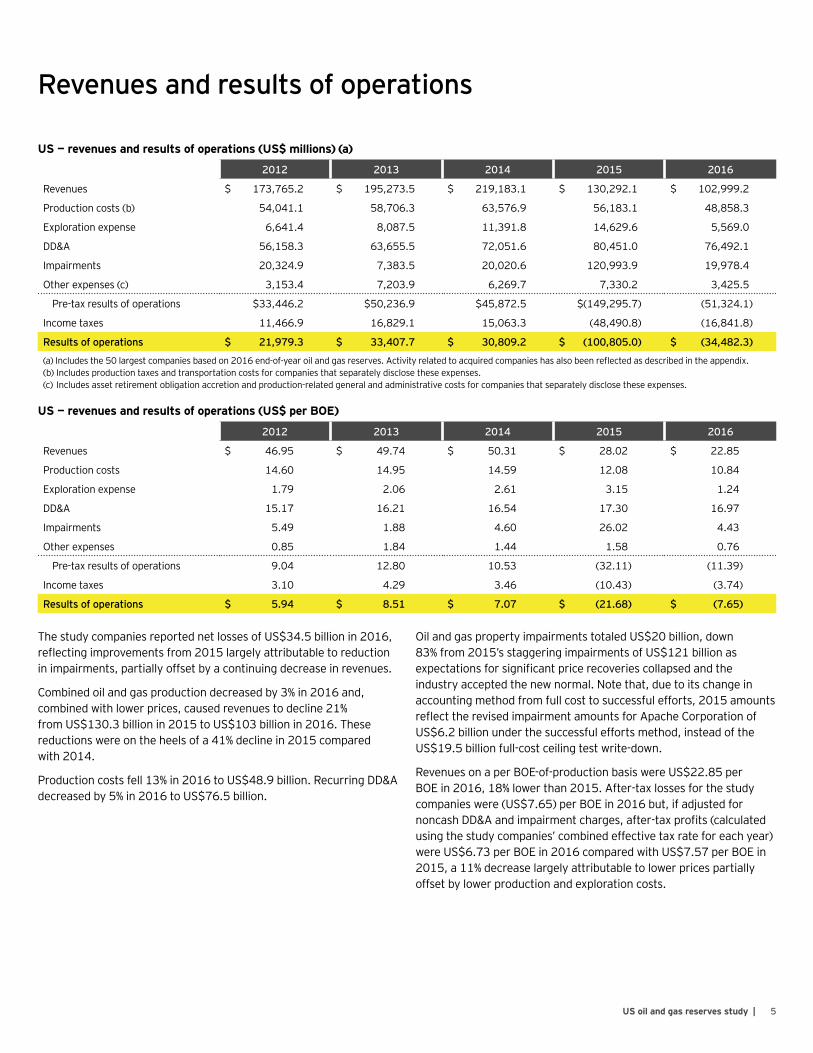
2012 2013 2014 2015 2016
Revenues $ 173,765.2 $ 195,273.5 $ 219,183.1 $ 130,292.1 $ 102,999.2
Production costs (b) 54,041.1 58,706.3 63,576.9 56,183.1 48,858.3
Exploration expense 6,641.4 8,087.5 11,391.8 14,629.6 5,569.0
DD&A 56,158.3 63,655.5 72,051.6 80,451.0 76,492.1
Impairments 20,324.9 7,383.5 20,020.6 120,993.9 19,978.4
Other expenses (c) 3,153.4 7,203.9 6,269.7 7,330.2 3,425.5
Pre-taxresultsofoperations $33,446.2 $50,236.9 $45,872.5 $(149,295.7) (51,324.1)
Income taxes 11,466.9 16,829.1 15,063.3 (48,490.8) (16,841.8)
Results of operations $ 21,979.3 $ 33,407.7 $ 30,809.2 $ (100,805.0) $ (34,482.3)
(a)Includesthe50largestcompaniesbasedon2016end-of-yearoilandgasreserves.Activityrelatedtoacquiredcompanieshasalsobeenreflectedasdescribedintheappendix.(b) Includes production taxes and transportation costs for companies that separately disclose these expenses.(c) Includesassetretirementobligationaccretionandproduction-relatedgeneralandadministrativecostsforcompaniesthatseparatelydisclosetheseexpenses.
US — revenues and results of operations (US$ millions) (a)
2012 2013 2014 2015 2016
Revenues $ 46.95 $ 49.74 $ 50.31 $ 28.02 $ 22.85
Production costs 14.60 14.95 14.59 12.08 10.84
Exploration expense 1.79 2.06 2.61 3.15 1.24
DD&A 15.17 16.21 16.54 17.30 16.97
Impairments 5.49 1.88 4.60 26.02 4.43
Other expenses 0.85 1.84 1.44 1.58 0.76
Pre-taxresultsofoperations 9.04 12.80 10.53 (32.11) (11.39)
Income taxes 3.10 4.29 3.46 (10.43) (3.74)
Results of operations $ 5.94 $ 8.51 $ 7.07 $ (21.68) $ (7.65)
US — revenues and results of operations (US$ per BOE)
ThestudycompaniesreportednetlossesofUS$34.5billionin2016,reflectingimprovementsfrom2015largelyattributabletoreductionin impairments, partially offset by a continuing decrease in revenues.
Combinedoilandgasproductiondecreasedby3%in2016and,combined with lower prices, caused revenues to decline 21% fromUS$130.3billionin2015toUS$103billionin2016.Thesereductionswereontheheelsofa41%declinein2015comparedwith2014.
Productioncostsfell13%in2016toUS$48.9billion.RecurringDD&Adecreasedby5%in2016toUS$76.5billion.
OilandgaspropertyimpairmentstotaledUS$20billion,down83%from2015’sstaggeringimpairmentsofUS$121billionasexpectationsforsignificantpricerecoveriescollapsedandtheindustry accepted the new normal. Note that, due to its change in accountingmethodfromfullcosttosuccessfulefforts,2015amountsreflecttherevisedimpairmentamountsforApacheCorporationofUS$6.2billionunderthesuccessfuleffortsmethod,insteadoftheUS$19.5billionfull-costceilingtestwrite-down.
RevenuesonaperBOE-of-productionbasiswereUS$22.85perBOEin2016,18%lowerthan2015.After-taxlossesforthestudycompanieswere(US$7.65)perBOEin2016but,ifadjustedfornoncashDD&Aandimpairmentcharges,after-taxprofits(calculatedusingthestudycompanies’combinedeffectivetaxrateforeachyear)wereUS$6.73perBOEin2016comparedwithUS$7.57perBOEin2015,a11%decreaselargelyattributabletolowerpricespartiallyoffset by lower production and exploration costs.
6 | US oil and gas reserves study
Revenues and results of operations
$0
$250
$200
$150$100$50
$(50)$(100)$(150)
US$
bill
ions
US$
per
BO
E
$60$50$40$30$20$10$0$(10)$(20)$(30)
2012 2013 2014 2015 2016
Net income per BOE (right axis) Revenue per BOE (right axis)
Revenues (left axis) Net income (left axis)
Thestudycompaniesposteda158%plowbackpercentagein2016,whilethefive-yearaveragewas132%.Theplowbackpercentagerepresents total capital expenditures as a percentage of netback (revenues less production costs). Independents posted the highestplowbackpercentagewitha2016rateof186%.Thelargeindependents had a rate of 149%, while the integrateds followed closely at 141%.
Plowback percentage250%
200%
150%
100%
50%
0%
2012 2013 2015 20162014
Integrateds IndependentsLarge independents
7US oil and gas reserves study |
Oil reserves
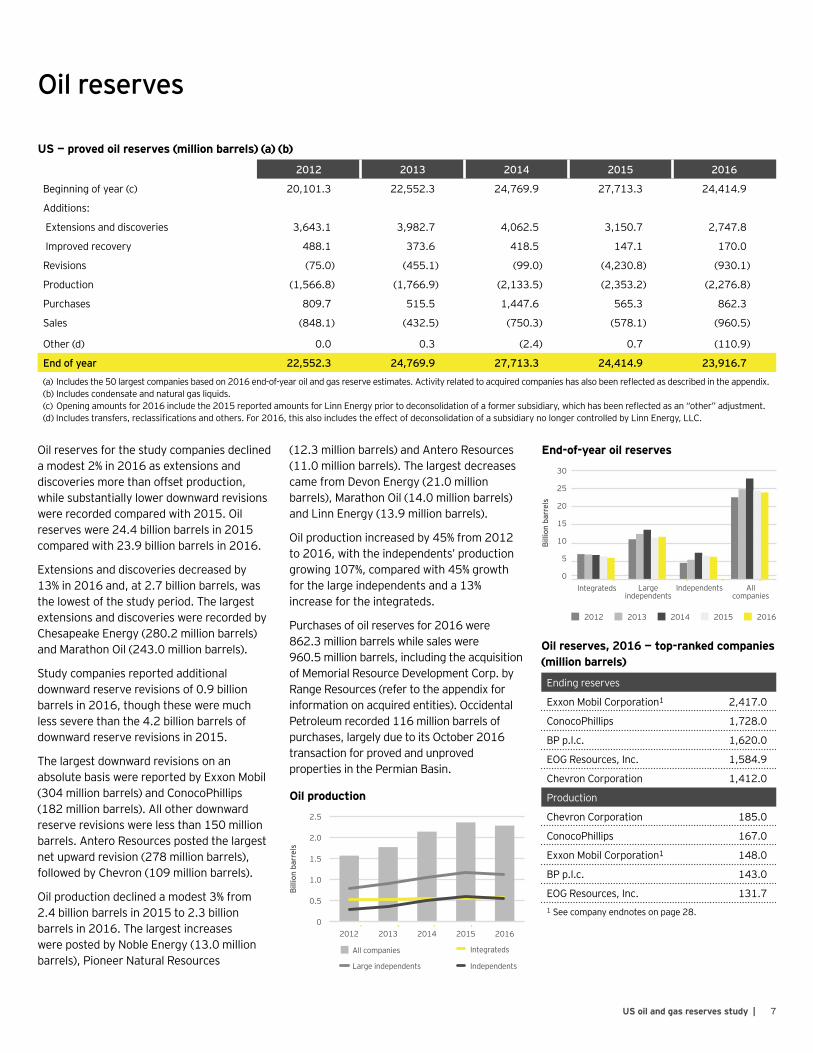
US — proved oil reserves (million barrels) (a) (b)
2012 2013 2014 2015 2016
Beginning of year (c) 20,101.3 22,552.3 24,769.9 27,713.3 24,414.9
Additions:
Extensions and discoveries 3,643.1 3,982.7 4,062.5 3,150.7 2,747.8
Improved recovery 488.1 373.6 418.5 147.1 170.0
Revisions (75.0) (455.1) (99.0) (4,230.8) (930.1)
Production (1,566.8) (1,766.9) (2,133.5) (2,353.2) (2,276.8)
Purchases 809.7 515.5 1,447.6 565.3 862.3
Sales (848.1) (432.5) (750.3) (578.1) (960.5)
Other (d) 0.0 0.3 (2.4) 0.7 (110.9)
End of year 22,552.3 24,769.9 27,713.3 24,414.9 23,916.7
(a) Includesthe50largestcompaniesbasedon2016end-of-yearoilandgasreserveestimates.Activityrelatedtoacquiredcompanieshasalsobeenreflectedasdescribedintheappendix.(b) Includes condensate and natural gas liquids.(c)Openingamountsfor2016includethe2015reportedamountsforLinnEnergypriortodeconsolidationofaformersubsidiary,whichhasbeenreflectedasan“other”adjustment.(d)Includestransfers,reclassificationsandothers.For2016,thisalsoincludestheeffectofdeconsolidationofasubsidiarynolongercontrolledbyLinnEnergy,LLC.
Oil reserves for the study companies declined amodest2%in2016asextensionsanddiscoveries more than offset production, while substantially lower downward revisions wererecordedcomparedwith2015.Oilreserveswere24.4billionbarrelsin2015comparedwith23.9billionbarrelsin2016.
Extensions and discoveries decreased by 13%in2016and,at2.7billionbarrels,wasthe lowest of the study period. The largest extensions and discoveries were recorded by ChesapeakeEnergy(280.2millionbarrels)andMarathonOil(243.0millionbarrels).
Study companies reported additional downwardreserverevisionsof0.9billionbarrelsin2016,thoughtheseweremuchless severe than the 4.2 billion barrels of downwardreserverevisionsin2015.
The largest downward revisions on an absolutebasiswerereportedbyExxonMobil(304millionbarrels)andConocoPhillips(182 million barrels). All other downward reserverevisionswerelessthan150millionbarrels. Antero Resources posted the largest net upward revision (278 million barrels), followedbyChevron(109millionbarrels).
Oil production declined a modest 3% from 2.4billionbarrelsin2015to2.3billionbarrelsin2016.ThelargestincreaseswerepostedbyNobleEnergy(13.0millionbarrels), Pioneer Natural Resources
(12.3 million barrels) and Antero Resources (11.0millionbarrels).ThelargestdecreasescamefromDevonEnergy(21.0millionbarrels),MarathonOil(14.0millionbarrels)and Linn Energy (13.9 million barrels).
Oilproductionincreasedby45%from2012to2016,withtheindependents’productiongrowing107%,comparedwith45%growthfor the large independents and a 13% increase for the integrateds.
Purchasesofoilreservesfor2016were862.3 million barrels while sales were 960.5millionbarrels,includingtheacquisitionofMemorialResourceDevelopmentCorp.byRange Resources (refer to the appendix for information on acquired entities). Occidental Petroleum recorded 116 million barrels of purchases,largelyduetoitsOctober2016transaction for proved and unproved properties in the Permian Basin.
Oil reserves, 2016 — top-ranked companies (million barrels)
Ending reserves
ExxonMobilCorporation1 2,417.0
ConocoPhillips 1,728.0
BP p.l.c. 1,620.0
EOG Resources, Inc. 1,584.9
Chevron Corporation 1,412.0
Production
Chevron Corporation 185.0
ConocoPhillips 167.0
ExxonMobilCorporation1 148.0
BP p.l.c. 143.0
EOG Resources, Inc. 131.7 1 See company endnotes on page 28.
Billi
on b
arre
ls
Oil production
0
0.5
1.0
1.5
2.5
2.0
2012 2013 2014 2015 2016
All companies Integrateds
IndependentsLarge independents
Integrateds Large independents
All companies
Independents
End-of-year oil reserves
0
10
5
15
20
30
Billi
on b
arre
ls
25
2012 2013 2014 2015 2016
Oil and gas production for the study companies decreased by 3% in 2016.

9US oil and gas reserves study |
End-of-yeargasreservesforthestudycompaniesshedamere1%in2016to148tcf,comparedwitha21%dropin2015largelyduetosignificantdownwardreserverevisions.In2016,extensionsanddiscoverieswererelativelyflat,at18.8tcf,andlargelyoffsetproductionand smaller downward reserve revisions.
EQT Corporation (2.2 tcf), Antero Resources (2.0tcf),ChesapeakeEnergy(1.8tcf)andRiceEnergy (1.7 tcf) posted the largest extensions and discoveries.
Study companies recorded more than 74.5 tcf of net downward reserve revisions from 2012through2016,concentratedprimarilyina41.0tcfreductionrecordedin2015.Downwardrevisionsin2016were5.9tcf.While large independents experienced the most net downward revision of 3.2 tcf (or 4% ofbeginning-of-yearreserves),integratedsexperienced the largest reduction as a percentageofbeginning-of-yearreserves(6%,or2.0tcf).Independentsexperiencedthesmallestdownwardrevisionsoverall(0.8tcf,or2%ofbeginning-of-yearreserves).
AnteroResources(2.1tcf),BHPBilliton(1.6tcf)andExxonMobil(1.6tcf)recordedthelargestdownwardrevisionsin2016onanabsolute basis. A larger number of companies postednetpositiverevisionsin2016thanin2015,withChesapeakeEnergy(0.6tcf)andDevonEnergy(0.5tcf)recognizingthelargest increases on an absolute basis.
Gas production decreased 3% from 13.8tcfin2015to13.4tcfin2016.Thelargest declines were split between WPX Energy (158.4 bcf), Southwestern Energy (111.0bcf)andConocoPhillips(104.0bcf).These were offset by increases, led by EQT (139.0bcf)andRiceEnergy(103.1bcf).
From2012to2016,thelargeindependentsled the way and increased production by 15%. The integrateds decreased by 13%; independents by 3%.
Purchases of gas reserves were 7.9 tcf in 2016,ledbyEQT(2.3tcf,includingseveraltransactionsintheMarcellusregion),CONSOLEnergy(1.4tcf),RangeResources(0.9tcf,includingitsacquisitionofMemorialResourceDevelopment*)andRiceEnergy(0.9tcf).
Salesofgasreserveswere9.7tcfin2016,includingtheacquisitionofMemorialResourcesDevelopment (1.4 tcf) by Range Resources.* Theothermostsignificantsaleswerereportedby WPX Energy (1.5 tcf), Anadarko Petroleum (1.3 tcf) and Chesapeake Energy (1.2 tcf).
Gas reserves
US — proved gas reserves (Bcf) (a)
2012 2013 2014 2015 2016
Beginning of year (b) 175,887.1 159,993.1 174,270.1 189,134.6 150,107.1
Additions:
Extensions and discoveries 24,315.6 28,844.2 29,218.3 18,772.3 18,762.4
Improved recovery 1,257.3 945.4 982.0 557.8 609.0
Revisions (26,501.9) (269.3) (879.8) (41,024.4) (5,890.3)
Production (12,805.3) (12,953.4) (13,340.0) (13,778.1) (13,384.8)
Purchases 7,177.9 1,667.1 8,151.9 2,115.9 7,916.2
Sales (9,337.7) (3,957.0) (9,266.8) (5,670.0) (9,685.5)
Other (c) 0.0 0.0 (0.9) (1.1) (388.0)
End of year 159,993.1 174,270.1 189,134.6 150,107.1 148,046.0
(a)Includesthe50largestcompaniesbasedon2016end-of-yearoilandgasreserveestimates.Activityrelatedtoacquiredcompanieshasalsobeenreflectedasdescribedinthe appendix.
(b)Openingamountsfor2016includethe2015reportedamountsforLinnEnergypriortodeconsolidationofaformersubsidiary,whichhasbeenreflectedasan“other”adjustment.(c) Includestransfers,reclassificationsandothers.For2016,thisalsoincludestheeffectofdeconsolidationofasubsidiarynolongercontrolledbyLinnEnergy,LLC.
Gas production
4
2
6
8
10
12
16
14
Tcf
2012 2013 2014 2015 2016
All companies Integrateds
IndependentsLarge independents
0
Gas reserves, 2016 — top-ranked companies (bcf)
Ending reserves
ExxonMobilCorporation1 17,997.0
EQT Corporation 12,331.9
Antero Resources Corporation 9,414.0
CabotOil&GasCorporation 8,281.0
BP p.l.c. 8,015.0
Production
ExxonMobilCorporation1 1,236.0
Chesapeake Energy Corporation 1,050.0
Southwestern Energy Company 788.0
Anadarko Petroleum Corporation 766.0
EQT Corporation 701.01 See company endnotes on page 28.*Refer to the appendix for information on acquired companies.
Integrateds Large independents
All companies
Independents
End-of-year gas reserves
0
400500
200100
300
900800
Tcf
600700
2012 2013 2014 2015 2016
10 | US oil and gas reserves study
Performance measures
Proved reserve acquisition costs, finding and development costs, and reserve replacement costs
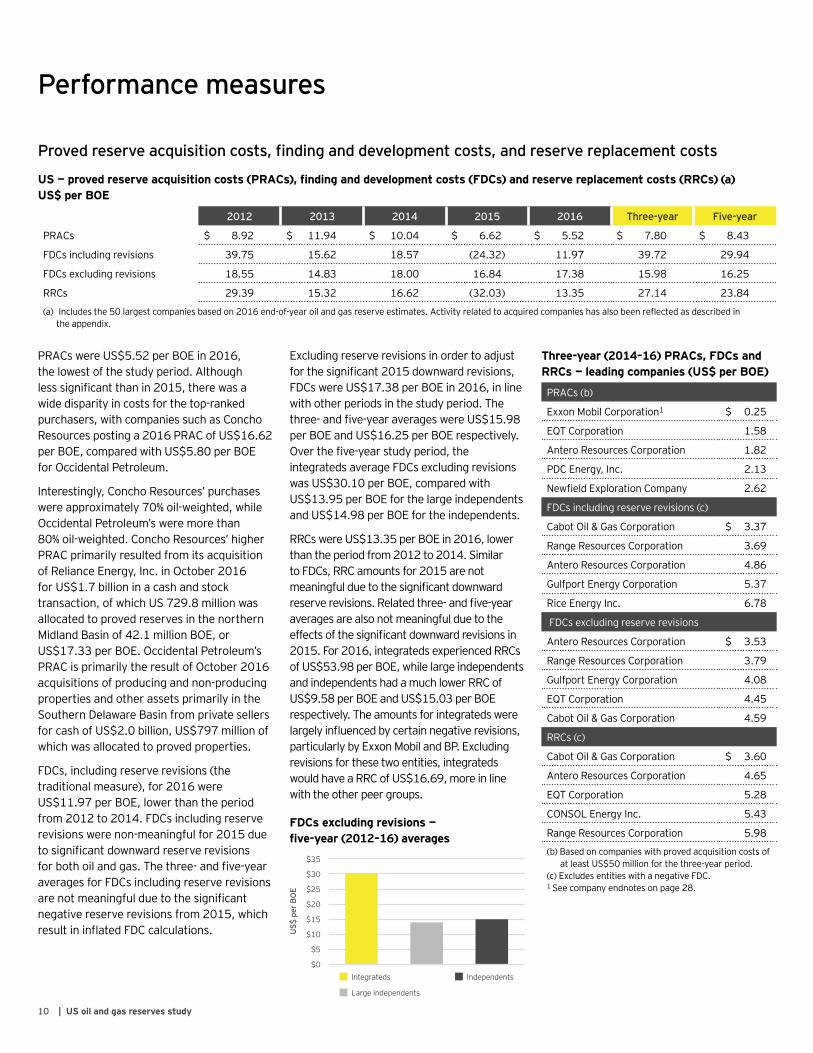
PRACswereUS$5.52perBOEin2016,the lowest of the study period. Although lesssignificantthanin2015,therewasawidedisparityincostsforthetop-rankedpurchasers, with companies such as Concho Resourcespostinga2016PRACofUS$16.62perBOE,comparedwithUS$5.80perBOEfor Occidental Petroleum.
Interestingly,ConchoResources’purchaseswereapproximately70%oil-weighted,whileOccidentalPetroleum’sweremorethan80%oil-weighted.ConchoResources’higherPRAC primarily resulted from its acquisition ofRelianceEnergy,Inc.inOctober2016forUS$1.7billioninacashandstocktransaction,ofwhichUS729.8millionwasallocated to proved reserves in the northern MidlandBasinof42.1millionBOE,orUS$17.33perBOE.OccidentalPetroleum’sPRACisprimarilytheresultofOctober2016acquisitionsofproducingandnon-producingproperties and other assets primarily in the Southern Delaware Basin from private sellers forcashofUS$2.0billion,US$797millionofwhich was allocated to proved properties.
FDCs,includingreserverevisions(thetraditionalmeasure),for2016wereUS$11.97perBOE,lowerthantheperiodfrom2012to2014.FDCsincludingreserverevisionswerenon-meaningfulfor2015duetosignificantdownwardreserverevisionsforbothoilandgas.Thethree-andfive-yearaveragesforFDCsincludingreserverevisionsarenotmeaningfulduetothesignificantnegativereserverevisionsfrom2015,whichresultininflatedFDCcalculations.
Excludingreserverevisionsinordertoadjustforthesignificant2015downwardrevisions,FDCswereUS$17.38perBOEin2016,inlinewith other periods in the study period. The three-andfive-yearaverageswereUS$15.98perBOEandUS$16.25perBOErespectively.Overthefive-yearstudyperiod,theintegratedsaverageFDCsexcludingrevisionswasUS$30.10perBOE,comparedwithUS$13.95perBOEforthelargeindependentsandUS$14.98perBOEfortheindependents.
RRCswereUS$13.35perBOEin2016,lowerthantheperiodfrom2012to2014.SimilartoFDCs,RRCamountsfor2015arenotmeaningfulduetothesignificantdownwardreserverevisions.Relatedthree-andfive-yearaverages are also not meaningful due to the effectsofthesignificantdownwardrevisionsin2015.For2016,integratedsexperiencedRRCsofUS$53.98perBOE,whilelargeindependentsand independents had a much lower RRC of US$9.58perBOEandUS$15.03perBOErespectively. The amounts for integrateds were largelyinfluencedbycertainnegativerevisions,particularlybyExxonMobilandBP.Excludingrevisions for these two entities, integrateds wouldhaveaRRCofUS$16.69,moreinlinewith the other peer groups.
US — proved reserve acquisition costs (PRACs), finding and development costs (FDCs) and reserve replacement costs (RRCs) (a) US$ per BOE
2012 2013 2014 2015 2016 Three-year Five-year
PRACs $ 8.92 $ 11.94 $ 10.04 $ 6.62 $ 5.52 $ 7.80 $ 8.43
FDCsincludingrevisions 39.75 15.62 18.57 (24.32) 11.97 39.72 29.94
FDCsexcludingrevisions 18.55 14.83 18.00 16.84 17.38 15.98 16.25
RRCs 29.39 15.32 16.62 (32.03) 13.35 27.14 23.84
(a)Includesthe50largestcompaniesbasedon2016end-of-yearoilandgasreserveestimates.Activityrelatedtoacquiredcompanieshasalsobeenreflectedasdescribedinthe appendix.
Three-year (2014–16) PRACs, FDCs and RRCs — leading companies (US$ per BOE)
PRACs (b)
ExxonMobilCorporation1 $ 0.25
EQT Corporation 1.58
Antero Resources Corporation 1.82
PDC Energy, Inc. 2.13
NewfieldExplorationCompany 2.62
FDCsincludingreserverevisions(c)
CabotOil&GasCorporation $ 3.37
Range Resources Corporation 3.69
Antero Resources Corporation 4.86
Gulfport Energy Corporation 5.37
Rice Energy Inc. 6.78
FDCsexcludingreserverevisions
Antero Resources Corporation $ 3.53
Range Resources Corporation 3.79
Gulfport Energy Corporation 4.08
EQT Corporation 4.45
CabotOil&GasCorporation 4.59
RRCs (c)
CabotOil&GasCorporation $ 3.60
Antero Resources Corporation 4.65
EQT Corporation 5.28
CONSOL Energy Inc. 5.43
Range Resources Corporation 5.98
(b) Based on companies with proved acquisition costs of atleastUS$50millionforthethree-yearperiod.
(c)ExcludesentitieswithanegativeFDC.1 See company endnotes on page 28.
FDCs excluding revisions — five-year (2012–16) averages
$0
$5
$10
$15
$20
$35
$30
$25
US$
per
BO
E
Integrateds Independents
Large independents
11US oil and gas reserves study |
Production replacement ratesOil
2012 2013 2014 2015 2016 Three-year Five-year
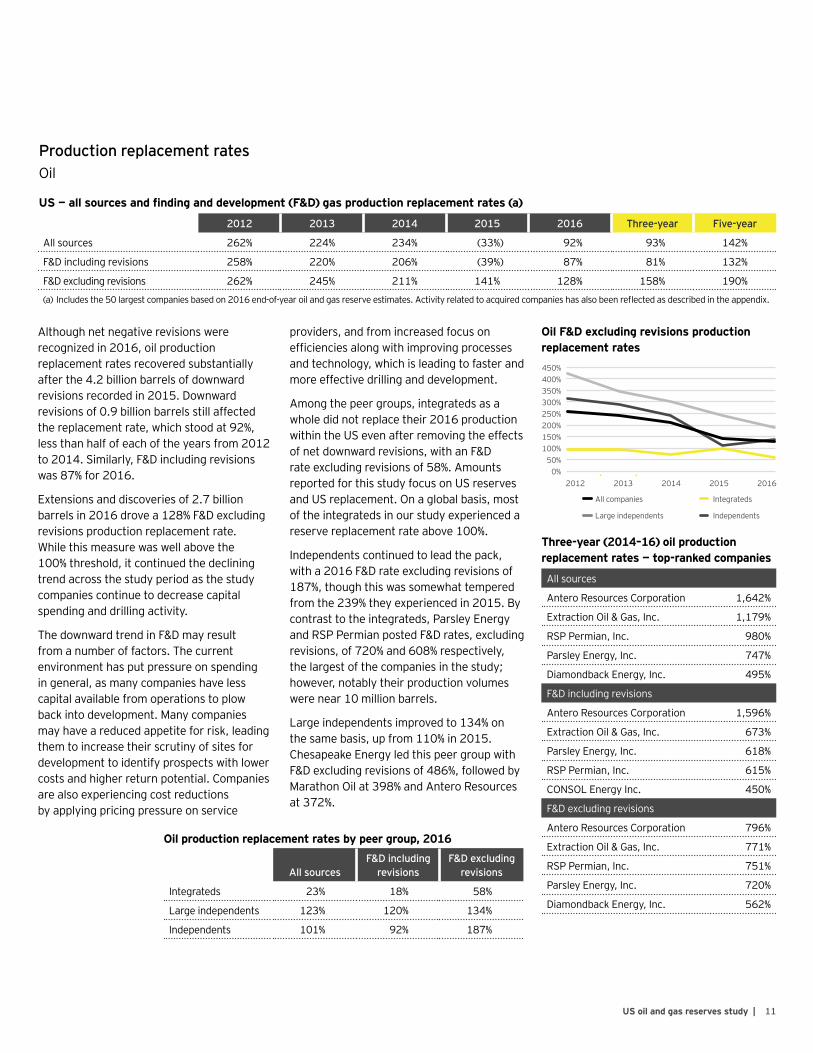
All sources 262% 224% 234% (33%) 92% 93% 142%
F&Dincludingrevisions 258% 220% 206% (39%) 87% 81% 132%
F&Dexcludingrevisions 262% 245% 211% 141% 128% 158% 190%
(a) Includesthe50largestcompaniesbasedon2016end-of-yearoilandgasreserveestimates.Activityrelatedtoacquiredcompanieshasalsobeenreflectedasdescribedintheappendix.
US — all sources and finding and development (F&D) gas production replacement rates (a)
Although net negative revisions were recognizedin2016,oilproductionreplacement rates recovered substantially after the 4.2 billion barrels of downward revisionsrecordedin2015.Downwardrevisionsof0.9billionbarrelsstillaffectedthe replacement rate, which stood at 92%, lessthanhalfofeachoftheyearsfrom2012to2014.Similarly,F&Dincludingrevisionswas87%for2016.
Extensions and discoveries of 2.7 billion barrelsin2016drovea128%F&Dexcludingrevisions production replacement rate. While this measure was well above the 100%threshold,itcontinuedthedecliningtrend across the study period as the study companies continue to decrease capital spending and drilling activity.
ThedownwardtrendinF&Dmayresultfrom a number of factors. The current environment has put pressure on spending in general, as many companies have less capital available from operations to plow backintodevelopment.Manycompaniesmay have a reduced appetite for risk, leading them to increase their scrutiny of sites for development to identify prospects with lower costs and higher return potential. Companies are also experiencing cost reductions by applying pricing pressure on service
providers, and from increased focus on efficienciesalongwithimprovingprocessesand technology, which is leading to faster and more effective drilling and development.
Among the peer groups, integrateds as a wholedidnotreplacetheir2016productionwithintheUSevenafterremovingtheeffectsofnetdownwardrevisions,withanF&Drate excluding revisions of 58%. Amounts reportedforthisstudyfocusonUSreservesandUSreplacement.Onaglobalbasis,mostof the integrateds in our study experienced a reservereplacementrateabove100%.
Independents continued to lead the pack, witha2016F&Drateexcludingrevisionsof187%, though this was somewhat tempered fromthe239%theyexperiencedin2015.Bycontrast to the integrateds, Parsley Energy andRSPPermianpostedF&Drates,excludingrevisions,of720%and608%respectively,the largest of the companies in the study; however, notably their production volumes werenear10millionbarrels.
Large independents improved to 134% on thesamebasis,upfrom110%in2015.Chesapeake Energy led this peer group with F&Dexcludingrevisionsof486%,followedbyMarathonOilat398%andAnteroResourcesat 372%.
All sources
Antero Resources Corporation 1,642%
ExtractionOil&Gas,Inc. 1,179%
RSP Permian, Inc. 980%
Parsley Energy, Inc. 747%
Diamondback Energy, Inc. 495%
F&Dincludingrevisions
Antero Resources Corporation 1,596%
ExtractionOil&Gas,Inc. 673%
Parsley Energy, Inc. 618%
RSP Permian, Inc. 615%
CONSOL Energy Inc. 450%
F&Dexcludingrevisions
Antero Resources Corporation 796%
ExtractionOil&Gas,Inc. 771%
RSP Permian, Inc. 751%
Parsley Energy, Inc. 720%
Diamondback Energy, Inc. 562%
Three-year (2014–16) oil production replacement rates — top-ranked companies
Oil F&D excluding revisions production replacement rates450%400%
300%350%
100%50%
150%200%250%
0%2012 2013 2014 20162015
All companies Integrateds
IndependentsLarge independents
Oil production replacement rates by peer group, 2016
All sourcesF&D including
revisionsF&D excluding
revisions
Integrateds 23% 18% 58%
Large independents 123% 120% 134%
Independents 101% 92% 187%

12 | US oil and gas reserves study
Production replacement ratesGas
US — all sources and finding and development (F&D) gas production replacement rates (a)
2012 2013 2014 2015 2016 Three-year Five-year
All sources 2% 209% 210% (179%) 98% 41% 66%
F&Dincludingrevisions (7%) 228% 219% (158%) 101% 52% 75%
F&Dexcludingrevisions 199% 229% 227% 141% 145% 171% 188%
(a)Includesthe50largestcompaniesbasedon2016USend-of-yearoilandgasreserveestimates.Activityrelatedtoacquiredcompanieshasalsobeenreflectedasdescribedinthe appendix.
Gas production replacement rates were somewhat more favorable thanoilin2016.Althoughtheeventsof2016stillledcompaniesto post 5.9 tcf of downward reserve revisions that had a dragging effect on replacement rates, this was a vast improvement compared withthe40.1tcfofdownwardreserverevisionsrecordedin2015.Includingrevisions,replacementrateshoverednearthe100%replacement threshold.
TheF&Dexcludingrevisionsreplacementratewas145%in2016,wellabovethe100%thresholdandcomparablewith2015,butmuchlowerthantheearlierpartofthefive-yearstudyperiod.Aswithoil,the integrateds had the lowest replacement rates, which failed to meetthe100%threshold.TheindependentsoutstrippedtheotherpeergroupswithanF&Drateexcludingrevisionsofnearly200%,whilelargeindependentssplitthedifferenceataround150%.
Gas production replacement rates by peer group, 2016
All sourcesF&D including
revisionsF&D excluding
revisions
Integrateds 2% 10% 84%
Large independents 115% 107% 147%
Independents 140% 169% 196%
Three-year (2014–16) gas production replacement rates — leading companies
All sources
ExtractionOil&Gas,Inc. 1,605%
RSP Permian, Inc. 1,030%
Rice Energy Inc. 700%
Oasis Petroleum Inc. 631%
Diamondback Energy, Inc. 599%
F&Dincludingrevisions
ExtractionOil&Gas,Inc. 967%
Rice Energy Inc. 500%
Gulfport Energy Corporation 470%
Continental Resources, Inc. 468%
RSP Permian, Inc. 463%
F&Dexcludingrevisions
ExtractionOil&Gas,Inc. 859%
RSP Permian, Inc. 832%
Diamondback Energy, Inc. 750%
Antero Resources Corporation 741%
Gulfport Energy Corporation 611%Gas F&D excluding revisions production replacement rates 300%
200%
250%
100%
50%
150%
0%
2012 2013 2014 20162015
All companies Integrateds
IndependentsLarge independents
13US oil and gas reserves study |
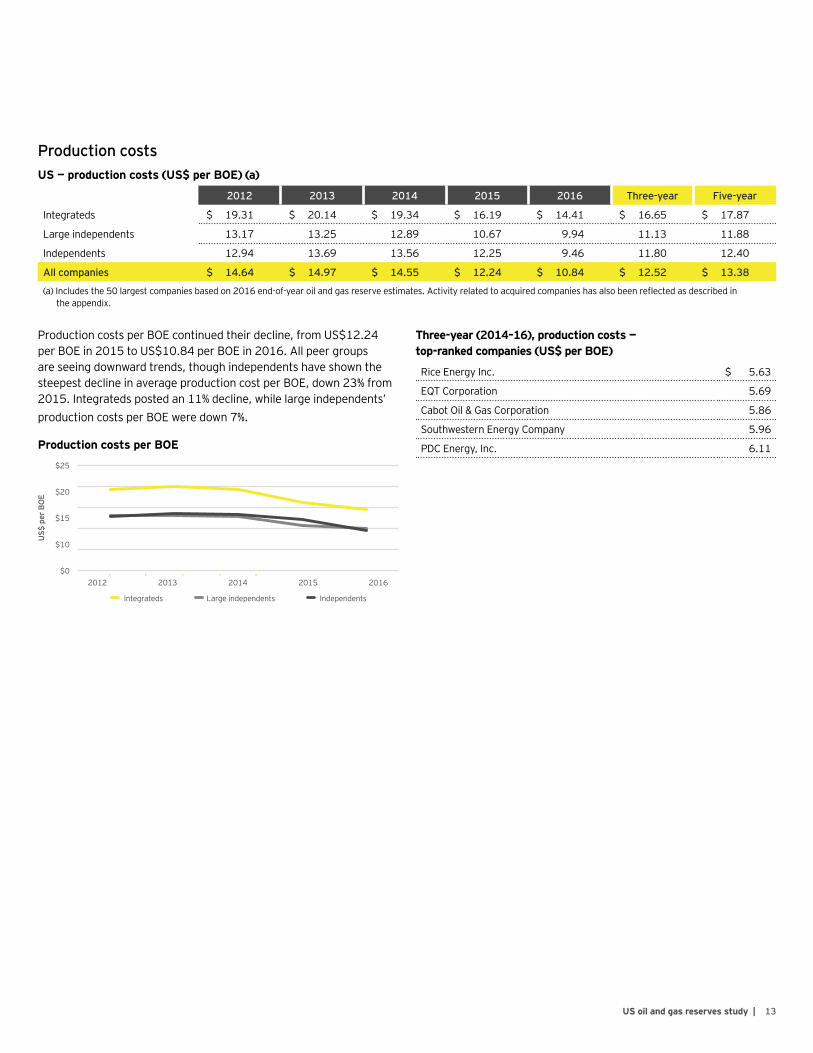
Production costsUS — production costs (US$ per BOE) (a)
ProductioncostsperBOEcontinuedtheirdecline,fromUS$12.24perBOEin2015toUS$10.84perBOEin2016.Allpeergroupsare seeing downward trends, though independents have shown the steepest decline in average production cost per BOE, down 23% from 2015.Integratedspostedan11%decline,whilelargeindependents’production costs per BOE were down 7%.
Three-year (2014–16), production costs — top-ranked companies (US$ per BOE)
Rice Energy Inc. $ 5.63
EQT Corporation 5.69
CabotOil&GasCorporation 5.86
Southwestern Energy Company 5.96
PDC Energy, Inc. 6.11
2012 2013 2014 2015 2016 Three-year Five-year
Integrateds $ 19.31 $ 20.14 $ 19.34 $ 16.19 $ 14.41 $ 16.65 $ 17.87
Large independents 13.17 13.25 12.89 10.67 9.94 11.13 11.88
Independents 12.94 13.69 13.56 12.25 9.46 11.80 12.40
All companies $ 14.64 $ 14.97 $ 14.55 $ 12.24 $ 10.84 $ 12.52 $ 13.38
(a)Includesthe50largestcompaniesbasedon2016end-of-yearoilandgasreserveestimates.Activityrelatedtoacquiredcompanieshasalsobeenreflectedasdescribedinthe appendix.
Production costs per BOE
$0
$10
$15
$25
US$
per
BO
E $20
2012 2013 2014 2015 2016
Integrateds IndependentsLarge independents
14 | US oil and gas reserves study
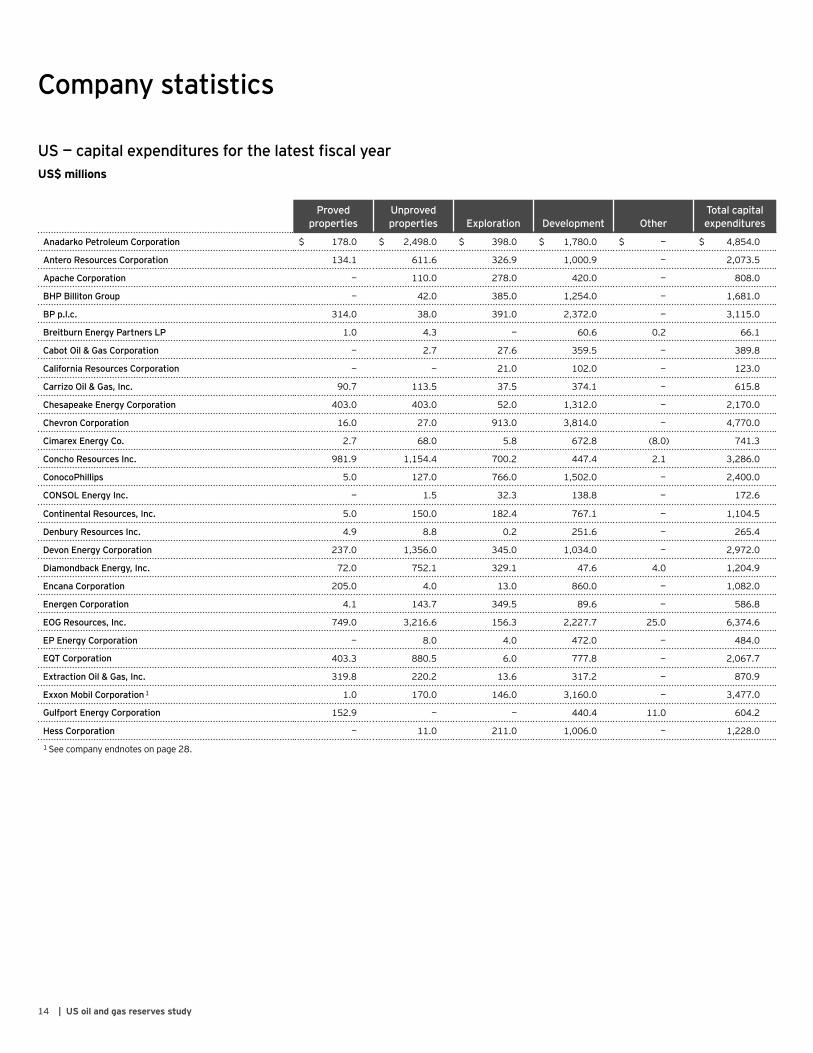
Company statistics
Proved properties
Unproved properties Exploration Development Other
Total capital expenditures
Anadarko Petroleum Corporation $ 178.0 $ 2,498.0 $ 398.0 $ 1,780.0 $ — $ 4,854.0
Antero Resources Corporation 134.1 611.6 326.9 1,000.9 — 2,073.5
Apache Corporation — 110.0 278.0 420.0 — 808.0
BHP Billiton Group — 42.0 385.0 1,254.0 — 1,681.0
BP p.l.c. 314.0 38.0 391.0 2,372.0 — 3,115.0
Breitburn Energy Partners LP 1.0 4.3 — 60.6 0.2 66.1
Cabot Oil & Gas Corporation — 2.7 27.6 359.5 — 389.8
California Resources Corporation — — 21.0 102.0 — 123.0
Carrizo Oil & Gas, Inc. 90.7 113.5 37.5 374.1 — 615.8
Chesapeake Energy Corporation 403.0 403.0 52.0 1,312.0 — 2,170.0
Chevron Corporation 16.0 27.0 913.0 3,814.0 — 4,770.0
Cimarex Energy Co. 2.7 68.0 5.8 672.8 (8.0) 741.3
Concho Resources Inc. 981.9 1,154.4 700.2 447.4 2.1 3,286.0
ConocoPhillips 5.0 127.0 766.0 1,502.0 — 2,400.0
CONSOL Energy Inc. — 1.5 32.3 138.8 — 172.6
Continental Resources, Inc. 5.0 150.0 182.4 767.1 — 1,104.5
Denbury Resources Inc. 4.9 8.8 0.2 251.6 — 265.4
Devon Energy Corporation 237.0 1,356.0 345.0 1,034.0 — 2,972.0
Diamondback Energy, Inc. 72.0 752.1 329.1 47.6 4.0 1,204.9
Encana Corporation 205.0 4.0 13.0 860.0 — 1,082.0
Energen Corporation 4.1 143.7 349.5 89.6 — 586.8
EOG Resources, Inc. 749.0 3,216.6 156.3 2,227.7 25.0 6,374.6
EP Energy Corporation — 8.0 4.0 472.0 — 484.0
EQT Corporation 403.3 880.5 6.0 777.8 — 2,067.7
Extraction Oil & Gas, Inc. 319.8 220.2 13.6 317.2 — 870.9
Exxon Mobil Corporation 1 1.0 170.0 146.0 3,160.0 — 3,477.0
Gulfport Energy Corporation 152.9 — — 440.4 11.0 604.2
Hess Corporation — 11.0 211.0 1,006.0 — 1,228.0
US — capital expenditures for the latest fiscal yearUS$ millions
1 See company endnotes on page 28.
15US oil and gas reserves study |
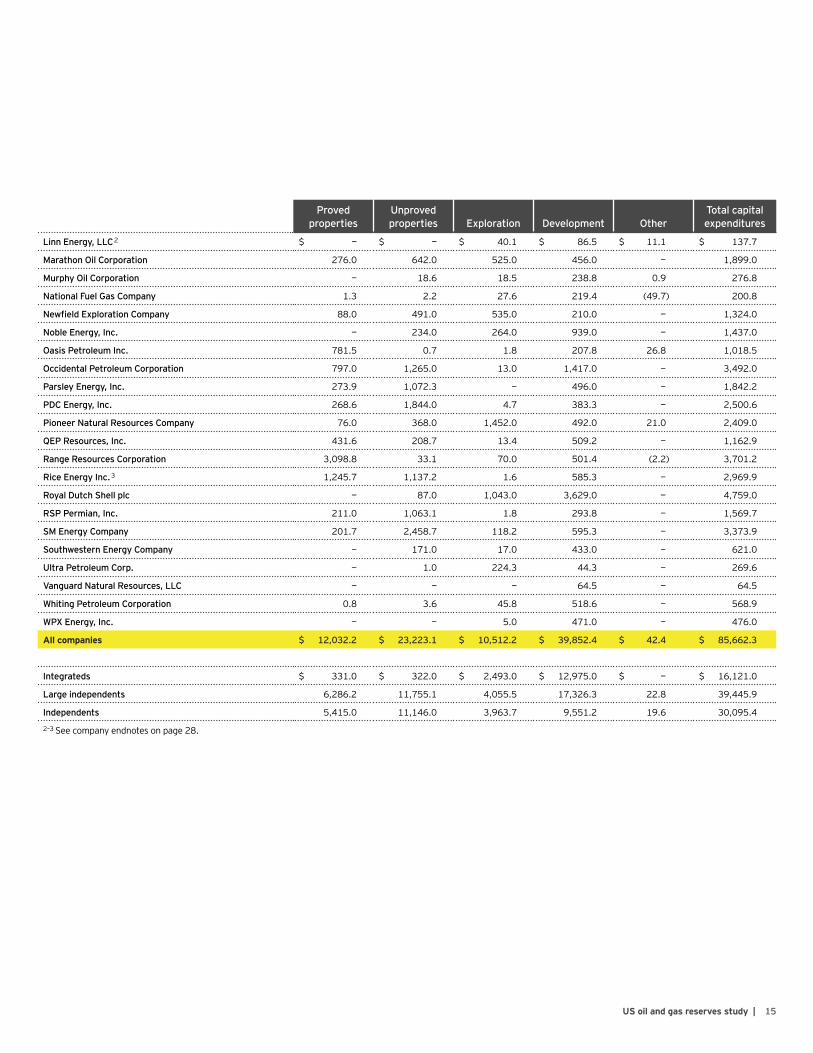
Proved properties
Unproved properties Exploration Development Other
Total capital expenditures
Linn Energy, LLC 2 $ — $ — $ 40.1 $ 86.5 $ 11.1 $ 137.7
Marathon Oil Corporation 276.0 642.0 525.0 456.0 — 1,899.0
Murphy Oil Corporation — 18.6 18.5 238.8 0.9 276.8
National Fuel Gas Company 1.3 2.2 27.6 219.4 (49.7) 200.8
Newfield Exploration Company 88.0 491.0 535.0 210.0 — 1,324.0
Noble Energy, Inc. — 234.0 264.0 939.0 — 1,437.0
Oasis Petroleum Inc. 781.5 0.7 1.8 207.8 26.8 1,018.5
Occidental Petroleum Corporation 797.0 1,265.0 13.0 1,417.0 — 3,492.0
Parsley Energy, Inc. 273.9 1,072.3 — 496.0 — 1,842.2
PDC Energy, Inc. 268.6 1,844.0 4.7 383.3 — 2,500.6
Pioneer Natural Resources Company 76.0 368.0 1,452.0 492.0 21.0 2,409.0
QEP Resources, Inc. 431.6 208.7 13.4 509.2 — 1,162.9
Range Resources Corporation 3,098.8 33.1 70.0 501.4 (2.2) 3,701.2
Rice Energy Inc. 3 1,245.7 1,137.2 1.6 585.3 — 2,969.9
Royal Dutch Shell plc — 87.0 1,043.0 3,629.0 — 4,759.0
RSP Permian, Inc. 211.0 1,063.1 1.8 293.8 — 1,569.7
SM Energy Company 201.7 2,458.7 118.2 595.3 — 3,373.9
Southwestern Energy Company — 171.0 17.0 433.0 — 621.0
Ultra Petroleum Corp. — 1.0 224.3 44.3 — 269.6
Vanguard Natural Resources, LLC — — — 64.5 — 64.5
Whiting Petroleum Corporation 0.8 3.6 45.8 518.6 — 568.9
WPX Energy, Inc. — — 5.0 471.0 — 476.0
All companies $ 12,032.2 $ 23,223.1 $ 10,512.2 $ 39,852.4 $ 42.4 $ 85,662.3
Integrateds $ 331.0 $ 322.0 $ 2,493.0 $ 12,975.0 $ — $ 16,121.0
Large independents 6,286.2 11,755.1 4,055.5 17,326.3 22.8 39,445.9
Independents 5,415.0 11,146.0 3,963.7 9,551.2 19.6 30,095.4
2–3 See company endnotes on page 28.

16 | US oil and gas reserves study
US — revenues and results of operations for the latest fiscal year (a)US$ millions
RevenuesProduction
costs (b)Exploration
expense DD&A Impairments
Other (income)
expense (c)Income taxes
Results of operations
Anadarko Petroleum Corporation $ 5,755.0 $ (2,077.0) $ (541.0) $ (3,512.0) $ (55.0) $ (917.0) $ 494.0 $ (853.0)
Antero Resources Corporation 1,755.1 (999.5) (6.9) (700.3) (162.9) — 43.3 (71.2)
Apache Corporation 1,997.0 (768.0) (285.0) (1,055.0) (61.0) (34.0) 72.0 (134.0)
BHP Billiton Group 3,487.0 (1,718.0) (128.0) (10,569.0) — (23.0) 3,047.0 (5,904.0)
BP p.l.c. 6,844.0 (2,679.0) (693.0) (3,940.0) — (1,060.0) 402.0 (1,126.0)
Breitburn Energy Partners LP 451.2 (350.0) — (303.3) (283.3) — 1.1 (484.3)
Cabot Oil & Gas Corporation 1,172.0 (566.5) (27.7) (590.1) (435.6) (1.9) 242.5 (207.2)
California Resources Corporation 1,700.0 (921.0) (23.0) (527.0) — (71.0) (64.0) 94.0
Carrizo Oil & Gas, Inc. 563.0 (123.3) — (212.6) (576.5) (1.4) — (350.9)
Chesapeake Energy Corporation 3,288.0 (2,639.0) — (1,003.0) (2,564.0) — 1,027.0 (1,891.0)
Chevron Corporation 7,073.0 (3,975.0) (399.0) (5,913.0) (342.0) 416.0 1,080.0 (2,060.0)
Cimarex Energy Co. 1,221.2 (504.1) — (419.6) (719.1) (7.8) 148.2 (281.3)
Concho Resources Inc. 2,260.2 (451.3) (77.5) (1,167.2) (1,524.6) (7.1) 876.1 (91.4)
ConocoPhillips 7,404.0 (4,238.0) (1,272.0) (4,905.0) (149.0) (246.0) 1,378.0 (2,028.0)
CONSOL Energy Inc. 695.9 (501.8) — (417.9) — (57.2) 69.3 (211.7)
Continental Resources, Inc. 2,027.0 (431.7) (17.0) (1,679.5) (237.3) — 126.8 (211.7)
Denbury Resources Inc. 935.8 (483.8) — (220.1) (810.9) (173.1) 285.8 (466.4)
Devon Energy Corporation 3,198.0 (1,323.0) — (817.0) (2,809.0) 1,154.0 — (597.0)
Diamondback Energy, Inc. 527.1 (128.5) — (176.4) (245.5) (1.1) (0.2) (24.5)
Encana Corporation 1,510.0 (499.0) — (523.0) (903.0) — 150.0 (265.0)
Energen Corporation 532.9 (214.7) (5.4) (663.7) — (6.7) 123.2 (234.4)
EOG Resources, Inc. 5,259.4 (1,917.6) (126.5) (3,249.8) (611.3) — 230.4 (415.5)
EP Energy Corporation 840.0 (339.0) (5.0) (450.0) — — (17.0) 29.0
EQT Corporation 1,595.0 (1,055.0) (13.4) (859.0) (6.9) — 136.3 (203.1)
Extraction Oil & Gas, Inc. 320.9 (82.8) (36.4) (205.3) (23.4) (13.6) 29.3 (11.4)
Exxon Mobil Corporation 1 7,597.0 (4,639.0) (220.0) (9,635.0) — — 2,543.0 (4,354.0)
Gulfport Energy Corporation 385.9 (248.1) — (243.1) (715.5) — — (820.8)
Hess Corporation 2,096.0 (1,049.0) (342.0) (2,031.0) — (696.0) (380.0) (2,402.0)
1 See company endnotes on page 28.
17US oil and gas reserves study |
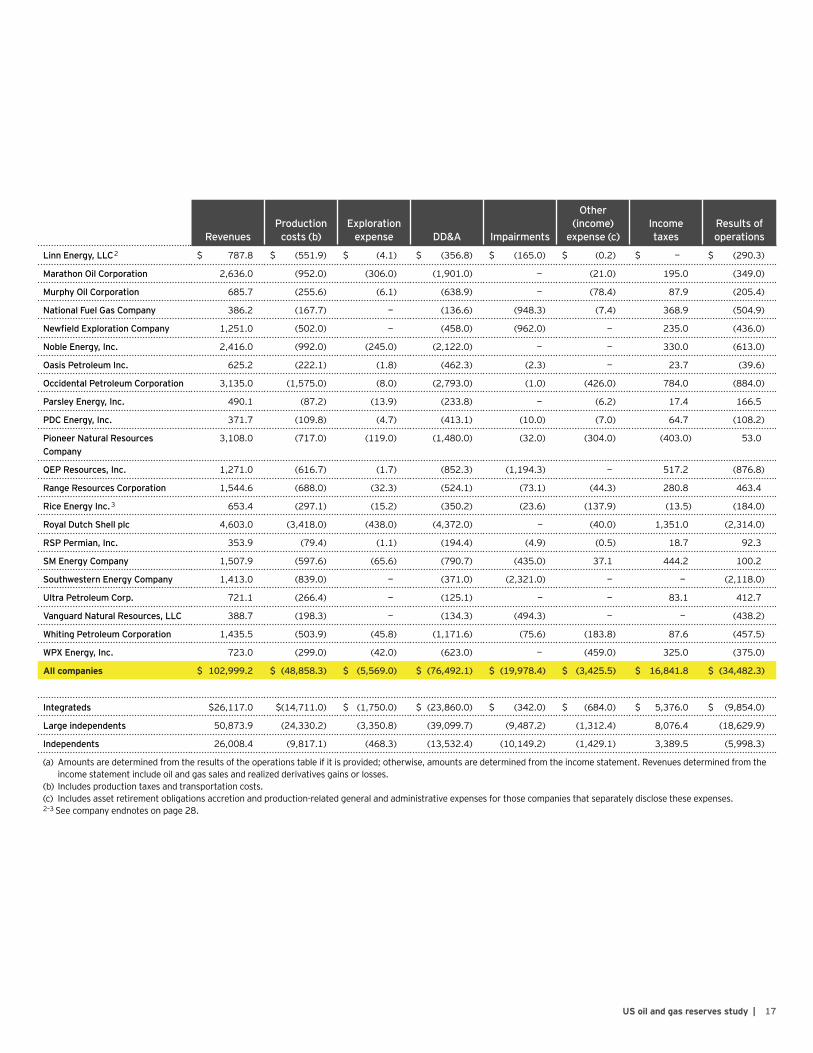
RevenuesProduction
costs (b)Exploration
expense DD&A Impairments
Other (income)
expense (c)Income taxes
Results of operations
Linn Energy, LLC 2 $ 787.8 $ (551.9) $ (4.1) $ (356.8) $ (165.0) $ (0.2) $ — $ (290.3)
Marathon Oil Corporation 2,636.0 (952.0) (306.0) (1,901.0) — (21.0) 195.0 (349.0)
Murphy Oil Corporation 685.7 (255.6) (6.1) (638.9) — (78.4) 87.9 (205.4)
National Fuel Gas Company 386.2 (167.7) — (136.6) (948.3) (7.4) 368.9 (504.9)
Newfield Exploration Company 1,251.0 (502.0) — (458.0) (962.0) — 235.0 (436.0)
Noble Energy, Inc. 2,416.0 (992.0) (245.0) (2,122.0) — — 330.0 (613.0)
Oasis Petroleum Inc. 625.2 (222.1) (1.8) (462.3) (2.3) — 23.7 (39.6)
Occidental Petroleum Corporation 3,135.0 (1,575.0) (8.0) (2,793.0) (1.0) (426.0) 784.0 (884.0)
Parsley Energy, Inc. 490.1 (87.2) (13.9) (233.8) — (6.2) 17.4 166.5
PDC Energy, Inc. 371.7 (109.8) (4.7) (413.1) (10.0) (7.0) 64.7 (108.2)
Pioneer Natural Resources Company
3,108.0 (717.0) (119.0) (1,480.0) (32.0) (304.0) (403.0) 53.0
QEP Resources, Inc. 1,271.0 (616.7) (1.7) (852.3) (1,194.3) — 517.2 (876.8)
Range Resources Corporation 1,544.6 (688.0) (32.3) (524.1) (73.1) (44.3) 280.8 463.4
Rice Energy Inc. 3 653.4 (297.1) (15.2) (350.2) (23.6) (137.9) (13.5) (184.0)
Royal Dutch Shell plc 4,603.0 (3,418.0) (438.0) (4,372.0) — (40.0) 1,351.0 (2,314.0)
RSP Permian, Inc. 353.9 (79.4) (1.1) (194.4) (4.9) (0.5) 18.7 92.3
SM Energy Company 1,507.9 (597.6) (65.6) (790.7) (435.0) 37.1 444.2 100.2
Southwestern Energy Company 1,413.0 (839.0) — (371.0) (2,321.0) — — (2,118.0)
Ultra Petroleum Corp. 721.1 (266.4) — (125.1) — — 83.1 412.7
Vanguard Natural Resources, LLC 388.7 (198.3) — (134.3) (494.3) — — (438.2)
Whiting Petroleum Corporation 1,435.5 (503.9) (45.8) (1,171.6) (75.6) (183.8) 87.6 (457.5)
WPX Energy, Inc. 723.0 (299.0) (42.0) (623.0) — (459.0) 325.0 (375.0)
All companies $ 102,999.2 $ (48,858.3) $ (5,569.0) $ (76,492.1) $ (19,978.4) $ (3,425.5) $ 16,841.8 $ (34,482.3)
Integrateds $26,117.0 $(14,711.0) $ (1,750.0) $ (23,860.0) $ (342.0) $ (684.0) $ 5,376.0 $ (9,854.0)
Large independents 50,873.9 (24,330.2) (3,350.8) (39,099.7) (9,487.2) (1,312.4) 8,076.4 (18,629.9)
Independents 26,008.4 (9,817.1) (468.3) (13,532.4) (10,149.2) (1,429.1) 3,389.5 (5,998.3)
(a) Amounts are determined from the results of the operations table if it is provided; otherwise, amounts are determined from the income statement. Revenues determined from the income statement include oil and gas sales and realized derivatives gains or losses.
(b) Includes production taxes and transportation costs.(c) Includesassetretirementobligationsaccretionandproduction-relatedgeneralandadministrativeexpensesforthosecompaniesthatseparatelydisclosetheseexpenses.2–3 See company endnotes on page 28.

18 | US oil and gas reserves study
US — oil reserves for the latest fiscal year (a)Million barrels
Beginning
Extensions and
discoveriesImproved recovery Revisions Production Purchases Sales Other(b) Ending
Anadarko Petroleum Corporation 850.0 30.0 — 56.0 (130.0) 86.0 (83.0) — 809.0
Antero Resources Corporation 613.0 108.0 — 278.0 (29.0) 25.0 — — 995.0
Apache Corporation 584.5 19.9 — (52.1) (57.8) 0.0 (0.1) — 494.4
BHP Billiton Group 491.9 4.7 — (124.0) (83.4) — — — 289.2
BP p.l.c. 1,806.0 — 5.0 (54.0) (143.0) 7.0 (1.0) — 1,620.0
Breitburn Energy Partners LP 148.7 18.6 — (23.3) (11.5) 0.1 (1.0) — 131.6
Cabot Oil & Gas Corporation 55.7 5.5 — (5.9) (4.5) — (1.8) — 49.2
California Resources Corporation 525.0 16.0 3.0 (40.0) (39.0) — (1.0) — 464.0
Carrizo Oil & Gas, Inc. 129.8 48.7 — (20.0) (11.2) 4.9 — — 152.3
Chesapeake Energy Corporation 497.2 280.2 — (56.1) (57.6) 4.6 (42.8) — 625.5
Chevron Corporation 1,386.0 131.0 5.0 109.0 (185.0) — (34.0) — 1,412.0
Cimarex Energy Co. 232.1 33.5 — 2.3 (30.7) 0.0 (0.6) — 236.5
Concho Resources Inc. 367.8 83.6 — (24.7) (33.8) 41.0 (5.8) — 428.0
ConocoPhillips 1,938.0 130.0 9.0 (182.0) (167.0) — — — 1,728.0
CONSOL Energy Inc. 97.1 12.7 — (21.9) (6.0) 15.1 (26.6) — 70.5
Continental Resources, Inc. 700.5 97.6 — (100.0) (46.9) — (8.1) — 643.2
Denbury Resources Inc. 282.3 — — (9.3) (22.5) 0.0 (3.4) — 247.1
Devon Energy Corporation 670.0 78.0 — 15.0 (89.0) 15.0 (70.0) — 619.0
Diamondback Energy, Inc. 132.0 69.0 — (14.4) (14.0) 3.6 — — 176.3
Encana Corporation 219.6 69.9 — (17.2) (34.7) 12.2 (37.7) — 212.1
Energen Corporation 282.4 55.6 — (24.6) (17.1) 0.1 (38.8) — 257.6
EOG Resources, Inc. 1,470.7 165.3 — 95.8 (131.7) 27.1 (42.3) — 1,584.9
EP Energy Corporation 389.6 42.6 — (98.0) (22.4) — (1.5) — 310.4
EQT Corporation 144.4 23.9 — 22.5 (12.6) 17.9 — — 196.1
Extraction Oil & Gas, Inc. 109.9 36.6 — (13.6) (7.6) 28.2 — — 153.4
Exxon Mobil Corporation 1 2,632.0 173.0 — (304.0) (148.0) 79.0 (15.0) — 2,417.0
Gulfport Energy Corporation 24.2 8.9 — (1.4) (6.0) — — — 25.7
Hess Corporation 420.0 17.0 — 65.0 (61.0) — — — 441.0
1 See company endnotes on page 28.

19US oil and gas reserves study |
Beginning
Extensions and
discoveriesImproved recovery Revisions Production Purchases Sales Other (b) Ending
Linn Energy, LLC 2 311.6 25.3 — (3.4) (19.3) — — (110.9) 203.3
Marathon Oil Corporation 752.0 243.0 4.0 (148.0) (62.0) 24.0 (80.0) — 733.0
Memorial Resource Development Corp. 4 201.7 — — — — — (201.7) — —
Murphy Oil Corporation 274.3 11.4 — (9.7) (20.7) — (4.5) — 250.8
National Fuel Gas Company 33.7 0.5 — (2.2) (2.9) — (0.1) — 29.0
Newfield Exploration Company 281.0 27.0 — 4.0 (32.0) 19.0 (19.0) — 280.0
Noble Energy, Inc. 432.0 97.0 — 30.0 (56.0) 4.0 (4.0) — 503.0
Oasis Petroleum Inc. 184.9 10.8 — 11.7 (15.2) 50.2 (5.8) — 236.6
Occidental Petroleum Corporation 1,101.0 — 142.0 (89.0) (88.0) 116.0 (3.0) — 1,179.0
Parsley Energy, Inc. 97.6 84.7 — (0.6) (11.8) 20.1 (5.0) — 185.1
PDC Energy, Inc. 162.7 0.8 — (29.2) (13.6) 82.7 (1.0) — 202.5
Pioneer Natural Resources Company 438.3 142.1 — (2.6) (64.8) 3.3 (1.1) — 515.1
QEP Resources, Inc. 251.9 16.3 — (10.0) (26.3) 74.2 (0.3) — 305.8
Range Resources Corporation 602.3 33.5 — 43.9 (31.4) 52.7 (0.7) — 700.3
Rice Energy Inc. 3 — — — — — — — — —
Royal Dutch Shell plc 560.0 20.0 2.0 17.0 (103.0) — (5.0) — 491.0
RSP Permian, Inc. 136.9 57.6 — (12.7) (9.5) 35.0 — — 207.4
SM Energy Company 260.7 63.1 — (54.6) (30.8) 12.2 (40.0) — 210.6
Southwestern Energy Company 49.7 14.0 — 15.4 (14.6) — (0.0) — 64.5
Ultra Petroleum Corp. 32.0 4.0 — (1.8) (2.9) — — — 31.4
Vanguard Natural Resources, LLC 122.5 0.8 — (16.9) (8.4) — (19.0) — 79.0
Whiting Petroleum Corporation 709.6 61.2 — (121.8) (40.6) — (112.1) — 496.3
WPX Energy, Inc. 218.0 74.7 — (6.7) (20.1) 2.0 (43.8) — 224.1
All companies 24,414.9 2,747.8 170.0 (930.1) (2,276.8) 862.3 (960.5) (110.9) 23,916.7
Integrateds 6,384.0 324.0 12.0 (232.0) (579.0) 86.0 (55.0) — 5,940.0
Large independents 11,470.1 1,360.3 155.0 (157.3) (1,128.4) 387.5 (362.4) — 11,724.8
Independents 6,560.8 1,063.5 3.0 (540.8) (569.4) 388.8 (543.1) (110.9) 6,252.0
(a) Includes condensate and natural gas liquids.(b)Includestransfers,reclassificationsandothers.2–4 See company endnotes on page 28.
20 | US oil and gas reserves study
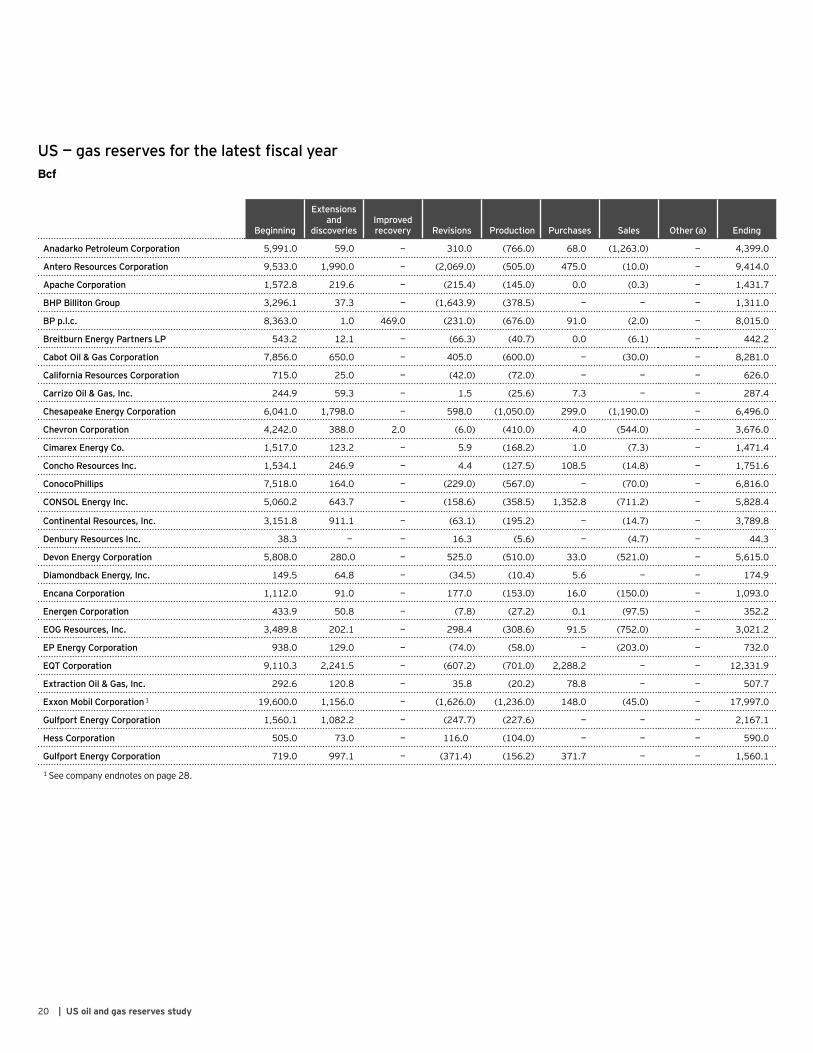
US — gas reserves for the latest fiscal yearBcf
Beginning
Extensions and
discoveriesImproved recovery Revisions Production Purchases Sales Other (a) Ending
Anadarko Petroleum Corporation 5,991.0 59.0 — 310.0 (766.0) 68.0 (1,263.0) — 4,399.0
Antero Resources Corporation 9,533.0 1,990.0 — (2,069.0) (505.0) 475.0 (10.0) — 9,414.0
Apache Corporation 1,572.8 219.6 — (215.4) (145.0) 0.0 (0.3) — 1,431.7
BHP Billiton Group 3,296.1 37.3 — (1,643.9) (378.5) — — — 1,311.0
BP p.l.c. 8,363.0 1.0 469.0 (231.0) (676.0) 91.0 (2.0) — 8,015.0
Breitburn Energy Partners LP 543.2 12.1 — (66.3) (40.7) 0.0 (6.1) — 442.2
Cabot Oil & Gas Corporation 7,856.0 650.0 — 405.0 (600.0) — (30.0) — 8,281.0
California Resources Corporation 715.0 25.0 — (42.0) (72.0) — — — 626.0
Carrizo Oil & Gas, Inc. 244.9 59.3 — 1.5 (25.6) 7.3 — — 287.4
Chesapeake Energy Corporation 6,041.0 1,798.0 — 598.0 (1,050.0) 299.0 (1,190.0) — 6,496.0
Chevron Corporation 4,242.0 388.0 2.0 (6.0) (410.0) 4.0 (544.0) — 3,676.0
Cimarex Energy Co. 1,517.0 123.2 — 5.9 (168.2) 1.0 (7.3) — 1,471.4
Concho Resources Inc. 1,534.1 246.9 — 4.4 (127.5) 108.5 (14.8) — 1,751.6
ConocoPhillips 7,518.0 164.0 — (229.0) (567.0) — (70.0) — 6,816.0
CONSOL Energy Inc. 5,060.2 643.7 — (158.6) (358.5) 1,352.8 (711.2) — 5,828.4
Continental Resources, Inc. 3,151.8 911.1 — (63.1) (195.2) — (14.7) — 3,789.8
Denbury Resources Inc. 38.3 — — 16.3 (5.6) — (4.7) — 44.3
Devon Energy Corporation 5,808.0 280.0 — 525.0 (510.0) 33.0 (521.0) — 5,615.0
Diamondback Energy, Inc. 149.5 64.8 — (34.5) (10.4) 5.6 — — 174.9
Encana Corporation 1,112.0 91.0 — 177.0 (153.0) 16.0 (150.0) — 1,093.0
Energen Corporation 433.9 50.8 — (7.8) (27.2) 0.1 (97.5) — 352.2
EOG Resources, Inc. 3,489.8 202.1 — 298.4 (308.6) 91.5 (752.0) — 3,021.2
EP Energy Corporation 938.0 129.0 — (74.0) (58.0) — (203.0) — 732.0
EQT Corporation 9,110.3 2,241.5 — (607.2) (701.0) 2,288.2 — — 12,331.9
Extraction Oil & Gas, Inc. 292.6 120.8 — 35.8 (20.2) 78.8 — — 507.7
Exxon Mobil Corporation 1 19,600.0 1,156.0 — (1,626.0) (1,236.0) 148.0 (45.0) — 17,997.0
Gulfport Energy Corporation 1,560.1 1,082.2 — (247.7) (227.6) — — — 2,167.1
Hess Corporation 505.0 73.0 — 116.0 (104.0) — — — 590.0
Gulfport Energy Corporation 719.0 997.1 — (371.4) (156.2) 371.7 — — 1,560.1
1 See company endnotes on page 28.
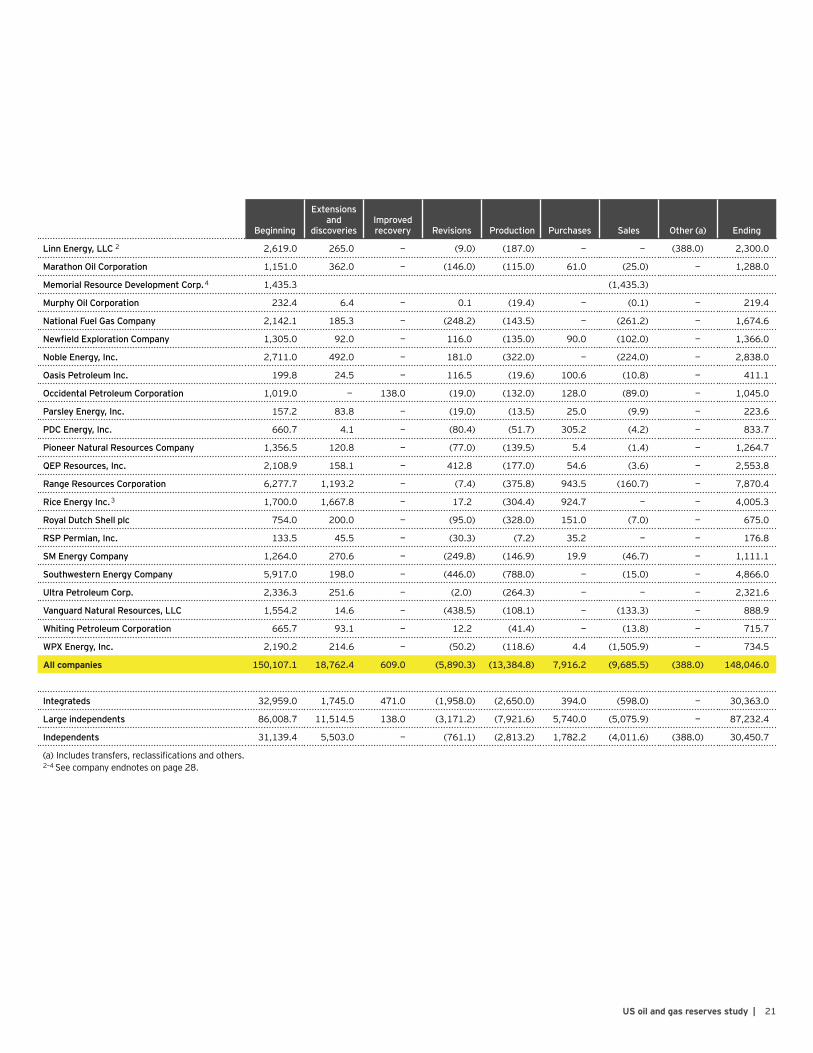
21US oil and gas reserves study |
Beginning
Extensions and
discoveriesImproved recovery Revisions Production Purchases Sales Other (a) Ending
Linn Energy, LLC 2 2,619.0 265.0 — (9.0) (187.0) — — (388.0) 2,300.0
Marathon Oil Corporation 1,151.0 362.0 — (146.0) (115.0) 61.0 (25.0) — 1,288.0
Memorial Resource Development Corp. 4 1,435.3 (1,435.3)
Murphy Oil Corporation 232.4 6.4 — 0.1 (19.4) — (0.1) — 219.4
National Fuel Gas Company 2,142.1 185.3 — (248.2) (143.5) — (261.2) — 1,674.6
Newfield Exploration Company 1,305.0 92.0 — 116.0 (135.0) 90.0 (102.0) — 1,366.0
Noble Energy, Inc. 2,711.0 492.0 — 181.0 (322.0) — (224.0) — 2,838.0
Oasis Petroleum Inc. 199.8 24.5 — 116.5 (19.6) 100.6 (10.8) — 411.1
Occidental Petroleum Corporation 1,019.0 — 138.0 (19.0) (132.0) 128.0 (89.0) — 1,045.0
Parsley Energy, Inc. 157.2 83.8 — (19.0) (13.5) 25.0 (9.9) — 223.6
PDC Energy, Inc. 660.7 4.1 — (80.4) (51.7) 305.2 (4.2) — 833.7
Pioneer Natural Resources Company 1,356.5 120.8 — (77.0) (139.5) 5.4 (1.4) — 1,264.7
QEP Resources, Inc. 2,108.9 158.1 — 412.8 (177.0) 54.6 (3.6) — 2,553.8
Range Resources Corporation 6,277.7 1,193.2 — (7.4) (375.8) 943.5 (160.7) — 7,870.4
Rice Energy Inc. 3 1,700.0 1,667.8 — 17.2 (304.4) 924.7 — — 4,005.3
Royal Dutch Shell plc 754.0 200.0 — (95.0) (328.0) 151.0 (7.0) — 675.0
RSP Permian, Inc. 133.5 45.5 — (30.3) (7.2) 35.2 — — 176.8
SM Energy Company 1,264.0 270.6 — (249.8) (146.9) 19.9 (46.7) — 1,111.1
Southwestern Energy Company 5,917.0 198.0 — (446.0) (788.0) — (15.0) — 4,866.0
Ultra Petroleum Corp. 2,336.3 251.6 — (2.0) (264.3) — — — 2,321.6
Vanguard Natural Resources, LLC 1,554.2 14.6 — (438.5) (108.1) — (133.3) — 888.9
Whiting Petroleum Corporation 665.7 93.1 — 12.2 (41.4) — (13.8) — 715.7
WPX Energy, Inc. 2,190.2 214.6 — (50.2) (118.6) 4.4 (1,505.9) — 734.5
All companies 150,107.1 18,762.4 609.0 (5,890.3) (13,384.8) 7,916.2 (9,685.5) (388.0) 148,046.0
Integrateds 32,959.0 1,745.0 471.0 (1,958.0) (2,650.0) 394.0 (598.0) — 30,363.0
Large independents 86,008.7 11,514.5 138.0 (3,171.2) (7,921.6) 5,740.0 (5,075.9) — 87,232.4
Independents 31,139.4 5,503.0 — (761.1) (2,813.2) 1,782.2 (4,011.6) (388.0) 30,450.7
(a)Includestransfers,reclassificationsandothers.2–4 See company endnotes on page 28.
22 | US oil and gas reserves study
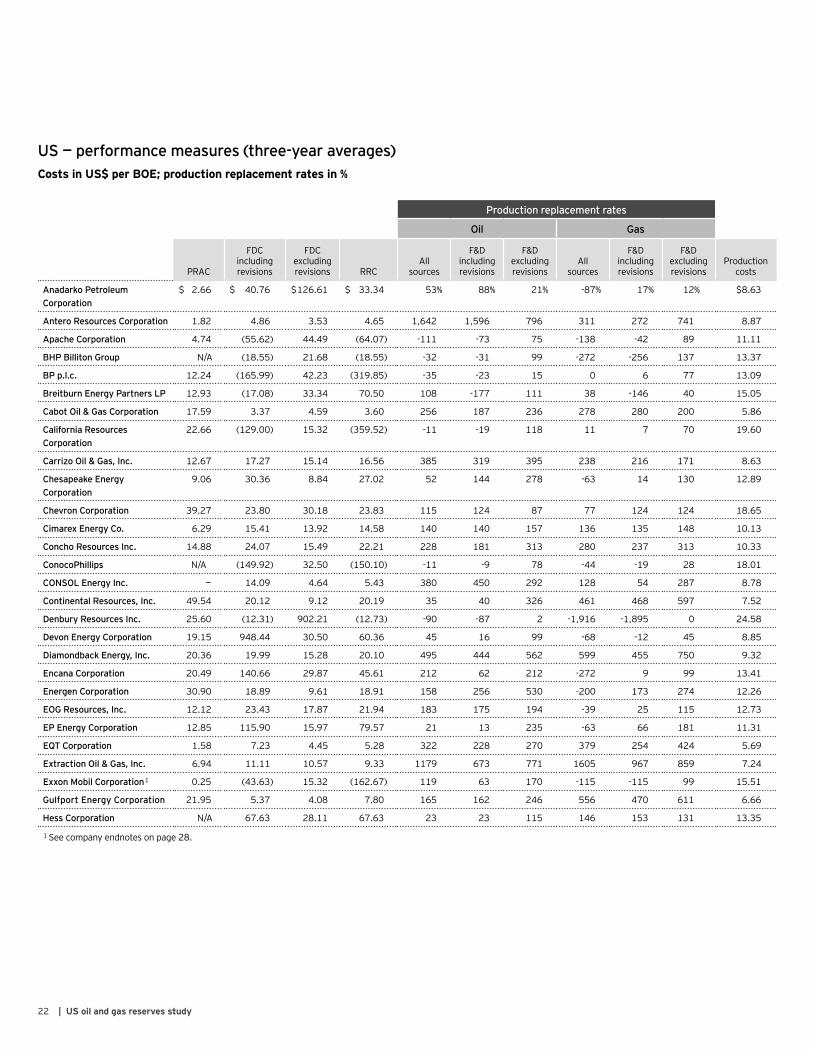
US — performance measures (three-year averages)Costs in US$ per BOE; production replacement rates in %
Production replacement rates
Oil Gas
PRAC
FDCincluding revisions
FDCexcluding revisions RRC
All sources
F&Dincluding revisions
F&Dexcluding revisions
Allsources
F&Dincluding revisions
F&Dexcluding revisions
Production costs
Anadarko Petroleum Corporation
$ 2.66 $ 40.76 $126.61 $ 33.34 53% 88% 21% -87% 17% 12% $8.63
Antero Resources Corporation 1.82 4.86 3.53 4.65 1,642 1,596 796 311 272 741 8.87
Apache Corporation 4.74 (55.62) 44.49 (64.07) -111 -73 75 -138 -42 89 11.11
BHP Billiton Group N/A (18.55) 21.68 (18.55) -32 -31 99 -272 -256 137 13.37
BP p.l.c. 12.24 (165.99) 42.23 (319.85) -35 -23 15 0 6 77 13.09
Breitburn Energy Partners LP 12.93 (17.08) 33.34 70.50 108 -177 111 38 -146 40 15.05
Cabot Oil & Gas Corporation 17.59 3.37 4.59 3.60 256 187 236 278 280 200 5.86
California Resources Corporation
22.66 (129.00) 15.32 (359.52) -11 -19 118 11 7 70 19.60
Carrizo Oil & Gas, Inc. 12.67 17.27 15.14 16.56 385 319 395 238 216 171 8.63
Chesapeake Energy Corporation
9.06 30.36 8.84 27.02 52 144 278 -63 14 130 12.89
Chevron Corporation 39.27 23.80 30.18 23.83 115 124 87 77 124 124 18.65
Cimarex Energy Co. 6.29 15.41 13.92 14.58 140 140 157 136 135 148 10.13
Concho Resources Inc. 14.88 24.07 15.49 22.21 228 181 313 280 237 313 10.33
ConocoPhillips N/A (149.92) 32.50 (150.10) -11 -9 78 -44 -19 28 18.01
CONSOL Energy Inc. — 14.09 4.64 5.43 380 450 292 128 54 287 8.78
Continental Resources, Inc. 49.54 20.12 9.12 20.19 35 40 326 461 468 597 7.52
Denbury Resources Inc. 25.60 (12.31) 902.21 (12.73) -90 -87 2 -1,916 -1,895 0 24.58
Devon Energy Corporation 19.15 948.44 30.50 60.36 45 16 99 -68 -12 45 8.85
Diamondback Energy, Inc. 20.36 19.99 15.28 20.10 495 444 562 599 455 750 9.32
Encana Corporation 20.49 140.66 29.87 45.61 212 62 212 -272 9 99 13.41
Energen Corporation 30.90 18.89 9.61 18.91 158 256 530 -200 173 274 12.26
EOG Resources, Inc. 12.12 23.43 17.87 21.94 183 175 194 -39 25 115 12.73
EP Energy Corporation 12.85 115.90 15.97 79.57 21 13 235 -63 66 181 11.31
EQT Corporation 1.58 7.23 4.45 5.28 322 228 270 379 254 424 5.69
Extraction Oil & Gas, Inc. 6.94 11.11 10.57 9.33 1179 673 771 1605 967 859 7.24
Exxon Mobil Corporation 1 0.25 (43.63) 15.32 (162.67) 119 63 170 -115 -115 99 15.51
Gulfport Energy Corporation 21.95 5.37 4.08 7.80 165 162 246 556 470 611 6.66
Hess Corporation N/A 67.63 28.11 67.63 23 23 115 146 153 131 13.35
1 See company endnotes on page 28.

23US oil and gas reserves study |
Production replacement rates
Oil Gas
PRAC
FDCincluding revisions
FDCexcluding revisions RRC
All sources
F&Dincluding revisions
F&Dexcluding revisions
Allsources
F&Dincluding revisions
F&Dexcluding revisions
Production costs
Linn Energy, LLC 2 $ 6.70 $ (8.59) $ 24.19 $ 70.78 -175% -191% 66% 49% -153% 56% $ 11.93
Marathon Oil Corporation 7.26 18.13 11.18 17.28 157 185 306 174 192 294 14.15
Murphy Oil Corporation 1.05 31.97 30.47 30.35 151 149 167 141 139 88 12.49
National Fuel Gas Company 3.71 8.22 6.46 7.79 -40 -40 29 188 242 297 6.78
Newfield Exploration Company
2.62 38.38 22.10 29.01 75 85 167 27 74 101 10.23
Noble Energy, Inc. 5.89 38.38 25.04 21.73 231 108 154 124 93 154 9.57
Oasis Petroleum Inc. 11.88 28.20 13.82 20.46 182 95 283 631 430 319 14.84
Occidental Petroleum Corporation
8.87 103.87 17.36 43.04 42 48 191 -110 -34 124 16.41
Parsley Energy, Inc. 12.04 19.01 16.11 17.52 747 618 720 573 456 578 7.69
PDC Energy, Inc. 2.13 113.55 14.81 22.62 304 26 491 190 129 497 6.11
Pioneer Natural Resources Company
14.38 33.78 15.79 33.30 93 128 253 -45 34 123 10.41
QEP Resources, Inc. 6.46 25.34 14.46 16.26 173 46 200 100 138 143 12.23
Range Resources Corporation 13.80 3.69 3.79 5.98 452 416 308 315 315 351 7.11
Rice Energy Inc. 3 8.38 6.78 6.34 7.24 N/A N/A N/A 700 500 535 5.63
Royal Dutch Shell plc 0.52 (104.42) 214.39 (154.87) -63 -52 18 -56 -40 34 21.70
RSP Permian, Inc. 10.23 23.60 18.56 18.34 980 615 751 1,030 463 832 9.15
SM Energy Company 12.58 39.20 16.95 34.47 79 91 235 83 116 237 11.66
Southwestern Energy Company
3.81 (38.61) 19.97 55.46 329 -238 78 14 -38 99 5.96
Ultra Petroleum Corp. 3.50 (5.21) 6.01 (305.99) 72 -244 393 -43 -188 149 7.29
Vanguard Natural Resources, LLC
7.27 (2.46) 23.94 14.69 121 -156 12 202 -193 22 13.29
Whiting Petroleum Corporation
11.65 23.57 16.04 18.87 180 165 290 488 451 337 13.38
WPX Energy, Inc. 10.03 106.86 19.26 40.79 163 139 271 -296 -25 95 8.85
All companies $ 7.80 $ 39.72 $ 15.98 $ 27.14 93% 81% 158% 41% 52% 171% $ 12.52
Integrateds $ 1.41 $ 503.55 $ 31.67 $ 130.13 46% 40% 77% -49% -38% 90% $ 16.65
Large independents 7.00 29.06 13.46 22.41 95 94 159 53 69 185 11.13
Independents 9.58 35.87 14.87 22.91 140 96 240 92 91 207 11.80
2–3 See company endnotes on page 28.
24 | US oil and gas reserves study
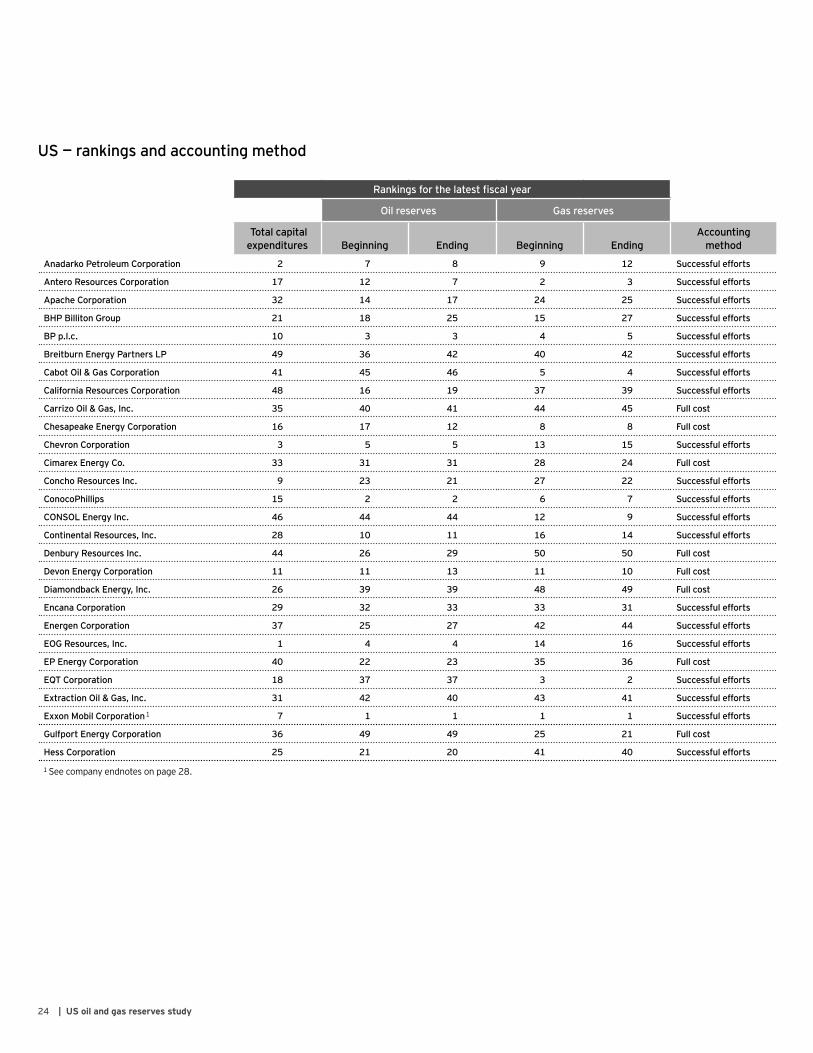
US — rankings and accounting method
Rankings for the latest fiscal year
Oil reserves Gas reserves
Total capital expenditures Beginning Ending Beginning Ending
Accounting method
Anadarko Petroleum Corporation 2 7 8 9 12 Successful efforts
Antero Resources Corporation 17 12 7 2 3 Successful efforts
Apache Corporation 32 14 17 24 25 Successful efforts
BHP Billiton Group 21 18 25 15 27 Successful efforts
BP p.l.c. 10 3 3 4 5 Successful efforts
Breitburn Energy Partners LP 49 36 42 40 42 Successful efforts
Cabot Oil & Gas Corporation 41 45 46 5 4 Successful efforts
California Resources Corporation 48 16 19 37 39 Successful efforts
Carrizo Oil & Gas, Inc. 35 40 41 44 45 Full cost
Chesapeake Energy Corporation 16 17 12 8 8 Full cost
Chevron Corporation 3 5 5 13 15 Successful efforts
Cimarex Energy Co. 33 31 31 28 24 Full cost
Concho Resources Inc. 9 23 21 27 22 Successful efforts
ConocoPhillips 15 2 2 6 7 Successful efforts
CONSOL Energy Inc. 46 44 44 12 9 Successful efforts
Continental Resources, Inc. 28 10 11 16 14 Successful efforts
Denbury Resources Inc. 44 26 29 50 50 Full cost
Devon Energy Corporation 11 11 13 11 10 Full cost
Diamondback Energy, Inc. 26 39 39 48 49 Full cost
Encana Corporation 29 32 33 33 31 Successful efforts
Energen Corporation 37 25 27 42 44 Successful efforts
EOG Resources, Inc. 1 4 4 14 16 Successful efforts
EP Energy Corporation 40 22 23 35 36 Full cost
EQT Corporation 18 37 37 3 2 Successful efforts
Extraction Oil & Gas, Inc. 31 42 40 43 41 Successful efforts
Exxon Mobil Corporation 1 7 1 1 1 1 Successful efforts
Gulfport Energy Corporation 36 49 49 25 21 Full cost
Hess Corporation 25 21 20 41 40 Successful efforts
1 See company endnotes on page 28.
25US oil and gas reserves study |
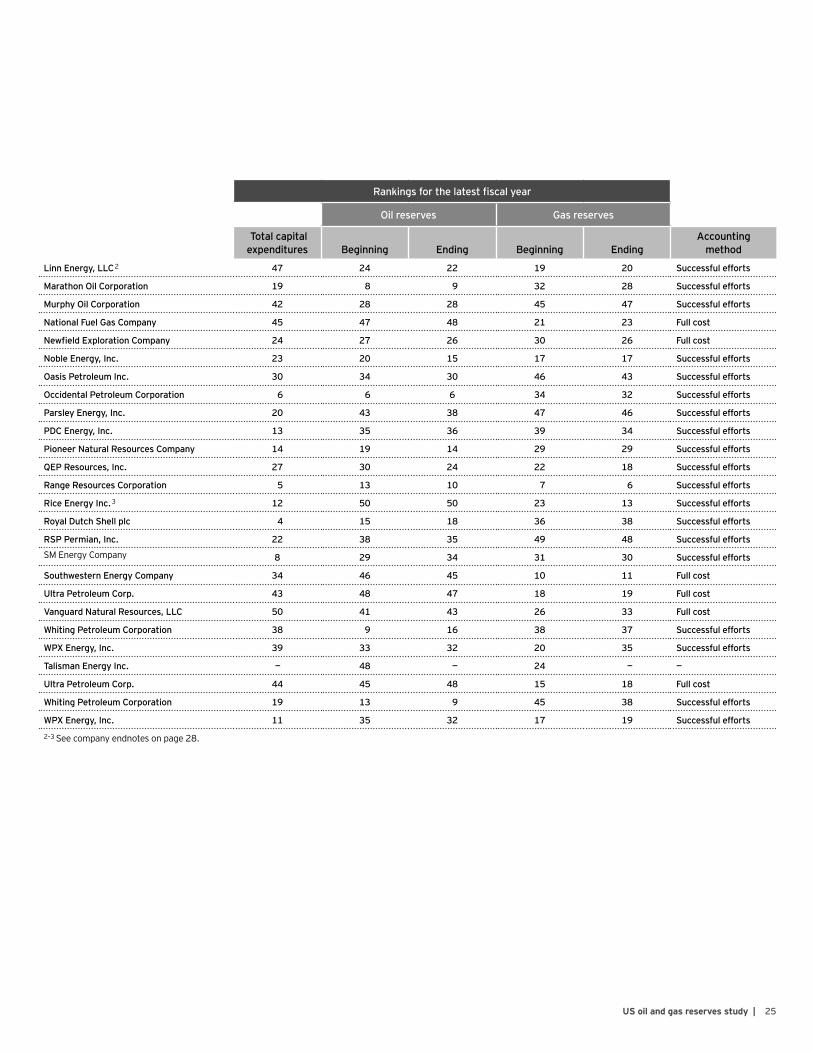
Rankings for the latest fiscal year
Oil reserves Gas reserves
Total capital expenditures Beginning Ending Beginning Ending
Accounting method
Linn Energy, LLC 2 47 24 22 19 20 Successful efforts
Marathon Oil Corporation 19 8 9 32 28 Successful efforts
Murphy Oil Corporation 42 28 28 45 47 Successful efforts
National Fuel Gas Company 45 47 48 21 23 Full cost
Newfield Exploration Company 24 27 26 30 26 Full cost
Noble Energy, Inc. 23 20 15 17 17 Successful efforts
Oasis Petroleum Inc. 30 34 30 46 43 Successful efforts
Occidental Petroleum Corporation 6 6 6 34 32 Successful efforts
Parsley Energy, Inc. 20 43 38 47 46 Successful efforts
PDC Energy, Inc. 13 35 36 39 34 Successful efforts
Pioneer Natural Resources Company 14 19 14 29 29 Successful efforts
QEP Resources, Inc. 27 30 24 22 18 Successful efforts
Range Resources Corporation 5 13 10 7 6 Successful efforts
Rice Energy Inc. 3 12 50 50 23 13 Successful efforts
Royal Dutch Shell plc 4 15 18 36 38 Successful efforts
RSP Permian, Inc. 22 38 35 49 48 Successful efforts
SMEnergyCompany 8 29 34 31 30 Successful efforts
Southwestern Energy Company 34 46 45 10 11 Full cost
Ultra Petroleum Corp. 43 48 47 18 19 Full cost
Vanguard Natural Resources, LLC 50 41 43 26 33 Full cost
Whiting Petroleum Corporation 38 9 16 38 37 Successful efforts
WPX Energy, Inc. 39 33 32 20 35 Successful efforts
Talisman Energy Inc. — 48 — 24 — —
Ultra Petroleum Corp. 44 45 48 15 18 Full cost
Whiting Petroleum Corporation 19 13 9 45 38 Successful efforts
WPX Energy, Inc. 11 35 32 17 19 Successful efforts
2–3 See company endnotes on page 28.
26 | US oil and gas reserves study
Peer groups
IntegratedsBP p.l.c.Chevron CorporationExxonMobilCorporationRoyal Dutch Shell plc
Large independentsAnadarko Petroleum CorporationAntero Resources CorporationApache CorporationBHPBillitonGroupCabotOil&GasCorporationChesapeake Energy CorporationConocoPhillipsCONSOL Energy Inc.Continental Resources, Inc.Devon Energy CorporationEOG Resources, Inc.EQT CorporationHessCorporationMarathonOilCorporationNoble Energy, Inc.Occidental Petroleum CorporationRange Resources CorporationSouthwestern Energy Company
IndependentsBreitburn Energy Partners LPCalifornia Resources CorporationCarrizoOil&Gas,Inc.Cimarex Energy Co.Concho Resources Inc.Denbury Resources Inc.Diamondback Energy, Inc.Encana CorporationEnergen CorporationEP Energy CorporationExtractionOil&Gas,Inc.Gulfport Energy CorporationLinn Energy, Inc.MurphyOilCorporationNationalFuelGasCompanyNewfieldExplorationCompanyOasis Petroleum Inc.Parsley Energy, Inc.PDC Energy, Inc.Pioneer Natural Resources CompanyQEP Resources, Inc.Rice Energy Inc.RSP Permian, Inc.SMEnergyCompanyUltraPetroleumCorp.Vanguard Natural Resources, LLCWhiting Petroleum CorporationWPX Energy, Inc.
27US oil and gas reserves study |
Appendix
Acquired companiesDuetothesignificanceoftheoperationsofcompaniesthatwereacquired during the study period, their capital expenditures, revenues and results of operations, oil reserves and gas reserves have been included for the years prior to their acquisition. This provides a more meaningful comparison throughout the study period.
InSeptember2016,MemorialResourceDevelopmentCorp.wasacquiredbyRangeResourcesCorporation.MemorialResourceDevelopment’s2012through2015capitalexpenditures,revenuesand results of operations, oil reserves and gas reserves have been included in the study. The capital expenditures, revenues and results of operations, oil reserves and gas reserves reported by RangeResourcesfor2016includeactivityrelatedtotheoperationsacquiredfromMemorialResourceDevelopment.MemorialResourceDevelopment’send-of-year2015oilreserves(201.7millionbarrels)andgasreserves(1,435.3bcf)havebeenincludedin2016beginning-of-yearreserveswithanequalvolumeincludedassalesin2016toreflecttheRangeResourcestransaction.
InJuly2015,RosettaResourceswasacquiredbyNobleEnergy.RosettaResources’2012through2014capitalexpenditures,revenues and results of operations, oil reserves and gas reserves have been included in the study. The capital expenditures, revenues and results of operations, oil reserves and gas reserves reported byNobleEnergyfor2015includeactivityrelatedtotheoperationsacquiredfromRosettaResources.RosettaResources’end-of-year2014oilreserves(172.5millionbarrels)andgasreserves(655.1bcf)havebeenincludedin2015beginning-of-yearreserveswithanequalvolumeincludedassalesin2015toreflecttheNobleEnergy transaction.
InAugust2011,PetrohawkEnergyCorporationwasacquiredbyBHPBillitonGroup.BHPBillitonhasa30Junefiscalyear-end,anditsfiscalyearincludestheperiodfrom1Julythrough30June.Thus,thecapital expenditures, revenues and results of operations, oil reserves andgasreservesreportedbyBHPBillitonfor2012includeactivityrelated to the operations acquired from Petrohawk Energy from the dateofacquisition.PetrohawkEnergy’send-of-year2011oilreserves(114.8 million barrels) and gas reserves (3,355.1 bcf) have been includedin2012beginning-of-yearreserveswithanequalvolumeincludedassalesin2012toreflecttheBHPBillitontransaction.
Forpurposesofthepeergroupanalysis,MemorialResourceDevelopment, Rosetta Resources and Petrohawk Energy are independents.
Performance measuresThe performance measures presented herein were calculated based onthecompanies’oilandgasreservedisclosureinformation.EY’smethodologyforcalculatingtheperformancemeasuresisdefinedbelow:
• Plowback percentage represents total capital expenditures as a percentage of netback (revenues less production costs).
• PRACs are calculated as proved property acquisition costs divided by proved reserves purchased.
• FDCs including revisions are calculated as the sum of unproved property acquisition costs, exploration costs, development costs andidentifiedrelatedassetretirementobligationcostsdividedby the sum of extensions and discoveries, revisions and improved recovery of proved reserves. The calculation excludes the effect of proved reserves purchased.
• FDCs excluding revisions are calculated as the sum of unproved property acquisition costs, exploration costs, development costs andidentifiedrelatedassetretirementobligationcostsdividedby the sum of extensions and discoveries and improved recovery of proved reserves. The calculation excludes the effect of proved reserves purchased.
• RRCs are calculated as total capital expenditures divided by the sum of extensions and discoveries, revisions, improved recovery and purchases of proved reserves.
• Production replacement rate (all sources) is calculated as the sum of extensions and discoveries, improved recovery, revisions, purchases and sales of proved reserves divided by production.
• Production replacement rate (F&D including revisions) is calculated as the sum of extensions and discoveries, improved recovery and revisions of proved reserves divided by production.
• Production replacement rate (F&D excluding revisions) is calculated as the sum of extensions and discoveries and improved recovery of proved reserves divided by production.
• Production costs are calculated as production costs, including production taxes, and transportation costs divided by production.
Manyindividualcompaniescalculateandreporttheirownperformancemeasures, and companies may use different methods that produce results different from those shown in this study.
28 | US oil and gas reserves study
Data limitationsUsersofthisstudyshouldkeepinmindthefollowinglimitationsonthedatapresented:
• Thisstudyexcludesgovernment-andprivatelyownedcompaniesand smaller public companies.
• Individual companies did not prepare or review the compiled data presented in this report.
• OilandgascompaniesthatfollowUSgenerallyacceptedaccountingprinciples (GAAP) are allowed to select either successful efforts accounting or full cost accounting for their oil and gas activities. SomecompaniesincludedinthisstudyfollowUSGAAP,whileothersfollowInternationalFinancialReportingStandards(IFRS)asadopted by their applicable country. These variations in standards can result in different results for some companies.
• Data for all companies may not be comparable because of differing interpretations or applications of reporting requirements.
• Oil and gas reserve estimates are imprecise and are revised as additional information about reserves becomes known.
OtherThe data included herein is obtained from Evaluate Energy andtheindividualcompanies’publishedannualreports.Thestudy companies generally were determined based on data availablefromEvaluateEnergyasof15March2017.Thedataincludeseachyear’soriginaldisclosuresmadebythecompanies.Restatementsorotheradjustmentsmadetocapitalexpendituresor revenues and results of operations data in subsequent years generallyhavenotbeenincorporatedherein.Unlessotherwiseindicated (such as in the company endnotes below for Linn Energy, LLC),restatementsorotheradjustmentsmadetooilandgasreserve data are included in the “Other” component of the reserve tables, but these amounts are not included in the performance measurecalculations.However,prior-periodinformationforApacheCorporationfor2013to2015,includingtheeffectsoncalculatedperformancemeasures,hasbeenrevisedtoreflectitsconversiontothesuccessfuleffortsmethodin2016.Revisionsto2012werenotavailable, and were not revised. Previously, Apache reported using the full cost method.
Totals presented may not add due to rounding. All amounts are reportedinUSdollars.
NaturalgaspricesarequotedonaMMBtubasis,whilegasreservesinthis study are presented in bcf and tcf.
Certain amounts in this study are presented on a per BOE basis. Natural gas volumes are converted to barrels at a ratio of six thousand cubic feet (mcf) to one barrel of oil. This ratio is generally viewedasbeingreflectiveofanapproximatethermalequivalencebetween the two commodities, though some individual companies may use a different ratio for their internal performance metrics.
Company endnotes1 AmountspresentedforExxonMobilincludeinvestmentsaccounted
for by the equity method. Oil rollforwards and computations based on oil volumes exclude NGLs, which are only reported on a worldwide basis.
2 Linn Energy, LLC is the successor entity to Linn Energy, Inc., which declaredbankruptcyin2016.Forconsistency,theresultsofLinnEnergy, Inc. are included for this entity for prior periods and for three-yearaveragecomputationsforLinnEnergy,LLC.Inaddition,becauseofadeconsolidationeventduring2016,opening2016oilandgasreserveshavebeenadjustedtoreflectthe2015closingreserves,withacorrespondingdownwardadjustmentinthe “Other” column to reduce the reserve volumes to opening reservesreportedfor2016.Thisisintendedtoadjustforthedeconsolidation event.
3 AllofRiceEnergy’soilandgasreservesareincludedasgasreserves,asthecompanydisclosesitsreservesonamcf-equivalentbasis.
4 MemorialResourceDevelopmentCorp.wasacquiredbyRangeResourceCorporationduring2016.RefertothenoteonAcquired companies.

29US oil and gas reserves study |
James Bowie US Oil and Gas Financial Advisory Assurance Services Senior Manager +1 212 773 4115 [email protected]
Deborah Byers US Energy Leader +17137508138 [email protected]
Mitch Fane US Oil & Gas Transaction Advisory Services Principal +17137504897 [email protected]
Herb Listen US Oil and Gas Assurance Partner +17137508282 [email protected]
Contacts
Why EY?
Through our oil and gas industry knowledge, our closely linked Assurance, Transactions, Tax and Advisory service teams, as well as more than 10,000 industry professionals globally, EY is equipped to provide independent, whole-life support and advice to our oil and gas clients during this time of fundamental change. We help clients solve complex issues and capitalize on opportunities to grow, optimize and protect their businesses now and in the future. Our team has proven skills covering the entire breadth and depth of our oil and gas clients’ businesses, ranging from strategy to portfolio review, improvement and management to execution.

About EYEY is a global leader in assurance, tax, transaction and advisory services. The insights and quality services we deliver help build trust and confidence in the capital markets and in economies the world over. We develop outstanding leaders who team to deliver on our promises to all of our stakeholders. In so doing, we play a critical role in building a better working world for our people, for our clients and for our communities.
EY refers to the global organization, and may refer to one or more, of the memberfirmsofErnst&YoungGlobalLimited,eachofwhichisaseparatelegalentity.Ernst&YoungGlobalLimited,aUKcompanylimitedbyguarantee,doesnotprovideservicestoclients.Formoreinformationaboutourorganization, please visit ey.com..
How EY’s Global Oil & Gas Sector can help your business The oil and gas sector is constantly changing. Increasingly uncertain energy policies, geopolitical complexities, cost management and climate change allpresentsignificantchallenges.EY’sGlobalOil&GasSectorsupportsaglobalnetworkofmorethan10,000oilandgasprofessionalswithextensiveexperience in providing assurance, tax, transaction and advisory services across the upstream, midstream, downstream and oil field subsectors. The Sector team works to anticipate market trends, execute the mobility of our global resources and articulate points of view on relevant sector issues. With our deep sector focus, we can help your organization drive down costs and compete more effectively.
©2017EYGMLimited.All Rights Reserved.
EYGNo.04466-174GBLCSGNo.1706-2334417ED None
This material has been prepared for general informational purposes only and is not intended to be relied upon as accounting, tax or other professional advice. Please refer to your advisors for specific advice.
ey.com/oilandgas
EY | Assurance | Tax | Transactions | Advisory
Connect with us
Follow us on Twitter @EY_OilGas
Visit us on LinkedIn
See us on YouTube