extremely intron-rich genes in the alveolate ancestors inferred
TRANSCRIPT

Extremely intron-rich genes in the alveolate ancestors inferred with a flexible maximum likelihood approach
1,2,*, Igor B. Rogozin
3, and Eugene V. Koonin
3,*
1Department of Computer Science and Operations Research, Université de Montréal, Montréal,
Québec, Canada; 2Collegium Budapest Institute for Advanced Study, Budapest, Hungary;
3National Center for Biotechnology Information, National Library of Medicine, National
Institutes of Health, Bethesda, MD 20894, USA
*For correspondence: [email protected], [email protected]
Abstract
Chromalveolates are a large, diverse supergroup of unicellular eukaryotes that includes
Apicomplexa, dinoflagellates, ciliates (three lineages that form the alveolate branch),
heterokonts, haptophytes, and cryptomonads (three lineages comprising the chromist branch). All
sequenced genomes of chromalveolates have relatively low intron density in protein-coding
genes, and few intron positions are shared between chromalveolate lineages. In contrast, genes of
different chromalveolates share many intron positions with orthologous genes from other
eukaryotic supergroups, in particular, the intron-rich orthologs from animals and plants.
Reconstruction of the history of intron gain and loss during the evolution of chromalveolates
using a general and flexible maximum-likelihood approach indicates that genes of the ancestors
of chromalveolates and, particularly, alveolates had unexpectedly high intron densities. It is
estimated that the chromalveolate ancestor had, approximately, 2/3 of the human intron density
whereas the intron density in the genes of the alveolate ancestor is estimated to be slightly greater
than the human intron density. Accordingly, it is inferred that the evolution of chromalveolates
was dominated by intron loss. The conclusion that ancestral chromalveolate forms had high
intron densities is unexpected because all extant unicellular eukaryotes have relatively few
introns, and are thought to be unable to maintain numerous introns due to intense purifying
selection in their, typically, large populations. It is suggested that, at early stages of evolution,
chromalveolates went through major population bottlenecks that were accompanied by intron
invasion.
Introduction
Spliceosomal introns that interrupt most of the protein-coding genes and the concurrent splicing
machinery that mediates intron excision and exon splicing are among the defining features of
eukaryotes (Doolittle 1978; Gilbert 1978; Mattick 1994; Deutsch and Long 1999). To date, all
eukaryotes with sequenced genomes, including parasitic protists with compact genomes,
previously suspected to be intronless, have been shown to possess at least a few introns (Nixon et
al. 2002; Simpson, MacQuarrie, and Roger 2002; Vanacova et al. 2005) and a (nearly) full
complement of spliceosomal proteins (Collins and Penny 2005). Different species dramatically
vary in their intron density, ranging from a few introns per genome to over 8 per gene (Logsdon
1998; Mourier and Jeffares 2003; Jeffares, Mourier, and Penny 2006). Despite the ubiquity of
introns in eukaryotic genomes, their natural history is poorly understood. To what extent introns
are to be regarded as “junk DNA” as opposed to functional parts of the genome remains an open
question. There are many reports on the contribution of introns to the regulation of gene
expression (Bourdon, Harvey, and Lonsdale 2001; Le Hir, Nott, and Moore 2003; Rose 2004;
Ying and Lin 2005) but it is unclear how general such functional roles of introns might be.
Much uncertainty also remains with regard to the origin and subsequent evolution of introns. For
the last 30 years, the study of intron evolution had been coached, primarily, as a debate between
the so-called introns-early and introns-late concepts. The introns-early view (more recently
revived in the form of “introns-first”) holds that introns were part of the very first protein-coding
genes and contributed to the emergence of proteins via recombination between RNA molecules
that encoded short peptide (Doolittle 1978; Gilbert 1978; Gilbert and Glynias 1993; Gilbert, de
Souza, and Long 1997; Jeffares, Mourier, and Penny 2006). The introns-late concept counters
that the primordial genes were intronless, and prokaryotic genes have remained so throughout
their history, whereas eukaryotic genes have been invaded by introns only after (or during) the
onset of the eukaryotic lineage (Stoltzfus et al. 1994; Logsdon et al. 1995; Logsdon 1998).
Considering the absence of the spliceosome and spliceosomal introns in prokaryotes, the failure
of key predictions, such as those about differences in intron phase distributions among ancient
and more recent introns (Rogozin et al. 2003) and conservation of intron positions between
ancient paralogs (Cho and Doolittle 1997; Sverdlov et al. 2007), and the uncertainty surrounding
other types of evidence such as intron-domain correspondence(Roy and Gilbert 2006), the
original introns-early concept hardly seems tenable anymore (Koonin 2006). However,
comparative-genomic studies show that numerous intron positions in orthologous genes are
conserved at great evolutionary depths, e.g., between plants and animals (Fedorov, Merican, and
Gilbert 2002; Rogozin et al. 2003). Furthermore, increasingly sophisticated reconstructions of
intron gain and loss during eukaryotic evolution suggest that the protein-coding genes of ancient
eukaryotic ancestors, including the Last Eukaryotic Common Ancestor (LECA), already
possessed intron density comparable to that found in modern, moderately intron-rich genomes
(Csuros 2005; Nguyen, Yoshihama, and Kenmochi 2005; Roy and Gilbert 2005b; Roy and
Gilbert 2005a; Carmel et al. 2007b). Accordingly, the history of eukaryotic genes, with respect to
the dynamics of introns, appears to be, to a large extent, dominated by losses, perhaps,
punctuated with a few episodes of major gain (Roy 2006; Carmel et al. 2007b).
Currently, the major phylogenetic divisions of eukaryotes are conservatively envisaged as
5 supergroups, the relationships between which remain uncertain (Keeling et al. 2005; Keeling
2007). The intron-rich organisms (animals and plants, respectively) belong to two supergroups,
unikonts and plantae, which also include many (relatively) intron-poor species such as,

respectively, fungi and green and red algae. The finding that orthologous genes of plants and
animals share ~25% of the intron positions led to the inference of a relatively high intron content
for the common ancestor of these two supergroups which, depending on the adopted phylogeny,
may or may not be the same as LECA(Rogozin et al. 2003; Roy and Gilbert 2005b; Carmel et al.
2007b). The remaining eukaryotic supergroups so far are known to include only (relatively)
intron-poor, unicellular species. Given the widespread intron loss during eukaryotic evolution, a
major question is: did the evolution of these eukaryotic lineages start from an intron-poor state
such that their subsequent history involved limited and, more or less, balanced loss and gain of
introns, or was the ancestral state intron-rich state such that subsequent evolution comprised of,
mostly, differential intron loss.
Here, we address this question in the case of the chromalveolates, a vast supergroup that is
an assemblage of diverse unicellular eukaryotes and encompasses up to half of all protist and
algal species (Cavalier-Smith 1999; Cavalier-Smith 2004). The monophyly of chromalveolates
has been originally suggested on the basis of a parsimonious scenario for plastid evolution under
which the common ancestor of chromalveolates engulfed a red alga and thus acquired the plastid
through secondary endosymbiosis (Cavalier-Smith 1999; Archibald 2005). Subsequently, this
hypothesis received strong support from phylogenetic analysis of both plastid and nuclear
genes(Fast et al. 2001; Fast et al. 2002; Harper and Keeling 2003; Harper, Waanders, and Keeling
2005). These phylogenetic studies have also established the tree topology within the
chromalveolate supergroup. The chromalveolates are subdivided into two major groups, each
consisting of 3 subgroups, all of which are diverse collections of organisms in their own right.
The alveolate group encompasses Apicomplexa (including a variety of important pathogens, such
as malarial plasmodium, toxoplasma, and cryptosporidium), dinoflagellates, and ciliates, whereas

the chromist group consists of cryptomonads, haptophytes and heterokonts (also known as
stramenopiles). Here we apply a general and flexible maximum likelihood technique to the
comparative-genomic analysis of 11 genomes of chromalveolates and 12 other eukaryotes, and
show that the common ancestors of chromalveolates and, particularly, alveolates had
unexpectedly intron-rich genes.
Materials and Methods
Data
We collected gene structure data from all publicly available, complete, annotated
chromalveolate genomes in which spliceosomal introns are not uncommon. As outgroups, we
used all available land plant genomes and two green algal genomes, as well as a comparable
number of genomes from animals and fungi. Among the available fungal and animal genomes,
we selected a diverse set of intron-rich species (which are expected to convey more information
about ancestral introns than intron-poor genomes). Throughout the evolutionary analyses, a fixed
organismal phylogeny that includes, mostly, uncontested evolutionary relationships was used; the
tree includes three relevant eukaryotic supergroups, Chromalveolata, Plantae, and unikonts, with
the relationship between them remaining unresolved and represented as a trifurcation (Adl et al.
2005l; Keeling et al. 2005. The genome sequences were extracted from GenBank, the NCBI
RefSeq database or the Joint Genome Institute database; the details on the sources of protein
sequences and exon-intron structure are given in Supplementary table S1. The following
eukaryotic species were included in the analysis: Plasmodium berghei (Pber), Plasmodium
chabaudi chabaudi (Pcha), Plasmodium falciparum (Pfal), Plasmodium yoelii yoelii (Pyoe),

Theileria annulata (Tann), Theileria parva (Tpar), Paramecium tetraurelia (Ptet), Tetrahymena
thermophyla (Tthe), Phaeodactylum tricornutum (Ftri), Phytophthora ramorum (Pram),
Phytophthora sojae (Psoj), Arabidopsis thaliana (Atha), Oryza sativa ssp. japonica (Osat),
Populus trichocarpa (Ptri), Chlamydomonas reinhardtii (Crei), Ostreococcus tauri (Otau), Apis
mellifera (Amel), Homo sapiens (Hsap), Tribolium castaneum (Tcas), Coprinus cinereus (Ccin),
Phycomyces blakesleeanus (Pbla), Phanerochaete chrysosporium (Pchr), Rhizopus oryzae
(Rory).
Paralogous gene sets
Sets of paralogous genes were constructed by updating and extending the database of eukaryotic
clusters of orthologous genes (KOGs) as follows. First, the KOG database covering seven
eukaryotic genomes (Tatusov et al. 2003) was downloaded from
ftp://ftp.ncbi.nlm.nih.gov/pub/COG/KOG/. Subsequently, each KOG was used as query to search
clade-specific databases of protein sequences using the PSI-BLAST program (Altschul et al.
1997; Schaffer et al. 2001). The searches were performed using command-line tools of the NCBI
software development kit (version 6.1, obtained from
ftp://ftp.ncbi.nlm.nih.gov/toolbox/ncbi_tools/ncbi.tar.gz). Using a BLAST database for each of
fungi, chromalveolates, and insects, the searches were performed using three iterations (switch –
j 3) of PSI-BLAST (blastpgp executable); for human and plant sequences, no iterations
were used. For each KOG query, sequences with an E-value <10-9
were retained if they had a
BLAST hit score within 50% of the best hit for the species. In a further filtering step, reversed
position-specific BLAST search (Marchler-Bauer et al. 2007) was used to query each retained
protein sequence against the CDD database of KOGs (rpsblast executable with default
parameters). Only those sequences passed this filter for which the highest-scoring KOG hit was

the same as the KOG used in the initial PSI-BLAST search, and the second highest scoring KOG
had less than 90% of the highest score. Sequences from the same genome that were thus assigned
to the same KOG comprised paralogous sets.
Orthologous genes
Within each set of paralogs, a set of putative orthologs was selected by reconciling gene and
species phylogenies using the following procedure. First, we employed a novel “weaving”
method to select a plausible orthologous set, which was then validated using a likelihood-based
phylogeny comparison. The weaving method (see Supplemental Material) constructs a phylogeny
of molecular sequences within a fixed species tree. The key technique consists of building a
rooted evolutionary tree from sequences associated with two organismal lineages resulting from a
speciation event, in the following manner. First, pairwise distances are computed from a multiple
alignment of the sequences (the alignment is computed on the fly for each application of this
technique.) Second, the tree is built by applying the Neighbor Joining algorithm (Saitou and Nei
1987; Studier and Keppler 1988) to the distances. Inner nodes of the tree are subsequently
classified as speciation or duplication nodes. Duplication nodes that have descendant speciation
nodes are split so that paralogous gene lineages are identified for which duplication predates the
speciation event. Only one sequence is kept as a representative from each gene lineage. This
technique is applied to each bifurcation of the species tree by proceeding from the terminal taxa
towards the root. The result of this weaving procedure is a set of putative orthologous lineages,
which are presumably the result of gene duplication predating the root of the species tree.
The largest set of putative orthologs was elected from each set of paralogs, and a
phylogeny was constructed using Neighbor Joining. The resulting distance-based phylogeny was
compared to the species tree. For this comparison the PAML package (Yang 2007) was used to
compute likelihood scores for protein sequence evolution along both phylogenies (with the
WAG+! model). A set of putative orthologs was considered valid if it contained representatives
of at least 18 species, and the log-likelihood score with the distance-based phylogeny was greater
than the log-likelihood score with the species tree by at most 0.4 (this threshold was established
by surveying the distribution of these scores across all KOGs).
Throughout the ortholog identification phase, sequences were aligned using MUSCLE
(Edgar 2004), and distances were computed using the heuristic of Sonnhammer and Hollich
(Sonnhammer and Hollich 2005) in conjunction with the VTML240 amino acid scoring matrix
(Muller, Spang, and Vingron 2002).
Orhtologous intron sites
For each set of orthologous proteins, a multiple alignment was constructed using MUSCLE
(Edgar 2004), the corresponding coding sequences were aligned using the protein alignment as
the guide, and the intron sites were projected onto the alignment as described previously
(Rogozin et al. 2003). Aligned intron-containing sites with identical phases were considered
orthologous. Sites were propagated to further analysis by computationally inspecting sequence
conservation around them. For each intron site within each sequence, the number of non-gap
amino acid positions had to be at least four on both the left- and right-hand sites to be categorized
solid. If the number of solid positions at a site was at least 18, then it was included in the intron
data set. In solid positions, 0 and 1 were used to encode absence and presence of the intron,
respectively, whereas in non-solid positions, and for missing sequences, an ambiguity character
was used. The intron data set was compiled by concatenating the intron site information from all
orthologous sets.

Likelihood-based analysis of intron evolution
The intron data set was analyzed in a likelihood framework described previously (Csuros 2005;
Csuros, Holey, and Rogozin 2007). Briefly, the procedure is as follows. It is assumed that intron
sites evolve independently under a Markov model (Steel 1994). The intron state (encoded by 0
and 1 for absence and presence) changes on each branch e of the phylogeny according to the
probabilities
(1)
where ! denotes branch-specific intron gain rate, µ denotes branch-specific loss rate, and t stands
for branch length. These latter parameters were set by numerical optimization of the likelihood
function, while taking into account a correction for missing intron sites (Felsenstein, 1992)). The
intron density at an ancestral node was computed as an expected value conditioned on the
observed data, by summing posterior probabilities (Csuros, Holey, and Rogozin 2007). The
extent of intron gains and losses along individual branches are estimated analogously, using
conditional expectations.
We experimented with rate variation models in which intron sites belong to discrete loss
and gain rate categories. In rate variation models, each site category is defined by a pair of gain
and loss rate modifying factors (", #) that apply to all branches of the tree such that loss and gain
rates "µ and #! are plugged into the state transition probabilities of (1). We used the Bayesian
Information Criterion (Schwarz 1978) to select the best rate variation model, which had two loss
rates classes.
Confidence intervals
Confidence intervals for estimates of ancestral intron density were obtained by using 1000
bootstrap replicates. In each iteration, a new data set was generated by randomly selecting the
same number of intron sites (independently and uniformly, with replacement). The likelihood of
the new data set was maximized numerically to set gain and loss rates, as well as the rate
variation parameters. Ancestral intron densities were estimated as conditional expectations. The
confidence intervals were obtained by discarding the 25 largest and the 25 smallest values from
the bootstrap estimates.
Results
Shared and unique intron positions in orthologous genes of
chromalveolates and other eukaryotes
The data set analyzed here consisted of 394 orthologous gene sets from 23 eukaryotes,
including 11 chromalveolates, where each set was represented in at least 18 species. The species
were selected to combine the chromalveolates with complete annotated genome sequences are
available with a maximum representation of intron-rich outgroups. The data set contained 7030
intron-bearing sites in conserved, unambiguously aligned regions of the orthologous protein
sequences (see Methods).
A crucial observation is that introns are rarely found in the same position between distant
chromalveolate species, with the exception of introns in Plasmodium, which often share positions
with introns in Theileria, as reported previously (Roy and Penny 2006). Previous analyses have

shown similar patterns of intron sharing at slightly lower levels, due to sparser taxonomic
sampling (Rogozin et al. 2003; Nguyen, Yoshihama, and Kenmochi 2007; Roy and Penny
2007a). Surprisingly, in many cases, chromalveolate introns are more likely to share position
with introns in orthologous genes of animals, fungi, or plants than with other chromalveolates
(Table 1). Thus, almost half of Phytophthora intron positions coincide with those in orthologous
genes of animals, fungi or plants . This pattern of intron sharing suggests that differential lineage-
specific intron loss was a substantial, if not the primary, contributor to the observed differences in
the exon-intron structure of orthologous genes among the chromalveolates.
Intron gain and loss dynamics in chromalveolate lineages
The gain and loss of introns in chromalveolates were reconstructed using a likelihood framework
that incorporated branch-specific intron loss and gain rates, as well as rate variation across sites
embodied by two loss-rate categories where about one-fifth of modern intron sites lose introns at
a 60% lower rate than the rest of the sites. The parameters of the rate categories were set by
numerical optimization along with other model parameters. The number of rate categories was
picked using a correction for model complexity to the likelihood score (see Methods). The model
imposes no constraints on the sequence of events occurring in the same site, i.e., introns in a
given position of an orthologous gene set can be lost and regained, or gained independently in
different lineages.
The reconstruction revealed a remarkable variation in intron loss and gain dynamics
among chromalveolate lineages (Fig. 1; the reconstructions for each of the individual set of
orthologs are available at http://www.iro.umontreal.ca/~csuros/introns/Chroma23/). The exon-
intron structure of orthologous genes has not changed much within the Apicomplexan genera,
i.e., individual species of Theileria and Plasmodium maintained the same intron density with

balanced gains and losses affecting 3–4% of their introns. This is in agreement with the recent
findings of Roy and Hartl who demonstrated the stasis of gene structures within the Plasmodium
genus (Roy and Hartl 2006). The branch leading to the Theileria ancestor, where ~20% of
modern Theileria introns were gained, is characterized by a slight net loss, with losses
outnumbering gains, approximately, twofold. Intron abundance was reduced more drastically in
other alveolate branches, where losses outnumber gains three- to sixfold (the ciliate branch and
the Alveolata-Apicomplexa branch), or even more than twenty-fold (the Apicomplexa-
Plasmodium branch), in agreement with the previous conclusions on the high prevalence of
intron loss in Apicomplexa (Roy and Penny 2007a). The present reconstruction indicates that
evolution of gene structure in heterokont lineages was also dominated by massive loss of introns
(Fig. 1).
The extensive intron loss is often accompanied by modest but non-negligible intron gain.
Among the chromalveolates, in the extreme case of the diatom P. tricornutum, these recent gains
account for ~90% of the few introns present in the genes of this organism (Fig. 2). A similar
pattern has been detected and thoroughly discussed by Roy and Penny for the diatom
Thalassiosira pseudonana (Roy and Penny 2007b). Phytophthora is estimated to have gained a
comparable number of introns in the same time interval but underwent a less extreme reduction
such that about 50% of the introns predate the chromalveolate ancestor (Fig. 1). In alveolates,
recent lineage-specific gains (on branches below the apicomplexan and ciliate ancestors) account
for 20–30% of the extant introns in Theileria, Plasmodium and Tetrahymena, and ~46% of the
extant introns in Paramecium (Fig. 2).

High intron density in deep ancestors of chromalveolates
We considered four alveolate lineages: Plasmodium, Theileria, Paramecium, and Tetrahymena.
The key aspects of chromalveolate intron evolution are apparent in the pattern of intron sharing
between these lineages (Table 2). First, introns that are shared between alveolate and non-
alveolate organisms most often appear in only one alveolate lineage (specifically, in 72% of the
cases). Considering the relatively low level of parallel intron gain in the same position (estimated
at <20% even for the most distant eukaryotes(Sverdlov et al. 2005; Carmel et al. 2007a)), these
shared introns were, most likely, present in the alveolate ancestor, so their presence in only a
subset of the chromalveolate lineages attests to extensive, lineage-specific intron loss. Second,
introns that are unique to chromalveolates exhibit an even more skewed distribution among
lineages than introns that are conserved outside the supergroup. Indeed, introns that are shared
with other eukaryotes are significantly more likely to appear in multiple chromalveolate lineages
than supergroup-specific introns. Introns that appear in, at least, two chromalveolate lineages and
are shared with non-chromalveolates are significantly more likely to appear in three or more
lineages than chromalveolate-specific introns (P<6.2x10⁻³
, one-tailed Fisher’s exact test). This
difference is likely to stem from a combination of the substantial between-sites variation of the
intron loss rate (Carmel et al. 2007b) and the relatively recent origin of some chromalveolate-
specific introns (Roy and Penny 2007b).
The inferred intron densities in the ancestors of alveolates and chromalveolates are
remarkably high (Fig. 3). Specifically, the alveolate ancestor is estimated to have had a slightly
greater intron density than humans, whereas the ancestor of the chromalveolate supergroup would
have ~65% of that density. Strikingly, the estimated intron density of the alveolate ancestor is
somewhat greater than the intron density in the plant (~91 % of the human density) and

opisthokont (~78% of the human density) ancestors estimated with the same method (Fig. 3). The
latter estimates were only slightly higher than those obtained previously with more constrained
ML models (Nguyen, Yoshihama, and Kenmochi 2005; Roy and Gilbert 2005b; Carmel et al.
2007b; Csuros, Holey, and Rogozin 2007).
Although modern alveolates have an intron density that is at least 60% lower than the
current estimate for the ancestral form, ~72% of the inferred ancestral alveolate intron positions
are shared by at least one extant, non-alveolate eukaryote. The uncertainty of the ancestral
alveolate density estimate is relatively high (~19% coefficient of variation in bootstrap
experiments) but even conservative estimates exceed two-thirds of the modern human intron
density (P<0.05 in bootstrap experiments). Similar high estimates were obtained with the three
possible branching orders for the supergroups, and when different conservation criteria were
applied for identification of homologous intron sites (see Supplementary Material). Furthermore,
the possibility of a numerical optimization artifact was ruled out by examining the surface of the
likelihood function (see Supplementary Material).
Discussion
The results of this study appear counter-intuitive in that a very high intron density
is confidently predicted for the ancestors of eukaryotic groups that (at least, so far) do not contain
a single intron-rich species. This prediction became possible because a general and flexible
maximum-likelihood method was applied to a diverse set of species. Adequate taxon sampling is
particularly crucial for the reconstruction of evolution characterized by dramatic reduction of
intron frequency in multiple lineages within a eukaryotic group such as the chromalveolates. In a
case like this, evidence of a high ancestral intron density in the examined group can be obtained
only through analysis of a diverse set of species because the genomes within the group share very

few intron positions with each other but, collectively, retain many ancestral intron positions
shared with some intron-rich genomes outside the group. The estimates of the rates of parallel
intron gain obtained here are, generally, compatible with the previous estimates (Sverdlov et al.
2005; Carmel et al. 2007a) and indicate that the shared introns are predominantly ancestral rather
than acquired in different lineages independently. The high level of intron conservation between
chromalveolates and representatives of other eukaryotic supergroups, such as plants and animals,
suggests that the intriguing possibility that, at least, some of the conserved introns retain ancestral
functions throughout eukaryotic evolution. Indeed, introns often affect the expression of genes at
several levels including mRNA export, stability, and translation efficiency (Le Hir et al. 2003).
However, the loss of most of the ancestral introns in some of the chromalveolate lineages
indicates that, if such ancestral functions of introns exist, they are not unconditionally essential.
The trend toward an upward revision of inferred ancestral intron densities is seen in recent
reconstructions (Carmel et al. 2007b; Csuros, Holey, and Rogozin 2007) compared to previous
analyses, even those performed with methods that might be prone to statistical bias (Roy and
Gilbert 2005b). Conceivably, given that the current collection of eukaryotic genomes (improved
as it is) hardly can be considered representative of each supergroup, even the estimates in this
work are conservative.
Another important factor is the number of orthologous genes included in the data set as
this determines the number of intron sites. Given the large loss and gain rate variation between
lineages, several thousand sites are necessary to produce accurate rate estimates. In addition, with
too few intron sites, models with rate variation cannot be used because there is insufficient
information to partition the sites into rate categories. For instance, when only half of the intron
sites contained in the present data set is analyzed, a constant-rate model has almost as much

statistical support as a two-loss-rates model, and a model complexity penalty (e.g., the Bayesian
Information Criterion) will outvote the rate variation model (data not shown). An inevitable
complication is that the requirement for a large number of intron sites forces one to include
ambiguous entries in the data table. This ambiguity between intron absence and presence in
homologous intron sites can be caused by ortholog misidentification, a genuine lack of an
ortholog in one or more species due to lineage-specific gene loss, or uncertainties in multiple
alignments. Accordingly, a correction for missing data was employed in the present analysis (see
Methods). The missing data problem notwithstanding, analysis of a data set that includes
sufficiently large numbers of species, genes, and sites is crucial for reaching robust inferences on
ancestral gene structures. A case in point is the recent work of Nguyen et al. (Nguyen,
Yoshihama, and Kenmochi 2007) in which 162 orthologous genes from 9 alveolate species were
analyzed, yielding an estimate of the ancestral alveolate intron density close to that in
Tetrahymena. This appears to be a substantial underestimate, likely, caused by an inadequate
choice of the outgroup (only one non-alveolate species, human, was used for comparison),
combined with scant taxon sampling (no chromists and only one ciliate), and a small data set to
which only a constant-rate model could be applied, as a result of the imposed requirements of
completely resolved orthologous gene sets and intron sites.
The inference of very high intron densities for the chromalveolate and, particularly,
alveolate ancestral forms is generally compatible with other recent inferences of intron-rich
eukaryotic ancestors (Csuros 2005; Nguyen, Yoshihama, and Kenmochi 2005; Roy and Gilbert
2005b; Carmel et al. 2007b; Csuros, Holey, and Rogozin 2007). However, in more specific
terms, these findings appear unexpected inasmuch as, so far, no particularly intron-rich
unicellular eukaryotes have been identified. The (relative) paucity of introns in the genomes of
unicellular organisms has been interpreted from the standpoint of a general population-genetic
theory according to which intensive purifying selection in the large populations of these
organisms prevents retention of a large number of introns(Lynch and Conery 2003; Lynch 2006).
The present results strongly suggest that unicellular eukaryotes with very high intron densities did
exist in the remote past. This conclusion seems to indicate that early stages of eukaryotic
evolution, beginning with the eukaryogenesis itself (Martin and Koonin 2006), involved major
bottlenecks during which extensive intron gain had occurred. The present reconstruction shows
that the high intron density in the common ancestor of the chromalveolate supergroup is,
essentially, the heritage of eukaryogenesis that is thought to have involved massive invasion of
Group II introns into the emerging nuclear genome, possibly from the mitochondrial
endosymbiont (Lynch and Richardson 2002; Lambowitz and Zimmerly, 2004) (Martin and
Koonin 2006). The emergence of chromalveolates appears to be connected with a secondary
endosymbiosis (Cavalier-Smith 1999; Cavalier-Smith 2004; Archibald 2005), however, this event
did not seem to bring about another wave of intron invasion. By contrast, major intron gain is
inferred to have occurred at the onset of the alveolate group (Figs. 1, 3), presumably, as a result
of yet another population bottleneck. The rest of the chromalveolate evolution, including the
origin of heterokonts, was apparently dominated by intron loss, presumably, following
independent increases in the effective population size in each lineage. To a large extent, this
extensive elimination of introns might have been mediated by retrotransposon activity as
suggested by Roy and Penny (Roy and Penny 2007a). In future genome analyses, it would be of
interest to investigate other correlates of intensive purifying selection in these lineages of
chromalveolates, such as the extent of gene loss.
Conclusions
The results of this work indicate that ancestral forms in a eukaryotic supergroup that
consists exclusively of unicellular and relatively intron-poor organisms were, in all likelihood,
extremely intron-rich — possibly, more so than modern multicellular eukaryotes with the most
complex genomes. Given the extensive lineage-specific intron loss that apparently dominated the
evolution of chromalveolates, this conclusion could be reached only by analyzing a large set of
orthologous genes from a representative set of species. As shown here and elsewhere, the
ancestors of plantae and unikonts are also estimated to have been intron-rich although,
paradoxically, somewhat less so than the chromalveolate and alveolate ancestors. For the
remaining two eukaryotic supergroups that include only protists, Rhizaria and Excavates, there
are currently no sufficiently intron-rich genomes to perform similar reconstructions. When such
genomes become available, it will become possible to obtain a reasonably complete scenario of
early evolution of eukaryotic gene structure.
Acknowledgements
This research was supported by the Intramural Research Program of the NIH (National Library of
Medicine, National Center for Biotechnology Information), and by a research grant from the
National Sciences and Engineering Research Council of Canada.

References
Adl, S. M. et al. 2005. The new higher level classification of eukaryotes with emphasis on the
taxonomy of protists. J Eukaryot Microbiol 52:399-451.
Altschul, S. F., T. L. Madden, A. A. Schaffer, J. Zhang, Z. Zhang, W. Miller, and D. J. Lipman.
1997. Gapped BLAST and PSI-BLAST: a new generation of protein database search
programs. Nucleic Acids Res 25:3389-3402.
Archibald, J. M. 2005. Jumping genes and shrinking genomes--probing the evolution of
eukaryotic photosynthesis with genomics. IUBMB Life 57:539-547.
Bourdon, V., A. Harvey, and D. M. Lonsdale. 2001. Introns and their positions affect the
translational activity of mRNA in plant cells. EMBO Rep 2:394-398.
Carmel, L., I. B. Rogozin, Y. I. Wolf, and E. V. Koonin. 2007a. Patterns of intron gain and
conservation in eukaryotic genes. BMC Evol Biol 7:192.
Carmel, L., Y. I. Wolf, I. B. Rogozin, and E. V. Koonin. 2007b. Three distinct modes of intron
dynamics in the evolution of eukaryotes. Genome Res 17:1034-1044.
Cavalier-Smith, T. 1999. Principles of protein and lipid targeting in secondary symbiogenesis:
euglenoid, dinoflagellate, and sporozoan plastid origins and the eukaryote family tree. J
Eukaryot Microbiol 46:347-366.
Cavalier-Smith, T. 2004. Chromalveolate diversity and cell megaevolution: interplay of
membranes, genomes and cytoskeleton in R. P. Hirt, Horner, D., ed. Organelles, Genomes
and Eukaryotic Evolution. Taylor and Francis, London.
Cho, G., and R. F. Doolittle. 1997. Intron distribution in ancient paralogs supports random
insertion and not random loss. J Mol Evol 44:573-584.
Collins, L., and D. Penny. 2005. Complex spliceosomal organization ancestral to extant
eukaryotes. Mol Biol Evol 22:1053-1066.
Csuros, M. 2005. Likely scenarios of intron evolution. Comparative Genomics. Lecture Notes in
Computer Science. 3678:47-60.
Csuros, M., J. A. Holey, and I. B. Rogozin. 2007. In search of lost introns. Bioinformatics 23:i87-
96.
Deutsch, M., and M. Long. 1999. Intron-exon structures of eukaryotic model organisms. Nucleic
Acids Res 27:3219-3228.
Doolittle, W. F. 1978. Genes in pieces: Were they ever together? Nature 272:581-582.
Edgar, R. C. 2004. MUSCLE: multiple sequence alignment with high accuracy and high
throughput. Nucleic Acids Res 32:1792-1797.
Fast, N. M., J. C. Kissinger, D. S. Roos, and P. J. Keeling. 2001. Nuclear-encoded, plastid-
targeted genes suggest a single common origin for apicomplexan and dinoflagellate
plastids. Mol Biol Evol 18:418-426.
Fast, N. M., L. Xue, S. Bingham, and P. J. Keeling. 2002. Re-examining alveolate evolution
using multiple protein molecular phylogenies. J Eukaryot Microbiol 49:30-37.
Fedorov, A., A. F. Merican, and W. Gilbert. 2002. Large-scale comparison of intron positions
among animal, plant, and fungal genes. Proc Natl Acad Sci U S A 99:16128-16133.
Felsenstein, J., 1992. Phylogenies from restriction sites: a maximum likelihood approach.
Evolution 46:159–173.
Gilbert, W. 1978. Why genes in pieces? Nature 271:501.
Gilbert, W., S. J. de Souza, and M. Long. 1997. Origin of genes. Proc Natl Acad Sci U S A
94:7698-7703.
Gilbert, W., and M. Glynias. 1993. On the ancient nature of introns. Gene 135:137-144.
Harper, J. T., and P. J. Keeling. 2003. Nucleus-encoded, plastid-targeted glyceraldehyde-3-
phosphate dehydrogenase (GAPDH) indicates a single origin for chromalveolate plastids.
Mol Biol Evol 20:1730-1735.
Harper, J. T., E. Waanders, and P. J. Keeling. 2005. On the monophyly of chromalveolates using
a six-protein phylogeny of eukaryotes. Int J Syst Evol Microbiol 55:487-496.
Jeffares, D. C., T. Mourier, and D. Penny. 2006. The biology of intron gain and loss. Trends
Genet 22:16-22.
Keeling, P. J. 2007. Genomics. Deep questions in the tree of life. Science 317:1875-1876.
Keeling, P. J., G. Burger, D. G. Durnford, B. F. Lang, R. W. Lee, R. E. Pearlman, A. J. Roger,
and M. W. Gray. 2005. The tree of eukaryotes. Trends Ecol Evol 20:670-676.
Koonin, E. V. 2006. The origin of introns and their role in eukaryogenesis: A compromise
solution to the introns-early versus introns-late debate? Biol Direct 1:22.
Lambowitz, A. M., and S. Zimmerly. 2004. Mobile Group II introns. Annu Rev Genet 38:1-35.
Le Hir, H., A. Nott, and M. J. Moore. 2003. How introns influence and enhance eukaryotic gene
expression. Trends Biochem Sci 28:215-220.
Logsdon, J. M., Jr. 1998. The recent origins of spliceosomal introns revisited. Curr Opin Genet
Dev 8:637-648.
Logsdon, J. M., Jr., M. G. Tyshenko, C. Dixon, D. J. J, V. K. Walker, and J. D. Palmer. 1995.
Seven newly discovered intron positions in the triose-phosphate isomerase gene: evidence
for the introns-late theory. Proc Natl Acad Sci U S A 92:8507-8511.
Lynch, M. 2006. The origins of eukaryotic gene structure. Mol Biol Evol 23:450-468.
Lynch, M., and A. O. Richardson. 2002. The evolution of spliceosomal introns. Curr Opin Genet
Dev 12:701-710.
Lynch, M., and J. S. Conery. 2003. The origins of genome complexity. Science 302:1401-1404.
Marchler-Bauer, A., J. B. Anderson, M. K. Derbyshire, C. DeWeese-Scott, N. R. Gonzales, M.
Gwadz, L. Hao, S. He, D. I. Hurwitz, J. D. Jackson, Z. Ke, D. Krylov, C. J. Lanczycki, C.
A. Liebert, C. Liu, F. Lu, S. Lu, G. H. Marchler, M. Mullokandov, J. S. Song, N. Thanki,
R. A. Yamashita, J. J. Yin, D. Zhang, and S. H. Bryant. 2007. CDD: a conserved domain
database for interactive domain family analysis. Nucleic Acids Res 35:D237-240.

Martin, W., and E. V. Koonin. 2006. Introns and the origin of nucleus-cytosol
compartmentalization. Nature 440:41-45.
Mattick, J. S. 1994. Introns: evolution and function. Curr Opin Genet Dev 4:823-831.
Mourier, T., and D. C. Jeffares. 2003. Eukaryotic intron loss. Science 300:1393.
Muller, T., R. Spang, and M. Vingron. 2002. Estimating amino acid substitution models: a
comparison of Dayhoff's estimator, the resolvent approach and a maximum likelihood
method. Mol Biol Evol 19:8-13.
Nguyen, H. D., M. Yoshihama, and N. Kenmochi. 2005. New maximum likelihood estimators for
eukaryotic intron evolution. PLoS Comput Biol 1:e79.
Nguyen, H. D., M. Yoshihama, and N. Kenmochi. 2007. The evolution of spliceosomal introns in
alveolates. Mol Biol Evol 24:1093-1096.
Nixon, J. E., A. Wang, H. G. Morrison, A. G. McArthur, M. L. Sogin, B. J. Loftus, and J.
Samuelson. 2002. A spliceosomal intron in Giardia lamblia. Proc Natl Acad Sci U S A
99:3701-3705.
Rogozin, I. B., Y. I. Wolf, A. V. Sorokin, B. G. Mirkin, and E. V. Koonin. 2003. Remarkable
interkingdom conservation of intron positions and massive, lineage-specific intron loss
and gain in eukaryotic evolution. Curr Biol 13:1512-1517.
Rose, A. B. 2004. The effect of intron location on intron-mediated enhancement of gene
expression in Arabidopsis. Plant J 40:744-751.
Roy, S. W. 2006. Intron-rich ancestors. Trends Genet 22:468-471.
Roy, S. W., and W. Gilbert. 2005a. Rates of intron loss and gain: implications for early
eukaryotic evolution. Proc Natl Acad Sci U S A 102:5773-5778.
Roy, S. W., and W. Gilbert. 2005b. Complex early genes. Proc Natl Acad Sci U S A 102:1986-
1991.
Roy, S. W., and W. Gilbert. 2006. The evolution of spliceosomal introns: patterns, puzzles and
progress. Nat Rev Genet 7:211-221.
Roy, S. W., and D. L. Hartl. 2006. Very little intron loss/gain in Plasmodium: Intron loss/gain
mutation rates and intron number. Genome Res 16:750-756.
Roy, S. W., and D. Penny. 2007a. Widespread intron loss suggests retrotransposon activity in
ancient apicomplexans. Mol Biol Evol 24:1926-1933.
Roy, S. W., and D. Penny. 2007b. A very high fraction of unique intron positions in the intron-
rich diatom Thalassiosira pseudonana indicates widespread intron gain. Mol Biol Evol
24:1447-1457.
Roy, S. W., and D. Penny. 2006. Large-scale intron conservation and order-of-magnitude
variation in intron loss/gain rates in apicomplexan evolution. Genome Res 16:1270-1275.
Saitou, N., and M. Nei. 1987. The neighbor-joining method: a new method for reconstructing
phylogenetic trees. Mol Biol Evol 4:406-425.
Schaffer, A. A., L. Aravind, T. L. Madden, S. Shavirin, J. L. Spouge, Y. I. Wolf, E. V. Koonin,
and S. F. Altschul. 2001. Improving the accuracy of PSI-BLAST protein database

searches with composition-based statistics and other refinements. Nucleic Acids Res
29:2994-3005.
Schwarz, G. 1978. Estimating the dimensions of a model. Ann Stat 6:461-464.
Simpson, A. G., E. K. MacQuarrie, and A. J. Roger. 2002. Eukaryotic evolution: early origin of
canonical introns. Nature 419:270.
Sonnhammer, E. L., and V. Hollich. 2005. Scoredist: a simple and robust protein sequence
distance estimator. BMC Bioinformatics 6:108.
Steel, M. A. 1994. Recovering a tree from the leaf colourations it generates under a Markov
model. Appl Math Lett 7:19-24.
Stoltzfus, A., D. F. Spencer, M. Zuker, J. M. Logsdon, Jr., and W. F. Doolittle. 1994. Testing the
exon theory of genes: the evidence from protein structure. Science 265:202-207.
Studier, J. A., and K. J. Keppler. 1988. A note on the neighbor-joining algorithm of Saitou and
Nei. Mol Biol Evol 5:729-731.
Sverdlov, A. V., M. Csuros, I. B. Rogozin, and E. V. Koonin. 2007. A glimpse of a putative pre-
intron phase of eukaryotic evolution. Trends Genet 23:105-108.
Sverdlov, A. V., I. B. Rogozin, V. N. Babenko, and E. V. Koonin. 2005. Conservation versus
parallel gains in intron evolution. Nucleic Acids Res 33:1741-1748.
Tatusov, R. L., N. D. Fedorova, J. D. Jackson, A. R. Jacobs, B. Kiryutin, E. V. Koonin, D. M.
Krylov, R. Mazumder, S. L. Mekhedov, A. N. Nikolskaya, B. S. Rao, S. Smirnov, A. V.
Sverdlov, S. Vasudevan, Y. I. Wolf, J. J. Yin, and D. A. Natale. 2003. The COG database:
an updated version includes eukaryotes. BMC Bioinformatics 4:41.
Vanacova, S., W. Yan, J. M. Carlton, and P. J. Johnson. 2005. Spliceosomal introns in the deep-
branching eukaryote Trichomonas vaginalis. Proc Natl Acad Sci U S A 102:4430-4435.
Yang, Z. 2007. PAML 4: Phylogenetic Analysis by Maximum Likelihood. Mol Biol Evol.
Ying, S. Y., and S. L. Lin. 2005. Intronic microRNAs. Biochem Biophys Res Commun 326:515-
520.

Figure legends
Figure 1. Inferred intron gains and losses in the evolution of eukaryotes.
On each branch, the positive number is the intron gain estimate and the negative number is the
intron loss estimate. Double lines highlight branches dominated by intron gain. The discs indicate
the inferred intron density at deep ancestors. The boxed numbers next to the chromalveolate
lineages give the intron count in diatom or the inferred intron content in the group’s common
ancestor.
Figure 2. Origin of alveolate introns.
Bars show the predicted branch on which modern introns were gained in the respective species.
Numbers next to the organism names show the number of introns in the data set for the species;
numbers within the bars show the inferred numbers of introns of different provenance. For each
species, the surveyed branches are the terminal species-specific branch, the branch descending
from the alveolate ancestor (to the apicomplexan or ciliate ancestor), as well as the branches
Chromalveolata-Alveolata, Bikonta-Chromalveolata, root-Bikonta, and the protoeukaryote
branch leading to the root (branches are identified by the descendant taxon). For P. falciparum
and T. annulata, the branch leading from the apicomplexan ancestor to the genus ancestor
(Plasmodium or Theileria) is also considered.
Figure 3. Intron densities in the analyzed eukaryotic species and inferred intron densities
for ancestral forms.
For the ancestral forms (internal nodes of the tree), 95% confidence intervals are shown by the
error bars, which were established by bootstrapping (see Methods). Scaling on the right-hand side

was obtained by projecting the intron counts onto density by using human as reference (4603
introns in coding sequences of total length 671877 bp).

Table 1. Introns shared between taxa*.
Theile
ria
Plasmo
dium
Ciliates Phytoph
thora
Viridipl
antae
Animals Opistho
konts
AFV
Theileria
(692)
100 13 9 4 17 17 23 29
Plasmodiu
m (195)
46 100 16 8 21 17 23 29
Ciliates
(824)
7 4 100 4 17 18 23 28
Phytophtho
ra (288)
10 6 12 100 32 31 45 48
*Numbers denote percentages, computed as the fraction of all introns from taxa in the row’s
clade that coincide with at least one member of the column’s set. “AFV” column refers to all
animals, fungi, plants and green algae in the data set. The numbers of intron-bearing sites are
shown in parentheses in the row headers.

Table 2: Distribution of shared introns in alveolate lineages (Plasmodium, Theileria,
Paramecium, Tetrahymena)*.
Lineages Shared Unique
1 299 999
2 96 125
3 or 4 22 10
*The “Shared” column shows the distribution of the number of alveolate lineages in which a site
is occupied by introns that are also shared with at least one non-alveolate lineage. The “Unique”
column shows the same distribution for intron-bearing sites that are unique to alveolates.

Alveolata
Animals
Viridiplantae
Fungi
Phytophthora
Ciliates
Theileria
+289-25
+690-353
+106-274
+630-502
+29-11
+760-16
+0-555
+237-1509
+451-1547
+135-502
diatom
+106-626
Eukaryota
Plasmodium
+155-312
+33-709
Apicomplexa
Chromalveolata
Heterokonta
Opisthokonta272
118
664
684
165

110
215141
56
243
142
76
93
10570
39
132
136102
2328
28
0
100
200
300
400
500
600
700
P. falciparum (155) T. annulata (633) T. thermophyla (493) P. tetraurelia (462)
intro
n c
ou
nt
species genus Apicomplexa/Ciliophora Alveolata Eukaryota

2000
1000
intro
n co
unt
Hsa
p Met
azoa
Am
el
Tcas
Fung
i
Pchr
Ccin
Pbla
Rory
Osa
tPl
anta
ePt
riA
tha
Crei
Ota
u
Api
com
plex
aTp
arTa
nn Thei
leria
Pber
Pcha
Pfal Plas
mod
ium
PyoePr
amPs
oj Phyt
opht
hora
Ftri
Cilio
phor
a
Tthe
Ptet
Alv
eola
ta
Opi
sthok
onta
Viri
dipl
anta
eCh
rom
alve
olat
aEu
kary
ota
Het
erok
onta
2
4
6
intro
ns p
er k
bp

Extremely intron-rich genes in thealveolate ancestors inferred with
a flexible maximum likelihoodapproach
Supplementary Material
Miklos Csuros, Igor B. Rogozin, and Eugene V. Koonin
Contents
1 Analyzed species, genome assembly and source 2
2 Relaxed conservation criteria 4
3 Eukaryotic phylogeny 6
4 Neighborhood of the optimum 10
5 Weaving algorithm for ortholog selection 12
1
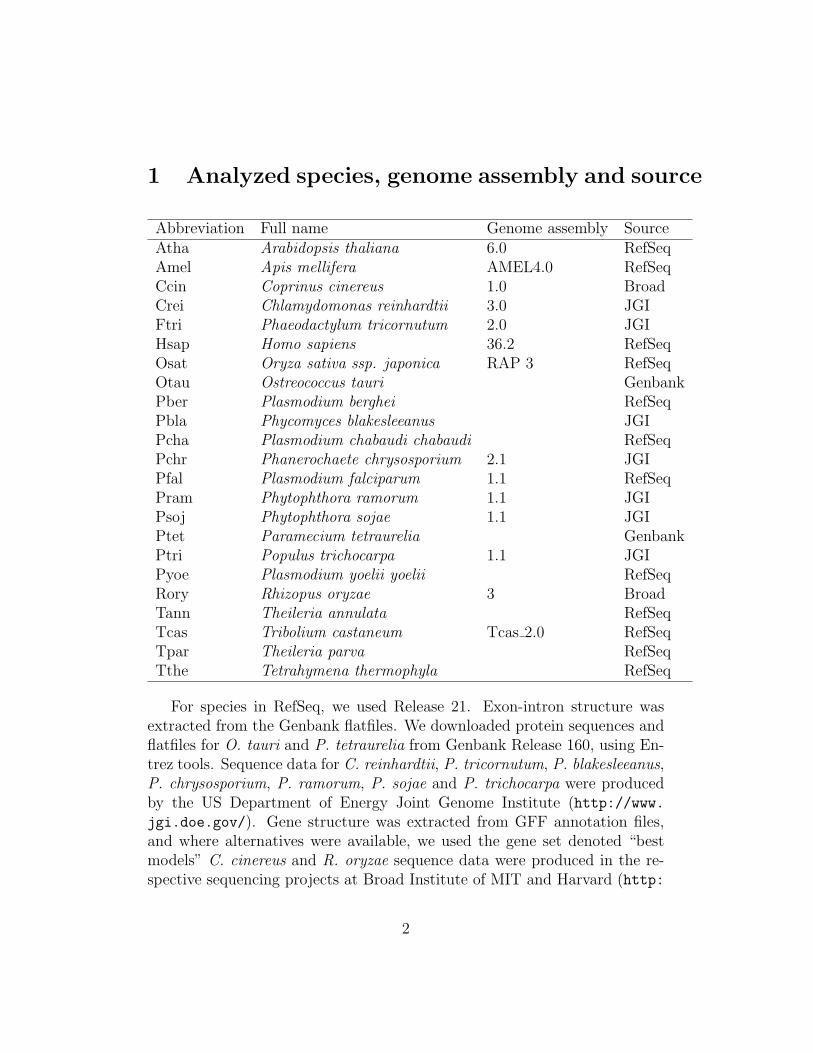
1 Analyzed species, genome assembly and source
Abbreviation Full name Genome assembly SourceAtha Arabidopsis thaliana 6.0 RefSeqAmel Apis mellifera AMEL4.0 RefSeqCcin Coprinus cinereus 1.0 BroadCrei Chlamydomonas reinhardtii 3.0 JGIFtri Phaeodactylum tricornutum 2.0 JGIHsap Homo sapiens 36.2 RefSeqOsat Oryza sativa ssp. japonica RAP 3 RefSeqOtau Ostreococcus tauri GenbankPber Plasmodium berghei RefSeqPbla Phycomyces blakesleeanus JGIPcha Plasmodium chabaudi chabaudi RefSeqPchr Phanerochaete chrysosporium 2.1 JGIPfal Plasmodium falciparum 1.1 RefSeqPram Phytophthora ramorum 1.1 JGIPsoj Phytophthora sojae 1.1 JGIPtet Paramecium tetraurelia GenbankPtri Populus trichocarpa 1.1 JGIPyoe Plasmodium yoelii yoelii RefSeqRory Rhizopus oryzae 3 BroadTann Theileria annulata RefSeqTcas Tribolium castaneum Tcas 2.0 RefSeqTpar Theileria parva RefSeqTthe Tetrahymena thermophyla RefSeq
For species in RefSeq, we used Release 21. Exon-intron structure wasextracted from the Genbank flatfiles. We downloaded protein sequences andflatfiles for O. tauri and P. tetraurelia from Genbank Release 160, using En-trez tools. Sequence data for C. reinhardtii, P. tricornutum, P. blakesleeanus,P. chrysosporium, P. ramorum, P. sojae and P. trichocarpa were producedby the US Department of Energy Joint Genome Institute (http://www.jgi.doe.gov/). Gene structure was extracted from GFF annotation files,and where alternatives were available, we used the gene set denoted “bestmodels” C. cinereus and R. oryzae sequence data were produced in the re-spective sequencing projects at Broad Institute of MIT and Harvard (http:
2
OsatO. sativa (rice)
AthaA. thaliana
PtriP. trichocarpa (poplar)
CreiC. reinhardtii
OtauO. tauri
PberP. berghei
PyoeP. yoelii
PchaP. chabaudi
PfalP. falciparum
TparT. parva
TannT. annulata
PramP. ramorum
PsojP. sojae
TtheTetrahymena thermophyla
PtetParamecium tetraurelia
FtriP. tricornutum (diatom)
Api
com
plex
ans
Ciliates
Heterokonts
Plants
Alveolata
Chromalveolata
Gre
en
alga
e
Plasm
odium
Theiler
ia
Phytophthora
PblaP. blakeesleanus Rory
R. oryzae
CcinC. cinereus
PchrP. chrysosporium
TcasT. castaneum (beetle)
AmelA. mellifera (bee)
HsapH. sapiens
Anim
als
Zygomycota
Basidiomycota
Opisthokonta
Fungi
Viridiplantae
Eukaryota
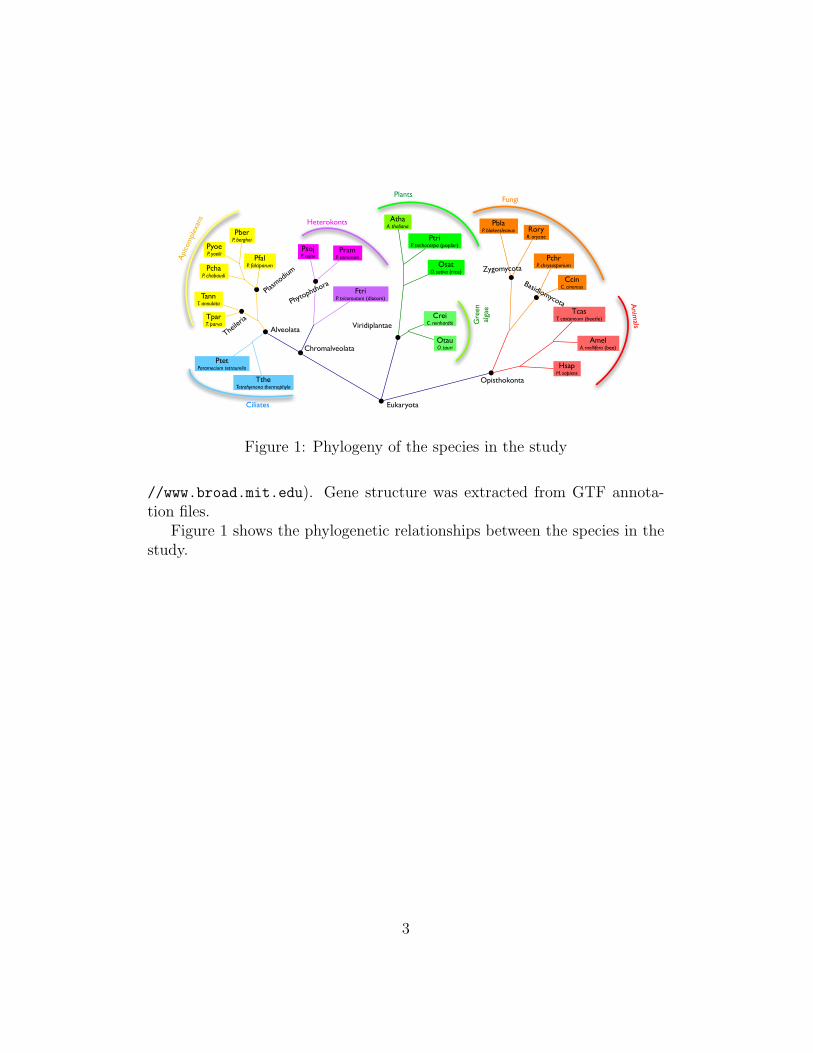
Figure 1: Phylogeny of the species in the study
//www.broad.mit.edu). Gene structure was extracted from GTF annota-tion files.
Figure 1 shows the phylogenetic relationships between the species in thestudy.
3
2 Relaxed conservation criteria
We experimented with different criteria for identifying homologous intronsites. For compiling an alternative data set based on less strict conserva-tion rules, we employed the following procedure. For each set of orthologousproteins, a multiple alignment was constructed using MUSCLE [5], and theintron sites relative to the coding sequences were projected onto them, as de-scribed previously [14, 13]. Aligned intron-bearing sites with identical phaseswere considered homologous. Sites were propagated to further analysis byinspecting sequence conservation around them. For each intron site withineach sequence, the number of non-gap amino acid positions was counted toits left and right. If the total number of those positions was at least 6, andthe site was not a phase-3 intron site on a gap boundary, then the intronsite in the studied sequence was categorized as solid. If the number of solidpositions in a site was at least 18, then it was included in the intron data set.In solid positions, 0 and 1 were used to encode absence and presence, respec-tively, whereas in non-solid positions, and for missing sequences an ambiguitycharacter was used. The intron data set was compiled by concatenating theintron site information from all orthologous sets.
The alternative data set obtained this way comprises 420 orthologousgene families with 10136 intron-bearing sites. Figure 2 shows the predictedancestral intron densities.
4

2000
1000
intro
n co
unt
Hsa
p Met
azoa
Am
el
Tcas
Fung
i
Ccin
Pchr
Pbla
Rory
Osa
tPl
anta
ePt
riA
tha
Crei
Ota
u
Api
com
plex
aTh
eile
riaTp
arTa
nn
Plas
mod
ium
Pfal
Pyoe
Pber
PchaPs
ojPr
amPh
ytop
htho
ra
Ftri
Cilio
phor
a
Tthe
Ptet
Alv
eola
ta
Opi
sthok
onta
Viri
dipl
anta
eBi
kont
aH
eter
okon
taCh
rom
alve
olat
a
2
4
6
intro
ns p
er k
bp
Figure 2: Predicted intron density at terminal and inner nodes of the phy-logeny using the alternative data set with relaxed conservation criteria. Forinner nodes, 95% confidence intervals are shown by the error bars, which wereestablished by bootstrapping. Scaling on the right-hand side is obtained byprojecting the intron counts onto the human intron density of the data set(4962 introns in coding sequences of total length 720945 bp).
5

Opisthokonta
Viridiplantae
Chromalveolata A
C
B
Figure 3: Three different root placements.
3 Eukaryotic phylogeny
The evolutionary tree used in our study reflects widely agreed phyloge-netic groupings [1, 12, 8], with three supergroups: Opisthokonts (animalsand fungi), Viridiplantae (land plants and green algae) and Chromalveolata(alveolates and heterokonts [also called stramenopiles]). Within Plasmod-ium species, we followed the phylogeny suggested by Roy and Hartl [15]: thebranching order between members of this clade has a negligible impact at ex-terior nodes. The placement of the root on the three deepest branches shownin Figure 3, however, is subject to some debate [9, 19, 17, 2]. Some aspectsof the debate [19, 17, 2] are outside the scope of our study as they revolvearound the placement of taxonomic groups such as Parabasalia that are notpresent in this study. Tree A shows a more traditional phylogeny [9] assum-ing a Crown group implied by the monophyly of plants and animals. Tree Ccorresponds to the hypothetical monophyly [19] of Bikonta (chromalveolatesand plants). For the sake of completeness, we also investigated the case of amonophyletic group for chromalveolates and opisthokonts with Tree B.
Figures 4–6 show the predicted ancestral intron densities. Figure 7 com-pares directly the predictions using the relaxed conservation criteria (Sec-tion 2), or different tree rootings. While rooting has a negligible effect on theestimates, the relaxed conservation criteria bring about a slightly lower den-sity estimate at the alveolan ancestor. Nevertheless, given the error levels,the values are not qualitatively different. The relaxed conservation criteria
6

2000
1000
intro
n co
unt
Hsa
p Met
azoa
Am
el
Tcas
Fung
i
Pchr
Ccin
Pbla
Rory
Osa
tPl
anta
ePt
riA
tha
Crei
Ota
u
Api
com
plex
aTp
arTa
nn Thei
leria
Pber
Pcha
Pfal Plas
mod
ium
PyoePr
amPs
oj Phyt
opht
hora
Ftri
Cilio
phor
aTt
he
Ptet
Alv
eola
ta
Opi
sthok
onta
Viri
dipl
anta
eCh
rom
alve
olat
aCr
own
Het
erok
onta
2
4
6
intro
ns p
er k
bp
Figure 4: Predicted intron density at terminal and inner nodes of Tree A.
2000
1000
intro
n co
unt
Hsa
p Met
azoa
Am
el
Tcas
Fung
i
Pchr
Ccin
Pbla
Rory
Plan
tae
Osa
tPt
riA
tha
Crei
Ota
u
Api
com
plex
aTp
ar
Tann Thei
leria
Pber
Pcha
Pfal Plas
mod
ium
PyoePr
amPs
oj Phyt
opht
hora
Ftri
Cilio
phor
a
Tthe
Ptet
Alv
eola
ta
Viri
dipl
anta
eO
pisth
okon
taCh
rom
alve
olat
a
Opi
sthko
nta+
Chro
mal
veol
ata
Het
erok
onta
2
4
6
intro
ns p
er k
bp
Figure 5: Predicted intron density at terminal and inner nodes of Tree B.
7
2000
1000
intro
n co
unt
Hsa
p Met
azoa
Am
el
Tcas
Fung
i
Pchr
Ccin
Pbla
Rory
Osa
tPl
anta
ePt
riA
tha
Crei
Ota
u
Api
com
plex
aTp
arTa
nn Thei
leria
Pber
Pcha
Pfal Plas
mod
ium
PyoePr
amPs
oj Phyt
opht
hora
Ftri
Cilio
phor
aTt
he
Ptet
Alv
eola
ta
Opi
sthok
onta
Euka
ryot
aV
iridi
plan
tae
Chro
mal
veol
ata
Biko
nta
Het
erok
onta
2
4
6
intro
ns p
er k
bp
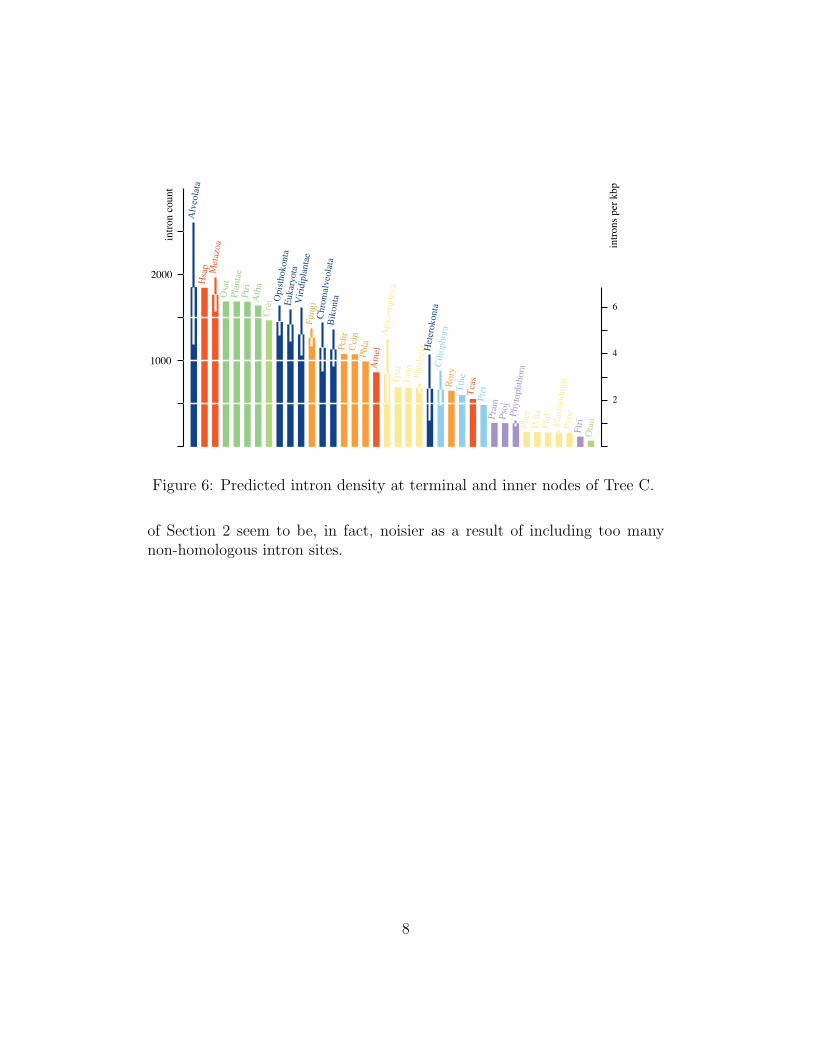
Figure 6: Predicted intron density at terminal and inner nodes of Tree C.
of Section 2 seem to be, in fact, noisier as a result of including too manynon-homologous intron sites.
8

0%
20%
40%
60%
80%
100%
120%
140%
160%
Apicomplexa Ciliophora Alveolata Heterokonta Chromalveolata
Intr
on
de
nsi
ty w
ith
re
spe
ct t
o h
um
an
main text relaxed conservation Tree A Tree B Tree C`
Figure 7: Comparison of predicted intron densities. Y axis plots the relativeintron densities normalized by the number of human introns in the data set.Error bars show 95% confidence intervals computed from 1000 bootstrapreplicates.
9
4 Neighborhood of the optimum
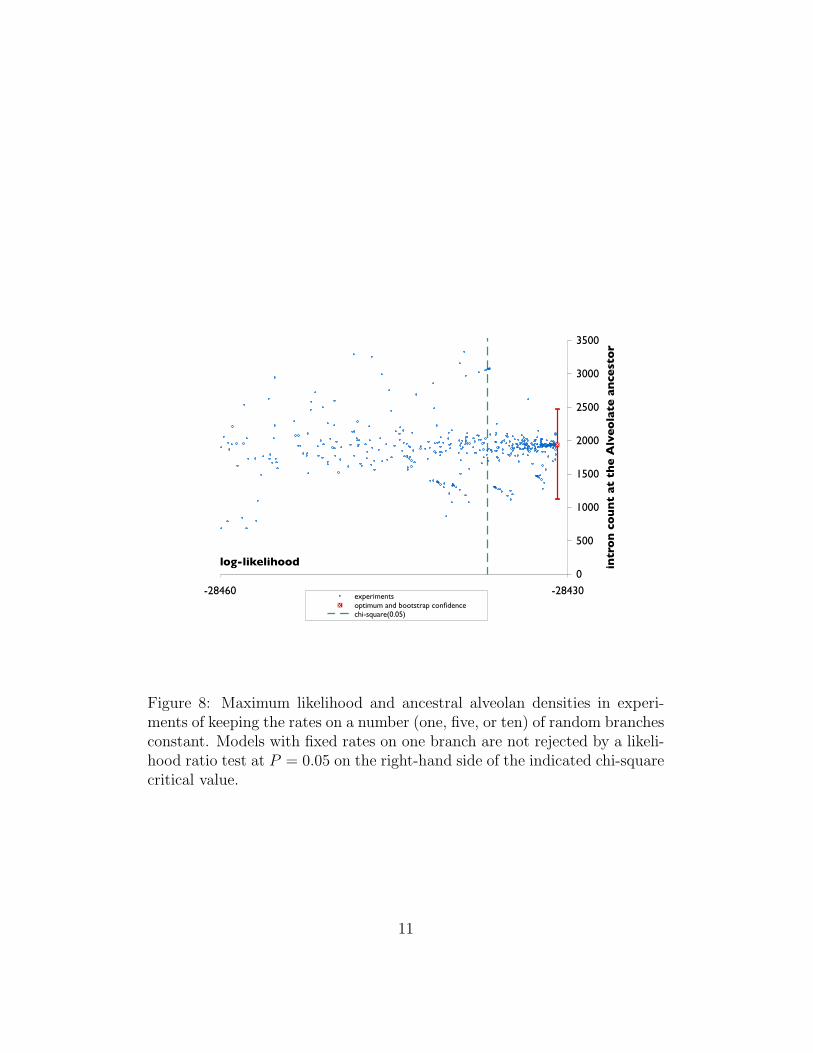
We conducted a number of experiments exploring the neighborhood of theoptimal model parameters. Namely, in each experiment we fixed loss andgain parameters on some branches at some random values, and performedthe numerical optimization of the likelihood while keeping those parametersconstant. The random values were chosen by imposing an exponential distri-bution with mean equal to the original optimized value. The procedure wasrepeated 500 times with one, five, or ten selected random branches for fixingthe rates. Figure 8 shows the results of these experiments. The experimentscan be compared to the original optimum by using a likelihood ratio test [7].Specifically, the test statistic is the ratio of the likelihood optima L1, L0 be-tween fixed-rate models and freely-variable rate models, respectively, i.e.,
Λ =L0
L1
.
Since the models are nested, (−2 ln Λ) has a chi-square distribution with 2tdegrees of freedom, where t is the number of branches on which rates arekept constant. Figure 8 plots the critical value for P = 0.05 and t = 1: thedensity estimates in this area are typically close to the original estimate, andhave an equivalent spread to the bootstrap confidence interval.
10
0
500
1000
1500
2000
2500
3000
3500
-28460 -28430
log-likelihood intr
on
co
un
t at
th
e A
lve
ola
te a
nce
sto
rexperimentsoptimum and bootstrap confidencechi-square(0.05)
Figure 8: Maximum likelihood and ancestral alveolan densities in experi-ments of keeping the rates on a number (one, five, or ten) of random branchesconstant. Models with fixed rates on one branch are not rejected by a likeli-hood ratio test at P = 0.05 on the right-hand side of the indicated chi-squarecritical value.
11
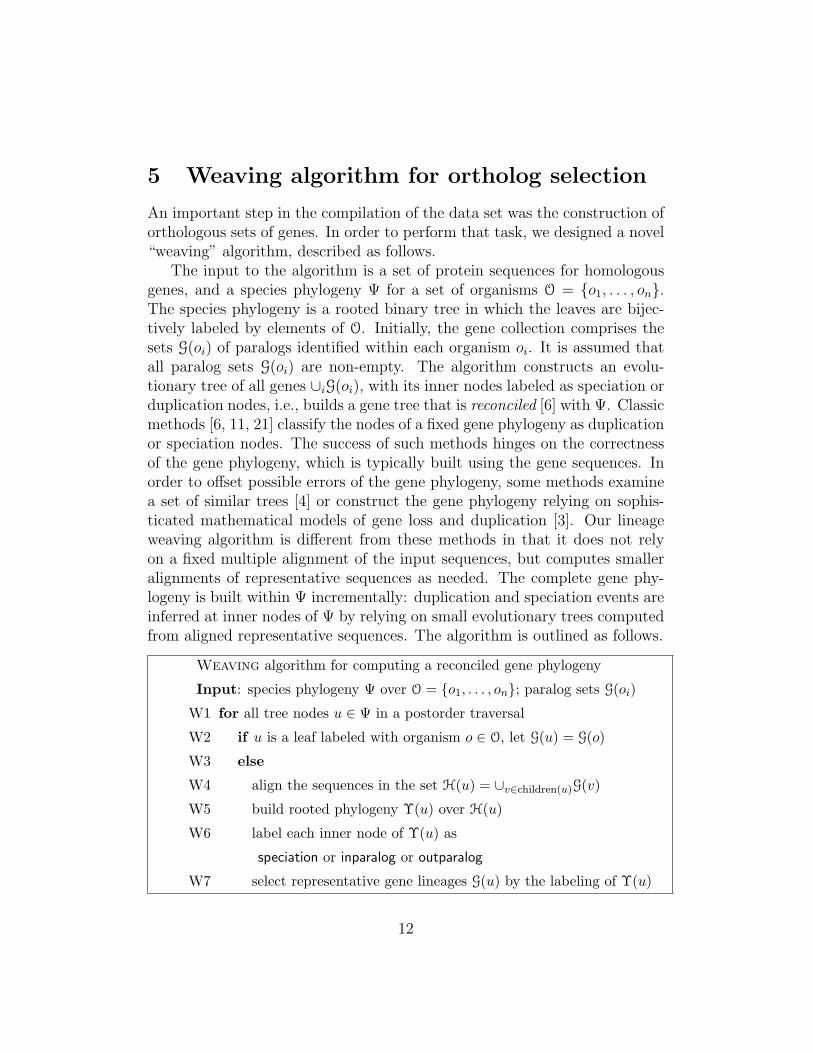
5 Weaving algorithm for ortholog selection
An important step in the compilation of the data set was the construction oforthologous sets of genes. In order to perform that task, we designed a novel“weaving” algorithm, described as follows.
The input to the algorithm is a set of protein sequences for homologousgenes, and a species phylogeny Ψ for a set of organisms O = {o1, . . . , on}.The species phylogeny is a rooted binary tree in which the leaves are bijec-tively labeled by elements of O. Initially, the gene collection comprises thesets G(oi) of paralogs identified within each organism oi. It is assumed thatall paralog sets G(oi) are non-empty. The algorithm constructs an evolu-tionary tree of all genes ∪iG(oi), with its inner nodes labeled as speciation orduplication nodes, i.e., builds a gene tree that is reconciled [6] with Ψ. Classicmethods [6, 11, 21] classify the nodes of a fixed gene phylogeny as duplicationor speciation nodes. The success of such methods hinges on the correctnessof the gene phylogeny, which is typically built using the gene sequences. Inorder to offset possible errors of the gene phylogeny, some methods examinea set of similar trees [4] or construct the gene phylogeny relying on sophis-ticated mathematical models of gene loss and duplication [3]. Our lineageweaving algorithm is different from these methods in that it does not relyon a fixed multiple alignment of the input sequences, but computes smalleralignments of representative sequences as needed. The complete gene phy-logeny is built within Ψ incrementally: duplication and speciation events areinferred at inner nodes of Ψ by relying on small evolutionary trees computedfrom aligned representative sequences. The algorithm is outlined as follows.
Weaving algorithm for computing a reconciled gene phylogeny
Input: species phylogeny Ψ over O = {o1, . . . , on}; paralog sets G(oi)
W1 for all tree nodes u ∈ Ψ in a postorder traversal
W2 if u is a leaf labeled with organism o ∈ O, let G(u) = G(o)
W3 else
W4 align the sequences in the set H(u) = ∪v∈children(u)G(v)
W5 build rooted phylogeny Υ(u) over H(u)
W6 label each inner node of Υ(u) as
speciation or inparalog or outparalog
W7 select representative gene lineages G(u) by the labeling of Υ(u)
12

inparalogsspeciationoutparalogs
organismal lineage 1 organismal lineage 2
node u
representative sequences
Figure 9: Labeling the nodes of an intermediate gene phylogeny as speciationor duplication (inparalogs/outparalogs) nodes
Sequence alignment (Line W4) In order to align the sequences, we usedthe program Muscle [5].
Phylogeny construction (Line W5) Pairwise distances between thesequences were computed from the multiple alignment by the heuristic ofSonnhammer and Hollich [18]. Genealogies were built using a custom im-plementation of Neighbor-Joining [16]. In order to root the unrooted treecomputed by Neighbor-Joining, we placed the root on the longest branch inthe last step of the algorithm (where only three nodes are left).
Resolving speciation and duplication nodes (Line W6) Figure 9illustrates interior node labeling in the gene tree Υ(u). The labeling is com-puted in a postorder tree traversal, by the following rules. (1) A node islabeled as inparalog if its children are all either leaves, or inparalog nodesfrom the same organismal lineage. (2) A node is labeled as speciation if itsdescendants are leaves or inparalog nodes from different organismal lineages.(3) A node is labeled as outparalog otherwise (i.e., if a child is a speciationnode, or an outparalog node). Notice that by construction, the root of Υ(u)may not be an inparalog.
13

prune back to speciation nodes
propagate lineages toward root
Figure 10: Selection of representative gene lineages
Selection of representatives (Line W7) Figure 10 illustrates the se-lection of representative lineages. In that step, Υ(u) is transformed into aset F(u) of disjoint rooted trees (i.e., a forest in graph theory) in a top-downtraversal, so that every resulting tree is either rooted at a speciation node, oris a single leaf (i.e., corresponding to an original representative sequence fromthe child lineages). Specifically, this step employs a queue data structure Qinitialized with the root of Υ(u). Then, as long as Q is not empty, the firstnode is removed from the front of Q, and if it is not a leaf or a speciationnode, then its children are added at the end of Q. From each disjoint lineagetree, a representative sequence is selected for the set G(u).
At the end of the algorithm, a complete reconciled gene phylogeny canbe recovered by using the intermediate forests F(u). The largest orthologouslineage is computed by dynamic programming in a postorder traversal of thereconciled gene tree.
The underlying logic of our procedure is that gene duplications can bedated by evidence of earlier speciation events. In lack of such evidence, genelineages are propagated towards the root of the species tree (i.e., older speci-ation events). The main weakness of our heuristic ortholog selection is thatlineage-specific gene loss or misidentified homologs [10] may result in errors.In our case, such errors were filtered out in a later step where the phylogeny ofthe selected putative orthologs was computed with a sophisticated likelihood
14
method [20] and compared to the canonical species phylogeny.The advantage of our weaving method is its computational expedience,
by virtue of the fact that typically only a few sequences need to be aligned atLine W4, and that only small trees are built in Line W5. As a consequence, itis especially useful in genome-wide comparative studies across a large numberof organisms, where it is not uncommon that hundreds of homologs need tobe processed at a time.
References
[1] S. M. Adl, A. G. B. Simpson, M. A. Farmer, R. A. Andersen, O. R. Anderson,J. R. Barta, S. S. Bowser, G. Brugerolle, R. A. Fensome, S. Fredericq, T. Y.James, S. Karpov, P. Kugrens, J. Krug, C. E. Lane, L. A. Lewis, J. Lodge,D. H. Lynn, D. G. Mann, R. M. McCourt, L. Mendoza, Ø. Mostrup, S. E.Mozley-Standridge, T. A. Nerad, C. A. Shearer, A. V. Smirnov, F. W. Spiegel,and M. F. J. R. Taylor. The new higher level classification of eukaryotes withemphasis on the taxonomy of protists. Journal of Eukaryotic Microbiology,52(5):399–451, 2005.
[2] N. Arisue, M. Hasegawa, and T. Hashimoto. Root of the eukaryota tree asinferred from combined maximum likelihood analyses of multiple molecularsequence data. Molecular Biology and Evolution, 22(3):409–420, 2005.
[3] L. Arvestad, A.-C. Berglund, J. Lagergren, and B. Sennblad. Gene tree recon-struction and orthology analysis based on an integrated model for duplicationsand sequence evolution. In D. Gusfield, editor, RECOMB ’04: Proceedingsof the Eighth Annual International Conference on Research in ComputationalMolecular Biology, pages 326–335, New York, NY, 2004. ACM.
[4] K. Chen, D. Durand, and M. Farach-Colton. NOTUNG: a program for dat-ing gene duplications and optimizing gene trees. Journal of ComputationalBiology, 7(3/4):429–447, 2000.
[5] R. C. Edgar. MUSCLE: multiple sequence alignment with high accuracy andhigh throughput. Nucleic Acids Research, 32(5):1792–1797, 2004.
[6] M. Goodman, J. Czelusniak, G. W. Moore, A. E. Romero-Herrera, andG. Matsuda. Fitting the gene lineage into its species lineage, a parsimonystrategy illustrated by cladograms constructed from globin sequences. Sys-tematic Zoology, 28(2):132–163, 1979.
15

[7] J. P. Huelsenbeck and K. A. Crandall. Phylogeny estimation and hypothesistesting using maximum likelihood. Annual Review of Ecology, Evolution, andSystematics, 28:437–466, 1997.
[8] P. J. Keeling, G. Burger, D. G. Durnford, B. F. Lang, R. W. Lee, R. E.Pearlman, A. J. Roger, and M. W. Gray. The tree of eukaryotes. Trends inGenetics, 20(12):670–676, 2005.
[9] P. J. Keeling and J. D. Palmer. Parabasalian flagellates are ancient eukaryotes.Nature, 405:635–637, 2000.
[10] E. V. Koonin. Orthologs, paralogs, and evolutionary genomics. Annual Reviewof Genetics, 39:309–338, 2005.
[11] R. D. M. Page and M. A. Charleston. Reconciled trees and incongruentgene and species trees. In B. Mirkin, F. R. McMorris, F. S. Roberts, andA. Rzhetsky, editors, Mathematical Hierarchies in Biology, volume 37 of DI-MACS Series in Discrete Mathematics and Theoretical Computer Science,pages 57–70. AMS, Providence, RI, 1997.
[12] L. W. Parfrey, E. Barbero, E. Lasser, M. Dunthorn, D. Bhattacharya, D. J.Patterson, and L. A. Katz. Evaluating support for the current classificationof eukaryotic diversity. PLoS Genetics, 2(12):e220, 2006.
[13] I. B. Rogozin, A. V. Sverdlov, V. N. Babenko, and E. V. Koonin. Anal-ysis of evolution of exon-intron structure of eukaryotic genes. Briefings inBioinformatics, 6(2):118–134, 2005.
[14] I. B. Rogozin, Y. I. Wolf, A. V. Sorokin, B. G. Mirkin, and E. V. Koonin. Re-markable interkingdom conservation of intron positions and massive, lineage-specific intron loss and gain in eukaryotic evolution. Current Biology, 13:1512–1517, 2003.
[15] S. W. Roy and D. L. Hartl. Very little intron loss/gain in plasmodium: Intronloss/gain mutation rates and intron number. Genome Research, 16(6):750–756, 2006.
[16] N. Saitou and M. Nei. The neighbor-joining method: a new method forreconstructing phylogenetic trees. Molecular Biology and Evolution, 4(4):406–425, 1987.
[17] A. G. B. Simpson and A. J. Roger. Eukaryotic tree: getting to the root ofthe problem. Current Biology, 12:R691–R693, 2002.
16

[18] E. L. L. Sonnhammer and V. Hollich. Scoredist: A simple and robust proteinsequence distance estimator. BMC Bioinformatics, 6:108, 2005.
[19] A. Stechmann and T. Cavalier-Smith. Rooting the eukaryote tree by using aderived gene fusion. Science, 297:89–91, 2002.
[20] Z. Yang. PAML 4: Phylogenetic analysis by maximum likelihood. MolecularBiology and Evolution, 24(8):1586–1591, 2007.
[21] C. M. Zmasek and S. R. Eddy. A simple algorithm to infer gene duplicationand speciation events on a gene tree. Bioinformatics, 17(9):821–828, 2001.
17