extraordinary leadership
TRANSCRIPT
The Extraordinary Leader
Turning Good Managers
into Great Leaders
Presented by Jack Zenger and Joe Folkman
2
The Extraordinary Leader Research • The last two years were spent researching the
impact of leadership performance and the key behaviors that make great leadership possible
• The source of our insight – hundreds of thousands of 360 assessments done over the past 10 years
• Our approach – lead with the data• The result – New insights that fundamentally
change our philosophy and approach
3
Insight 1
• Great Leaders Make a Great Difference.
4
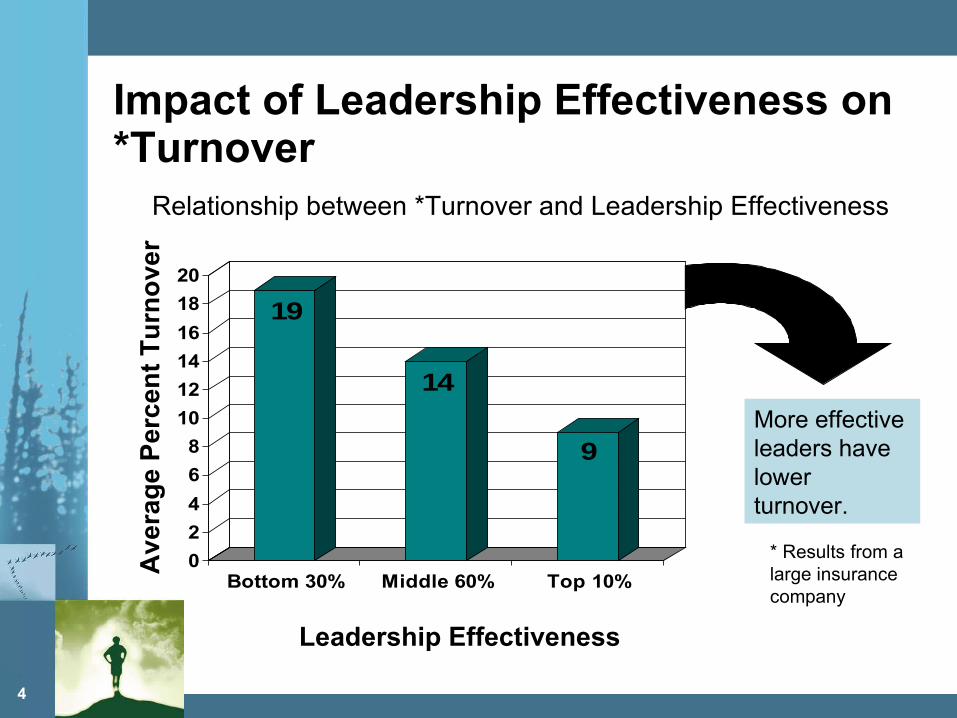
Impact of Leadership Effectiveness on *Turnover
19
14
9
0
2
4
6
8
10
12
14
16
18
20
Bottom 30% Middle 60% Top 10%
More effective leaders have lower turnover.
Relationship between *Turnover and Leadership Effectiveness
Av
era
ge
Per
cen
t T
urn
ove
r
Leadership Effectiveness
* Results from a large insurance company
5
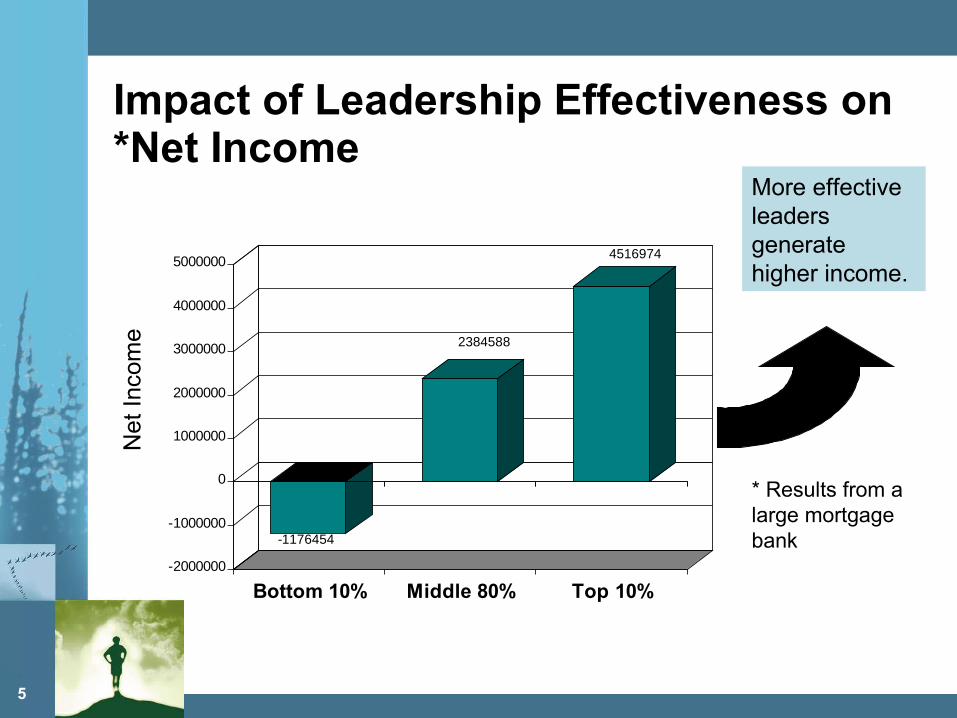
Impact of Leadership Effectiveness on *Net Income
Net
Inc
ome
More effective leaders generate higher income.
-1176454
2384588
4516974
-2000000
-1000000
0
1000000
2000000
3000000
4000000
5000000
Bottom 10% Middle 80% Top 10%
* Results from a large mortgage bank
6
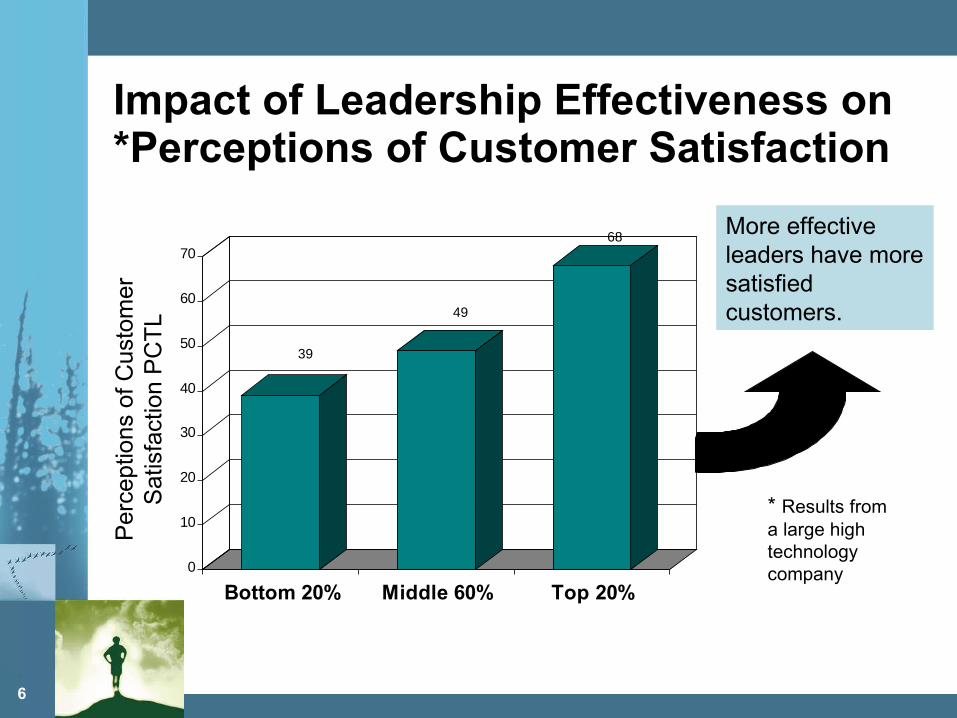
Impact of Leadership Effectiveness on *Perceptions of Customer Satisfaction
Per
cept
ions
of C
usto
mer
S
atis
fact
ion
PC
TL
More effective leaders have more satisfied customers.
39
49
68
0
10
20
30
40
50
60
70
Bottom 20% Middle 60% Top 20%
* Results from a large high technology company
7
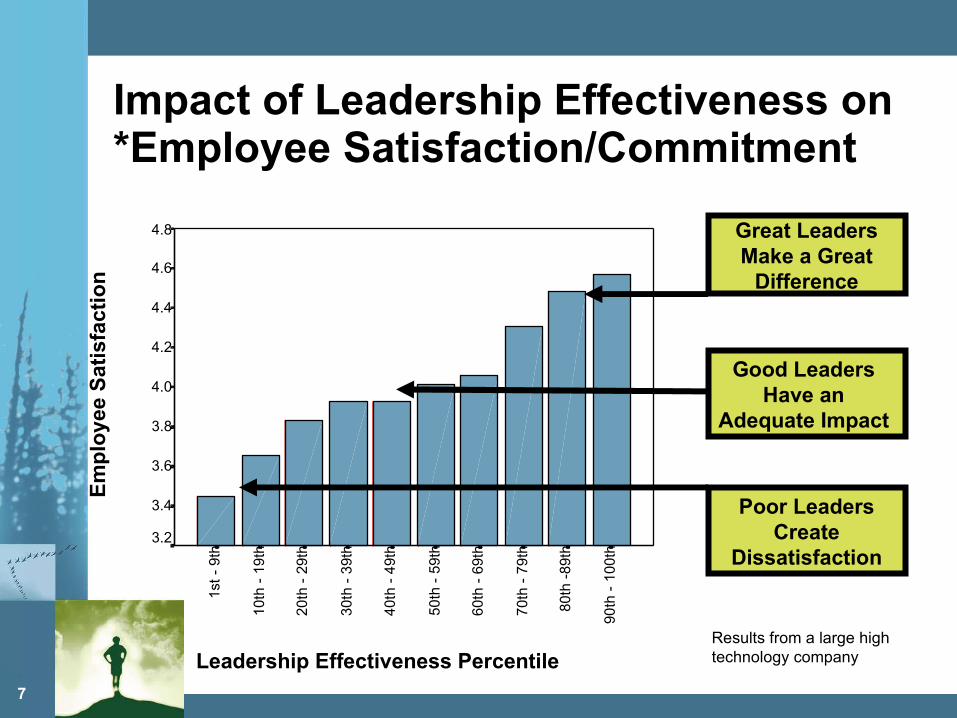
Impact of Leadership Effectiveness on *Employee Satisfaction/Commitment
Results from a large high technology companyLeadership Effectiveness Percentile
Em
plo
yee
Sat
isfa
ctio
n
90th
- 1
00th
80th
-89
th
70th
- 7
9th
60th
- 6
9th
50th
- 5
9th
40th
- 4
9th
30th
- 3
9th
20th
- 2
9th
10th
- 1
9th
1st
- 9t
h4.8
4.6
4.4
4.2
4.0
3.8
3.6
3.4
3.2
Poor LeadersCreate
Dissatisfaction
Good Leaders Have an
Adequate Impact
Great LeadersMake a Great
Difference
8
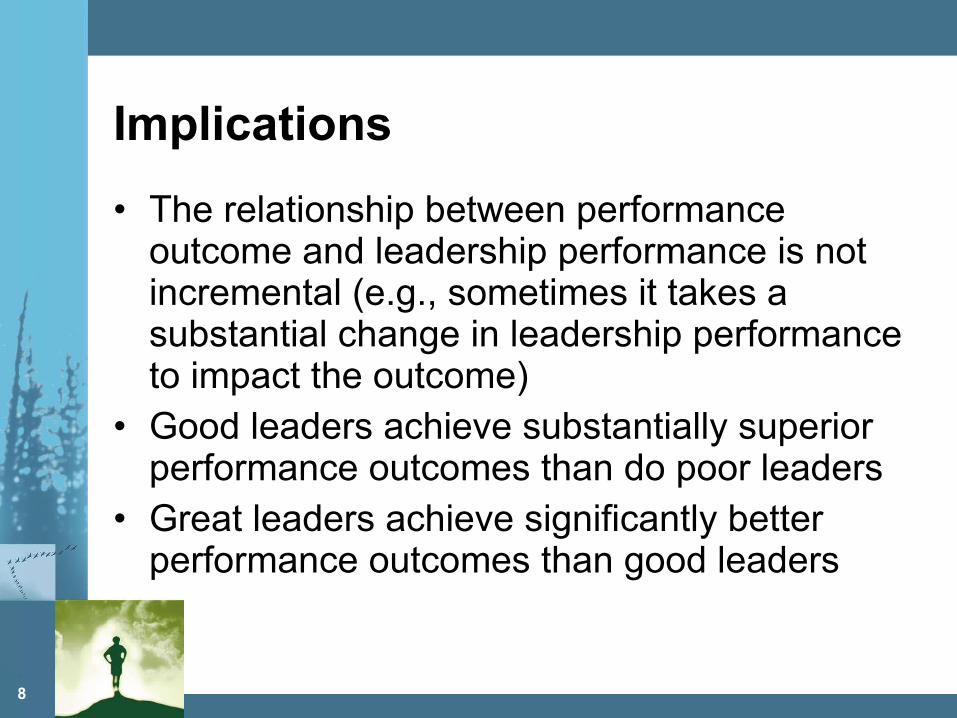
Implications
• The relationship between performance outcome and leadership performance is not incremental (e.g., sometimes it takes a substantial change in leadership performance to impact the outcome)
• Good leaders achieve substantially superior performance outcomes than do poor leaders
• Great leaders achieve significantly better performance outcomes than good leaders

9
Insight 2
• Current approaches to development primarily focus on fixing weaknesses
10
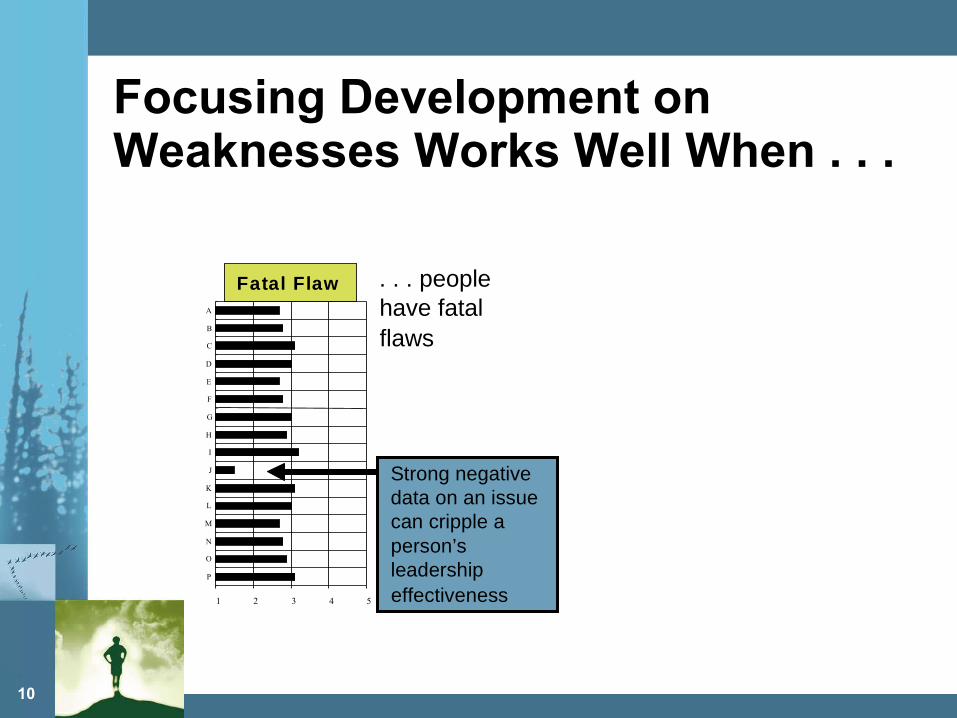
Focusing Development on Weaknesses Works Well When . . .
Fatal Flaw
1 2 3 4 5
P
O
N
M
L
K
J
I
H
G
F
E
D
C
B
A
. . . people have fatal flaws
Strong negative data on an issue can cripple a person’s leadership effectiveness
11
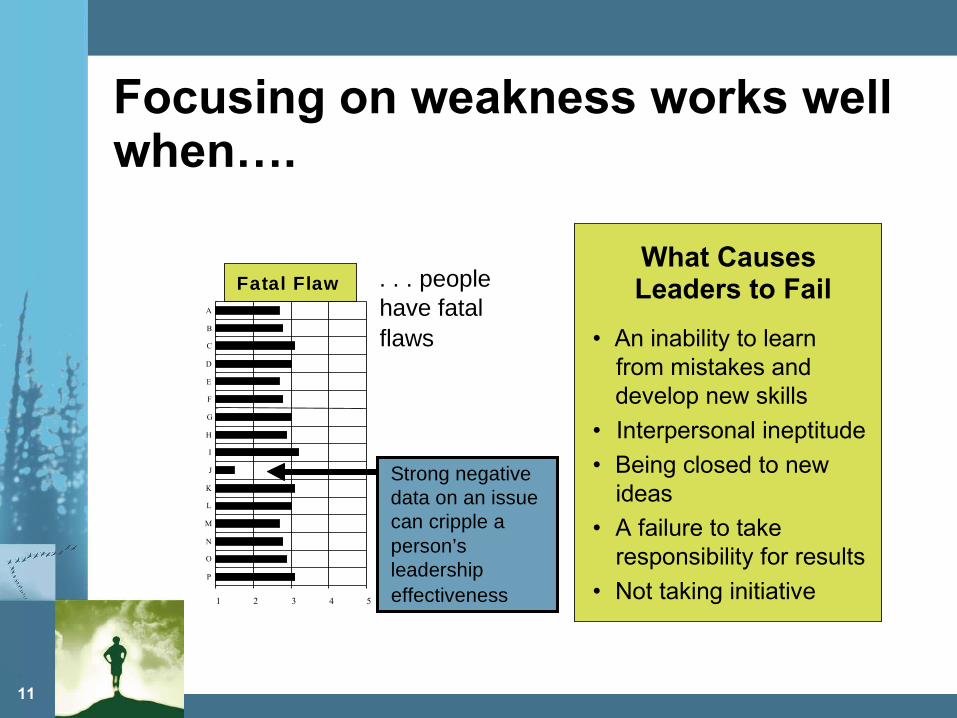
Focusing on weakness works well when….
Fatal Flaw
1 2 3 4 5
P
O
N
M
L
K
J
I
H
G
F
E
D
C
B
A
. . . people have fatal flaws
Strong negative data on an issue can cripple a person’s leadership effectiveness
What Causes Leaders to Fail
• An inability to learn from mistakes and develop new skills
• Interpersonal ineptitude
• Being closed to new ideas
• A failure to take responsibility for results
• Not taking initiative
12
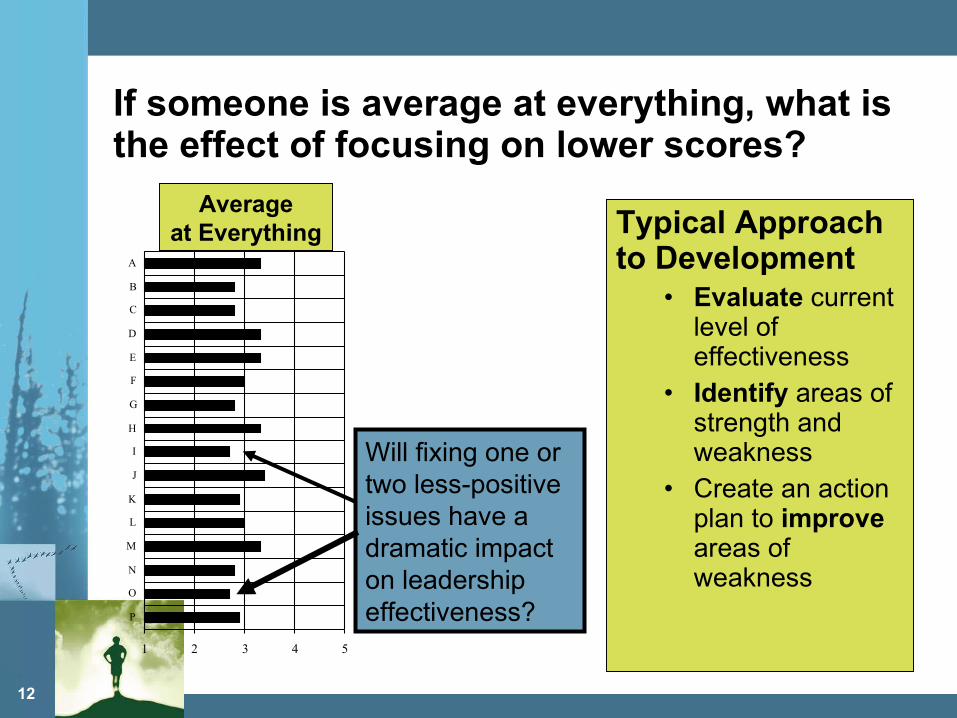
If someone is average at everything, what is the effect of focusing on lower scores?
Typical Approach to Development
• Evaluate current level of effectiveness
• Identify areas of strength and weakness
• Create an action plan to improve areas of weakness
Averageat Everything
1 2 3 4 5
P
O
N
M
L
K
J
I
H
G
F
E
D
C
B
A
Will fixing one or two less-positive issues have a dramatic impact on leadership effectiveness?
13
What Does Performance Improvement Mean to Most People?
This philosophy for improvement is reinforced by:• Educational experience• Performance management approaches• Culture
Fixing Weaknesses
14
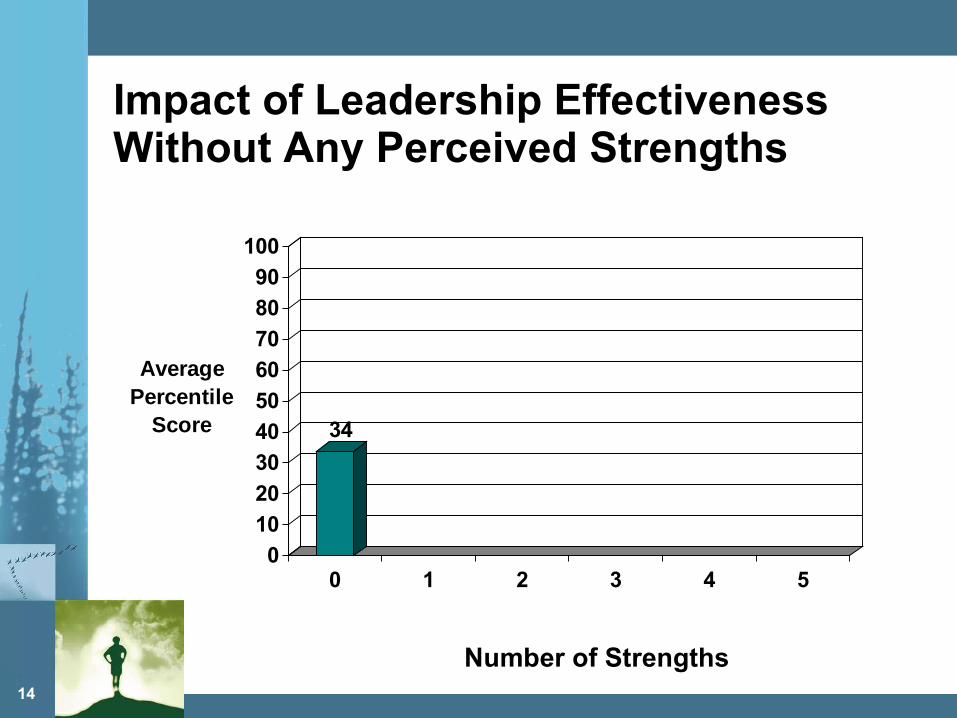
Impact of Leadership Effectiveness Without Any Perceived Strengths
34
0
10
20
30
40
50
60
70
80
90
100
Average Percentile
Score
0 1 2 3 4 5
Number of Strengths
15
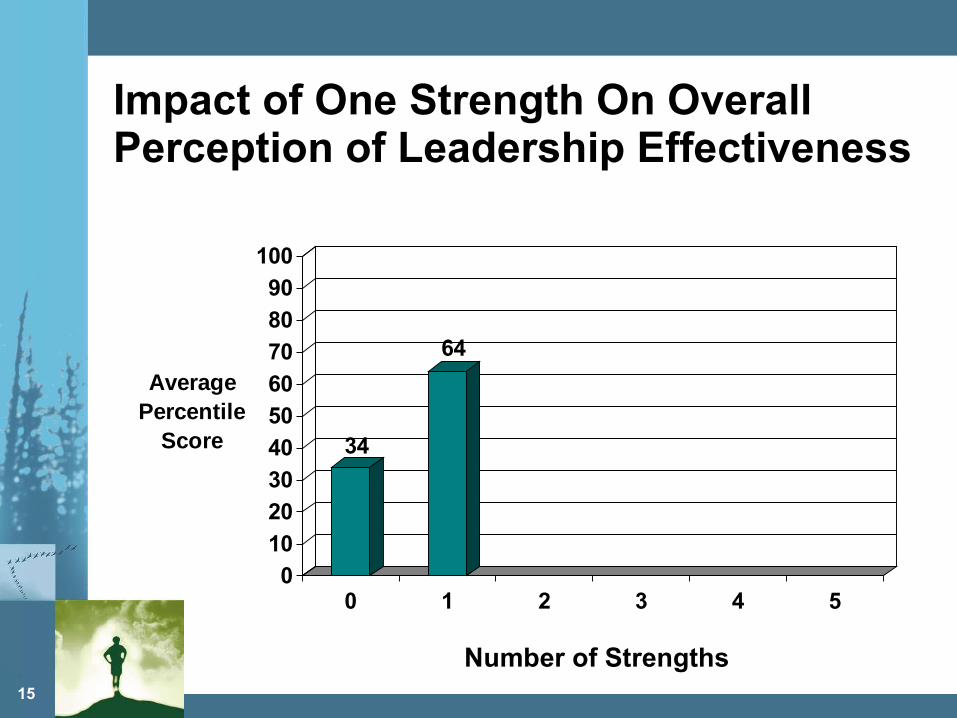
Impact of One Strength On Overall Perception of Leadership Effectiveness
34
64
0
10
20
30
40
50
60
70
80
90
100
Average Percentile
Score
0 1 2 3 4 5
Number of Strengths
16
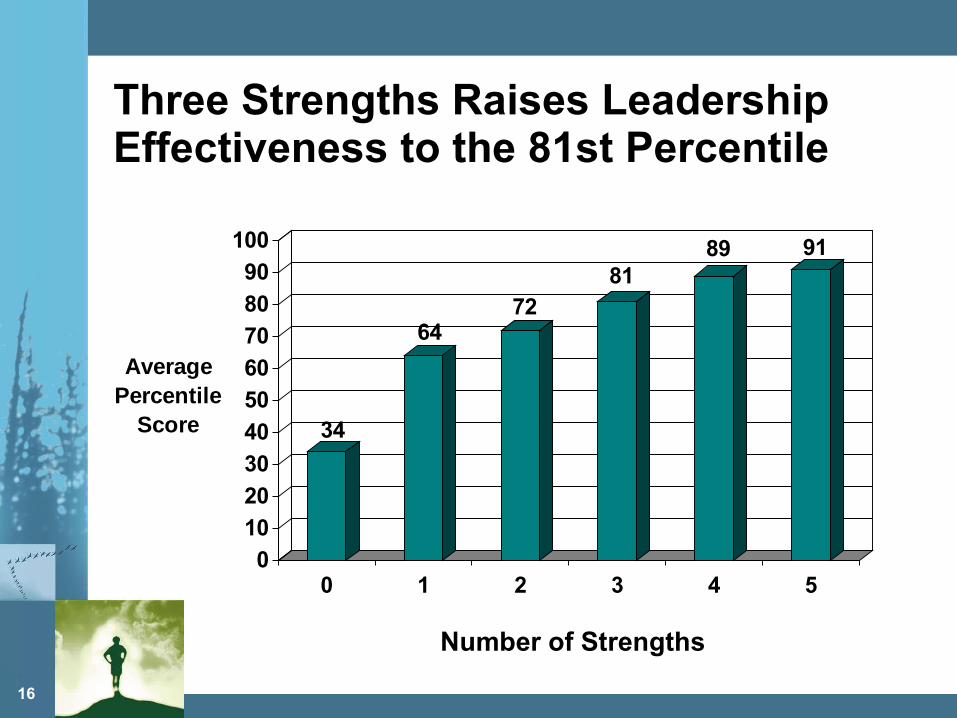
Three Strengths Raises Leadership Effectiveness to the 81st Percentile
34
6472
8189 91
0
10
20
30
40
50
60
70
80
90
100
Average Percentile
Score
0 1 2 3 4 5
Number of Strengths

17
Insight 3
• Powerful Combinations
18
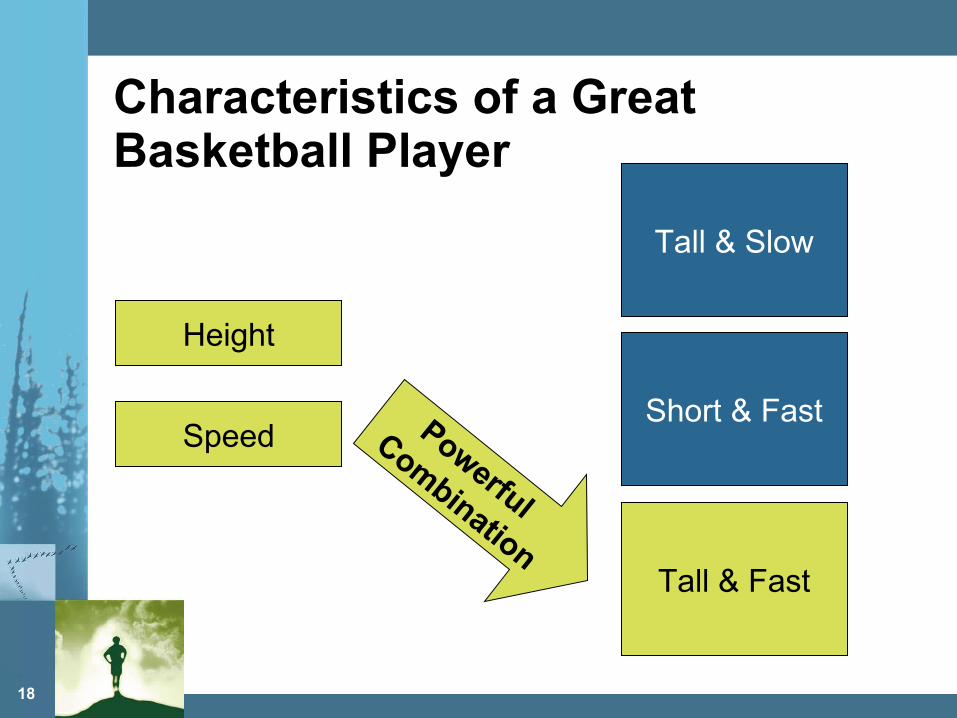
Characteristics of a Great Basketball Player
Height
Speed
Tall & Slow
Tall & Fast
Short & FastPowerful
Combination
19
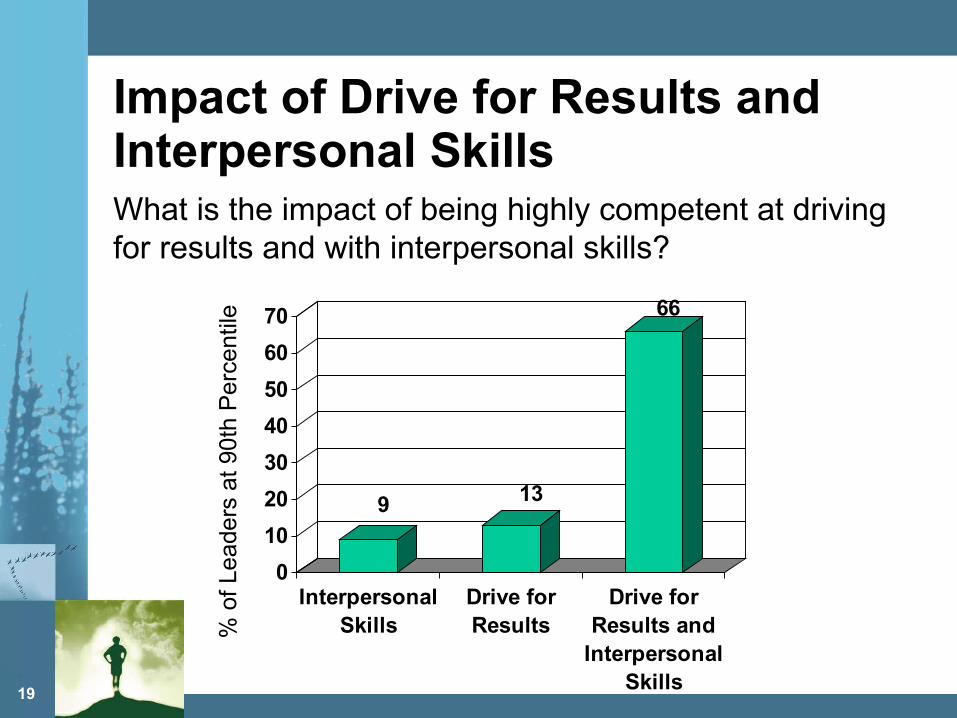
Impact of Drive for Results and Interpersonal Skills
9 13
66
0
10
20
30
40
50
60
70
InterpersonalSkills
Drive forResults
Drive forResults and
InterpersonalSkills
% o
f Le
ader
s at
90t
h P
erce
ntile
What is the impact of being highly competent at driving for results and with interpersonal skills?
20
Insight 4
• Not all behaviors are created equal – some are more noticeable and leverage more improvement than others
21
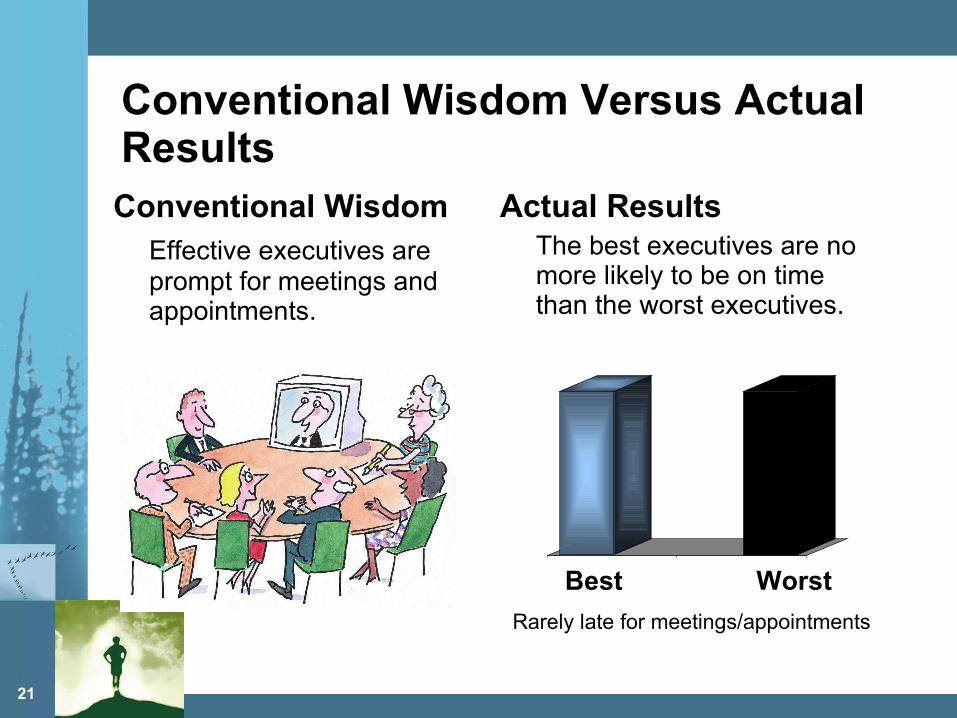
Conventional Wisdom Versus Actual ResultsConventional Wisdom
Effective executives are prompt for meetings and appointments.
Actual ResultsThe best executives are no more likely to be on time than the worst executives.
Rarely late for meetings/appointments
Best Worst
22
The Research
• Compiled a data set of 200,000 evaluations on 20,000 people
• Contrasted the highest performing 10% to the lowest performing 10%
• Found the behaviors that best differentiated between the best and the worst
• The behaviors not only told us what high performers did right, but also what the low performers did wrong
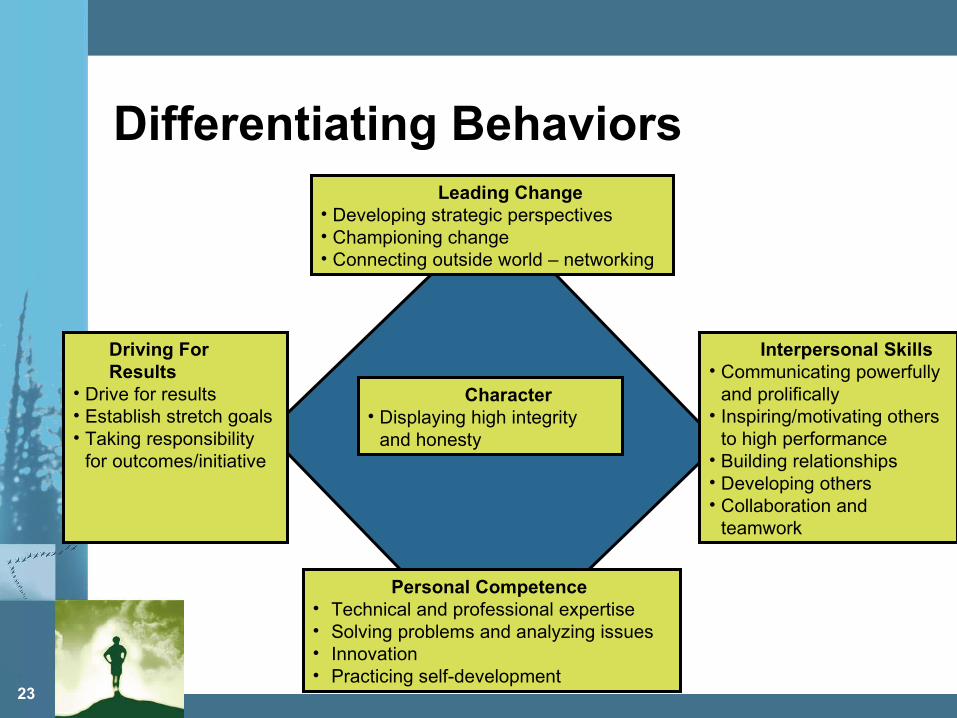
23
Differentiating BehaviorsLeading Change
• Developing strategic perspectives • Championing change • Connecting outside world – networking
Character• Displaying high integrity
and honesty
Interpersonal Skills• Communicating powerfully
and prolifically• Inspiring/motivating others
to high performance • Building relationships• Developing others• Collaboration and
teamwork
Driving For Results
• Drive for results • Establish stretch goals• Taking responsibility
for outcomes/initiative
Personal Competence • Technical and professional expertise• Solving problems and analyzing issues• Innovation• Practicing self-development
24
Insight 5
• The non-linear approach to development may be the most helpful way to develop strengths
25
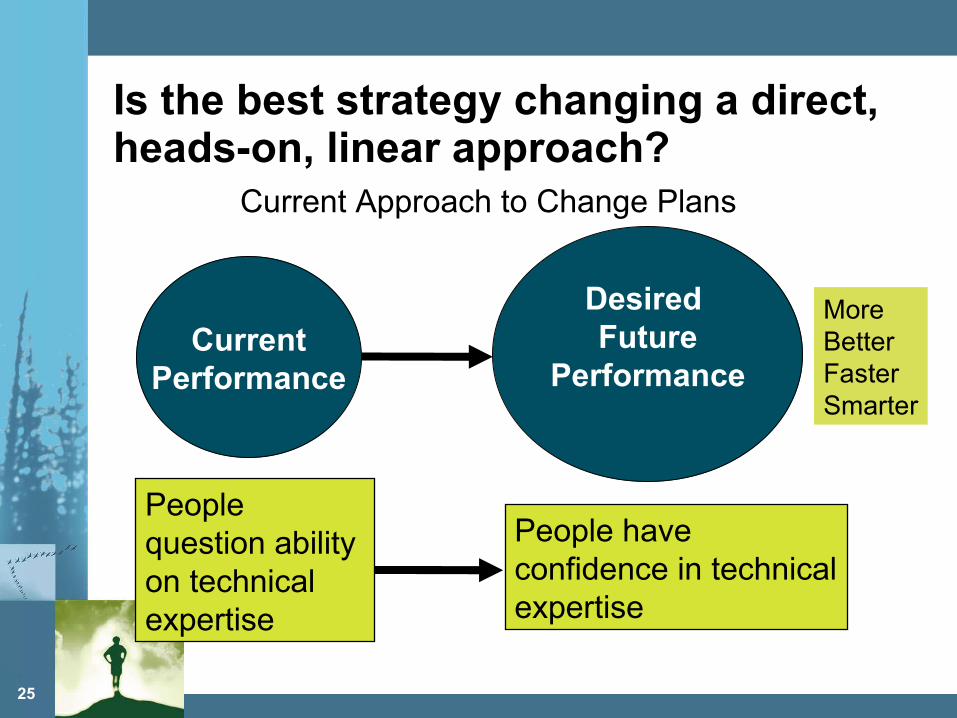
Is the best strategy changing a direct, heads-on, linear approach?
Current Approach to Change Plans
CurrentPerformance
People question ability on technical expertise
Desired Future
Performance
People have confidence in technical expertise
MoreBetterFasterSmarter
26
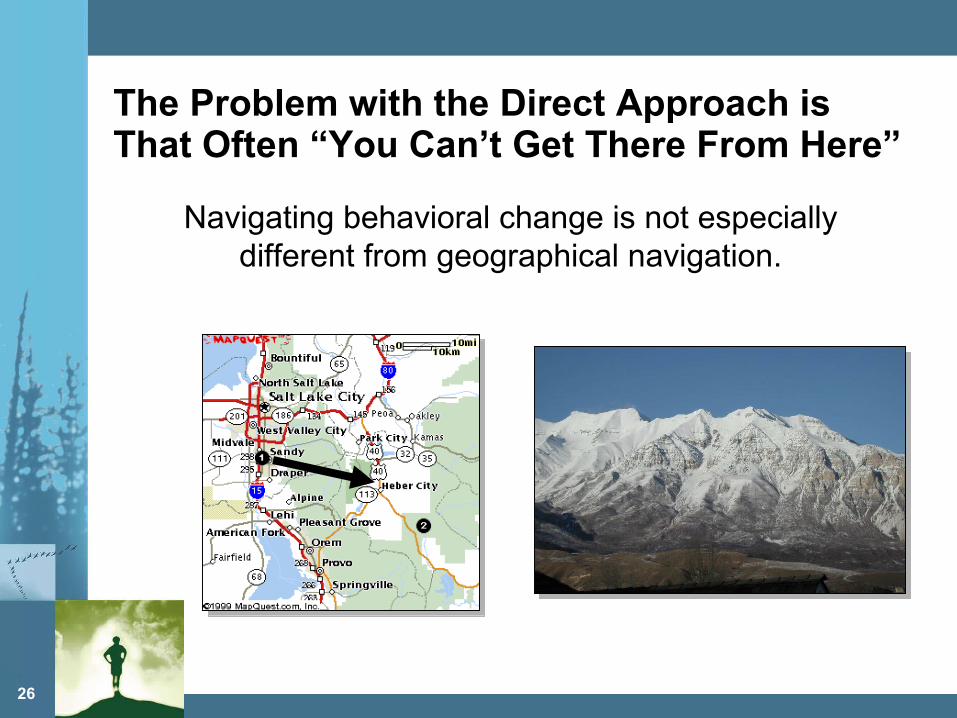
The Problem with the Direct Approach is That Often “You Can’t Get There From Here”
Navigating behavioral change is not especially different from geographical navigation.
27
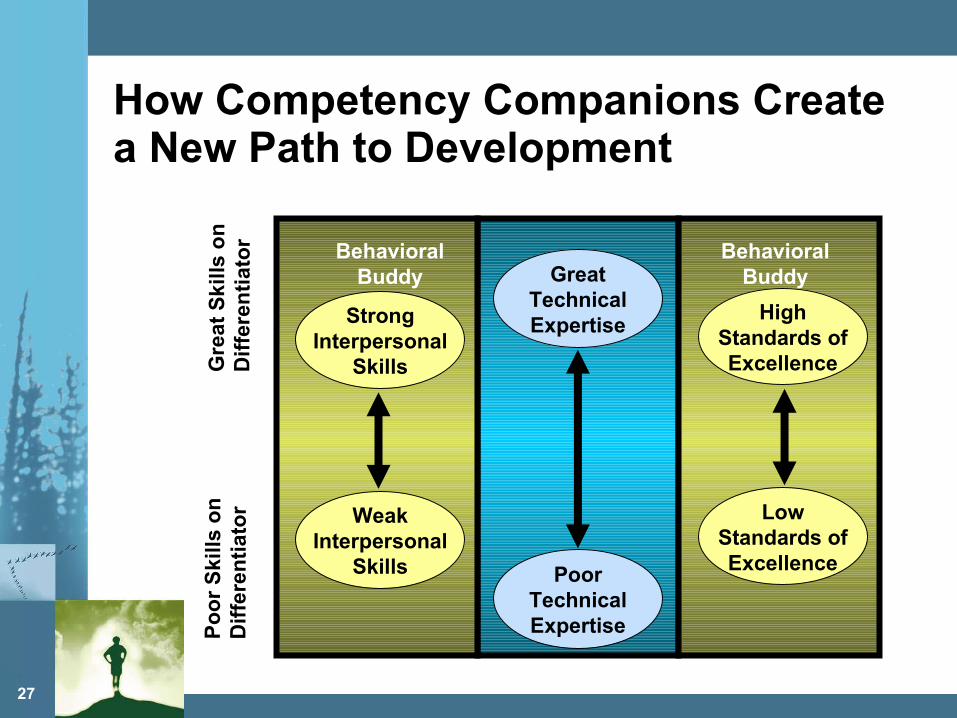
How Competency Companions Create a New Path to Development
GreatTechnicalExpertise
PoorTechnicalExpertise
Gre
at S
kills
on
Dif
fere
nti
ato
r
Po
or
Ski
lls o
nD
iffe
ren
tiat
or
StrongInterpersonal
Skills
WeakInterpersonal
Skills
BehavioralBuddy
HighStandards ofExcellence
LowStandards ofExcellence
BehavioralBuddy
Differentiator
28
How Do You Build Trust?
Competency Companions• Considerate of others• Open, friendly style• Non-competitive internally• Listen• Use candor
29
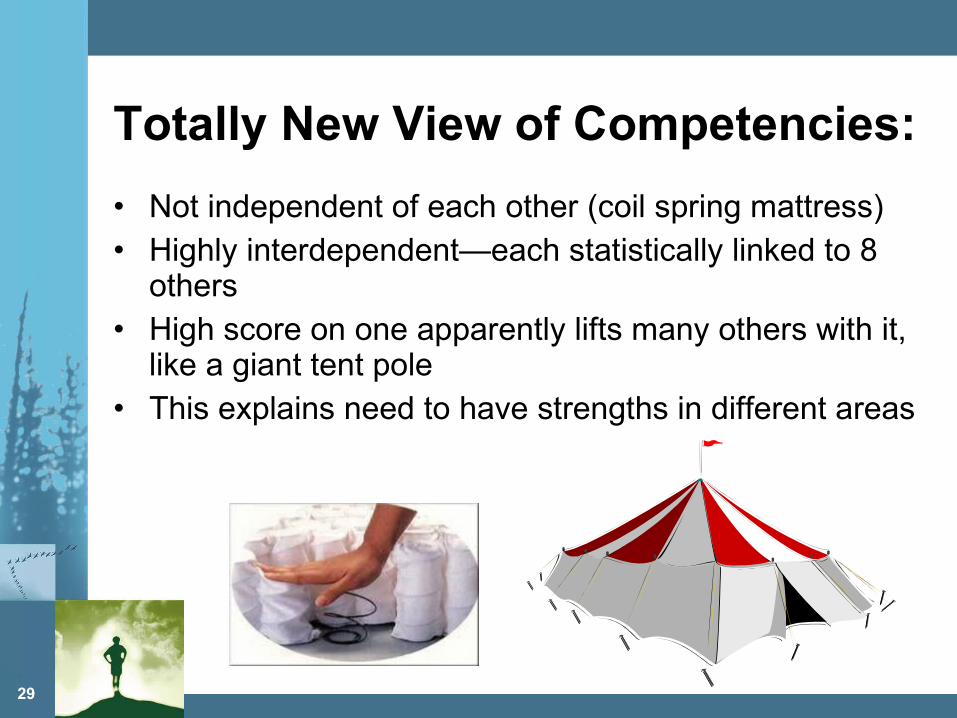
Totally New View of Competencies:
• Not independent of each other (coil spring mattress)• Highly interdependent—each statistically linked to 8
others• High score on one apparently lifts many others with it,
like a giant tent pole• This explains need to have strengths in different areas
30
Insight 6
• Change Requires Practice
31
Change Requires Practice
• Frequently, people underestimate the difficulty of some behavioral changes.
• A key to developing a new skill is finding a way to practice prior to getting in the game.
32
Summary• Effective leadership can impact bottom line results• Good leaders achieve more than poor leaders but
great leaders can produce a 2X impact on many outcomes
• If you have a fatal flaw, fix it• Building leadership strengths will substantially
influence the perception of leadership effectiveness• Not all behaviors are created equal – some are more
noticeable than others• Non-linear development is a new approach to change
that provides a unique path to developing strengths• To become extraordinary, leaders must practice
leadership