exploring the linkages between productivity and social ... · exploring the linkages between...
TRANSCRIPT

Centre for the Study of Living Standards 111 Sparks Street, Suite 500, Ottawa, ON K1P 5B5
Tel 613-233-8891 Fax 613-233-8250 [email protected]
Exploring the Linkages between Productivity and Social Development in Market Economies
Andrew Sharpe Executive Director
Centre for the Study of Living Standards
February 2004 CSLS Research Report 2004-02


Exploring the Linkages between Productivity and Social Development in Market Economies
TABLE OF CONTENTS Abstract............................................................................................................................ 5 Executive Summary ........................................................................................................ 6 I Introduction.......................................................................................................... 10
II Productivity and Social Development ................................................................ 14
The Impact of Productivity on Social Well-being: The Cases of Government Balances and Environmental Sustainability........................................................... 16
Social Determinants of Productivity: Education, Health, and Social Divergence .................................................................................................. 18
1) Impact of Education............................................................................. 18
2) Impact of Health .................................................................................. 19
3) Impact of Social Divergence ............................................................... 20
Should Productivity be a Social Priority?.............................................................. 21
Social Policy and Productivity............................................................................... 23
Key Themes on the Relationship between Productivity and Social Development ............................................................................................... 24
The CSLS Index of Economic Well-being: Weighting Tree................................. 27
III The CSLS Index of Economic Well-being: Identifying Linkages between
Productivity and Social Development ................................................................ 28
The Impact of Productivity on Economic Well-being........................................... 29
1) Consumption Flows............................................................................. 29
2) Stocks of Wealth.................................................................................. 33
3) Income Inequality ................................................................................ 35
4) Economic Security............................................................................... 36
The Impact of Economic Well-being on Productivity........................................... 37
1) Consumption Flows............................................................................. 37
2) Stocks of Wealth.................................................................................. 38
3) Income Inequality ................................................................................ 38

4) Economic Security............................................................................... 38 IV Empirical Evidence on the Linkage between Productivity and Poverty in
Developing Countries........................................................................................... 39
Contribution of Productivity Growth to Economic and GDP per Capita Growth in Developing Countries................................................................ 39
1) The Contribution of Productivity Growth to Economic Growth......... 39
2) The Contribution of Productivity Growth to GDP Per Capita Growth...................................................................................... 40
The Empirical Relationship Between Productivity, Poverty, and Income Inequality .................................................................................................. 42
The Relationship Between Productivity and Poverty Using Simple Regression Analysis............................................................................................... 42
The Relationship between Productivity, Poverty, and Income Distribution Using Multiple Regression Analysis ..................................................................... 57
The Relation Between Productivity and Poverty Using Alternative Measures of Poverty .............................................................................................. 60
Level Analysis ....................................................................................................... 61
Trend Analysis....................................................................................................... 64
Overall Findings..................................................................................................... 64 V Conclusion ............................................................................................................ 67 References ....................................................................................................................... 68

5
Exploring the Linkages between Productivity and Social Development in Market Economies
Abstract
This paper explores the linkages between productivity and social development from the perspective of synthesizing the findings of projects undertaken by the Centre for the Study of Living Standards in three related areas. The first is a project exploring the linkages between productivity and social well-being involving researchers from around the world and culminating in the edited volume Toward a Social Understanding of Productivity. Contributions discuss both linkages from productivity to social well-being, as in the case of productivity�s role in improving fiscal balances; and from social well-being to productivity, as in the case of social and cultural factors surrounding the desire and capacity of families to invest in the education of children having powerful long-term consequences in a knowledge-driven economy. The second area is the Index of Economic Well-being developed by the Centre for the Study of Living Standards. Each of the four components � consumption, stocks of wealth, equality and economic security � are positively affected by productivity, and some in addition can in turn positively affect productivity. The third area is statistical research into the relationship between productivity and poverty in developing countries. It is found that this relationship is even stronger than that between economic growth and poverty reduction, and about as important as that between GDP per capita growth and poverty reduction. It is also found that the level of income inequality mediates the relationship between productivity growth and poverty reduction. The greater the level of inequality and any increase in inequality, the less an increase in productivity and income will reduce poverty.

6
Exploring the Linkages between Productivity and
Social Development in Market Economies Executive Summary This paper explores the linkages between productivity and social development from the perspective of synthesizing the findings of projects undertaken by the Centre for the Study of Living Standards in three related areas:
• a project on the relationship between productivity and social progress which brought together researchers from Canada, Europe and Australia and New Zealand and resulted in the publication of an edited volume entitled Towards a Social Understanding of Productivity;
• the development of a measure of well-being called the Index of Economic
Well-being that goes beyond GDP to incorporate aspects of well-being such as environmental sustainability, inequality and security and work on the relationship between productivity and this measure of economic well-being; and
• background studies for the International Labour Organization�s 2004 World
Employment Report on the linkage between productivity growth and poverty reduction in developing countries and on China�s productvity performance.
The volume Towards a Social Understanding of Productivity documents specific
cases of the impact of productivity on social well-being as well as linkages running in the opposite direction, namely the social determinants of productivity. These links can be direct and immediate, such as real incomes being tightly tied to productivity trends. But they can also be indirect in the sense that higher real incomes do not necessarily translate directly into higher subjective economic security. They can also be weak. For example, productivity may have little or no observed effect on such important measures of social well-being as membership in associations and clubs. There is even the possibility that the relationship will be a negative one, for example when economic growth driven by productivity gains contributes to increased pollution.
Linkages running from social well-being to productivity performance are less well
documented but are likely to be significant. For example, the social and cultural factors surrounding the desire and capacity of families to invest in the education of children have powerful long-term consequences in a knowledge-driven economy.
One specific linkage from productivity to social well-being is through the fiscal
room to manoeuvre generated by increased productivity. Macroeconometric simulations of the Canadian economy to the year 2030 indicate that higher productivity growth can have a substantial cumulative impact on government revenues. These increased revenues could in turn be used to increase social well-being through expanded social spending

7
programs. Also, these programs, as well as possible tax cuts made possible by the higher government revenue, could have important impacts on further improving productivity growth, creating a virtuous circle from higher productivity growth to improved fiscal balances back to increased productivity growth.
The paper also discusses three examples of social well-being affecting productivity, namely in the cases of education, health and social diversity. It concludes that education can have a sizeable impact on productivity growth and economic performance. It also finds that the health-productivity relationship goes well beyond the obvious effect of health on capacity to work in terms of both energy level and working time. For instance, individuals with a longer life expectancy may choose to invest more in education as they receive greater returns from their investment. They may also be motivated to save more for retirement, which would lead to greater accumulation of physical capital. Finally, improvement in the survival and health of young children may provide incentives for reduced fertility and may result in increased labour-force participation. Social divergence and economic inequality are found to have a dampening effect on productivity through barriers to communication. However, this is not a sign that social homogeneity is to be preferred, as diversity can also have important social and economic benefits.
The paper also discusses whether productivity should be a social priority and the
linkages between social policy and productivity growth. Although productivity plays an important role in improving the consumption opportunities of individuals, it is not clear that this has translated into greater happiness, which for rich countries raises questions in devoting more resources to pursuing ever-faster productivity growth.
In the past the relationship between the equality fostered by social policy and
efficiency were seen as direct tradeoffs. More recent work, however, suggests that inequality may actually be harmful to economic growth, while many social policies promote growth. As a result, the policy-maker must make do without convenient intellectual crutches, and the implications of social programs for productivity must be assessed on a case-by-case basis.
The Centre for the Study of Living Standards has developed the Index of Economic
Well-being, which is based on four components of economic well-being. These components are flows of effective consumption, net societal accumulation of stocks of productive assets, poverty and inequality, and economic security from risks imposed by unemployment, illness, single parent poverty and poverty in old age. Productivity has a role in improving each of these components. In addition, independent improvements in some of the components can potentially improve productivity performance.
Productivity increases consumption because real incomes, which are driven by
productivity, are the primary determinant of consumption. Productivity also gives individuals choice in terms of taking more leisure time while maintaining their level of real wages. Non-working time is a part of effective consumption since individuals value this time at the level of the foregone after-tax wage. Increased life expectancy is also a part of effective consumption because individuals care about how much they consume

8
but also about how long they can consume it � and productivity can increase life expectancy, for example through providing higher incomes through which more investments in health can be made.
Stocks of wealth are also affected by productivity since productivity increases
raise national income, part of which is profits. Increased profits play a large role in increasing investment in physical capital as well as research and development, both of which contribute to stocks of productive assets. Productivity can, on the one hand, increase consumption of natural resources and goods that contribute to pollution, but on the other hand improve the efficiency with which natural resources are extracted and contribute to making production processes more environmentally friendly. The relationship between productivity and stocks of natural and environmental resources is hence not necessarily a negative one.
Productivity�s effect on poverty is ambiguous if a relative definition of poverty is
used, since the relationship will depend on how aggregate productivity gains are shared among different income groups. However, if an absolute definition of poverty is used, productivity will unambiguously decrease poverty as it lifts real incomes.
There no longer appears to be a belief that productivity increases unemployment
in the long-run, and indeed, the improvement to government balances made available by productivity increases can be used to make unemployment insurance programs more generous. Improved government balances may also increase health spending, decreasing the out-of-pocket expenditure required by individuals in instances of illness. Productivity�s effect on elderly and single parent poverty is the same as that for the overall population.
Virtuous circles are also evident for some components of the Index of Economic
Well-being and productivity. For example, investments in the stock of research and development play a large role in increasing productivity, which in turn can cause further investment, leading in turn back to higher productivity. Increased leisure time, a part of the consumption component of the Index, increases productivity measured on an hours basis since for a given level of output workers work more intensely for a shorter amount of time.
The work on productivity and social development discussed thus far applies
mainly to developed countries. Much previous literature has investigated the statistical relationships between poverty and economic growth/GDP per capita growth for developing countries, but very little work has been done on the relationship between productivity growth and poverty in developing countries. The Centre for the Study of Living Standards explored this relationship in detail in background papers for the International Labour Organization.
First of all, it was found that productivity growth accounts for a large share of
economic growth across all developing countries with a smaller role for population growth and growth in the employment to total population ratio. This, however, was not

9
the case for Africa, where population growth had the largest impact. In the case of GDP per capita, output per worker growth was much more important than growth in the employment to total population ratio in all developing countries.
Given the importance of productivity in output and GDP per capita, the
relationship between productivity and poverty, defined as the proportion of the population with less than $1US per day or $2US per day, is expected to be as important as the relationships between poverty and these same variables. Indeed, regressions of the change in poverty over the 1970-1998 period on growth in output per worker over this period show a better fit than when economic growth is the independent variable, and a comparable fit to regressions with GDP per capita growth as the independent variable. Similar conclusions hold for both the one dollar per day poverty rate and the two dollar per day rate, and across different developing regions.
Regression analysis was also undertaken for the level of poverty in 1998 on the
level of output per worker in 1998. A strong negative effect was again found, similar in magnitude and fit to that between the level of poverty and the level of GDP per capita. This conclusion holds for elasticities as well, and when alternative measures of poverty such as the Human Poverty Indicator are considered. Overall, the evidence suggests that productivity�s potential for decreasing poverty in developing countries has not been adequately recognized. Focus in previous research has been on GDP per capita, which indeed is driven by productivity.
It was also found through multivariate regression analysis of changes in poverty
on income inequality and productivity growth that the level of income inequality mediates the relationship between productivity growth and poverty reduction. The greater the level of inequality and any increase in inequality, the less an increase in productivity and income will reduce poverty.
These results provide strong support for the view that productivity growth is
essential for poverty reduction and should be a priority for developing countries. Consequently, the challenge developing countries face is to foster productivity growth, but at the same time to develop adjustment mechanisms that can protect those negatively affected by such productivity growth. It is important that productivity growth be seen by the population as the basis of the material advance of society and not associated with permanent job loss and catastrophic falls in income and living conditions. This is an issue of political economy.
In the end, the research undertaken by the Centre for the Study of Living Standards exploring the linkages between social development and productivity calls for a social understanding of productivity. Productivity does not simply enhance our material standard of living; it also expands the range of choices available. Increased productivity gives society the choice through both markets and the political arena of whether our greater economic well-being will manifest itself through greater private consumption goods, more public goods, additional leisure, or greater public transfers to increase equality and economic security.

10
Exploring the Linkages between Productivity and Social Development in Market Economies1
I Introduction
A key focus of the research agenda of the Centre for the Study of Living
Standards (CSLS)2 has recently been the linkages between productivity and social development in market economies, with particular but not exclusive reference to OECD countries. The CSLS has undertaken three major projects in this area:
• a project on the relationship between productivity and social progress which
brought towards researchers from Canada, Europe and Australia and New Zealand and resulted in the publication of an edited volume entitled Towards a Social Understanding of Productivity (Sharpe, Banting, and St-Hilaire, 2002);
• the development of a measure of well-being called the Index of Economic
Well-being that goes beyond GDP to incorporate aspects of well-being such as environmental sustainability, inequality and security (Osberg and Sharpe, 2002a) and work on the relationship between productivity and this measure of economic well-being (Sharpe, 2002); and
• background studies for the International Labour Organization�s 2004 World
Employment Report on the linkage between productivity growth and poverty
1 This paper was presented at the Symposium on Social Dimensions of Productivity organized by the Asian Productivity Organization, December 16-18, 2003, India International Centre, Lodhi Estate, New Delhi, India. Parts of the paper draw on Banting, Sharpe and St-Hilaire (2002), Osberg and Sharpe (2002b) and CSLS (2003a). The author would like to thank Lynne Browne and Jeremy Smith for editorial assistance. 2 The CSLS is a national, independent, not-for-profit research organization established in 1995 based in Ottawa, Canada. The two main objectives of CSLS are to:
• contribute to a better understanding of trends and determinants of productivity, living standards and economic well-being through research;
• contribute to public debate by developing and advocating specific policies to improve productivity, living standards, and economic well-being.
The research activities of CSLS are motivated by the following general principles: • in the long run, productivity growth is the key to improved living standards; • in the short to medium term elimination of any output gap is the most effective way to raise living
standards; • the equitable sharing of productivity gains among all groups in society is an essential element of
the economic growth process; • increased cooperation among the various groups which make up our society can contribute
significantly to better living standards; and • reliable data are crucial to the monitoring and analysis of living standards and to the development
of effective policies to increase living standards.
11
reduction in developing countries (CSLS, 2003a) and on China�s productvity performance (CSLS, 2003b).
The objective of this paper is to explore the linkages between productivity and
social development by presenting a synthesis of these three CSLS research projects. The paper highlights the relevance of the findings for developing countries in the context of this symposium on the social dimensions of productivity.
The paper is divided into three main sections. The first section provides a
synthesis of the main findings of the CSLS volume Towards a Social Understanding of Productivity (Sharpe, Banting, and St-Hilaire, 2002). The theme of the volume is the two-way relationship between productivity and social progress or development. Productivity growth provides the basis for improvements in social conditions, while better social conditions in turn feedback to high productivity. This section first discusses the impact of productivity on social well-being by looking at how productivity affects government balances and environmental sustainability, then explores the social determinants of productivity growth with particular reference to education, health, and social divergence, and finally examines the linkages between social policy and productivity.
The second section of the paper briefly presents the Index of Economic Well-
being and then discusses the two-way relationship between the four components of the Index (consumption flows, stocks of wealth, income inequality, and economic security) and productivity.
The third section highlights the key findings of the CSLS study for the ILO�s World Employment Report on the linkage between productivity growth and poverty reduction in developing countries. This section first presents data on the contribution of productivity growth to economic growth and to growth in GDP per capita in developing countries. It then explores the empirical relationship between productivity, poverty and inequality, looking at the relationship between productivity and poverty using simple regression analysis, as well as the relationship between productivity, poverty, and income distribution using multivariate regression analysis. It finally examines the relationship between productivity and poverty using alternative measures of poverty.
Productivity is the relationship between the output of goods and services and the
inputs of resources, human and non-human used in the production process, with the relationship usually expressed in ratio form. Both outputs and inputs are measured in physical volumes and thus are unaffected by price changes. Multiplying quantities of the various outputs and inputs by the price each has commanded in a base year yields the comparable or constant price values that can be added up to provide measures of aggregate output and input. The ratios may relate to the national economy, to an industry, or to a firm or even to a plant. Output growth that exceeds growth in measured inputs, that is to say an increase in the ratio of output to inputs, is what analysts mean when they say productivity is increasing.
Productivity growth is the most important source of long-term economic growth.

12
For example, from 1946 to 2000 real GDP per hour growth� the productivity of labour� accounted for 65 per cent of real GDP output growth in the business sector in Canada. Indeed, over the long term increased productivity is the only way to increase the standard of living, defined as real GDP per capita. Per capita income growth can come from increases in the employment-total population ratio, reflecting increased labour force participation, lower unemployment or a larger share of population of working age, or from improved terms of trade. But these sources of income growth are unsustainable in the long run as they have upper bounds (except possibly for the terms of trade). Productivity growth, on the other hand, is not constrained by the size of the population or other factors and its growth is at least in principle sustainable through technological advance.
Thus, trends in productivity are the key determinant of long-run trends in both
absolute and relative living standards. The fall-off in real income growth in many developed economies since 1973 is a direct result of slower productivity growth. Slower increases in the amount of output each worker produces means that there is slower growth in the output or income that can be shared among the total population.
The magnitude of the productivity growth estimates economists debate � almost
always below three percent for the aggregate economy in developed countries (but much greater in high-growth developing countries such as China) � may seem small or even trivial to non-economists. But small differences matter and the implications for society between a 1 and 3 per cent trend productivity growth rate are huge. Based on the mathematical rule of 72, a one per cent productivity growth scenario means that it will take 72 years or three generations for real output and hence income per worker to double. In contrast, under a 3 per cent productivity scenario it would take only 24 years or one generation for real income to double, while the 6.6 per cent average annual productivity growth rate experienced in China over the 1978-2001 period (CSLS, 2003b:Table 1.1) means living standards double in the space of only 11 years. Even moving from a 1 to 2 per cent trend productivity growth world cuts in half (to 36 years) the time needed to double living standards.
There is of course much more to life than productivity and the real income growth
it generates, as even economists realize. The economic well-being and quality of life of the population, much broader concepts than GDP per capita, are determined by many factors, of which productivity is only one. A focus on productivity by no means implies that economists consider these other determinants of well-being and quality of life unimportant. Economists study productivity because it is crucial for real income growth and important for improving economic well-being and quality of life, or at least its material aspects. They also believe that a better understanding of productivity trends and determinants can lead to the development of public policies and private sector actions that can improve productivity performance.
An understanding of the debate on the productivity-social development nexus requires familiarity with certain basic productivity concepts, including the differences

13
between measures of partial and total factor productivity, and the differences between productivity levels and growth rates.3
In productivity analysis, a fundamental distinction is made between partial and total productivity measures. The former relate output to only one input, more often labour and capital, although intermediate goods or raw materials also regularly figure in some compilation of inputs, even though it is recognized that other inputs contributed to output. The latter relate output to a combination of inputs, such as capital and labour. These measures are known as total factor or multifactor productivity and represent the growth in output not accounted for by input growth. The most readily available and widely used measure of productivity is labour productivity, the ratio of output to some measure of labour input (employment or hours). This term sometimes creates confusion as it may seem to imply that the level of labour productivity or the rate of growth of labour productivity is attributable solely to the effects of labour. In fact, labour productivity reflects the influence of all factors that affect productivity, including capital accumulation, technical change, and the organization of production. While the intensity of labour effort is obviously a factor that does affect labour productivity, it is generally significantly less important than the amount of capital a worker has to work with or the level of production technology.
The concept of total or multifactor productivity has been developed to measure the contribution of all factors of production to productivity growth. The rates of growth of all inputs are weighted to give one growth rate for the combined inputs.4 Total factor productivity growth is defined as the growth rate of output minus the growth rate of the combined inputs (just as labour productivity growth equals output growth minus labour input growth). As the growth rate of the capital stock is generally greater than that of employment (and hence the capital/labour ratio is rising), the growth rate of total factor productivity (using labour and capital as inputs) is generally less than the growth rate of labour productivity. This situation arises from the fact that the growth rate of the combined inputs of capital and labour exceeds that of labour alone.
The meaning of total factor productivity is also controversial. Some economists
interpret it as a measure of overall technical change, others as a measure of disembodied technological change, that is technical change that is not embodied in new machinery and equipment, and still others argue that TFP is in no way a measure of technological change.
3 Two less crucial issues are the differences between output per worker and output per hour and the impact of the business cycle on productivity. For discussion of these issues, see Sharpe, 2002. 4 A key issue in total factor productivity measurement is the weighting of these inputs. Under competitive conditions, the current dollar income share of the factor of production � labour income for hours worked and interest plus gross capital income (profits, and depreciation) for the capital stock � is normally considered the relative contribution of the factor to output and consequently used to weight the factor to produce an index of total input, or the growth rate of the index. When markets are not competitive, as in the case of monopolies, the weighting issue is much more complex.

14
It is incorrect to say that total factor productivity is a superior or preferred measure of productivity compared to labour productivity as the two concepts serve different purposes. For those interested in how efficiently all factors of production are used in the production process, total factor productivity is the relevant productivity measure since it takes account of the productivity of factors of production other than labour, such as capital, intermediate goods, and energy. For those interested in the potential of the economy to raise the standard of living, labour productivity is the
relevant productivity measure. It tells us how much output or income is produced by each worker and when combined with the total number of workers, how much total income there is to be distributed among the population.
A second important distinction is that between productivity levels and growth
rates. The former refers to the output per unit of input at a given point in time. For example, in 2000 the level or value of output per hour in the business sector in Canada was $29.14, expressed in constant 1992 prices. The latter represents the percentage change in output per hour levels, expressed in constant prices, between two points in time. An example would be the 13.6 per cent increase in labour productivity between 1989 and 2000, when the level of output per hour was $25.65. One often hears the complaint that Canada�s productivity is poor. This could be referring to a situation of a low aggregate productivity level or a low productivity growth rate, or both. It is important that commentators specify whether they are referring to levels or growth rates as the implications of the two situations can differ significantly.
International comparison of productivity levels requires that levels expressed in a domestic currency be converted into a common currency. This conversion can be done with either market exchange rates or exchange rates based on purchasing power parities (PPPs), that is the exchange rate that equalizes the price of a basket of goods and services between two countries. For accurate productivity level comparisons, it is imperative that PPPs be used, although the development of reliable PPPs is a complex task, particularly at the industry level. The existence of a range of PPPs produced by different agencies and researchers means that there is a range for relative international productivity level estimates.
II Productivity and Social Development
In contrast with the relative clarity of the meaning of productivity provided in the introduction, �social development� is a much broader idea. It can be manifested by improvements in a wide range of measures, including the incomes of families and individuals, the sense of economic security enjoyed by workers, the levels of poverty and social exclusion, the extent of inequality in life chances, the vibrancy of our distinctive communities, the strength of social cohesion and the sustainability of our environmental heritage. Such a complex and multifaceted phenomenon is thus best thought of as an overarching societal goal rather than as an analytical concept.

15
Any assessment of social development is also complex because it must move beyond aggregate measures. Overall indicators of the average level of social well-being always mask important variations in the experiences of different individuals and groups. Economic and social change on a major scale always produces winners and losers, groups who benefit from the new order and others whose economic and social prospects are eroded by the same forces. The history of wars, it is often observed, is written by the winning side. The history of social progress needs to be more balanced.
As well as being complex, social development is inevitably a contested idea, because different people have very different conceptions of what constitutes the �good� society. Even if members of society agree on whether specific indicators tap dimensions of social development, they will differ on the relative importance to be attached to the various indicators and hence on whether social development, in the aggregate, is advancing or declining.5 In the end, therefore, there can be no single measure of social development. Exploring the relationships between productivity and social development remains a compelling task, but the judgements rendered in this paper best seen as contributions to an open and pluralistic debate on the topic.
Not surprisingly, perhaps, the linkages between productivity and social
development are many and varied. In some cases the links are direct and immediate; changes in average incomes are tightly tied to productivity trends. In other cases the links are much more indirect and conditioned by other factors. For example, there may be a significant lag between productivity improvement and increased incomes on the one hand, and one�s own sense of economic security, as measured by opinion polls, on the other. In yet other areas, the link between changes in productivity and important dimensions of social well-being may be especially weak. For example, productivity may have little impact on indicators of social capital such as membership in associations and groups; cultural or social factors are probably much more decisive in shaping this aspect of our collective experience. Finally, in some cases the link between productivity and social development may be negative. For example, the economic growth made possible by productivity gains may have a negative effect on certain environmental indicators such as greenhouse gas emissions, or on quality-of-life indicators such as time spent commuting.
It is also important to note that the relationship between productivity and social
development may not be constant over time. For example, the impact of higher aggregate real incomes arising from productivity growth on the rate of poverty may be strong in certain periods and weak in others, because of changes in the nature of growth or the influence of other factors on poverty.
5 For certain indicators, there may even be disagreement about which direction of change represents social development, reflecting the ideological or world view of the observer. For example, some may see a rising proportion of students in private schools as a negative indicator because they believe such a trend threatens the development of an inclusive society. Others may see such a trend as positive since it means individuals have more choice in the educational options for their children.

16
The importance of the indirect linkages between productivity and the social lives of citizens is evident in their implications for public policy. In part, the impact of productivity on social well-being flows through public policy. To take the most obvious example, the post-1973 productivity slowdown that took place in all OECD countries reduced government revenues and increased deficits, and the growth of social programs in OECD countries, including Canada, was much less rapid after 1973. Of course, governments did have options, and fundamentally political judgements inevitably had to be made about how to proceed. But the erosion of the fiscal dividend enjoyed during capitalism�s golden era from 1945 to 1973 because of slower productivity growth left governments with fewer fiscal resources and hence less room to manoeuvre. Thus productivity performance is a powerful factor influencing public policies, even if its impact is indirect and mediated by political and social pressures.
Finally, in comparison with the links running from productivity to social
development, those running from social development or social well-being to productivity performance are less obvious and less well documented. Nevertheless, these links are likely to be significant. To take the most obvious example, in a knowledge-based economy, social and cultural factors that influence the desire and capacity of families to invest in their children�s education and development have potentially powerful long-term consequences for productivity growth. Changes in family structures and other social patterns that influence the capacity of families and communities to make such investments matter. For these and other reasons, some analysts have argued that social inequality can have negative implications for the accumulation of human capital, and that greater equality can boost long-term productivity growth. Similarly, many analysts have argued that the strength of social networks and the levels of social and political trust represent a form of social capital with important implications for economic activity.
The links between productivity and social development are thus multiple and
complex, and tracking the relationships in a comprehensive manner is a challenging analytical task. Nevertheless, as the rest of this section shows, it is possible to make at least provisional judgements about the core dynamics at work. The Impact of Productivity on Social Well-being: The Cases of Government Balances and Environmental Sustainability In examining the linkages between productivity and social development, one of the first considerations is the potential impact of changes in productivity growth on government fiscal balances, which in turn affects the government�s ability to contribute to social development. Of course, larger fiscal balances do not necessarily translate into enhanced social measures, as governments may have other competing objectives. But, clearly, determining the sensitivity of fiscal balances to alternative productivity growth rates is an initial step in determining how productivity growth can affect the ability of governments to pursue social objectives.
Peter Dungan (2002) investigated the sensitivity of Canadian government fiscal
balances to alternative long-run productivity growth rates using a macroeconometric

17
model to conduct simulations to the year 2030. Overall, the simulations indicate that even relatively small changes in productivity growth rates can cumulate over several decades to produce large changes in GDP and living standards, and this can alter significantly the fiscal �room to manoeuvre� of the federal and provincial governments and of public pension plans. This is true whether we are contemplating higher or lower productivity growth rates. For instance, a relatively modest addition of 0.3 per cent to annual productivity growth from 2004 to 2030 increases real GDP by 8 percent, or $171 billion Canadian ($2000), over the base-case scenario by the end of the period. This translates into an increase of $71 billion in aggregate government revenues. How the fiscal room to manoeuvre is used could have important effects on productivity growth itself: some tax cuts or expenditure increases could in turn raise productivity growth, through either improved technology or capital accumulation, while some poorly designed new social programs could reduce incentives and lower productivity growth. This feedback from fiscal policy to productivity becomes more important the further we go into the future.
As manifested by the intense debate throughout the world on the ratification of
the Kyoto Accord, the issue of sustainability of natural capital and its implications for economic growth ranks high in the interests of both policy-makers and the general public. Nancy Olewiler (2002) has explored the crucial, but often ignored, linkages among natural capital, sustainability and productivity.
Olewiler defines sustainability as the ability of the economy to maintain the flow
of production necessary to prevent a decline in per-capita consumption indefinitely, so that future generations can have a standard of living equal to or better than that of the present generation. In looking at natural capital as an input into production, Olewiler draws a clear distinction between those forms of natural capital, such as water and our atmosphere, that are essential to human existence, and other resources for which there are substitutes. This distinction between essential and non-essential inputs in turn leads to the concepts of weak and strong sustainability. Weak sustainability assumes that all the forms of capital involved are perfectly substitutable for each other, and that sustainability requires only that an aggregate stock of capital be maintained at a level necessary to ensure indefinite production. Strong sustainability on the other hand recognizes that specific forms of natural capital are essential � that is, they have no substitutes � and that stocks of these resources must be kept intact to ensure continued production. The challenge is to determine what forms of natural capital are essential and how to sustain the necessary stocks.
Olewiler examines productivity in natural resource industries in Canada and the United States to determine whether depletion in natural resource capital has affected productivity growth. Based on her detailed analysis of labour and total factor productivity growth rates, the author observes that:
• For Canadian non-renewable resource industries, changes in the stock of
natural capital have not led to a sustained decrease in labour or total factor productivity. Indeed technological change, whether induced by environmental

18
regulation or stock depletion, appears to be contributing to continued productivity growth in these industries.
• For Canadian renewable resource industries, such as logging and fishing, productivity has been declining due to poor resource-management practices. While these industries are certainly not essential for the overall sustainability of production in the Canadian economy, their loss does affect the viability of many communities.
• Ignorance of the state of our environmental capital and its relationship to
productivity and sustainability is particularly apparent in our lack of knowledge about threshold effects. Once a threshold is exceeded, damage to production and productivity from environmental degradation may be severe and irreversible. This uncertainty regarding thresholds has led many researchers to advocate a precautionary approach to environmental policy.
Olewiler concludes that the development of reliable productivity estimates for
natural capital sectors is important for monitoring trends in sustainability. Reductions in productivity may be seen as a warning that production and consumption are moving into a path of non-sustainability. Falling productivity in sectors that rely on natural capital may signal three possibilities: (1) technological change is not keeping up with depletion, (2) substitute inputs are not readily available, or (3) regulation is not addressing, in an appropriate manner, the market failures associated with the use of particular resources. Social Determinants of Productivity: Education, Health, and Social Divergence
Most research on the drivers of productivity growth has focused on economic
factors, such as investment, new technology and innovation, market structures and openness to trade. But economic variables alone do not fully explain differences in the levels of productivity and economic growth of countries around the world. This is especially the case when attention is focused on the growth experience of countries at all levels of development, from the richest to the poorest. The differences in productivity from the most to the least developed countries are enormous, and coherent explanations must go beyond standard economic variables to incorporate a wider range of institutional and social factors. When attention narrows to the experience of industrial or OECD countries, economic factors do a better job of explaining differences in their productivity. Nevertheless, even here a significant portion of productivity growth is unexplained by models built on purely economic factors, leaving open the question of the role of the institutional and social characteristics of different countries. 1) Impact of Education
The increased focus and attention of researchers and policy-makers, in recent years, on the potential determinants of productivity growth has generated considerable interest in human capital as a key contributing factor. Skills, innovation and human capital feature prominently on the policy agenda of industrialized countries concerned
19
with productivity and competitiveness issues. Not surprisingly, formal education is the preferred and most conventional policy instrument of governments in pursuing these objectives. Indeed, �more is better� is often the guiding principle here. The actual linkages, however, are not as straightforward as they may appear. Indeed, there are gains to be achieved through a better understanding of the relationship between the skills developed through formal education and their causal impact on productivity, as well as a more nuanced approach to policy in this area.
Arthur Sweetman (2002) has pointed out that �the issue is not whether education
has benefits but, rather, the magnitude of its �true� benefits, the benefits relative to costs, and the distribution of costs and benefits.� Sweetman notes the mixed macroeconomic evidence on the central role of human capital for economic growth, and concludes that the problem is basically one of measurement. The studies that failed to find a correlation tended to use educational attainment, enrolment rates or educational spending as measures of a country�s human capital. More recent studies that use direct measures of actual labour-force skills based on the quality of education (e.g., standardized test results or literacy scores) have found a �substantial, and remarkably precise, correlation between human capital and growth.� Based on his detailed review of endogenous growth literature, Sweetman concludes that both the quality and content of education have a sizeable impact on overall productivity and economic growth. He cites as an example the results of a study by Robert Barro of Harvard University, which suggest that an additional year of education of �average� quality is associated with an annual increase of 0.44 per cent in GDP. This implies a real social rate of return on education of about 7 percent. 2) Impact of Health
While human capital is commonly associated with education and skills, health also has potential links to productivity. Emile Tompa (2002) finds that the health-productivity relationship goes well beyond the obvious effect of health on capacity to work in terms of both energy level and working time. The author describes three additional pathways through which health can affect productivity at an aggregate level. For instance, individuals with a longer life expectancy may choose to invest more in education as they receive greater returns from their investment. They may also be motivated to save more for retirement, which would lead to greater accumulation of physical capital. Finally, improvement in the survival and health of young children may provide incentives for reduced fertility and may result in increased labour-force participation.
Tompa�s review of historical economic trends reveals �substantive evidence
concerning the productivity impact of increased life expectancy and reduced morbidity over the last few centuries in Europe and the United States.� He cites estimates indicating that substantial improvements in health and nutrition explain as much as 30 percent of growth in per-capita income in the United Kingdom since 1790. Similar estimates of the impacts of health are also found in cross-country studies based on data for the last 50 years, which would suggest that these historical trends have not fully run their course.

20
Tompa reports results from a range of studies indicating that between 21 and 47
percent of GDP growth per worker over the last 25 to 30 years can be linked to improvements in the health of populations. As Tompa points out, however, most of the research in this area has focused on life expectancy as a measure of health, which, given significant convergence among developed countries, has become a less salient indicator in explaining productivity differences among these countries. In his view this clearly underscores the need for more refined and relevant indicators (e.g., morbidity, vitality, mental health and acuity) if we are to fully comprehend the contemporary role of health as a productivity driver in developed economies.
Given the multifaceted nature of the factors that influence health and, by
extension, productivity, a more holistic approach to population health, including initiatives in areas traditionally considered outside the purview of health policy, may prove useful. A review of the health-productivity relationship from a human-capital perspective suggests that education policy, child-care and family policy, and labour-market policy are all important avenues through which the public sector can have an impact on population health. 3) Impact of Social Divergence
Quentin Grafton, Stephen Knowles and Dorian Owen (2002) have examined the
implications for productivity arising from the level of social diversity along a variety of dimensions, including ethnic, linguistic, and religious differences and inequalities between rich and poor. Their basic intuition is that human beings tend to associate and communicate most readily with people similar to themselves, and their hypothesis is therefore that �social divergence� generates social barriers to communication among groups, inhibiting the diffusion of knowledge and lowering the level of productivity in the economy. As a consequence, the more diverse the society and the greater the number of distinct social groups, the higher the communication costs and the greater the barriers to the exchange of ideas and innovation.
Grafton et al. compare their concept of social distance to related concepts such as
social capital, trust and social networks. They note that the impact of the polarization of societies along ethnic lines has received considerable attention in the literature on economic development. A variety of analysts have concluded that ethnic diversity tends to generate high levels of rent-seeking among competing ethnic groups, at the expense of general economic policies that promote growth. Ethnolinguistic and religious diversity is also a predictor of conflict, political instability and weak institutional frameworks, all of which can retard growth. Similar findings emerge in terms of income inequality and inequality in levels of educational attainment.
Grafton et al. analyze the impact on total factor productivity of a set of measures
of social divergence, using data from a cross-section of 31 developing countries. Their findings also support the proposition that social diversity and economic inequality weaken economic performance. These research findings are clearly preliminary, and are

21
subject to important limitations. For example, indicators of social divergence do not directly measure the extent and quality of communication among individuals and across social groups in a society. More direct measures of the links and exchanges among individuals would allow a clearer test of the proposition that social diversity inhibits the diffusion of knowledge and innovation. In addition, most of the literature on the economic consequences of social fragmentation uses data sets that are dominated by the experience of developing countries, and the authors� own analysis is limited to developing nations. The applicability of such findings to high-income countries that are socially diverse, including Canada, is an open question. Such countries tend to have much stronger institutional frameworks and richer communications networks that may well reduce the barriers to exchange across groups.
Finally, Grafton and his colleagues stress that their analysis does not imply that
social homogeneity is to be preferred. Social diversity can also have important economic benefits, as suggested by J.S. Mill in a passage quoted by the authors: �It is hardly possible to overrate the value�of placing human beings in contact with persons dissimilar to themselves, and with modes of thought and action unlike those with which they are familiar.� The danger, the authors argue, is that barriers to communication across groups can prevent the benefits of diversity from being realized. The challenge for multicultural countries is therefore to develop institutions and policies that facilitate communication among groups.
Social factors such as educational levels, health care and social diversity may not
be standard features of the debate about the determinants of productivity growth. But the papers highlighted above illustrate the importance of understanding the potential linkages that run from social dynamics to economic performance in both developed and developing countries. Should Productivity be a Social Priority?
Although the debate over productivity turns in part on empirical evidence of the relationships at work, it also touches on fundamental normative questions about values, the nature of the good society and the purposes of public action. In the most general sense, it is difficult to challenge a commitment to productivity or efficiency, understood as the best possible use of scarce resources to achieve a valued end. Who could be opposed to achieving greater human welfare � to meeting our economic, social and psychological needs more fully � with the resources at our disposal? In most policy debates, however, the concept of productivity tends to take on a narrow economic focus, one concerned with maximizing economic output. The social priority of this conception of productivity is certainly open to challenge, both in theory and in active politics, and the challenge emerges strongly in the work of Joseph Heath.
Heath (2002) argues that the citizens of developed countries tend to overestimate the contribution that further productivity growth will make to their welfare. Traditionally, productivity growth was thought to contribute to increased leisure time, greater consumer satisfaction, the elimination of poverty and greater public support for redistributive

22
efforts to narrow social inequality. While accepting that such benefits have flowed in the past, Heath argues that in the last 25 years productivity growth has contributed less and less to the well-being of Canadians. He points to the following indicators:
• After a long period of growth in leisure time, average working hours per week have begun to edge up again in North America over the last two decades. Moreover, a dramatic increase in two-income families � reflecting in part the widespread perception that it is impossible to maintain a middle-class lifestyle on the basis of one salary � has made the juggling of work and family increasingly difficult for many Canadians.
• While productivity growth has led to higher consumption, there is no evidence
that it has produced greater overall consumer satisfaction or happiness. Heath draws on a number of surveys that show that whereas economic growth is strongly associated with increased happiness in poor countries, there is no correlation between higher consumption and increased happiness in richer countries. Certainly, there is little evidence that people in rich countries have become happier in the last 25 years.
• Economic growth alone no longer seems to be reducing poverty. Important
gains were made in the post-war decades as a result of the expansion of redistributive government programs, but Heath points to studies finding no reduction in the level of �basic needs� poverty since the late 1970s.
• Economic growth during the last 25 years has not increased people�s
willingness to share through redistributive programs. Heath argues that there seems to be growing middle-class resistance to redistribution and the taxation needed to support it.
The key puzzle for Heath is why further economic growth does not lead to greater
happiness in developed countries. In attempting to solve this puzzle, he canvasses three currents of thought in the literature. One possible explanation is that increased consumption does not generate lasting increments in welfare, because the process of satisfying our desires generates new desires, an interpretation that Heath traces from classical Greek philosophers to modern analysts such as John Kenneth Galbraith. A second explanation, which Heath describes as neo-Veblenian, contends that consumption not only satisfies needs but also communicates status, class, upbringing and tastes. The difficulty with this element of consumption is that such status hierarchies have a zero-sum structure. If a spurt of economic growth suddenly allowed everyone to purchase an exotic car, the process would cancel out the status inherent in driving one. A third possible explanation draws on the work of Fred Hirsch, who argues that the supply of some goods, which he labels positional goods, is fixed. Waterfront property is a classic example. For these goods, the process of economic growth does not increase their quantity; it increases only their relative prices. As people become richer, therefore, some goods may become easier to acquire but positional goods continue to recede over the horizon.

23
Heath argues that if these three forms of consumption absorb a significant portion
of the benefits of economic growth, there will be little increase in satisfaction, at either the individual or the aggregate level. For Heath, this argues against making productivity growth a social priority in developed countries. For this reason, he is sceptical about investing scarce public dollars in a productivity agenda, and believes that other forms of investment will be more effective in enhancing the welfare of Canadians. He suggests a number of possibilities, including dealing seriously with the externalities generated by economic growth for the environment, reducing crowding in urban areas, increasing the supply of public goods, promoting leisure and increasing individuals� sense of security. However, his key point is that since productivity growth does not generate the benefits we expect, it should not be treated as an unchallenged priority, and we should not worry about our relative productivity compared to other countries, such as the United States. There is no reason why a decline in our relative �standard of living� should necessarily mean a decline in our quality of life.
In response to Heath�s critique of a productivity agenda, two points should be
stressed. First, the relevance of his critique does not apply to developing countries. Many studies show that for poor countries, higher GDP per capita does indeed raise the overall subjective well-being or happiness of the population (Easterlin, 1996). It also provides obvious material benefits for the population, including better health care and education opportunities. Second, Heath fails to note than many of the objectives he prefers over productivity growth, such as greater public services and more leisure time, can be obtained through productivity growth. Indeed, productivity growth is a means to an end, not an end in itself. It provides society with choices. Productivity gains can be taken in the form of greater private consumption, more public services, or reduced working time. It goes without saying that these productivity gains must not be achieved at any cost and if obtaining these gains conflicts with other societal objectives, societal tradeoffs must be made.
Social Policy and Productivity
The question of whether productivity is a social priority raises the related question of whether there is an implicit tradeoff between economic growth and social well-being. Establishing the relative priority of different goals is especially important if the tradeoffs are harsh, if more of one requires deep sacrifices of another valued goal. But is this the situation we face? Is there a sharp tradeoff between productivity growth and social policy objectives? Or could there actually be a positive relationship between these two agendas?
The traditional view is that there is an inherent conflict between economic efficiency and social equality, a view neatly summarized in the title of Okun�s famous book, Equality and Efficiency: The Big Tradeoff (1975). This view gained renewed currency in the policy debates of the 1990s, as commentators contrasted the economic performance of Europe and the United States in that decade. The European record was one of slow economic growth, particularly of employment, a pattern many commentators dubbed �Eurosclerosis� and blamed on the welfare state. In contrast, the United States
24
was recording a major surge in employment and strong productivity growth, which was widely heralded as the advent of a new economy � indeed a third industrial revolution � rooted in innovation in the information, communications and telecommunications fields. This growth was preceded by a significant rise in inequality in the United States, leading many to infer that higher levels of inequality seemed to contribute to growth.
More recently, however, this traditional view has been challenged both by cross-
national empirical studies and by theoretical advances. This recent research seems to suggest that there is no efficiency-equity tradeoff and that social policy and greater equality may actually contribute to higher productivity growth.6
There are two streams of recent research that point in this direction (Harris, 2002).
In the early 1990s a number of researchers analyzed cross-sectional and time-series data for both developing and developed countries, and identified a robust negative correlation between measures of income inequality and economic growth. This evidence would seem to suggest that greater equality can actually contribute to stronger economic growth. However, the majority of these studies involved samples dominated by developing countries. When attention is focused on OECD countries alone, the evidence is far from conclusive. Indeed, Harris concludes that the empirical case for a link running from greater income equality to higher economic growth for high-income countries is �at best statistically fragile and at worst insignificant.� But he also cautions that there is no significant evidence for the traditional idea of a tradeoff between equality and growth.
The old mythology that there is an inevitable tradeoff between efficiency and
equality must be set aside. But new ideas suggesting that inequality is harmful for economic growth as yet lack compelling empirical support. As a result, the policy-maker must make do without convenient intellectual crutches, and the implications of social programs for productivity must be assessed on a case-by-case basis. As often is the case, research has increased, rather than decreased, the analytical complexity facing governments. Key Themes on the Relationship between Productivity and Social Development The two-way or reciprocal relationship between productivity and social development is the central theme of this paper. Looking at the first linkage running from productivity to social development, productivity increases the amount of material wealth that a given hour of labour can produce. However, too often advocates of a productivity agenda highlight only its importance for our material standard of living, giving such an agenda an unnecessarily narrow political appeal. The additional wealth created by productivity growth can be taken in different forms: private consumption, enhanced social programs, lower taxes, more leisure time, or some combination of all four of these. In effect, productivity growth provides more opportunity for society. Greater productivity is not a necessary condition for social progress; indeed, we could choose to devote a
6 On this issue, see the papers in the special issue of the Canadian Public Policy on the linkages between economic growth (Fortin, Sharpe, and St-Hilaire, 2003)

25
larger proportion of our existing income to social purposes if we wished; and certainly greater productivity does not guarantee greater social well-being, as Heath (2002) correctly emphasizes.
What paths are taken depend on social and political choices. In the real world of politics, however, productivity growth does expand the choices open to society, and reduces the apparently zero-sum nature of choices inherent in a weak economy. It is no accident that the welfare state expanded greatly during the golden years of capitalism following the Second World War. There is a social as well as an economic case to be made for productivity growth, and it is unfortunate that the advocates of a productivity agenda tend to cast it in such narrow terms.
These realities should inform assessments of the performance of different
countries around the world. Much has been made of the contrast between the economic performance of the United States and that of Europe in the last decade. Clearly, the link between productivity and living standards, in terms of both levels and growth rates, is crucial. Countries with high levels of output per hour tend to have high levels of income, as measured by GDP per capita, and countries with rapid labour productivity growth tend to have fast GDP per-capita growth.
But certain European countries have very high levels of output per hour but
relatively low levels of income. This is because average annual hours worked and/or labour-force participation are low. The working-age population in these countries thus enjoys greater leisure but less income than would be the case if they worked longer and had higher labour-force participation. It is misleading to characterize these countries as having a lower standard of living than countries with comparable productivity levels and higher income levels, when a conscious choice is made to use productivity gains for additional leisure instead of income. Indeed, a broadly defined measure of living standards or economic well-being would include leisure as well as income. This inclusion of leisure, as well as income, in the measurement of living standards thus more fully defines and tightens the link between productivity and living standards. Productivity growth increases the production possibility frontier of society, allowing both greater income and greater leisure. Societies make different choices about which combination of these two variables they prefer.
Gaining a socially aware understanding of the role of productivity growth will be
especially important in the years to come. While labour productivity was the main source of advances in living standards in developed countries through the 20th century, other factors were also important, including increases in the relative size of the working-age component of the population and increased female labour-force participation. These trends have by now largely run their course. As noted by a number of contributors, with the retirements of the baby boom cohorts and the attainment of high levels of female labour-force participation, the contribution of these factors to living-standard growth will be considerably smaller in the future. Consequently, productivity growth will become even more important, in a relative sense, for the advancement of living standards.

26
Productivity advance is also an essential element of any strategy to ensure the sustainability of natural resources and the environment. While environmental sustainability is high on the public agenda, there appears to be limited public awareness of the positive role that productivity can play. Olewiler (2002) shows that productivity growth and technical progress � the two go hand in hand � can contribute substantially to sustainability. Technological progress can help improve the functioning of eco-systems through the production of more energy-efficient producer and consumer goods and the development of products that do less damage to the environment. A socially aware understanding of productivity must also incorporate the reciprocal nature of the relationship. Productivity growth is influenced by social factors that are the manifestations of the social progress of a society. Higher levels of educational attainment of the workforce enhance productivity growth. Better health makes workers more productive. Stronger communications flows across diverse groups in modern multicultural societies promote learning from others and lead to improved productivity.
The role of education is fundamental. At the level of both the individual and society, high levels of educational attainment are associated with high productivity and high incomes, while low levels have the opposite effect. Indeed, it is impossible to imagine a productive 21st-century economy and society that does not have a highly literate and numerate workforce. Because of the externalities associated with education and training, public policy has an important role to play in fostering human capital development.
This perspective also applies to health. It is a well-known fact that improvements
in population health have also contributed significantly to increased productivity and living standards over time. However, the productivity effects of health go well beyond those associated with increased life expectancy. We are only now beginning to understand the multifaceted nature of the factors that influence the health of the labour force and of the population as a whole.
In addition to highlighting the positive role of human capital, it is important to clear away traditional mythologies that do not stand up to close scrutiny. The belief that there is an inevitable tradeoff between efficiency and equality has long been an influential assumption underlying policy debates in Canada and many other Western nations. This hardy perennial has been seriously undermined by new research. To be sure, the more recent argument that greater equality and social spending actually contribute to productivity growth also seems to lack convincing support, at least in the case of advanced economies. But in the real world of public policy, debunking the assumption of an implicit tradeoff represents a significant corrective to the intuitions and hunches that shape choices. The need to assess social programs on a case-by-case basis, without the aid of such default positions, may raise the complexities confronting policy-makers. But clearing away unsupported intuitions is a healthy contribution to the policy process.
It is time to end the political posturing between the advocates of productivity growth
and the defenders of social well-being. Doing so requires accommodations on both sides.

27
Advocates of the productivity agenda need to broaden their focus by highlighting the ways in which productivity can enhance social development and recognizing the contribution of social well-being to future productivity. But defenders of social development need to incorporate productivity into the causes they hold dear. Productivity growth does not automatically fulfil collective aspirations, but it increases the choices available to society and reduces the zero-sum nature of alternatives facing government decision-makers.
The CSLS Index of Economic Well-being: Weighting Tree
Market Consumption per capita (constant $) adjusted for variation in household size
Unpaid Work per capita (constant $) Consumption Government Spending Flows per capita (constant $)
Value of variation in work time per capita (constant $) less: Regrettable Expenditures per capita (constant $) Value of variation in life expectancy per capita (constant $)
Capital Stock per capita (constant $)
R&D per capita (constant $)
Natural Resources per capita (constant $) Wealth Stocks Human Capital per capita (constant $) Index of less: Net Foreign Debt Per Capita Economic (constant $) Well-Being
less: Cost of Environmental Degradation per capita (constant $)
Poverty Rate and Gap (Poverty Intensity) Income Distribution Gini Coefficient Risk imposed by unemployment Economic Financial risk from illness Security Risk from single parent poverty Risk from poverty in old age

28
III The CSLS Index of Economic Well-being: Identifying Linkages between Productivity and Social Development
This section of the paper lays out a framework for identifying and analyzing the two-way or bi-directional relationship between productivity and economic and social well-being, defined in terms of the four components of the Index of Economic Well-being developed by the Centre for the Study of Living Standards.7 The effects of productivity gains for the different components of well-being are explored at a conceptual level.8 Then the implications for productivity of independent improvements in the four components of economic well-being are discussed. The four components or dimensions of economic well-being in the CSLS Index of Economic Well-being, which are illustrated on the previous page, are the following:9
• effective per capita consumption flows which includes consumption of private
and public goods and services, and effective per capita flows of household production, leisure and other unmarketed goods and services;
• net societal accumulation of stocks of productive resources, including net accumulation of tangible capital, housing stocks, net accumulation of human capital, the R&D capital stock, net changes in the value of natural resources stocks, costs of environmental degradation, and net change in the level of foreign indebtedness;
• poverty and inequality which includes the intensity of poverty (incidence and
depth) and the inequality of income; and
• economic insecurity from job loss and unemployment, illness, family breakup, poverty in old age.
A key aspect of the Index is the weighting scheme that is applied to the four basic
components as different weights produce different results.10 The weights are subjective 7 In the fall of 1998 the Centre for the Study of Living Standards (CSLS) introduced a new indicator of sustainable development for Canada (Osberg and Sharpe, 1998), appropriately called the Index of Economic Well-being (IEWB). Since then the CSLS has continued to develop the Index, producing estimates for the United States (Osberg and Sharpe, 2002a and 2004), the Canadian provinces (Osberg and Sharpe, 2000b), OECD countries (Osberg and Sharpe, 2002b). The Index has stimulated much interest among researchers and policy analysts, particularly at the international level. 8 See Sharpe (2002) for a discussion of the impact of productivity on these variables in the context of the postwar Canadian economy. 9 A detailed discussion of the rationale for the inclusion of the above variables, and the manner in which they have been included, in the Index of Economic Well-being is provided in Osberg (1985) and Osberg and Sharpe (1998). 10 Weights are also applied to the sub-components of the equality and economic security components because these sub-components are not expressed in constant prices and therefore cannot be aggregated. The weights given the poverty intensity and the income inequality are, like the weights given the four components, subjective as they reflect the relative valuation placed on these sub-components. In contrast,

29
and reflect one�s judgment of the relative importance of the components. In the most recent version of the Index, equal weights have been used. This weighting scheme has been found the most effective for the presentation of the Index. Based on the equal weighting scheme, the Index of Economic Well-being advanced only 16.6 per cent in Canada from 1971 to 1999. In contrast, GDP per capita rose 73.0 per cent. The Impact of Productivity on Economic Well-being This sub-section explores the impact of productivity for the consumption, stocks of wealth, inequality, and economic security components of the Index of Economic Well-being. 1) Consumption Flows
The concept of consumption flows used in the Index includes private and public consumption and unpaid work and makes adjustments for a number of factors, including life expectancy, household size, regrettables or negative externalities (cost of commuting, crime, auto accidents, and pollution abatement) as well as changes in working time.
The basic relationship between productivity and consumption is that productivity growth increases output and income and income is the key determinant of consumption. Productivity increases real income and when people earn more, they spend and consume more. Of course, not all increases (in either an absolute or proportionate sense) in income arising from productivity gains are spent. A significant proportion is taxed away by government, reducing potential private consumption, but potentially increasing public or collective forms of consumption and positively affecting the other components of economic well-being. A portion is also saved, financing investment. The relationship between changes in productivity and changes in marketed consumption or the private component of total consumption thus flows through real wage gains. At the aggregate level, increased levels of output per hour over long periods of time translate into increased real labour compensation per hour as labour�s share of national income has tended to remain relatively constant over time. Growth of real labour compensation or income in turn fuels growth of private consumption.
This close long-run relationship or correlation between real wages and
productivity reflects the fact that real wage growth in an accounting sense is limited by increases in the amount of output produced per hour worked. Changes in capital and labour�s share of output can result in divergences between productivity and real growth over short periods. But over long periods factor shares have been relatively stable so have had little effect on real wage growth.
the weights given the four sub-components of economic security have a more objective basis as they reflect the relative importance of the group at risk in the total population.

30
The primary causal linkage in the productivity-real wage relationship runs from increased productivity to higher real wages. Nevertheless, there can also be a causal linkage running from wages to productivity. For example, a large increase in wages can have a positive effect on labour productivity through greater substitution of capital for labour. In this sense, productivity and real wages are both endogenous variables. The relationship between real wages and consumption is mediated by the tax and transfer system and saving behaviour. Only part of labour income is spent on consumer goods, with the rest going to savings and taxes. Equally, consumer spending is financed by transfer payments and investment income from savings.
The long-run relationship between aggregate productivity and real wage growth does not hold on an industry or sector basis. The competitive nature of the labour market and the wage determination process tend, if not to eliminate, at least to put downward pressure on divergences in labour compensation increases across industries, ceteris paribus. This explains the relative limited range of sectoral real wage growth. Industries with above average productivity gains such as agriculture and communications have seen the relative price of their output fall, while sectors with below average gains such as personal services see their relative prices rise.
This aggregate relationship is also consistent with increases or decreases in
earning or wage inequality as such changes merely redistribute income among workers and do not affect labour�s share of national income. If this long-term relationship had not held and labour productivity growth had exceeded real labour compensation gains, the share of labour in national income would have declined and the share of profits would have increased, which has not happened. The relationship between productivity gains and changes in non-working time or leisure is more complex than the relationship between productivity and private and public consumption. From a theoretical perspective, productivity growth gives individuals greater choice in the leisure/work tradeoff. Three options are possible. With increased productivity, individuals can choose to use all productivity gains for increased leisure, foregoing any increase in income. If productivity doubles, everyone could work one half the hours currently worked yet still enjoy the same real income level. Second, individuals can use productivity gains for both increased leisure and income. Third, individuals can forgo all reductions in working time and use all productivity gains for increased income.
The relationship between productivity and working time for the employed population is in part mediated by trends in real labour compensation. Higher wages arising from productivity gains may entice workers to substitute leisure or non-working time for additional income if the labour supply curve is backward-bending. In other words, if it takes less time to make the things we need because of productivity gains, people may choose to work less. The large fall in working time during the first seven decades of the 20th century provides evidence of this preference for shorter working time. This development, predicated on the large real wage gains enjoyed during this period

31
arising from increased productivity, represents a major increase in the economic well-being of the workforce not captured by conventional economic statistics.
Since 1970 the downward trend in average hours worked in developed countries
has ended or even been reversed in certain instances, despite the continued increase in productivity and real wage growth, although the pace of this growth has certainly been less than in the pre-1970 period. The value of the additional leisure from reduced working time below the current levels now appears much less than in the past, at least as evidenced by the decisions the workforce has made regarding working time. Institutional constraints and rigidities in scheduling may however prevent worker preferences for fewer hours from being realized. Surveys show that a considerable number of Canadians would prefer to work fewer hours for a prorated cut in wages. But it appears most full-time workers appear satisfied working 35-40 hours per week and do not desire reductions in weekly hours, although they may value increased holidays and vacation time. Certainly productivity gains allow society to choose less working time, although at a cost of less real income. Many European countries appear to be taking this option, which appears much less popular in North America. The numbers of years worked over the life cycle is affected by the number of years of postsecondary education one pursues and the average age of retirement. Decisions determining investment in education and age of retirement are affected at least indirectly by the level of productivity or wealth of the society. For example, the decision to retire depends on the generosity of public and private pensions. Increased productivity and the larger tax base allow a richer enrichment of the public pension system. The rapid economic and productivity growth of the postwar period up to 1973 was a key precondition for the enrichment of the public pension system. Increases in productivity can lead to better returns on private pension plans through rising stock market valuations arising from productivity-enhanced earnings, increasing the incentive to retire. The decision to pursue postsecondary education may be linked to the rate of return on this investment. Increased aggregate productivity growth raises real labour compensation and can provide an increased incentive to accumulate human capital, particularly if the returns in occupations requiring higher education exceed those for occupations with lower educational requirements. The average number of years in postsecondary education obtained is also linked to the educational opportunities available to the population. A well developed postsecondary education sector allows high postsecondary enrolment rates. Again, the large tax base needed to finance such public investments is predicated on the wealth of the country, in turn a reflection of high productivity levels. A strong case can be made that longer life expectancy increases economic well-being and should be factored into measures of well-being. The Index of Economic Well-being attempts to capture this by making an upward adjustment in private consumption proportionate to the percentage increase in life expectancy.

32
In theory, higher income arising from productivity gains allows individuals to purchase better health care or the government to supply better health care services. In the immediate postwar almost all health care expenditures were private. With the introduction of hospital insurance in the late 1950s and medicare in the mid-1960s public health spending became much larger both in absolute terms and as a proportion of total health expenditure. Rising real incomes certainly fuelled this increase in health expenditures. Certain types of consumer expenditures do not contribute to economic well-being, but rather are necessary, but regrettable expenditures forced on consumers by the exigencies of modern life. A true measure of economic well-being subtracts these expenditures from consumption. The Index of Economic Well-being identifies four of these regrettables- cost of auto accidents, cost of pollution abatement equipment, costs of commuting, and costs of crime, and subtracts these costs from private consumption. The relationships between productivity and these four regrettables are complex and can be both positive and negative. For example, increased productivity and real income can increase the number of auto accidents as there is greater economic activity and traffic, but it can reduce accidents through increased public expenditure on safer roads. Higher productivity and real income can increase the cost of pollution abatement because of higher pollution levels associated with increased economic activity, while at the same time with higher income people may be willing to pay for and accept more regulation of pollution, reducing pollution abatement costs. The costs of commuting rise with higher levels of economic activity as more traffic increases commuting time. The costs of commuting can be reduced when a larger tax base allows public investment in public transit or highways.
The relationship between productivity and the costs of crime is less clear than for the three other types of regrettables. The distribution of productivity and real income gains in an uneven and inequitable manner, with the creation of a small very rich class may foster crime. More likely, the increased tax base from productivity growth allows the possibility of social spending to attack the social roots of crime.
Economic well-being can be improved by the increased supply of public goods and public consumption is included in consumption flows in the Index of Economic Well-being. Increased income arising from productivity gains results in additional tax revenues under almost all types of tax regimes (the exception would be a tax system completely funded by a head or poll tax). Part of these revenues can be used to finance the provision of public goods and services (e.g. education, health services, parks, defense, etc.) without charge or on a heavily subsidized basis to the population and represent public consumption, an important part of total consumption. Government expenditures on transfers to persons are not included in public consumption, as they are used by the recipients to finance private consumption.
Of course, increased productivity thus increases the tax base and allows for, but does not automatically lead to, increases in public consumption. With increased income,

33
governments may choose to lower taxes, or spend the additional revenues in other ways (e.g. pay down debt, increase transfer payments, capital spending). The Index of Economic Well-being considers unpaid labour, both within the household (homework) and outside the household (volunteer work), as contributing to economic well-being and adds the value (estimated on a replacement, generalist basis) of unpaid work to private and public consumption. Increases in the number of hours of unpaid work thus raise economic well-being.
Productivity gains can have indirect effects of the amount of unpaid labour undertaken by society. For example, higher productivity increases real incomes and workers substitute non-working time for working time and reduce annual hours worked. Some of this additional non-work time may be used for household work, or for volunteer work.
2) Stocks of Wealth
Stocks of wealth represent the sustainability component of economic well-being. While the depletion of stocks of wealth such as natural resources may add to current income, it reduces the potential income of future generations and hence should be factored into measures of economic well-being that care about intergenerational equity. The components of wealth stocks in the Index of Economic Well-being are physical capital, research and development capital, human capital, natural resources, net foreign debt, and the social costs of environmental degradation. Increases in these components (excluding net foreign debt), measured on a constant price, per capita basis, raise economic well-being.
The link between productivity and the physical residential and non-residential capital stock is direct. Higher productivity leads to higher national income, which means higher profits. Profits are a key determinate of investment, and the additional investment augments the capital stock. Technological change, the key driver of productivity growth, can also have a negative effect on certain components of the capital stock, rendering them economically obsolete. But this effect in terms of the aggregate capital stock is normally much smaller than the positive effect of productivity and economic growth on investment and the capital stock.
The link between productivity and research and development (R&D) is also
direct. Higher productivity increases income and profits. These additional profits finance increased research and development spending that adds to the stock of research and development.
Higher productivity and incomes can have at least two effects on human capital. First, if people have additional income they may use that to personally accumulate human capital through their own expenditure. Second, and more important higher productivity and incomes lead to higher tax revenues, giving the government more means to support human capital accumulation through investments in the education system.
34
In terms of natural resources, one might think that there is no link between
productivity and natural resources stocks, or even a negative link. With higher productivity and incomes, consumption will increase and consequently our stock of natural resources will be run down. And certainly that can happen, as the famous 1972 Club of Rome report emphasized.
But the stock of natural resources is linked to the price of natural resources. The greater demand for natural resources arising from higher incomes raises their prices. Higher prices leads to increased supply through more exploration and development, which increases the proven stocks of natural resources, as well as reduced demand through use of substitutes. In addition, productivity gains through technological advance in the natural resource sector can actually increase the stock of resources by lowering production costs and making previously non-economically viable reserves economically viable. For example, technological change has reduced the cost of extracting oil from the tar sands in Northern Alberta, with the result that the size of the economically viable reserves have increased significantly. Equally, productivity gains in animal husbandry in the farm sector have been impressive. So productivity growth can actually have a positive effect on the overall sustainability of resources by reducing the cost of extraction and therefore increasing the economic supply of natural resources.
The link between productivity and net foreign debt is obvious and one can hypothesize a number of possible relationships. Higher productivity has implications for the balance of payments as it can affect imports, exports and capital flows. A productivity and growth boom can suck in imports, increasing foreign debt. Equally, it can create an export spurt, due to increased competitiveness, that reduces debt. It may also make the country more attractive for foreign investors, and increase debt. There are no a priori reasons why any of these tendencies should be dominant. The United States is currently enjoying very strong productivity growth and is seeing its foreign debt soar because of a large trade deficit.
Like its impact on natural resources, productivity growth can have both a positive
and negative effect on the environment and on the social costs of environmental degradation. Greater economic growth fuelled by productivity growth can increase the level of pollution as additional economic activity generates more emissions and waste. This is certainly the environmentist perspective on the issue.
But the technological advances associated with productivity growth can also lead
to cleaner and more environmentally-sensitive production processes that reduce environmental degradation. Moreover, richer societies give greater weight to environmental problems than poorer societies and are more able and willing to pay the price of greater controls on pollution or pay for cleaning up the effects of pollution. Richer countries score much better than poor countries for many environmental indicators.

35
There is a spirited debate concerning overall trends in the quality of the environment in the world and there is no consensus on the issue.11 To be sure, quantification of environmental trends is very difficult.12 But a case can be made that economic and productivity growth are positively associated with improvements in environmental quality through a number of mechanisms, including technological advances that directly reduce pollution and a high-income elasticity for environmental quality.
3) Income Inequality
The degree of equality in society is a component of the overall economic well-
being of that society and there is wide agreement that increases in equality (or decreases in inequality) raise economic well-being, at least within the current range of values posted for this variable in OECD countries. The Index of Economic Well-being includes two income distribution variables, a measure of poverty intensity (the product of the poverty rate or incidence and the poverty gap) which reflects the income distribution of low-income persons, and the Gini coefficient, which measures the equality of income of the overall population.
A key issue in the discussion of the relationship between productivity and poverty is whether an absolute or relative concept of poverty is employed. If one uses an absolute concept of poverty, then increased incomes through productivity gains can pull individuals above the poverty line. There is a direct link between productivity and poverty both through the market income people earn and potentially through increased government transfers from the expanded tax base for people who are unable to participate in market activities.
With a relative definition of poverty, such as the definition used in the Index of
Economic Well-being of households with less than one half median equivalent income, there is less of a direct link between productivity and poverty. If everyone receives the same percentage increase in income because of productivity gains, there is no change in the relative distribution of income and hence in the poverty rate.
The impact of economic and productivity growth on the overall income distribution of the population is a complex issue. A key consideration is the definition of income used, whether market income, money income, which includes transfer payments, or after-tax income. Market forces largely influence market income while government policies through transfers and taxes directly affect both money income and after-tax income and reduce inequality.
11 See. for example, the recent book The Skeptical Environmentalist (Lomberg, 2001) and the intense debate it has generated. 12 Problems include the weighting given various environmental indicators, the lack of national time series data for many indicators, uncertainty about the effects of environmental trends, and ignorance about the existence of threshold effects whereby permanent damage is done once a certain level is reached. Another issue is the importance given to the precautionary principle.
36
In certain historical circumstances, productivity and economic growth may lead to a narrowing of market income differentials as persons at the bottom are brought into middle-income jobs. In other situations, growth may be associated with skill-biased technical change and benefit the highly skilled and educated to the detriment of the poorly educated, increasing market inequalities. As market income inequalities have increased in Canada over the last three decades, this second scenario seems more relevant to the Canadian experience.
Increased productivity and real income growth also expands the tax base, giving
the government at least the potential to reduce after-tax income inequality by increasing money transfers to low-income individuals, reducing taxes on the poor and raising them on the non-poor, and implementing social policies that increase the earning potential of the poor.
4) Economic Security The degree of economic security in society is a component of the overall economic and social well-being of that society and there is wide agreement that increases in economic security (or decreases in economic insecurity) raise economic well-being, at least within the current range of values posted for this variable in OECD countries. The Index of Economic Well-being includes four variables for economic security covering four risks facing the population: the risk of unemployment, the risk of financial distress caused by illness, the risk of single-parent poverty, and the risk of poverty in old age. Increased productivity can reduce all four risks.
In terms of the financial risk arising from unemployment, many people in the past have believed that productivity gains would lead to higher unemployment, reducing economic well-being. But according to public opinion surveys (Graves and Jenkins, 2002), three quarters of Canadians do not think that productivity gains are synonymous with job losses and believe that in the long run productivity actually can have a positive effect on unemployment, or at least not have a negative effect on unemployment. Economic theory and analysis support this view. It is now well recognized that it is aggregate demand and demographic structures that in the long run determine employment and unemployment levels, not the pace of productivity growth.
In addition, with greater productivity, incomes and tax revenues, we can choose to
have a more generous social welfare system, including greater employment insurance coverage and benefits. Higher levels of economic and social well-being would result from this greater generosity because the financial risks associated with unemployment would be reduced. It is much easier to enrich a social program in periods of rapid growth and expanding tax revenues. On the other hand, during periods of weak growth and declining revenues, social programs become candidates for retrenchment.
In terms of the financial risks associated with illness, greater productivity gains
leading to higher incomes and tax revenues again result in a greater possibility of both private and public expenditure on health and reduces the financial risk from sickness and

37
increases economic security. The establishment of medicare in Canada, introduced in the mid-1960s during a period of rapid productivity growth and rising tax revenues, represented a massive reduction in the financial risk from illness for Canadians. The delisting by provincial governments of certain medical procedures in the mid-1990s, precipitated by the fiscal crisis arising from weak economic and productivity growth, increased the financial risk from illness.
Productivity gains can result in reductions in the rate of poverty for single parent families through increases in real wages and through an expanded tax base which allows greater generosity of income transfers and provision of services to single parents so they can become self-reliant.
The implications of productivity growth for poverty among the elderly is largely
through the impact of productivity on the ability of government to fund transfers to the elderly given the low labour market participation of this group.
The Impact of Economic Well-being on Productivity The previous sub-section of the paper discussed the linkages running from productivity to economic well-being through the four dimensions or components of the Index of Economic Well-being. This sub-section looks more briefly at the relationship from the other direction, namely, the impact of changes in economic well-being on productivity. In many instances, exogenous improvements in a number of the variables contributing to economic well-being can boost productivity growth. 1) Consumption Flows Increases in real wages, in certain types of government spending, and declines in working time, all developments that raise economic well-being, also can increase productivity. As noted earlier in the paper, the relationship between real wages and productivity can run from wages to productivity as well as from productivity to wages. The price of labour relative to other factors of production determines the relative intensity of labour used in the production process. Ceteris paribus, the higher the wages, the less labour employed, and the higher the average productivity of the labour actually used as more capital-intensive methods of production are used. Thus exogenous wage shocks can lead to factor adjustments that raise labour productivity to higher levels. Government spending in a number of areas including infrastructure, research and development spending, and education and training can boost private sector productivity. Decreases in the length of the average work week can increase productivity, measured on an hours basis, because workers work more intensely within the shorter work period. This finding has often been observed when a shorter work week has been introduced.

38
2) Stocks of Wealth
Stocks of wealth are inputs into the economy�s aggregate production function Thus exogenous increases in the capital stock, in the stock of research and development, and in human capital, all variables in the sustainability component of economic well-being, can boost productivity. Investment, innovation, and human capital are the key determinants of productivity growth. Degradations of environmental stocks such as soil depletion or global warming due to CO2 emissions can have negative effects on productivity.
There are feedback mechanisms between productivity and wealth stocks. Virtuous
circles or spirals are created when higher productivity leads to more investment and stocks of wealth, which in turn leads to higher productivity, which in turn leads to more income and investment. 3) Income Equality The overall impact of inequality on economic growth and productivity is complex and still poorly understood, as noted in the first section of this paper. Traditionally, it has been argued that inequality is good for economic growth because of the positive incentive effects. Recently, a literature has developed that stresses the negative political economy effects of inequality as well as the negative effect on human capital accumulation because of liquidity constraints on borrowing by the poor to finance education. More research is needed on this issue before definitive conclusions can be reached. 4) Economic Security As was the case for the impact of inequality on economic and productivity growth, the impact of economic security is also poorly understood. Increased economic security contributes to productivity growth through the same mechanisms outlined above for greater equality and less poverty. Indeed, poverty is a key element in two of the four sub-components of the economic security component in the Index of Economic Well-being. If people feel that they are more secure, both in term of income and employment, they may be willing to make more investments in human capital. Again, it should be noted that there are positive feedback mechanisms running from productivity to economic security and then from economic security back to productivity. Again, more research is needed on this issue before definitive conclusions can be reached.

39
IV Empirical Evidence on the Linkage between Productivity and Poverty in Developing Countries This section of the paper examines the empirical evidence on the linkage between
productivity, both in terms of levels and rates of growth, and poverty in developing countries. The first sub-section examines the contribution of productivity growth to economic growth and GDP per capita growth in developing countries. The second sub-section explores the empirical relationship between productivity and poverty in developing countries.
Contribution of Productivity Growth to Economic and GDP per Capita Growth in Developing Countries Economic growth and income growth (GDP per capita growth) in the three regional aggregates of developing countries can be decomposed into components to show the relative contribution labour productivity has made to these two variables.13 1) The Contribution of Productivity Growth to Economic Growth Economic growth can be decomposed into growth in output per worker and growth in employment, with the latter in turn decomposable into population growth and growth in the employment/total population ratio.14 Exhibit 1 provides summaries of the percentage contributions summaries for the three regions or continents.
Based on both the Penn Table and the KILM-GGDC data set, economic growth was the slowest in Africa over the last three decades, with real GDP rising at only an average annual rate of 2.71 per cent and 3.10 per cent respectively. It was followed by Latin America at 3.65 per cent per year and Asia at 5.97 per cent based on the Penn Table. The KILM-GGDC equivalents were 3.49 per cent and 5.94 per cent respectively. Given the negative productivity growth observed from the Penn Table data, output per worker made a negative contribution to output growth in Africa, with population growth accounting for all economic growth. In contrast, in Asia, the robust productivity growth accounted for 63.8 per cent of output growth, with population growth accounting for 30.8 per cent. Latin America was between Africa and Asia, with productivity growth accounting for 22.2 per cent of output growth, population growth 59.7 per cent, and employment/total population growth 18.4 per cent. The story is
13 Two different data sets have been used to conduct this analysis and both show similar trends. The first one is based on the Penn World Table, version 6.1. The regional aggregates do not include all of the countries available from the Penn World Table. The data set was build to include only the countries for which Sala-i-Martin (2002) published poverty rates. Therefore the growth rates for the African aggregate should be interpreted as a proxy of the African growth rate and the same goes for the other two regional aggregates. The other data set is the Key Indicators of the Labour Market and Groningen Growth and Development Centre (KILM-GGDC) data set. 14 See CSLS (2003a) for all data behind the estimates in this paper.

40
essentially the same using KILM-GGDC data with the difference that labour productivity growth contributed positively to economic growth in Africa.
Exhibit 1
GDP Growth and its Components in Developing Regions, 1970-1998, based on the Penn World Table and the KILM-GGDC Data Set
GDP Growth Pop GDP/worker Empl/Pop
Penn World Table Estimates Africa 2.71 2.80 -0.08 0.0 % Contribution 100.0 103.3 -3.0 0.0 Latin America 3.65 2.18 0.81 0.67 % Contribution 100.0 59.7 22.2 18.4 Asia 5.97 1.84 3.81 0.23 % Contribution 100.0 30.8 63.8 3.9 KILM-GGDC Estimates Africa 3.10 2.77 0.36 -0.04 % Contribution 100.0 89.3 11.6 -1.2 Latin America 3.49 2.10 0.76 0.59 % Contribution 100.0 60.3 21.7 17.0 Asia 5.94 1.85 3.42 0.58 % Contribution 100.0 31.1 57.5 9.7 Source: CSLS (2003a:Tables 4 and 5).
One observes that the greater the output growth, the greater the productivity growth in both absolute and relative terms. When economic growth is strong, productivity growth will represent the lion�s share of output growth, in part because employment and population are supply-constrained. Consequently, the importance of population growth for economic growth is in inverse proportion to the strength of economic growth. 2) The Contribution of Productivity Growth to GDP Per Capita Growth Growth in living standards, proxied by GDP per capita can be decomposed into growth in output per worker and growth in the employment/total population ratio. Exhibit 2 provides a summary for the three regions or continents.

41
Exhibit 2
GDP Per Capita Growth and its Components in Developing Regions, 1970-1998, based on the Penn World Table and the KILM-GGDC data set
GDP/Capita GDP/Worker Empl/Pop
Penn World Table Estimates Africa -0.08 -0.08 0.00 % Contribution 100.0 100.0 0.0 Latin America 1.44 0.81 0.67 % Contribution 100.0 56.3 46.5 Asia 4.05 3.81 0.23 % Contribution 100.0 94.1 5.7 KILM-GGDC Estimates Africa 0.32 0.36 -0.04 % Contribution 100.0 111.3 -11.3 Latin America 1.35 0.76 0.59 % Contribution 100.0 55.8 43.9 Asia 4.02 3.42 0.58 % Contribution 100.0 85.1 14.4 Source: CSLS (2003a:Tables 6 and 7). Based on Penn World Data, of the three continents, Africa experienced the worst performance in terms of living standards over the last three decades, with real GDP per capita actually falling at an average annual rate of 0.08 per cent. It was followed by Latin America with a 1.44 per cent annual gain and Asia at a strong 4.05 per cent. Data from the KILM and GGDC databases tell a similar story with Africa experiencing the worst record in terms of growth in living standards. But since estimates by regions are aggregates of a different set of countries (the aggregate based on Penn Table includes 27 countries while the one based on KILM includes only 10), growth is slightly higher at 0.32 per cent a year on average. GDP per capita growth in Latin America and Asia are very close to their Penn Table equivalent at 1.35 per cent and 4.02 per cent respectively. Output per worker growth accounted for slightly over half of GDP per capita growth in Latin America, irrespective of the data source used (56.3 per cent based on the Penn Table and 55.8 based on the KILM and GGDC databases). Increases in the employment/total population ratio accounted for the remaining growth in living standards (46.5 per cent according to the Penn Table and 43.9 per cent based on KILM-GGDC). In Asia, almost all the growth in living standards was accounted for by productivity gains (94.1 per cent and 85.1 per cent). The percentage contributions for Africa have little

42
meaning because of the low value for GDP per capita growth (-0.08 per cent and 0.32 per cent) upon which the calculations are based.
One observes that the greater the GDP per capita growth, the greater the productivity growth in both absolute and relative terms. When productivity growth is robust, increases in living standards follow.15
The bottom line from the discussion above is that productivity gains are the driving force behind income gains, and their relative importance actually increases as productivity growth picks up.
The Empirical Relationship Between Productivity, Poverty, and Income Inequality This sub-section regroups the statistical analysis that was done using the different data sources to study the relationship between key variables. The first set of relationships studied is the one between productivity and poverty, focusing on both changes in productivity and poverty reduction and on the level of productivity and poverty incidence. The relationships between GDP growth and poverty and per capita GDP and poverty are also examined and compared and contrasted to the productivity/poverty relationships. The second set of relationships is the more complex relationship between labour productivity, poverty and income inequality, both in terms of levels and growth. The third set of relationships examined are those between labour productivity levels and growth and poverty incidence and changes, but using alternative measures of poverty developed by the UNDP, namely the Human Development Index (HDI) and the Human Poverty Index (HPI). The Relationship Between Productivity and Poverty Using Simple Regression Analysis This sub-section explores the link between productivity and poverty as a bivariate relationship. It first uses two Sala-i-Martin poverty estimates and bases the regressions on both productivity growth rates and changes in poverty and productivity levels and the level of poverty. It then repeats the analysis using World Bank poverty estimates
15 Again, the experiences of certain countries are noteworthy. Despite the dismal performance of Africa, two countries on this continent exhibited very significant increases in living standards because of their strong productivity growth � Botswana and Mauritius. In the KILM-GGDC data set Botswana and Mauritius are not available and therefore, Egypt had the fastest growth in living standards. Barbados enjoyed the strongest increases in living standards in Latin America and also had the strongest productivity gains in the region. According to the KILM-GGDC data set, Chile had the highest real GDP per capita growth rate in Latin America. Most Asian countries experienced strong GDP per capita growth thanks to their strong productivity growth and this true is in both data sets.

43
The literature has focused on the relationship between economic growth and poverty and not on the relationship between productivity and poverty.16 One reason that may explain why productivity has been neglected in the literature as a determinant of poverty reduction is that economic growth already subsumes productivity growth. It may have been felt that its impact was already covered. Economic growth can reduce poverty both by raising real wages and creating jobs. The difficulty of obtaining reliable labour input data in most developing countries, needed to calculate labour productivity, may have contributed to the use of GDP per capita or mean income in poverty reduction studies as well. Exhibit 3, based on data from the Penn World Tables and the KILM-GGDC data set, presents the R-squared coefficients from regressions of changes in poverty on economic growth, changes in poverty on per capita GDP growth, and changes in poverty on productivity growth as measured by output per worker growth, and for both the one dollar and two dollar poverty measures over the 1970-98 period for the three regions of the developing world and the overall developing world. The relationship between growth in real GDP, per capita GDP, or productivity and changes in poverty is negative in all instances. Poverty tends to fall with economic growth, with income growth, and with productivity growth. The relationship between productivity growth and the change in poverty for all developing countries is shown based on the Penn World Tables estimates in Chart 1 for the one dollar poverty measure and in Chart 2 for the two dollar poverty measure.
A first observation is that there are significant differences in results between the two data sets. In general, the relationship between growth in the three economic variables and poverty reduction is considerably better explained using the Penn World Tables data than the KILM-GGDC data. Out of 24 R-squared coefficients (three variables for four geographical areas, and two poverty measures), the Penn World Tables values are higher in 20 cases. The only exceptions are the two dollar poverty estimates for all three economic variables and one dollar poverty estimates for real GDP for Latin America where the KILM-GGDC estimates are higher. The most dissimilar results between the two data sets are for Africa where the Penn World Tables show a consistently tight relationship between the three economic variables and poverty while the same relationships are in most cases poorly explained by the KILM-GGDC data.
16 See CSLS (2003a) for a review of the literature on the relationship between economic growth and poverty in developing countries.

44
Exhibit 3
R-Squared Coefficients between Economic Growth, Per Capita GDP Growth and Productivity Growth and Changes in Poverty, based on Penn World Tables and
KILM-GGDC Data Penn World Table
One dollar a day poverty measure Asia* LA Africa Developing Countries
R-squared Coefficient Real GDP 0.010 0.131 0.517 0.455 -6.19 Real GDP per capita 0.171 0.289 0.699 0.527 -6.40 Productivity 0.197 0.228 0.528 0.496 -6.25
Two dollars a day poverty measure Real GDP 0.318 0.256 0.519 0.569 -9.56 Real GDP per capita 0.489 0.454 0.691 0.673 -9.99 Productivity 0.481 0.379 0.694 0.626 -9.71 KILM-GGDC One dollar a day poverty measure Asia* LA Africa Developing Countries R-squared Coefficient Real GDP 0.0058 0.2436 0.0721 0.1118 -2.51 Real GDP per capita 0.0106 0.1848 0.410 0.1266 -2.25 Productivity 0.0050 0.1897 0.0003 0.1295 -2.66
Two dollars a day poverty measure Real GDP 0.2042 0.7238 0.1244 0.2266 -5.26 Real GDP per capita 0.2618 0.6378 0.1167 0.2622 -4.77 Productivity 0.2959 0.6128 0.0338 0.2988 -5.97 Source. CSLS (2003a:Appendix Table 26). Also see the Appendix Charts. *Asia excluding Korea, Taiwan, Singapore and Hong Kong. These four countries had no or virtually no poverty in either 1970 or 1998 according to the Sala-i-Martin poverty data base. Note: The relationship between growth in real GDP, per capita GDP, or productivity and changes in poverty is a negative one in each case considered.
The differences in results between data sets may reflect differences in the number of countries in the sample. For the Penn World Tables, the results are based on data for 20 African countries, 19 Latin American countries, and 13 Asian countries for a total of 52 countries. For the KILM-GGDC data set, the results are based on data for 6 Latin American countries, 7 African countries, and 13 Asian countries for a total of 26 countries. The fact that the number of countries in the Penn World Table is double that of the KILM-GGDC data set suggests the former results may be more robust as the greater sample size provides more degrees of freedom.
Despite the stronger fit of the relationship between the three economic variables
and poverty reduction found in the Penn World Tables compared to the KILM-GGDC data set, there is one common pattern in the results across the two data sets. The
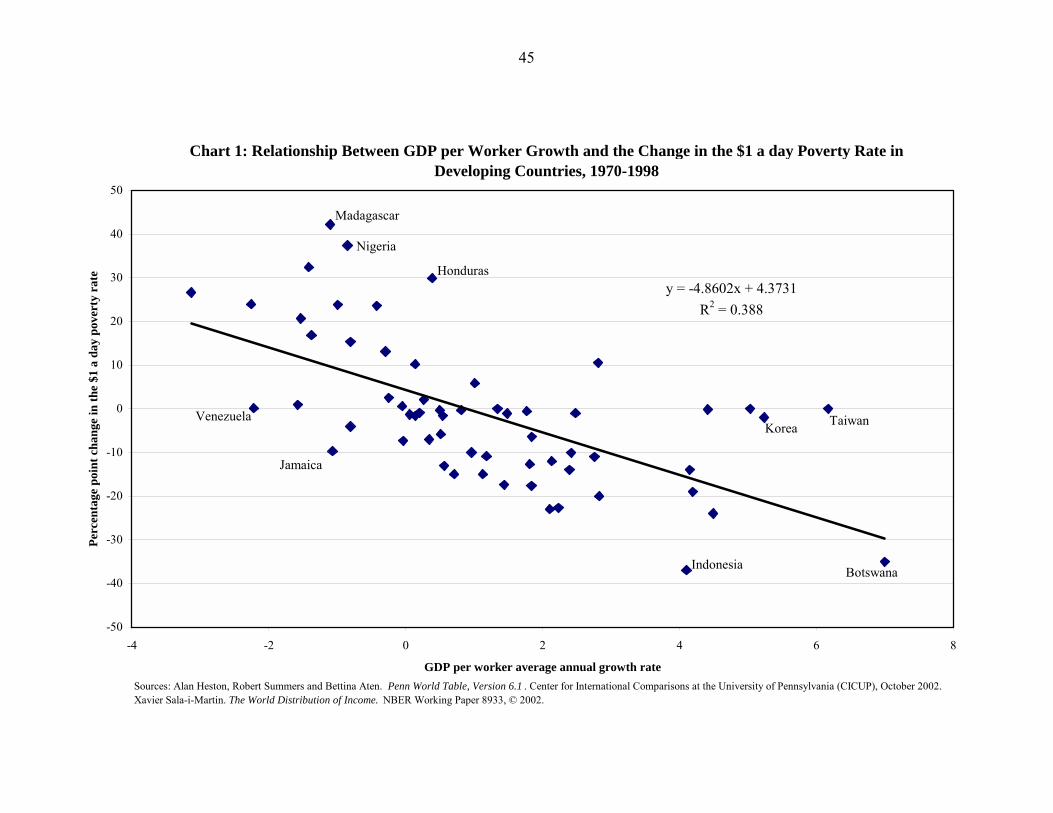
45
Chart 1: Relationship Between GDP per Worker Growth and the Change in the $1 a day Poverty Rate in Developing Countries, 1970-1998
y = -4.8602x + 4.3731R2 = 0.388
-50
-40
-30
-20
-10
0
10
20
30
40
50
-4 -2 0 2 4 6 8
GDP per worker average annual growth rate
Perc
enta
ge p
oint
cha
nge
in th
e $1
a d
ay p
over
ty r
ate
Sources: Alan Heston, Robert Summers and Bettina Aten. Penn World Table, Version 6.1 . Center for International Comparisons at the University of Pennsylvania (CICUP), October 2002. Xavier Sala-i-Martin. The World Distribution of Income. NBER Working Paper 8933, © 2002.
Indonesia
Taiwan
Madagascar
Nigeria
Honduras
Botswana
Jamaica
KoreaVenezuela

46
Chart 2: Relationship Between GDP per Worker Growth and the Change in the $2 a day Poverty Rate in Developing Countries, 1970-1998
y = -7.6953x + 2.7972R2 = 0.5099
-80
-60
-40
-20
0
20
40
60
-4 -2 0 2 4 6 8
GDP per worker average annual growth rate
Perc
enta
ge p
oint
cha
nge
in th
e $2
a d
ay p
over
ty r
ate
Sources: Alan Heston, Robert Summers and Bettina Aten. Penn World Table, Version 6.1. Center for International Comparisons at the University of Pennsylvania (CICUP), October 2002. Xavier Sala-i-Martin. The World Distribution of Income . NBER Working Paper 8933, © 2002.
Indonesia
TaiwanHong Kong
Honduras
Jamaica
ChinaIndia
Bolivia

47
R-squared coefficients for the two dollar poverty measure are always higher than the one dollar estimates. This reflects the higher poverty rates for the two dollar measure and hence the greater potential for decline. This potential is often realized, meaning that there are fewer countries displaying no change in poverty so that the linear relationship fits more accurately, producing a higher R-squared coefficient. Focusing on the Penn World Table results because of their potentially greater robustness, the most significant observation is that the R-squared coefficients in all three regions (but not for all developing countries) for both poverty measures from the regressions of changes in poverty on productivity growth are greater than those from the regressions of changes in poverty on economic growth. Productivity growth thus seems to have more explanatory power in terms of changes in poverty than economic growth.
Part of economic growth reflects employment growth arising from population growth. This growth, which does not increase the employment to population ratio, may have little impact on poverty reduction. Its effect is more to keep poverty from rising than to reduce it. This would explain why the relationship between economic growth and poverty is, at least for the likely more robust Penn World Tables results, always considerably weaker than that between both income growth and poverty and productivity growth and poverty.
For the three economic variables under study, the variable with the best fitting
relationship with changes in poverty across almost all regions and both poverty measures, at least for the results based on the Penn World Tables data is per capita GDP or income. This is not surprising as it is increased income on a per capita basis which reduces the incidence of poverty.
The fit of the relationship between productivity or output per worker growth and poverty reduction in most regions tends to be in an intermediate position between that of GDP growth and poverty reduction and per capita GDP growth and poverty reduction. This is explained by the fact that there is not a one-to-one relationship between productivity increases and per capita income increases because of changes in the employment to population ratio. If productivity rises, but proportionately fewer persons are working because of layoffs, poverty will not fall just as per capita income will not rise. Consequently, one would expect a tighter relationship between per capita income changes and poverty reduction than between productivity growth and poverty reduction. On the other hand, the relationship between changes in productivity and poverty will tend to be stronger than the relationship between GDP growth and poverty as the latter includes employment growth associated with population growth which has no effect on poverty reduction.
The results based on the Penn World Tables (in stark contrast to the KILM-GGDC based results) show high R-squared coefficients between all three economic variables and poverty reduction for Africa. This reflects the high poverty rates in this region and hence the greater scope for poverty reduction in absolute terms.

48
In terms of the magnitude of these relationships, the final column in Exhibit 3 shows the estimated slope coefficients. All estimates are statistically significant at the 5 per cent level or better. These estimates indicate by how much the change in poverty is reduced by a given change in the independent variable (the growth rate of either GDP, GDP per capita or productivity) across all developing countries on average. For example, a 1.00 percentage point increase in the annual rate of growth of productivity decreases the change in the $1 a day poverty rate between 1970 and 1998 by 6.25 percentage points.
Looking first at the estimates based on Penn data, it is GDP per capita growth that
has the greatest power in reducing changes in poverty, both when the $1 measure is used and when the $2 measure is used. Productivity growth is a close second, while GDP growth has the least power in reducing changes in poverty. Note that the coefficients are larger in absolute magnitude in the $2 regressions than in the $1 regressions in each case, however. This implies that a given percentage point increase in one of the independent variables decreases the change in the $2 a day poverty rate to a larger degree than the change in the $1 a day poverty rate. This is a favourable result because it means that income growth, for example, lifts the extremely poor not just above the $1 a day poverty line but above the $2 a day poverty line as well. In the example, the estimated coefficient tells us that the $2 poverty rate grows by 10 points less than it otherwise would if GDP per capita grows at a rate 1.00 percentage points higher, while the $1 poverty rate grows by only 6.4 points less. The $2 poverty rate is composed of two parts though, the $1 poverty rate and the proportion of the population with between $1 and $2 a day. The results tell us that the change in this latter part is reduced to a larger degree than the change in the former part, so in other words, growth is not reducing the change in the proportion of the population with less than $1 a day simply by increasing the change in the proportion of the population with between $1 and $2 a day.17
Turning now to the results of the KILM-GGDC regressions, this same conclusion
holds, that is, the decrease in the change of the $2 poverty rate in response to a given increase in the growth of productivity, GDP per capita or GDP is larger than the decrease in the change of the $1 poverty rate. The effects in both cases are much smaller in magnitude than in the Penn regressions though. There is another difference with the Penn results as well, namely, productivity growth and GDP growth both have more power in reducing the change in poverty than GDP per capita growth. This is a somewhat unexpected result, although not entirely implausible. However, it should be stated again
17 It is important to realize, however, that part of this result of larger coefficients from the $2 regressions could be interpreted as an artifact of the treatment of the data. The poverty rates are measured in percentage points, and the change in the poverty rates is an absolute change rather than a per cent change, thus the changes are measured in percentage points as well. But the $2 poverty rates are by nature larger than the $1 poverty rates, and a 10 percentage point change from a large number (for example from 70 per cent to 60 per cent) does not necessarily represent a larger relative change than a 6.4 percentage point change from a smaller number (for example from 45 per cent to 38.6 per cent). In the example each percentage point change corresponds roughly to a relative change of -14 per cent. Thus, in response to a given increase in the rate of growth of income, for example, the relative change in the growth of the $2 poverty rate may not be as much greater than the relative change in the growth of the $1 poverty rate as compared to the difference in absolute changes. Whether one values relative decreases in the change in the poverty rate over absolute decreases is a normative question though.

49
that the KILM-GGDC sample is much smaller than the Penn sample and hence the results may not be as reliable. The previous results suggest that growth in the incidence of poverty is reduced as labour productivity growth rises. We expect a similar result to hold in terms of the levels of productivity and poverty. Countries having higher levels of labour productivity should have lower levels of poverty incidence. We report the R-squared coefficients from regressions of poverty incidence on real GDP per worker using both the Penn World Tables and the KILM-GGDC estimates for the year 1998. R-squared coefficients are also reported for the relationship between the level of per capita GDP and poverty (Exhibit 4). All estimated slope coefficients from these regressions have a negative sign as expected but the goodness of fit varies across regions. The estimated relationship for all developing countries is shown in Chart 3 for the one dollar poverty measure and in Chart 4 for the two dollar measure.
For the eight R-squared coefficients from the regressions of the poverty rate on the productivity level for each data set (four geographical regions and two productivity measures), the estimates based on the Penn World Tables exceeded those of the KILM-GGDC data set four times and the KILM-GGDC data set exceeded the Penn World table estimates four times. In contrast to the growth rate estimates in the previous section, the relationship between productivity levels and poverty rates does not appear to be tighter in the Penn World Tables than in the KILM-GGDC data set. The R-squared coefficients for the productivity/poverty level relationship are the highest in Africa, independent of the productivity estimate used. The KILM-GGDC estimates produce a coefficient of 0.512 when the one dollar a day poverty measure is used and a higher coefficient of 0.671 for the two dollar a day measure. Using the Penn World Tables estimates yields a higher R-squared coefficient of 0.717 using the two dollars a day poverty measure, but a lower one using the one dollar a day measure of 0.482.
The fit of the linear relationship between poverty and productivity levels is weaker in Latin America than in Africa. The R-squared coefficients for the one and two dollars a day poverty measures based on the KILM-GGDC data set are 0.239 and 0.593 respectively. The coefficients derived from the Penn World Tables estimates were of the same magnitude, 0.339 and 0.539 respectively.
The fit of the relationship between labour productivity and poverty levels is also weak in the Asian region. Based on the KILM-GGDC estimates and the one dollar poverty measure, the R-squared coefficient is 0.295, higher than the one for Latin America. When the two dollars a day poverty measure is used, the correlation coefficient for Asia is lower at 0.492. Using the Penn World Tables estimates did not improve the goodness of fit as the R-squared coefficients for Asia associated with the one and two dollars a day poverty measures are 0.188 and 0.336 respectively.

50
Chart 3: Relationship Between GDP per Worker and the $1 a day Poverty Rate in Developing Countries, 1998
y = -0.0012x + 30.295R2 = 0.3854
0
10
20
30
40
50
60
70
80
0 10000 20000 30000 40000 50000 60000
GDP per worker (in 1996 chained US dollars)
$1 a
day
pov
erty
rat
e
Sources: Alan Heston, Robert Summers and Bettina Aten. Penn World Table, Vers?on 6.1 .?Center for International Comparisons at the University of Pennsylvania (CICUP), October 2002. Xavier Sala-i-Martin. The World Distribution of Income . NBER Working Paper 8933, © 2002.
Tanzania
Hong KongTaiwanKorea

51
Chart 4: Relationship Between GDP per Worker and the $2 a day Poverty Rate in Developing Countries, 1998
y = -0.002x + 54.171R2 = 0.5601
0
10
20
30
40
50
60
70
80
90
100
0 10000 20000 30000 40000 50000 60000
Sources: Alan Heston, Robert Summers and Bettina Aten. Penn World Table, Version 6.1. Center for International Comparisons at the?Univers?ty of P?nnsylvania (CICUP), October 2002. Xavier Sala-i-Martin. The World Distribution of Income . NBER Working Paper 8933, © 2002.
Tanzania
Hong KongTaiwanKorea

52
Exhibit 4
R-squared Coefficients between Levels of Real GDP per Capita and Labour Productivity, and Poverty Incidence, 1998, based on Penn World Tables and KILM-
GGDC data Penn World Table
One dollar a day poverty measure Asia* LA Africa Developing Countries
R-squared Coefficient Real GDP per capita 0.230 0.286 0.490 0.415 -0.0039 Productivity 0.188 0.339 0.482 0.453 -0.0017
Two dollars a day poverty measure Real GDP per capita 0.449 0.489 0.725 0.590 -0.0063 Productivity 0.336 0.539 0.717 0.627 -0.0027 KILM-GGDC One dollar a day poverty measure
Asia LA Africa Developing Countries
R-squared Coefficient Real GDP per capita 0.272 0.268 0.524 0.185 -0.0015 Productivity 0.295 0.239 0.512 0.228 -0.0007
Two dollars a day poverty measure Real GDP per capita 0.472 0.570 0.674 0.368 -0.0029 Productivity 0.492 0.593 0.671 0.430 -0.0014 Source: CSLS (2003a:Appendix Table 26). Also see the Appendix Charts. Note: *Asia excluding Korea, Taiwan, and Hong Kong.
Overall, when the three regions are aggregated, the R-squared coefficients take intermediate values between the results of Africa and Latin America. The fit of the linear relationship between poverty and labour productivity is tighter when the Penn World Tables estimates are used for both the one and two dollars a day poverty measures. The relationship between the level of GDP per capita and poverty is very similar to that between the level of productivity and poverty. For certain geographical areas and poverty measures the fit is stronger, for others it is weaker. When the Penn World Tables estimates of income and labour productivity are used in the regressions, the labour productivity variable has more explanatory power three times and the income variable has more explanatory power five times. When the KILM-GGDC estimates are used in the regressions, the labour productivity variable has the most explanatory power five times and the income variable three times. But in most of the cases, there is not much

53
difference in the values the R-squared coefficients take. Generally speaking, neither of the two variables seems to be a better explanatory variable than the other.
In terms of the magnitude of these relationships, per capita GDP has more power in reducing poverty incidence than productivity, with both poverty measures and in both data sets. For an increase of $1,000 in real value added per worker the $1 a day poverty rate falls by about 1.7 percentage points according to the Penn estimates or about 0.7 points according to the KILM-GGDC estimates. The corresponding declines in the poverty rate for an equal increase in GDP per capita are 3.9 and 1.5 percentage points respectively, more than twice as large as the productivity effects. A similar story holds for the estimates based on the $2 poverty rates.
Once again a given change in the independent variable (this time either the level of GDP per capita or the level of productivity) has a greater effect on the $2 poverty rate than the $1 poverty rate. This indicates that a given increase in the level of GDP per capita or productivity lifts the extremely poor not just above the $1 a day poverty line but above the $2 a day poverty line as well. Another similarity with the results from the growth regressions is that the independent variable has a smaller effect on the poverty rate according to the KILM-GGDC sample.18
Similar exercises can be carried out using World Bank poverty data, examining both the relationship between changes in poverty and the growth of income or productivity and the relationship between poverty incidence and income or productivity levels. The problem with this data set is that there are few observations in terms of looking at these relationships over time. The method here has therefore been to pool all available observations and look at the average relationship that holds across all countries in the sample over time. The results are quite similar to those presented above based on Sala-i-Martin poverty estimates, despite the difference in coverage, so do not need to be considered here in detail.
Since the World Bank poverty database has been the traditional data source for
cross-country investigations of growth�s effect on poverty, it would be interesting to use this data source along with the KILM-GGDC data for productivity and GDP per capita in following more closely the methods of other studies. Using the World Bank poverty and
18 It is possible that the linear functional form does not fit the entire sample well. The countries in the sample can be divided into two fairly distinct clusters, one with low poverty levels spread across a broad range of high levels of output per worker, and the other with a broad range of poverty levels across a narrow band of low productivity levels. The fit of these regressions could therefore be much improved in either of two ways. First, an inverse functional form could be adopted, or second, the samples could be separated into countries with low productivity levels and countries with high productivity levels (or by distinguishing between countries with high and low poverty rates) based on some arbitrary break point. Also, since some countries in the sample have a poverty rate of zero, a Tobit specification could be called for to deal with this truncation. In any case, the more important point is that the average effect of productivity on poverty incidence across all countries in the sample does not represent well the relationship that is likely to hold for any individual country in the sample. Countries with very low levels of productivity seem to get a much larger reward for increasing their productivity levels in terms of a reduced poverty rate than countries that already have high productivity levels and low poverty incidence and for whom poverty incidence has little or no room to fall further.

54
income distribution database and the KILM-GGDC data set, we estimate elasticities of poverty incidence with respect to labour productivity. Elasticities are calculated using GDP per capita as well as GDP per worker, for both low and high income inequality countries. We classify countries based on their GINI index ranking within our sample. The half with the lowest GINI indexes are considered low inequality and the rest are considered high inequality. Our definition of inequality is therefore relative in the sense that a GINI index value is considered high or low depending on the other GINI indexes in the sample. Since our sample includes GINI indexes based on expenditure and income as well, we subtract ten percentage points from GINI indexes based on income in order to make data comparable although in a non-rigorous way.
We start by regressing the natural logarithm of productivity on the natural
logarithm of poverty incidence. All countries and years are pooled together. By doing so, the slope coefficient is an elasticity. The interpretation of an elasticity is: a one per cent rise in labour productivity is associated with a X per cent decline in the incidence of poverty (not percentage point). All the elasticity estimates calculated using this methodology are statistically significant at the one per cent level (with the exception of some estimates from regressions of high inequality countries using the one dollar a day poverty measure). Yet there seems to be an auto-correlation problem when all countries and years are pooled together without distinction between high and low inequality countries.19
This problem has motivated the use of a second methodology. We regress the
average annual growth rate of labour productivity on the average annual growth of the incidence of poverty (yearly average of log differences). Under this method, average growth is calculated between each data point available within a country. This is not strictly speaking an elasticity. It is rather a growth elasticity and its interpretation differs from the elasticity interpretation as we will explain later. Using the second methodology, there are almost no signs of auto-correlation but the statistical significance of the slope coefficients is not as good, but still quite strong. The inequality rankings of log differences are based on the GINI index of the latest year used in calculating the average log difference. The elasticities of poverty incidence with respect to labour productivity derived from our data set indicate that growth in labour productivity reduces the incidence of poverty. When all data points are used in the regression, the elasticity indicates that a one per cent rise in labour productivity will be associated with a 0.74 per cent decline in the incidence of poverty on average. The separation of our data set based on the GINI index rankings allows us to evaluate the impact of income inequality on the poverty reducing power of labour productivity growth. In countries with the lowest GINI indexes, we find that a one per cent rise in labour productivity is associated with a 1.02 per cent decline in the incidence in poverty. The impact of a one per cent rise in labour productivity on
19 The Durbin-Watson Statistic indicates the presence of auto-correlation if it is significantly lower than 2. The presence of auto-correlation prevents any reliable inference from statistical results. Note that the Durbin-Watson statistics derived from the models with high inequality and all countries are very low, which calls for caution when interpreting these results.

55
poverty incidence is less important when income inequality is higher as the -0.45 elasticity estimate indicates.
The previous results are obtained using the percentage of population living with less than one dollar a day (1.08 dollars based on 1993 PPPs). When the two dollars a day poverty measure is used, the elasticities are systematically lower indicating that the poverty reducing power of labour productivity is lower when the poverty line is set higher. This is in contrast to the slope coefficients, which are simple rates of change rather than elasticities, from previous regressions, where the independent variable had a larger effect on the $2 poverty rate compared to the $1 poverty rate. The difference is that elasticities look at per cent changes, so the effect on the poverty rate is in relative (per cent) terms rather than absolute (percentage point) terms.20 Although the elasticities derived from the two dollars a day poverty rate are lower, the use of this broader poverty measure systematically yields a higher R-squared value, indicating that labour productivity variations explain a larger portion of the variations in poverty. The negative impact of higher income inequality on the poverty reducing power of labour productivity growth also applies when the two dollar a day poverty measure is used.
Elasticities of poverty incidence with respect to GDP per capita are also estimated in the same way and the results are similar in terms of magnitude but are all lower. This result shows the importance of giving as much attention to labour productivity as a poverty reducing variable as to GDP per capita growth. As was mentioned earlier, we also estimate elasticities of growth by regressing average log differences instead of just logs. When all countries are pooled together, we obtain an elasticity of -3.39, which is considerably larger than the -0.74 estimate we obtained from the log-log model. The interpretation of the slope coefficient is different and this explains why the two types of elasticities calculated are of different magnitudes. A -3.39 growth elasticity means that a one percentage point higher average annual growth rate in labour productivity will be associated on average to a 3.39 percentage point lower average annual growth rate in the incidence of poverty. Therefore, when the growth elasticity is lower than -1, the acceleration in the decline of the incidence in poverty will be larger than the acceleration in the growth of labour productivity. Based on our sample, an acceleration in labour productivity growth has more impact on the acceleration of the decline in the incidence of poverty in countries with higher levels of income inequality. High inequality countries have on average a growth elasticity of -4.93 compared to -3.17 for low inequality countries. The growth elasticity estimates derived from the two dollars a day poverty rates are systematically lower, as was the case when elasticities were calculated. When all countries are pooled together, the growth elasticity is -1.26. When countries are separated based on their level of income inequality, the growth elasticities are -1.09 and -1.91 for low inequality and high inequality countries respectively. Contrary to what was observed
20 A previous footnote also discusses this issue. Briefly, the two dollars a day poverty rates are by nature larger than the one dollar poverty rates, and in relative terms a large absolute change from a large number is not necessarily as large as a small absolute change from a small number.

56
when elasticities were estimated, the use of the two dollars a day poverty measure does not yield a higher R-squared coefficient. In fact, variations in labour productivity growth explain more of the variations in poverty incidence growth when the one dollar a day poverty measure is used. The results using GDP per capita average annual growth rates are quite different than the ones obtained with labour productivity. The elasticity estimates are lower and have less statistical significance. The R-squared values are also very low, meaning that GDP per capita average annual growth has almost no explanatory power of variations in poverty incidence average annual growth.
Following Moore and White (2003), we construct a table of annual labour productivity growth rates required to leave the absolute number of poor unchanged, given population growth rates and elasticities of poverty incidence with respect to labour productivity. From Exhibit 5, we see that for a given elasticity, the growth in labour productivity has to be higher the larger is population growth in order to leave the poverty headcount unchanged. And unsurprisingly, given a population rate of change, labour productivity growth can be lower as the elasticity of poverty incidence with respect to labour productivity (which measures the impact of a one per cent change in labour productivity on the incidence of poverty) is larger, in order to leave the number of poor unchanged. If labour productivity growth exceeds the value in the table for given population growth and elasticity, then the number of poor will decrease.
The values in Exhibit 5 are derived using the following formula:
l* = - p / ε
where l* is the annual rate of change in labour productivity required to leave the number of poor unchanged, p is the annual rate of change in population, and ε is the poverty incidence to labour productivity elasticity.21
Given our poverty dataset it is impossible to calculate elasticities for individual countries. The elasticities we derive are averages for the developing countries included in
21 The poverty rate (I) is equal to poverty headcount (D) divided by population (P). Therefore
i = d - p (1) where lowercase letters denote per cent change. The elasticity of poverty incidence with respect to labour productivity is given by
ε = i / l (2) where l is the per cent change in labour productivity. If the poverty headcount is to remain unchanged, then d=0 and equation (1) become
i = -p (3) We can express the per cent change in labour productivity in terms of the elasticity and the per cent change in labour productivity from equation (2):
i = ε · l (4) Substitute (3) into (4) to obtain
ε · l = -p (5) and rearrange to obtain
l* = -p / ε (6)

57
our sample. Our formula can only help us predict the impact of labour productivity growth on the number of poor in countries in our sample as a whole (or sub sample based on inequality levels). Furthermore, our prediction assumes that labour productivity growth is not accompanied by a change in the distribution of income that could affect poverty that is not already taken into account in the elasticity estimate. We reproduce the elasticities derived for developing countries by simple regression in Exhibit 5 to show the required labour productivity growth to leave the number of poor unchanged.
Exhibit 5
Labour Productivity Growth Rate (in italics) Required to Leave the Number of Poor Unchanged Given Population Growth Rates
Population Growth rates Countries Elasticities 1.0 1.5 2.0 2.5 High Inequality -0.45 Developing Countries -0.74 Low Inequality -1.02
2.22 1.35 0.98
3.33 2.03 1.47
4.44 2.70 1.96
5.56 3.38 2.45
Given the numerous results reported here it is not possible to definitively say whether productivity is a more important driver of reductions in poverty than GDP per capita. In some cases labour productivity has a larger effect, but in most cases this does not hold. However, the fit of the relationship seems to be stronger for productivity even though the magnitude of the relationship itself is not as strong. The most important point is that all of these results, in combination with previous studies, give compelling evidence that both productivity and GDP per capita are important in reducing poverty. Furthermore, increases in GDP per capita are themselves strongly driven by productivity gains. The Relationship between Productivity, Poverty, and Income Distribution Using Multiple Regression Analysis
Income inequality is important in mediating the relationship between economic growth and productivity growth and changes in poverty. Indeed, the fact that correlation coefficients between economic growth and poverty reduction or between productivity growth and poverty reduction are not larger is in part explained by the different levels of income inequality across countries. In countries with low initial levels of income inequality, a given per cent increase in income, even though it affects all quintiles proportionately, has a greater impact in reducing absolute poverty than the same per cent increase in income in countries with high levels of income inequality. This is simply because the absolute size of the income gains are greater in the low inequality country. The same reasoning applies for countries that experience a fall in their income inequality relative to those who experience an increase.

58
This sub-section of the report examines the relationship between productivity,
poverty and income distribution. The first step in constructing the database needed to undertake multivariate analysis of the relationship between poverty, labour productivity and income inequality is to select countries from the Penn World Tables and World Income Inequality databases for which Sala-i-Martin (2002) has provided poverty rate estimates. We then retain the countries for which GINI coefficient time series are available for at least ten years.22
Initially, we wanted to undertake a cross-section analysis for the years 1970 and 1998 using levels of each of the three variables. But because of the incomplete GINI coefficient time series, we did a cross-section analysis for the earliest year for which the GINI coefficient was available (and closest to 1970) and another one for the latest year (and closest to 1998). Associating labour productivity levels to GINI coefficients was easy because labour productivity estimates are available for each year from 1970 to 1998. But this was not the case for poverty rates. We therefore had to assign poverty rates to GINI coefficients on the basis of closeness to the years of availability. For example, if the earliest year of availability of a GINI coefficient was 1972, we assigned it the 1970 poverty rate. We then used the Ordinary Least Squares procedure with linear functional form to estimate the coefficients.
We also want to study the relationship between variations over time in each variable. We use the earliest and latest year available to calculate average annual growth rates for labour productivity and GINI coefficients and percentage changes for the poverty rates. Therefore, the growth rates for some countries are for shorter periods than for others. We then use the same statistical procedure as used for level comparisons.
We estimate an equation with the poverty rate as the dependent variable and labour productivity and inequality (measured by the GINI coefficient) as the explanatory variables. We use the one dollar a day poverty measure as well as the two dollars a day measure. We would expect a negative coefficient for labour productivity since higher aggregate productivity will be associated with higher income. We would expect a positive coefficient for income inequality since higher income inequality, every thing else being equal, would be associated with a higher poverty rate.
In the regression using the one dollar a day poverty measure for the earliest year,
the coefficient for labour productivity has the expected sign and is statistically different from zero at the 1 per cent level. It predicts that a $1,000 per worker higher level of labour productivity would be associated with a 1.5 percentage point lower poverty rate. The income inequality coefficient also has the expected sign but it is not statistically different from zero (at the 10 per cent level). The regression predicts that a 1 per cent increase in the GINI coefficient will be associated with a 0.068 percentage point higher
22 There are only 27 countries left after the selection: 12 in Latin America (Brazil, Chile, Colombia, Costa Rica, Dominican Republic, Ecuador, Jamaica, Mexico, Panama, Peru, El Salvador, Venezuela), 13 in Asia (Bangladesh, China, Hong Kong, Indonesia, India, Korea, Sri Lanka, Malaysia, Pakistan, Philippines, Singapore, Thailand, Taiwan) and 2 in Africa (Ethiopia, Tanzania).

59
poverty rate. The intercept coefficient is statistically different from zero at the 5 per cent level. Based on the R-squared value, 41 per cent of the variation in the poverty rate is explained by variations in labour productivity and income inequality.
The regression results also report on the one dollar a day poverty measure with
the latest year available (and closest to 1998). The labour productivity coefficient has the expected sign, and is statistically different from zero at the 5 per cent level. The regression predicts that a $1,000 dollars per worker higher labour productivity level will be associated with a 0.6 percentage point lower poverty rate. The coefficient for income inequality has the expected sign as well but again, is not statistically different from zero (at the 10 per cent level). The intercept coefficient is significantly different from zero at the 10 per cent level. The independent variables have less explanatory power when data for the latest year is used. Only 21 per cent of the variation in the poverty rate is explained by variation in labour productivity and inequality compared to 41 per cent when data for the earliest years are used.
When the two dollars a day poverty measure and earliest year available are used,
the coefficient for labour productivity has the expected sign and is statistically different from zero at the 1 per cent level. The regression results predict that a $1,000 per worker higher labour productivity level will be associated with a 2.6 percentage point lower poverty rate. The coefficient for income inequality does not have the expected sign but is not statistically different from zero at the 10 per cent level. The intercept coefficient is statistically different from zero at the 1 per cent level. The model has good explanatory power since variation in labour productivity and income inequality explain almost 62 per cent of the variation in the poverty rate.
The labour productivity coefficient still has the expected sign when data for the
latest year available and the two dollars a day poverty measure are used. It is statistically different from zero at the 1 per cent level. A 1.1 percentage point lower poverty rate is expected from a $1,000 per worker higher labour productivity level. The income inequality coefficient has the expected sign but again is not statistically different from zero at the 10 per cent level. A one per cent higher GINI coefficient is expected to be associated with 0.5 percentage point lower poverty rate. The intercept coefficient is not statistically different from zero at the 10 per cent level. As was the case when using the $1 a day poverty measure, the explanatory power of the model is lower if data for the latest year available is used. Only 38 per cent of the variation in the poverty rate is explained by the variation in labour productivity and income inequality compared to 62 per cent when the data for the earliest year available are used.
Regressions of the percentage point change in the poverty rate on the average annual growth rates of labour productivity and income inequality are also estimated using both poverty measures. We expect the coefficient for labour productivity to be negative, because growth in aggregate labour productivity would lead to growth in income and would reduce poverty if inequality remains constant. We expect a positive coefficient for income inequality growth because growth in inequality could lead to growth in poverty although not necessarily. If the income of only the top income quintile rises over time, inequality would rise, but absolute poverty would not.

60
Using the one dollar a day poverty measure, the regression results have the
expected sign. The average annual growth rate in labour productivity has a coefficient statistically different from zero at the 5 per cent level. The regression predicts that a one percentage point higher average annual growth rate in labour productivity would lead to a 1.75 percentage point reduction in the per cent change in the poverty rate between the earliest and latest year of availability. The income inequality coefficient is not statistically different from zero at the 10 per cent level. From the regression results, it is expected that a one per cent higher income inequality average annual growth rate will be associated with a 3.3 percentage point lower percentage point increase in the poverty rate between the earliest and latest year of availability. This model does not have much explanatory power since only 26 per cent of the variation in the percentage point change in the poverty rate is explained by variations in the average annual growth rates in labour productivity and income inequality.
Using the two dollars a day poverty measure yields similar results. Both
coefficients have the expected sign, yet only the average annual growth rate in labour productivity coefficient is statistically different from zero at the 1 per cent level. From the regression results, it is expected that a one per cent higher labour productivity growth rate will be associated with 3.5 percentage point reduction of the change in the poverty rate between the earliest and latest year of data availability. It is also predicted that a one percentage point rise in the GINI coefficient will be associated with a 2.8 percentage point larger change in the poverty rate between the earliest and latest year of data availability. According to the model, the variation in the two independent variables explains 32 per cent of the variation in the percentage point change in the poverty rate. The bottom line from the multivariate analysis is that income distribution does indeed affect the extent to which productivity gains are passed on to poor workers as income gains and reductions in poverty, but the relationship certainly appears weaker than the more basic relationship between productivity and poverty. The Relation Between Productivity and Poverty Using Alternative Measures of Poverty In addition to the use of the conventional poverty measures based on one and two dollars per day, the United Nations Development Programme (UNDP) produces indices of poverty based on a much more multi-dimensional conception of poverty. This sub-section of the paper examines the relationship between these measures and productivity and compares the results to those between conventional poverty measures and poverty.
Using labour productivity estimates from both the KILM-GGDC data set and the Penn World Tables, we plot labour productivity against the Human Development Index (HDI) and the Human Poverty Index (HPI) produced by the UNDP to ascertain if the relationship is different from the one observed using income poverty measures. There are 108 countries for which the UNDP publishes the HDI and we have labour productivity estimates from the Penn World Tables. This number falls to 31 when the KILM-GGDC
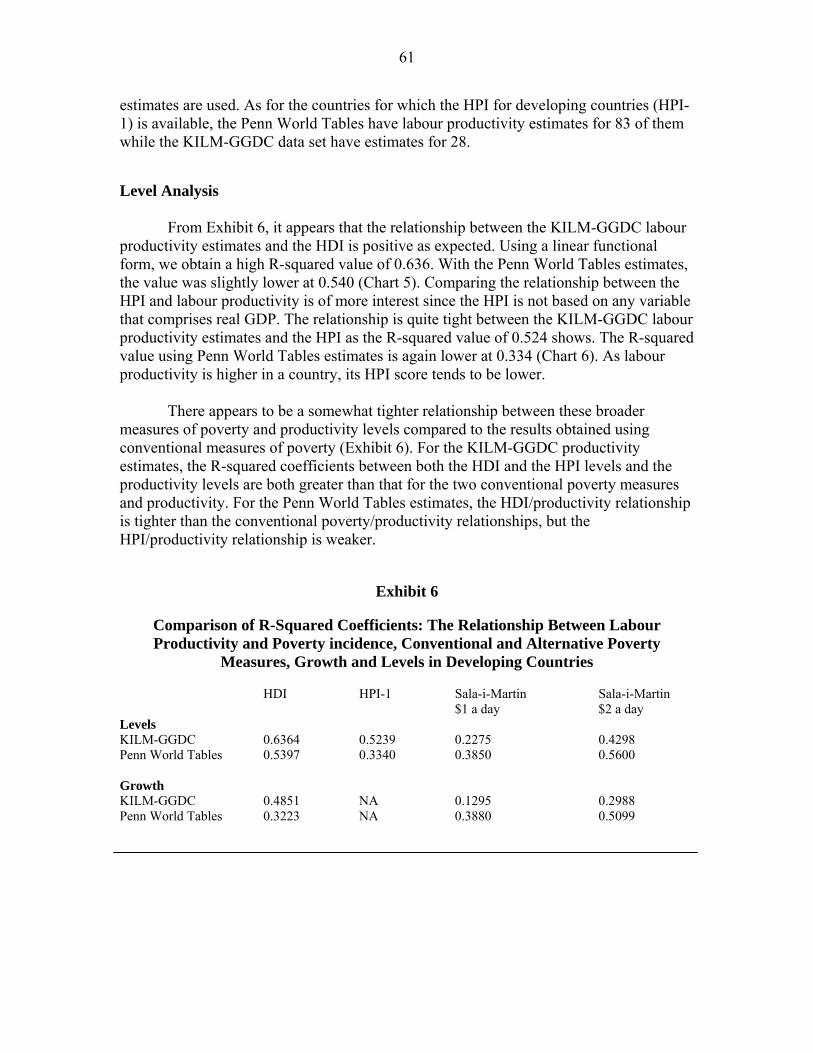
61
estimates are used. As for the countries for which the HPI for developing countries (HPI-1) is available, the Penn World Tables have labour productivity estimates for 83 of them while the KILM-GGDC data set have estimates for 28.
Level Analysis From Exhibit 6, it appears that the relationship between the KILM-GGDC labour
productivity estimates and the HDI is positive as expected. Using a linear functional form, we obtain a high R-squared value of 0.636. With the Penn World Tables estimates, the value was slightly lower at 0.540 (Chart 5). Comparing the relationship between the HPI and labour productivity is of more interest since the HPI is not based on any variable that comprises real GDP. The relationship is quite tight between the KILM-GGDC labour productivity estimates and the HPI as the R-squared value of 0.524 shows. The R-squared value using Penn World Tables estimates is again lower at 0.334 (Chart 6). As labour productivity is higher in a country, its HPI score tends to be lower.
There appears to be a somewhat tighter relationship between these broader
measures of poverty and productivity levels compared to the results obtained using conventional measures of poverty (Exhibit 6). For the KILM-GGDC productivity estimates, the R-squared coefficients between both the HDI and the HPI levels and the productivity levels are both greater than that for the two conventional poverty measures and productivity. For the Penn World Tables estimates, the HDI/productivity relationship is tighter than the conventional poverty/productivity relationships, but the HPI/productivity relationship is weaker.
Exhibit 6
Comparison of R-Squared Coefficients: The Relationship Between Labour Productivity and Poverty incidence, Conventional and Alternative Poverty
Measures, Growth and Levels in Developing Countries
HDI HPI-1 Sala-i-Martin Sala-i-Martin $1 a day $2 a day
Levels KILM-GGDC 0.6364 0.5239 0.2275 0.4298 Penn World Tables 0.5397 0.3340 0.3850 0.5600 Growth KILM-GGDC 0.4851 NA 0.1295 0.2988 Penn World Tables 0.3223 NA 0.3880 0.5099

62
Chart 5: Relationship Between Real GDP per Worker and the Human Development Index in Developing Countries, 2000
R2 = 0.5397
0
0.2
0.4
0.6
0.8
1
1.2
0 10,000 20,000 30,000 40,000 50,000 60,000 70,000
Real GDP per Worker in 1996 $US
Hum
an D
evel
opm
ent I
ndex
Source: Alan Heston, Robert Summers and Bettina Aten. Penn World Table, Version 6.1 . Center for International Comparisons at the University of Pennsylvania (CICUP), October 2002. United Nations Development Programme. Human Development Report 2002 . New York, Oxford University Press, 2002.
Kuwait
Oman
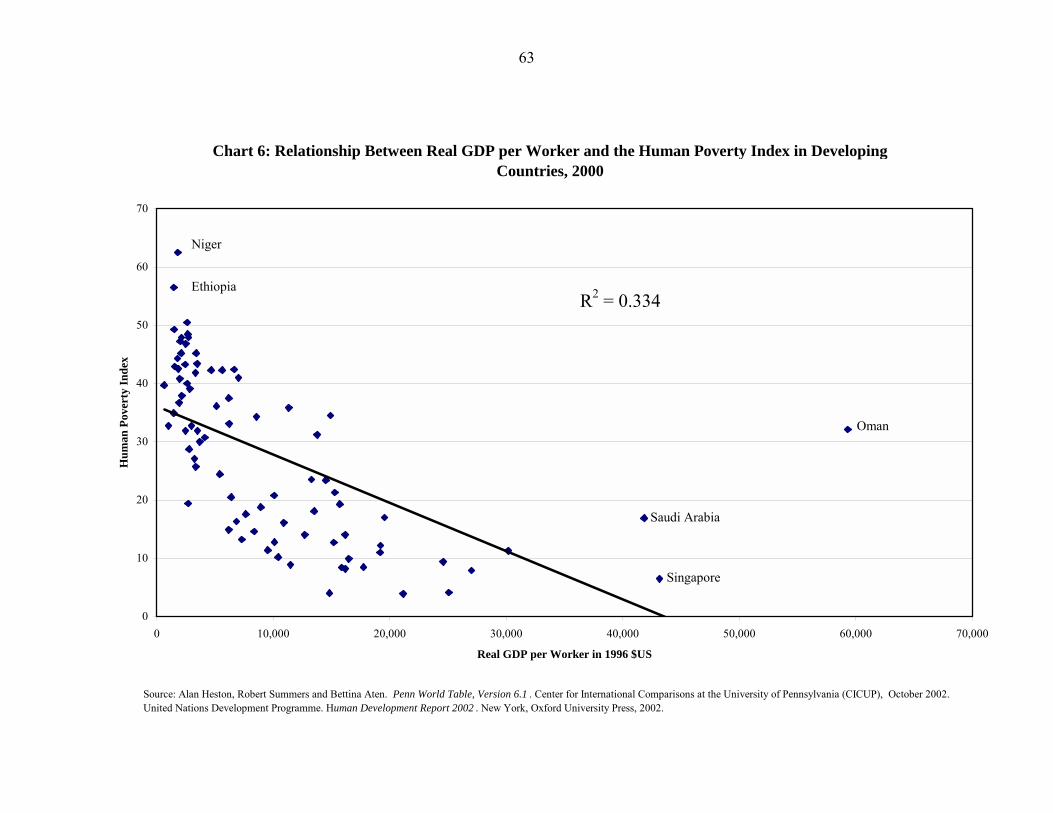
63
Chart 6: Relationship Between Real GDP per Worker and the Human Poverty Index in Developing Countries, 2000
R2 = 0.334
0
10
20
30
40
50
60
70
0 10,000 20,000 30,000 40,000 50,000 60,000 70,000
Real GDP per Worker in 1996 $US
Hum
an P
over
ty In
dex
Oman
Saudi Arabia
Niger
Ethiopia
Singapore
Source: Alan Heston, Robert Summers and Bettina Aten. Penn World Table, Version 6.1 . Center for International Comparisons at the University of Pennsylvania (CICUP), October 2002. United Nations Development Programme. Human Development Report 2002 . New York, Oxford University Press, 2002.

64
Trend Analysis The results from the regression analysis show that there is a relatively strong negative relationship between growth in real GDP per worker and changes in poverty incidence. We use the HDI to verify that this relationship still exists when alternative measures of poverty are used. It would be more interesting to use the HPI instead since that index is not based on GDP per capita but no time series are available yet from the UNDP on this variable. Since the HDI measures achievement in capabilities, the relationship between labour productivity growth and changes in the HDI should be positive. To investigate the relationship between labour productivity growth and changes in the HDI, we consider all developing countries for which a HDI time series is available for the 1975-2000 period. Of these countries, labour productivity estimates from the Penn World Tables are available for 68 of them (17 in Asia, 21 in Latin America, and 30 in Africa), while estimates from the KILM-GGDC data set are available for 28 of them (14 in Asia, 7 in Latin America, and 7 in Africa). We present the R-squared coefficients for Asia, Latin America, Africa, and developing countries. All coefficients had a positive sign indicating a positive relationship between the two variables as we expected.
The R-squared coefficients derived from the use of the HDI differ from the ones based on conventional poverty measures. The estimates from the Penn World Tables suggest labour productivity growth seems to have significantly less success in explaining changes in the HDI as the lower R-squared coefficient shows (see Exhibit 6). The coefficients are even lower than the ones obtained from the use of the one dollar a day poverty measure. The R-squared coefficients are also different when the KILM-GGDC labour productivity estimates are used.
Labour productivity has the strongest explanatory power in Africa when the HDI is the measure of poverty. But it is in Africa that labour productivity has the weakest explanatory power when conventional measures of poverty are used (see Exhibit 7). But in general, the KILM-GGDC estimates of labour productivity have success in explaining changes in the HDI, except in Asian countries. A possible reason that could explain these divergences is the different composition of the country samples.
Exhibit 7
R-Squared Coefficients between Labour Productivity Growth and Changes in the Human Development Index, based on Penn World Tables and KILM-GGDC data
Asia LA Africa Developing
Countries Penn World Tables Productivity growth 0.307 0.057 0.145 0.322 KILM-GGDC Productivity growth 0.128 0.430 0.708 0.485

65
Overall Findings The results of this section of the paper suggest that the relationship between productivity growth and poverty reduction in developing countries over the last three decades appears even stronger than that between economic growth and poverty reduction, and about as important as that between GDP per capita growth and poverty reduction. It was also found that the level of income inequality mediates the relationship between productivity growth and poverty reduction. The greater the level of inequality and any increase in inequality, the less an increase in productivity and income will reduce poverty. The general mechanism that explains why productivity growth reduces poverty is that productivity growth is the main determinant of income growth. The relationship between labour productivity growth and income growth is at the total economy or aggregate level. Gains in aggregate labour productivity mean that there is more real income in the economy that can be distributed to factors of production. In an economy with competitive product and factor markets, the relationship does not hold, and should not hold, at the firm or industry level. Workers in a sector that enjoys above average productivity growth will not see their wages increase more than the economy-wide average because of inter-sectoral wage competition due to labour mobility between sectors. What happens in these above average productivity growth sectors is that firms experience a decline in the relative price of their products. All members of society share in the productivity gains through lower prices, which raise real wages and incomes.
Aggregate labour productivity growth accrues from two sources. The first is intersectoral shifts of workers from low productivity level industries such as agriculture to high productivity level sectors such as manufacturing. Growth accounting studies have shown that this has historically been a very important source of productivity gains in the developed countries and it is currently a significant source of gains in the developing world. The workers who make this move enjoy large income gains, allowing many to move out of poverty. The second is intra-sectoral productivity growth. Again, because of labour and product market competition the wage gains of workers are not related to the productivity gains in their sector, but to aggregate labour productivity growth, although there may be many exceptions to this rule in non-competitive settings.
Through government fiscal policies, all members of society, not just workers, can benefit from productivity growth. Part of the higher factor incomes arising from productivity growth can be taxed from the factors of productions and the proceeds used for transfers or public services potentially targeted at the poor. Since the Industrial Revolution, there have been both winners and losers in the economy�s quest for productivity growth. Technological change, the key driver of both economic and productivity growth, both creates and destroy jobs. Economists often note that in the long run higher productivity makes everyone better off by raising the material base of society. But the path to such an outcome can be difficult for those displaced and made redundant by the creative destruction of the growth process. Since the Luddites, the

66
destruction or �restructuring� caused by the introduction of new productivity-enhancing technologies has provoked resistance on the part of those affected, which can have the effect of slowing the pace of technological change.
A growing economy that offers ample reemployment opportunities is crucial to minimizing the social costs from creative destruction, particularly over longer periods. But it is unlikely that a market economy will solve all social problems associated with restructuring. Public policy has an important role to play, particularly in the short-to-medium term. In principle, one can compensate the losers of the growth process. Their suffering can be lessened through income support programs and measures which foster their reemployment in other sectors and occupations, such as retraining programs. But in poor countries there are significant barriers to the development of such programs, including their cost and ineffective governance structures. The results in this section provide strong support for the view that productivity growth is essential for poverty reduction and should be a priority for developing countries. Consequently, the challenge developing countries face is to foster productivity growth, but at the same time to develop adjustment mechanisms that can protect those negatively affected by such productivity growth. It is important that productivity growth be seen by the population as the basis of the material advance of society and not associated with permanent job loss and catastrophic falls in income and living conditions. This is an issue of political economy. Two examples of creative destruction in developing countries illustrate the need for a deeper understanding of the economic and political ramifications of productivity growth. The first is the restructuring that has affected state enterprises in China. These firms have recorded very large productivity gains, often through massive layoffs of workers.23 Often these workers receive little if any compensation and have no access to retraining programs. For these workers, productivity can be a dirty word. The second example is the restructuring that is affecting the traditional low productivity agricultural sector in developing countries. The introduction of productivity-enhancing technologies in agriculture, while a necessary condition for development, can cause much suffering for the landless farm wage earners who no longer have work and are forced to migrate to the urban areas.
It is easy to say that productivity is crucial for living standard increases and poverty reduction. It is much harder to identify policies that will increase productivity growth. In dynamic economies, economic growth is largely accounted for by productivity. Policies that foster economic growth will therefore by definition increase or maintain productivity growth. The literature has shown that the types of public policies that stimulate growth include policies that maintain strong levels of non-inflationary aggregate demand through appropriate fiscal and monetary policies, policies that promote openness and competition, policies that foster human capital development, policies that stimulate investment in machinery and equipment and innovation, and policies that
23 See CSLS (2003b) for a detailed discussion of China�s productivity performance during the transition period.

67
facilitate the transfer of resources from low productivity sectors to high productivity sectors. The United Nations has set as a goal for the world community the halving of the rate of world poverty between 1990 and 2015. Over this period, the achievement of such a goal would require an annual rate GDP per capita growth of 3.6 per cent. This is equivalent to a rate of productivity growth of a minimum of 3 per cent as growth as in most countries there is limited potential for increases in the employment/total population ratio to make large long-term contributions to living standard growth. The poor are already in the labour force. Based on a continuation of developments in the 1990s, Asia is on track to meet this poverty-reduction objective because of strong productivity growth and poverty reduction in China. However, Latin America, and even more so, Africa are greatly off track in attaining this goal given their dismal economic performance in the 1990s. Drastic action is required in these regions if they are to meet the 2015 poverty objective. V Conclusion
Based on recent work undertaken by the Centre for the Study of Living Standards,
this paper has provided a detailed discussion of the linkages between productivity and social development in market economies. The first section reviewed recent literature on the impact of productivity on different aspects of social development and on the social determinants of productivity. The second section used the CSLS Index of Economic Well-being to identify the two-way linkages between productivity and economic and social well-being. The third section provided a detailed examination of the empirical relationship between productivity and poverty in developing countries.
In the end, our plea is for a social understanding of productivity. Productivity
does not simply enhance our material standard of living; it also expands the range of choices available. Increased productivity gives society the choice through both markets and the political arena of whether our greater economic well-being will manifest itself through greater private consumption goods, more public goods, additional leisure, or greater public transfers to increase equality and economic security. Of course, enhanced productivity will not automatically increase the social well-being, but it will reduce the apparently zero-sum nature of many of the decisions that we face today, and make it easier to achieve the economic and social goals that all citizens of the world have the right to expect to achieve.

68
References
Banting, Keith, Andrew Sharpe and France St-Hilaire (2002) �Towards a Social Understanding of Productivity: An Introduction and Overview,� in Andrew Sharpe, Keith Banting and France St-Hilaire (eds.) The Review of Economic Performance and Social Progress: Towards A Social Understanding of Productivity, (Ottawa: Centre for the Study of Living Standards and Montreal: Institute for Research on Public Policy and distributed by McGill-Queen�s University Press) posted at www.csls.ca.
Centre for the Study of Living Standards (2003a) Productivity Growth and Poverty Reduction in Developing Countries, CSLS Research Report 2003-6, September posted at www.csls.ca
Centre for the Study of Living Standards (2003b) China’s Productivity Performance and Its Impact on Poverty in the Transition Period, CSLS Research Report 2003-07, September, posted at www.csls.ca
Dungan, Peter (2002) �The Impact of Productivity Growth on Government Fiscal Balances,� in Andrew Sharpe, Keith Banting and France St-Hilaire (eds.) The Review of Economic Performance and Social Progress: Towards A Social Understanding of Productivity, (Ottawa: Centre for the Study of Living Standards and Montreal: Institute for Research on Public Policy and distributed by McGill-Queen�s University Press) posted at www.csls.ca. Easterlin, Richard (1996) Growth Triumphant (Ann Arbor: University of Michigan Press). Fortin, Pierre, Andrew Sharpe and France St-Hilaire, eds. (2003) The Linkages Between Economic Growth and Inequality: Special Issue of Canadian Public Policy, January, Volume XXIX, posted at www.csls.ca. Grafton, Quentin, Stephen Knowles and P. Dorian Owen (2002) �Social Divergence and Productivity: Making A Connection,� in Andrew Sharpe, Keith Banting and France St-Hilaire (eds.) The Review of Economic Performance and Social Progress: Towards A Social Understanding of Productivity, (Ottawa: Centre for the Study of Living Standards and Montreal: Institute for Research on Public Policy and distributed by McGill-Queen�s University Press) posted at www.csls.ca.
Graves, Frank and Richard Jenkins (2002) "Canadians Attitudes Toward Productivity: Balancing Standard of Living and Quality of Life,� in Andrew Sharpe, Keith Banting and France St-Hilaire (eds.) The Review of Economic Performance and Social Progress: Towards A Social Understanding of Productivity, (Ottawa: Centre for the Study of Living Standards and Montreal: Institute for Research on Public Policy and distributed by McGill-Queen�s University Press) posted at www.csls.ca.

69
Harris, Richard (2002) �Social Policy and Productivity Growth: What Are the Linkages,� in Andrew Sharpe, Keith Banting and France St-Hilaire (eds.) The Review of Economic Performance and Social Progress: Towards A Social Understanding of Productivity (Ottawa: Centre for the Study of Living Standards and Montreal: Institute for Research on Public Policy and distributed by McGill-Queen�s University Press) posted at www.csls.ca.
Heath, Joseph (2002) �Should Productivity Growth Be A Social Priority?� in Andrew Sharpe, Keith Banting and France St-Hilaire (eds.) The Review of Economic Performance and Social Progress: Towards A Social Understanding of Productivity, (Ottawa: Centre for the Study of Living Standards and Montreal: Institute for Research on Public Policy and distributed by McGill-Queen�s University Press) posted at www.csls.ca.
Lomberg, J. (2001) The Skeptical Environmentalist (New York: Cambridge University Press).
Moore, Mick and Howard White (2003) �Meeting the Challenge of Poverty and Inequality,� in Atul Kohli, Chung-in Moon and George Sorensen (eds.) States, Markets and Just Growth: Development in the Twenty-first Century (Tokyo: UN University Press). Okun, Arthur (1975) Equality and Efficiency: The Big Tradeoff (Washington: Brookings Institution).
Olewiler, Nancy (2002) �Natural Capital, Sustainability and Productivity: An Exploration of the Linkages,� in Andrew Sharpe, Keith Banting and France St-Hilaire (eds.) The Review of Economic Performance and Social Progress: Towards A Social Understanding of Productivity, (Ottawa: Centre for the Study of Living Standards and Montreal: Institute for Research on Public Policy and distributed by McGill-Queen�s University Press) posted at www.csls.ca. Osberg, Lars (1985) �The Measurement of Economic Well-being� in D. Laidler (research coordinator), Approaches to Economic Well-being, Vol. 26, Research Studies of the MacDonald Commission (Toronto: University of Toronto Press). Osberg, Lars and Andrew Sharpe (1998) �An Index of Economic Well-being for Canada,� Research Paper 99-01, Applied Research Branch, Strategic Policy, Human Resources Development Canada, December (posted at www.csls.ca). Osberg, Lars and Andrew Sharpe (2000) �An Index of Economic Well-being for the Canadian Provinces� November. (posted at www.csls.ca) Osberg. Lars and Andrew Sharpe (2001a) �Trends in Economic Well-being in Canada in the 1990s,� in Keith Banting, Andrew Sharpe and France St-Hilaire (eds.) The Longest Decade: Canada in the 1990s: The Review of Economic Performance and Social

70
Progress (Ottawa: Centre for the Study of Living Standards and Montreal: Institute for Research on Public Policy), posted at www.csls.ca. Osberg, Lars and Andrew Sharpe (2001b) �Comparisons of Trends in GDP and Economic Well-being - the Impact of Social Capital� in The Contribution of Human and Social Capital to Sustained Economic Growth and Well Being edited by John Helliwell, (HDRC and OECD). Osberg, Lars and Andrew Sharpe (2002a) The Index of Economic Well-being: An Overview Indicators: The Journal of Social Health, Spring. Osberg, Lars and Andrew Sharpe (2002b) �An Index of Economic Well-being for Selected OECD Countries, Review of Income and Wealth, September, pp. 293-316.
Osberg, Lars and Andrew Sharpe (2004) �Has Economic Well-being Improved in Canada and the United States?� in Edward Wolff (ed.) What Has Happened to the Quality of Life in America and Other Advanced Industrialized Nations? (Edgar Elgar).
Sala-i-Martin, Xavier (2002) �The World Distribution of Income (Estimated from Individual Country Distributions),� Working Paper 8933, National Bureau of Economic Research, May available at www.nber.org/papers/8933. Sharpe, Andrew (2002) �The Contribution of Productivity to Economic Well-being in Canada,� in Someshwar Rao and Andrew Sharpe (eds.) Productivity Issues in Canada (Calgary: University of Calgary Press). Sharpe, Andrew, Keith Banting and France St-Hilaire, eds. (2002) The Review of Economic Performance and Social Progress: Towards A Social Understanding of Productivity, (Ottawa: Centre for the Study of Living Standards and Montreal: Institute for Research on Public Policy and distributed by McGill-Queen�s University Press) posted at www.csls.ca. Sweetman, Arthur (2002) �Working Smarter: Education and Productivity,� in Andrew Sharpe, Keith Banting and France St-Hilaire (eds.) The Review of Economic Performance and Social Progress: Towards A Social Understanding of Productivity, (Ottawa: Centre for the Study of Living Standards and Montreal: Institute for Research on Public Policy and distributed by McGill-Queen�s University Press) posted at www.csls.ca
Tompa, Emile (2002) �The Impact of Health on Productivity: Empirical Evidence and Policy Implications,� in Andrew Sharpe, Keith Banting and France St-Hilaire (eds.) The Review of Economic Performance and Social Progress: Towards A Social Understanding of Productivity (Ottawa: Centre for the Study of Living Standards and Montreal: Institute for Research on Public Policy and distributed by McGill-Queen�s University Press) posted at www.csls.ca.