exploring geomorphometry through user generated … · exploring geomorphometry through ......
TRANSCRIPT

Research Article
Exploring geomorphometry through user generated content –
comparing an unsupervised geomorphometric classification
with terms attached to georeferenced images in Great Britain
Short Running head: Exploring geomorphometry through UGC
Christian Gschwend and Ross S. Purves
Department of Geography
University of Zurich
Winterthurerstrasse 190
CH 8057 Zurich
Switzerland
[email protected], [email protected]
Keywords
Geomorphometry, user generated content, volunteered geographic information, ethnophysiography,
semantics, DEM, topography
1 Corresponding author
2
Abstract
User generated content such as the georeferenced images and their associated tags found in Flickr
provides us with opportunities to explore how the world is described in the non-scientific, everyday
language used by contributors. Geomorphometry, the quantitative study of landforms, provides methods
to classify Digital Elevation Models (DEMs) according to attributes such as slope and convexity. In this
paper we compare the terms used in Flickr and Geograph in Great Britian to describe georeferenced
images to a quantitative, unsupervised classification of a DEM using a well established method, and
explore the variation of terms across geomorphometric classes and space. Anthropogenic terms are
primarily associated with more gentle slopes, whilst terms which refer to objects such as mountains and
waterfalls are typical of steeper slopes. Terms vary both across and within classes, and the source of the
user generated content has an influence on the type of term used, with Geograph, a collection which aims
to document the geography of Great Britain, dominated by features which might be observed on a map.
3
1 Introduction
The advent of large volumes of user generated content (UGC), and more specifically volunteered
geographic information (VGI) (Goodchild, 2007), provides new perspectives on how those with access to
digital media describe the world around them. Thus, for example, Haklay et al. (2010) have explored the
completeness and accuracy of OpenStreetMap road networks by comparison with data sourced from a
National Mapping Agency. Girardin et al. (2009) explored urban attractiveness treating the density of
images and phone calls with respect to points of interest in New York as a proxy for the popularity of
locations over time. Other research has explored the nature of contributions and the motivation of users to
contribute, in an attempt to better understand the phenomena of UGC and VGI in general (Coleman et al.,
2009).
One area where UGC has considerable potential, is exploring the everyday terms used to describe the
world. For instance, many researchers (e.g. Grothe and Schaab, 2009; Hollenstein and Purves, 2010) have
identified the potential of georeferenced media as a route to discovering, exploring and delineating the
use of vague or vernacular toponyms at scales ranging from regions like the Alps to individual districts
within cities. The use of UGC provides an alternative route to empirical experiments (e.g. Montello et al.,
2003) in exploring such questions which, potentially, can be applied across very large geographical areas
assuming that the data coverage of UGC is in some way representative.
There are a multitude of reasons why identifying terms used in everyday language is important. For
example, Davies et al. (2009) argue that vernacular names are important in the dispatch of emergency
services, since callers may use toponyms not contained in administrative gazetteers. Equally, indexing
information requires the use of terms that are likely to be used in search – for example, in the Tripod
project we sought to link spatial data to images through their coordinates. Thus, we used Corine Land
Cover data to identify likely land cover at a location, and a concept ontology derived from a range of
sources including UGC to map the formal descriptions of Corine onto the everyday terms likely to be
used in querying a search engine by lay users for images (Purves et al., 2010). A similar approach could
be imagined for generating indexing terms for locations with respect to landforms (e.g. hill, mountain
valley). The advent of seamless terrain models covering much of the Earth’s surface has enabled the
development of relatively straightforward methods, based on supervised and unsupervised classification,

4
for identification of landform classes through the use of parameters such as gradient or texture (e.g.
Wood, 1996; Iwahashi and Pike, 2007).
In this paper we wish to bridge the gap between such quantitative methods suitable for analysing
landforms and “folk” descriptions of these landforms. The work extends methods originally developed by
Gschwend (2010) and Gschwend and Purves (2011) for analysis of landforms in continental USA. Our
approach is to use two databases containing user generated content in the form of georeferenced images
and their descriptions and compare these descriptions to a quantitative classification of a DEM using a
robust unsupervised method. In particular we wish to explore the following questions:
• Which methods are required to explore the relationship between everyday language descriptions
of landforms and quantitative geomorphometric classifications?
• Can individual geomorphometric classes be related to terms used in user generated content?
How does the use of everyday language describing landforms vary across space and
geomorphometric classes?
2 State of the art
Our work is concerned primarily with two areas and the intersection between them, firstly research on
landform classification and geomorphometry and, secondly, work on user generated content from both
Geographic Information Science and Information Science.
2.1 Geomorphometry and landform classification
Geomorphometry was defined by Pike et al. (2009: 4) as “the science of topographic quantification; its
operational focus is the extraction of land-surface parameters and objects from digital elevation models
(DEMs).” In turn, Pike et al. (2009) define land surface parameters as descriptive measures of surface
form, taking the form of continuous fields. Such land surface parameters are typically described as
primary or compound topographic indices with gradient, aspect and flow direction being examples of the
former and topographic wetness index or stream power of the latter. Such indices are, given a DEM at a
particular resolution, straightforward to derive and widely used. Pike et al. (2009) give as examples of
objects extracted from DEMs drainage networks and watershed lines, which are themselves defined
through the use of land surface parameters. The values of the parameters, and thus the extents of related

5
objects, are related to scale (e.g. the extent of the moving window used to calculate gradient), data (e.g.
horizonzal resolution and vertical accuracy) and the algorithm used (e.g. steepest drop or finite
differences for gradient) (Deng, 2007).
An important question relates to how parameters and objects defined by domain experts can be related to
everyday conceptualisations of landscapes. These sorts of questions form the basis for much of David
Mark’s recent work in the field of ethnophysiography, where he and colleagues have demonstrated that
people from different cultures and backgrounds also have differing perceptions of the space around them
(e.g. Mark and Turk, 2003). Furthermore, they seem to us to be fundamental if one is to advance in the set
of challenges set out as naïve geography by Egenhofer and Mark (1995), which, simply put, can be
considered to be concerned with making GIS capable of more closely matching the expectations of a user
unfamiliar with the spatial data models used in GIS or the specialised categories used, in our case, by a
geomorphologist in describing landforms.
A wide range of methods which allocate every cell in a DEM to an individual landform class have also
been developed. Unsupervised methods make initial decisions on the parameters relevant to landform
delineation, but then classify landform elements without a priori knowledge of the expected classes (e.g.
Burrough et al., 2000; Deng et al., 2007). Iwahashi and Pike (2007) developed an unsupervised
classification method based on iterative subdivision of DEM cells using gradient, local convexity and
surface texture. Their method has the advantage that the parameters used are straightforward to interpret,
and its application is illustrated from the global to local scale. However the interpretation of the
individual landform classes is still based on an expert geomorphological characterisation of the classes
which would unlikely to relate directly to the everyday terms used to describe such landforms. Indeed, as
Iwahashi and Pike (2007: 437) state: “The work described here raises fundamental issues in terrain
classification that continue to challenge the discipline of geomorphometry … Some of these are semantic
and ontological: what's a hill? And when is it not a hill but a mountain?”
Until recently, the primary way to gather information about the everyday terms used to describe
landforms was through empirical studies, which required participants to list, for example, “a kind of
geographic feature” or “something that could be portrayed on a map” (Smith and Mark, 2003). However,

6
the advent of user generated content (UGC), or as it is more specifically known in Geographic
Information Science, volunteered geographic information (VGI) provides us with new opportunities to
explore how individuals describe landforms across space. UGC and VGI, and their application, form the
core of the next section.
2.2 User generated content and volunteered geographic information
User generated content (UGC) is a relatively recent phenomena, which can take the form of contributions
uploaded to the web, for example as blog entries, comments on restaurants, or georeferenced tagged
images. Volunteered geographic information (VGI) was defined by Goodchild (2007) as a special case of
UGC concerned with the production of specifically geographic information by individuals, in domains
which had traditionally been the preserve of professionals.
In previous work we showed how terms used in Geograph (Edwardes and Purves, 2007) were similarly
ranked to those identified in previous experiments seeking to identify category norms (e.g. Smith and
Mark, 2003) suggesting that UGC, could provide a valid proxy for empirical experiments aimed at
exploring how space was described. Rorissa (2008) demonstrated that participants in an image labeling
task preferred to use basic level terms (Tversky and Hemenway, 1983) to label individual images. In
further work Rorissa (2010) showed that tags used by Flickr were not only “richer in their semantic
content” than terms assigned by professional indexers, but also likely to include perceptual elements of
the image in question. The potential of Flickr, and other UGC, as ways of exploring semantics, and the
potential strengths and weaknesses of an essentially freeform approach to describing content have also
been the subject of considerable study and debate (e.g. Winget, 2006; Guy and Tonkin, 2006; Ames and
Naaman, 2007). For instance, Winget (2006) demonstrated that Flickr users not only assigned the correct
toponym to images of volcanoes, but that they also embraced the full hierarchical structure of toponyms
found in the Thesaurus of Geographic Names (TGN).
Identifying toponyms and delineating their associated regions, especially those which are not found in
traditional gazetteers, is one of the main uses to which Flickr data and other UGC have been put in
GIScience (e.g. Grothe and Schaab, 2009; Keßler et al., 2009; Popescu et al., 2009; Hollenstein and
Purves, 2010). Within information and computing science, UGC has been used to explore the overall

7
distribution of Flickr images and to identify semantically interesting locations (e.g. Crandall et al., 2009;
Rattenbury and Naaman, 2009).
In recent work (Purves et al., 2011), we explored the nature of terms used in both Flickr and Geograph.
Geograph is a moderated collection of images of the UK, complete with free text descriptions, which
focuses on geographic features identifiable on a map. An important difference between Flickr and
Geograph is in the nature and way in which terms are used. We classified the 1000 top ranked terms (after
removing toponyms, stop words and camera related terms) as either elements (objects likely to be visible
in an image), activities (again, likely to be visible in an image) and qualities (modifiers of elements or
activities or suggestions of feelings or moods). We found terms describing activities to be more common
in Flickr and those describing qualities to be more common in Geograph.
2.3 Research gaps
A number of gaps exist in the literature, both in the well established area of geomorphometry, and more
recent work with user generated content. As Iwahashi and Pike (2007) observed, important semantic and
ontological questions arise in assigning names to the classes generated by quantitative methods from
geomorphometry and, to our knowledge, little work has addressed what might termed everyday terms
appropriate for labeling such classifications. User generated content appears to provide one potential
means of addressing this gap, and in this paper we seek to explore the relationship between, on the one
hand the terms assigned to images by a wide range of individuals, and on the other a widely used
quantitative classification of landforms. Furthermore, despite initial studies exploring the spatial use of
user generated content, relatively little work has explored spatial variation except as a function of either
co-occurrence with other terms or, with respect to simple proxies for contributions such as population.
3 Data
Our analysis was carried out for data from Great Britain (that is to say the United Kingdom without
Northern Ireland). To prepare a land surface form classification we used a post-processed SRTM (Shuttle
Radar Topography Mission) DEM (Version 4, made available by the CGIAR Consortium for Spatial
Information) with a nominal resolution of 90m projected to the Ordnance Survey National Grid.
Gorokhovich and Voustianiouk (2006) evaluated the data quality of this post-processed SRTM data and

8
showed that this DEM was of higher quality than SRTM data which had not been subject to post-
processing. Figure 1 shows the relief of the study area, as well as a number of major cities and the borders
of England, Wales and Scotland (important in considering some geomorphometrically relevant terms
rooted in English, Welsh and Gaelic).
Figure 1 Relief of Great Britain and some locations discussed in the text
User generated content were derived from two sources, Flickr2 and Geograph3
. Flickr is an archetypal
Web 2.0 service, where individuals may upload images with a variety of metadata including titles, tags
and geographic coordinates. For this work we used the FlickrJ API to mine all georeferenced images
within the following bounding box (10W, 50N – 2E, 60N) with a reported precision equivalent to
georeferencing at the level of individual streets. In our analysis we used, as well as the locations of
images, the (anonymous) individual user identifiers and the tags associated with the images.
Geograph is a project with the aim of collecting “geographically representative photographs for every
square kilometer of the UK and Republic of Ireland”. Unlike Flickr, all contributions are moderated, and
2 www.flickr.com 3 www.geograph.org.uk
9
only those considered relevant to the stated aim, and thus with geographic relevance, are accepted. A
wide range of attributes, as well as locations with varying precisions4
, are stored, including free text titles
and descriptions. We used only images with a precision of 100m or more (approximately equivalent to
our DEM resolution) and used unique user identifiers and image descriptions in our further analysis.
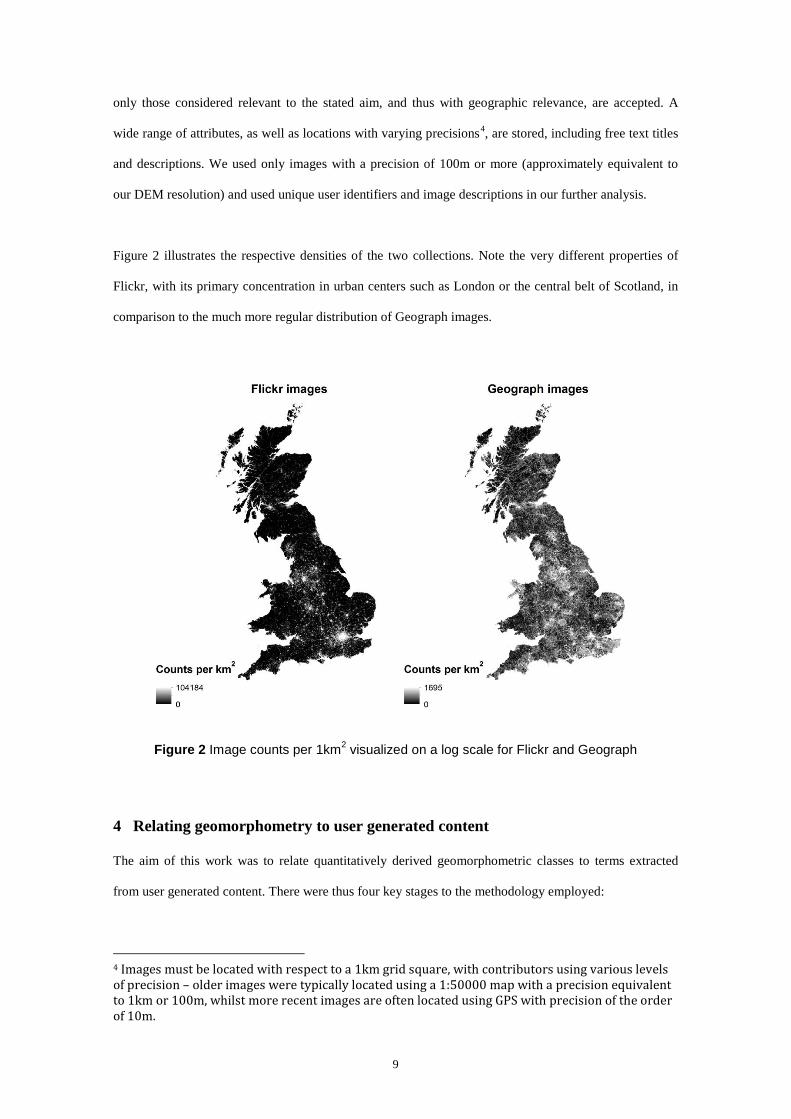
Figure 2 illustrates the respective densities of the two collections. Note the very different properties of
Flickr, with its primary concentration in urban centers such as London or the central belt of Scotland, in
comparison to the much more regular distribution of Geograph images.
Figure 2 Image counts per 1km2 visualized on a log scale for Flickr and Geograph
4 Relating geomorphometry to user generated content
The aim of this work was to relate quantitatively derived geomorphometric classes to terms extracted
from user generated content. There were thus four key stages to the methodology employed:
4 Images must be located with respect to a 1km grid square, with contributors using various levels of precision – older images were typically located using a 1:50000 map with a precision equivalent to 1km or 100m, whilst more recent images are often located using GPS with precision of the order of 10m.
10
• calculation of quantitative values assigning DEM cells to a landform class;
• identification and preprocessing of commonly used terms in user generated content
from Flickr and Geograph collections in Great Britain;
• ranking of terms according to variation within geomorphometric classes; and
• exploration and analysis of the spatial variation in terms used to describe different
geomorphometric classes.
The following describes each of these four stages in more detail. Processing was carried out using
ArcGIS, R and Java programmes as appropriate.
4.1 Deriving landform classes from a DEM
Iwahashi and Pike’s (2007) land surface classification gives each DEM cell a unique value, classifying a
location successively in terms of gradient, local convexity and surface texture. We closely followed the
method proposed, and chose eight landform classes, rather than the other possibilities of 12 or 16, for our
final landform classification, which we felt was an appropriate compromise for the relatively low relief of
Great Britain. In order to explore initial variation of landform classes as a function of resolution, we
generated landform classes at a resolution of 90m, before calculating modal relief at a resolution of 9km.
Gradient was calculated using a 3x3 moving window, using the finite differences method implemented in
ArcGIS. Convexity is argued by Iwahashi and Pike to allow discrimination between low relief features,
such as flood plains and alluvial terraces and a Laplacian filter is used to identify areas of positive and
negative local convexity. Finally, surface texture is used to classify cells according to relative relief (that
is to say pits and peaks) by subtracting the source DEM from median elevation values (again derived
using a 3x3 filter). Cells were allocated to one of eight landform classes according to, firstly their mean
gradient, followed by mean convexity and finally mean texture.
4.2 Extracting terms from user generated content
We worked with two fundamentally different collections of user generated content, Flickr and Geograph,
as described in §3. Previous work has shown that georeferenced Flickr images very commonly include
toponyms as tags (Sigurbjörnsson and Van Zwol, 2008; Hollenstein and Purves, 2010). Equally, since
11
Geograph descriptions consist of free text they also include many prepositions and other terms which
must first be filtered. In recent work, we generated lists of elements, qualities and activities by exploring
the 1200 most commonly used terms in Flickr and Geograph for some 1.6 million images taken before
April 2008 (Purves et al., 2011). Although specific events may result in some changes to the terms found
in these collections (for example, we would expect the tag riot to have been commonly used during and
after the events of the summer of 2011 in London and other UK cities), we suggest that terms used within
these lists to describe landform related characteristics are unlikely to have changed and used these word
lists5
to identify candidate terms. Furthermore, we used Porter stemming (Porter, 1980) to normalise
terms in our matching procedure. This has the advantage of grouping terms together to a single root,
though it is important to note that on occasion this may also increase ambiguity. Having matched
stemmed terms with entries in our word lists, we were left with term frequencies for both Flickr and
Geograph for each word listed by Purves et al. (2011).
4.3 Relating user generated content to Geomorphometry
Having identified commonly used terms by a process of word matching, we wished to explore how these
vary with different geomorphometric classes. Rattenbury and Naaman (2009) identified Flickr tags that
were significantly localized in space in order to derive place semantics, sets of tags that are descriptive of
a particular location. In our work, we wished to carry out an analogous procedure and identify terms
related to individual geomorphometric classes. We therefore adapted slightly the TagMaps TF-IDF
method (Rattenbury and Naaman, 2009) to our purposes. The measure is based on the well known
baseline information retrieval ranking algorithm, TF-IDF, which ranks documents for some given search
query according to, firstly, term frequency, and secondly, inverse document frequency. Term frequency is
simply the number of times a term occurs in an individual document. The inverse document frequency is
the total number of documents in a collection divided by the number of documents containing a term. TF-
IDF thus gives higher weight to terms in collections which are common in a small number of documents,
but not over the collection as a whole.
In our analysis, term frequency was treated as the total number of occurrences of a particular term in an
individual landform class. Inverse document frequency was the total number of images divided by the
5 The full term lists can be found in the supporting materials for Purves et al. (2011) at: http://gicentre.org/firstMonday
12
number of images with labeled with the term across all geomorphometric classes. Thus, terms which
occur more in a single geomorphometric class are proportionately higher ranked than equally prolific
terms across all classes. Finally, in user generated content participation inequality (Nielsen, 2006) is a
well known effect which typically manifests itself through small numbers of contributors generating very
large volumes of data. Here, we again followed Rattenbury and Naaman’s (2009) approach, and sought to
minimize this bias by adding a term representing user frequency, where terms used ubiquitously are
ranked higher than those suggested by a small number of prolific posters. The final ranking of each term
identified in the word list was thus given by the following equation:
𝑠𝑐𝑜𝑟𝑒(𝑅, 𝑥) = 𝑡𝑓(𝑅, 𝑥) ∙ 𝑖𝑑𝑓(𝑥) ∙ 𝑢𝑓(𝑅, 𝑥)
where R is classification according to Iwahashi and Pike
x is term to be ranked
tf is the number of photos for a given class and term
idf is the total number of photos divided by the total number of photos with term x
uf is the number of users for a given class and term divided by number of users for a given class
4.4 Exploring variation of term use in space
In order to explore the variation of term use in geographic space we generated χ-maps (Wood et al., 2007)
which show the variation in term used as a function of some overall expected distribution. Here, the
expected distribution was based not on a constant or random distribution in space, but the actual
distribution of all images from the collection under analysis (either Flickr or Geograph). χ-values were
calculated at a resolution of 9km, and distributions were generated by calculation of kernel density
surfaces with a kernel bandwidth of 50km. A 9km resolution was used so that a broad picture of variation
could be observed at a regional level. The observed distribution was the kernel density surface for the
term under analysis. The volumes of the observed and expected surfaces were normalized, before χ was
calculated as:
𝜒 =O − E√E
where O is the observed density of images in a pixel and
E is the expected density of images in a pixel.
13
To explore the relationship between χ-maps and individual geomorphometric classes, zonal statistics were
calculated to derive a range of mean and standard deviation in χ-values for each individual
geomorphometric class.
5 Results and interpretation
5.1 Geomorphometric classification
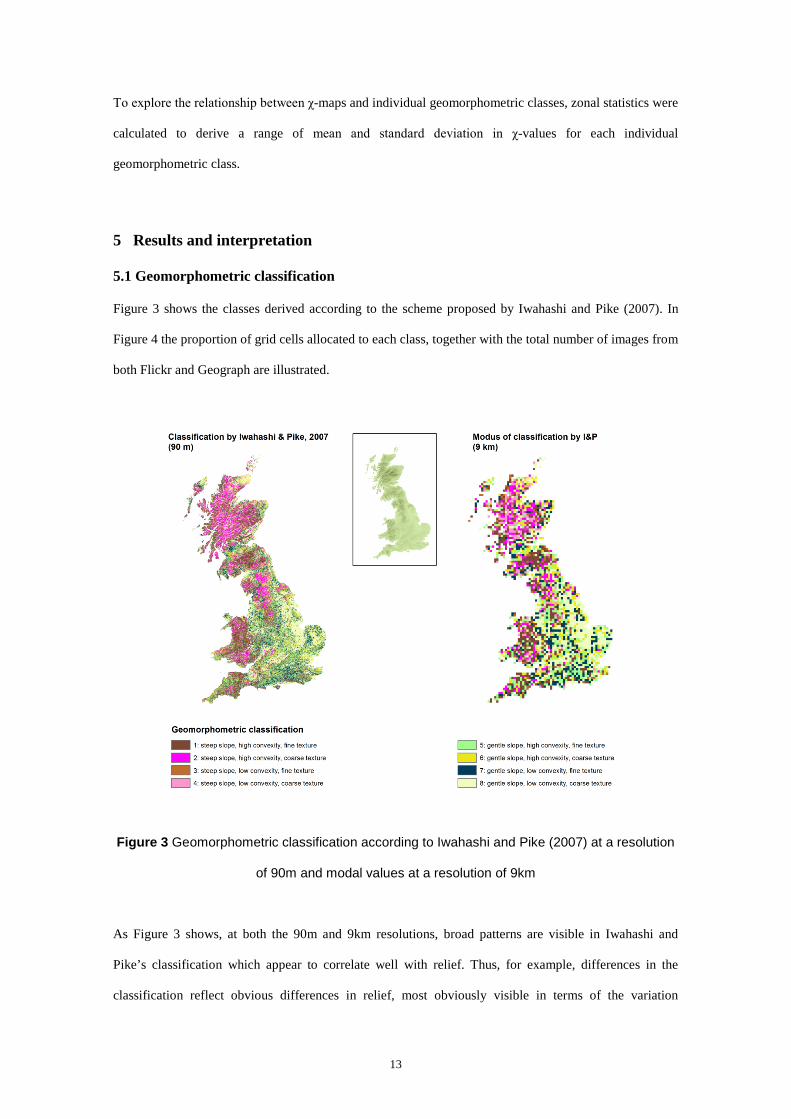
Figure 3 shows the classes derived according to the scheme proposed by Iwahashi and Pike (2007). In
Figure 4 the proportion of grid cells allocated to each class, together with the total number of images from
both Flickr and Geograph are illustrated.
Figure 3 Geomorphometric classification according to Iwahashi and Pike (2007) at a resolution
of 90m and modal values at a resolution of 9km
As Figure 3 shows, at both the 90m and 9km resolutions, broad patterns are visible in Iwahashi and
Pike’s classification which appear to correlate well with relief. Thus, for example, differences in the
classification reflect obvious differences in relief, most obviously visible in terms of the variation
14
between steep (1-4) and gentle (5-8) slopes. Some classes, especially 8 (gentle slope, low convexity,
coarse texture) which one would expect to relate to large areas of alluvial deposits or flood plains cover
large areas with little variation in class, whilst others, for example 2 and 4 (steep slopes, high and low
convexity, coarse texture) form complex patterns probably relating to mountainous regions incised by
glacial valleys. Resampling from 90m to 9km using modal values for the 9km grid cells retains the broad
overall pattern of variation, at a cost of an obvious loss in detail.
(a)
(b)
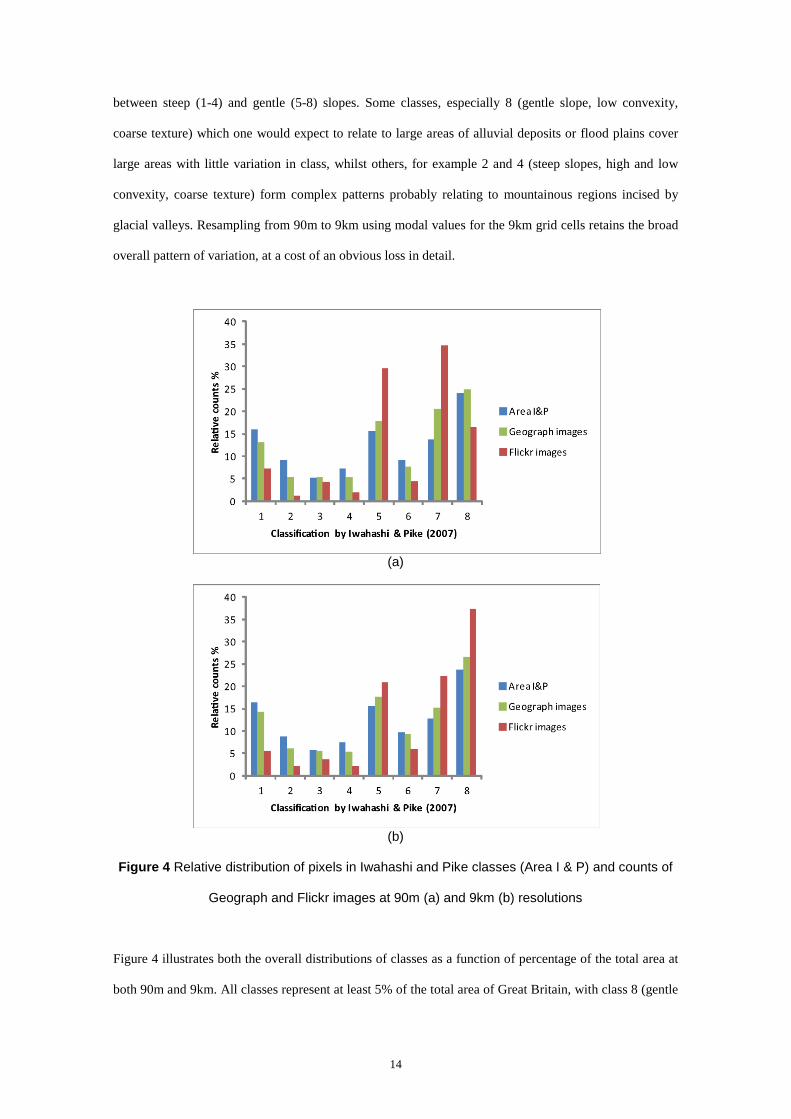
Figure 4 Relative distribution of pixels in Iwahashi and Pike classes (Area I & P) and counts of
Geograph and Flickr images at 90m (a) and 9km (b) resolutions
Figure 4 illustrates both the overall distributions of classes as a function of percentage of the total area at
both 90m and 9km. All classes represent at least 5% of the total area of Great Britain, with class 8 (gentle

15
slope, low convexity, coarse texture) being the most prominent and representing some 25% of the total
area. Class membership appears to be relatively stable, with no changes in area equivalent to more than
1% of the total area of Great Britain when resolution is changed from 90m to 9km. Figure 4 also shows
the distribution of images from both Geograph and Flickr across geomorphometric classes. A number of
aspects are notable here. Firstly, Flickr is biased, as one would expect, to more gentle slopes (classes 5-8)
with around 85% of Flickr images found in these regions. These more gentle slopes also correspond to
the most densely populated areas of Great Britain, with large areas with steep slopes such as the
Highlands of Scotland having very small populations. By contrast Geograph images are more or less
distributed according to geomorphometric classes. Secondly, the distribution of Geograph images is
relatively stable across all classes at both resolutions, with a maximum variation of the order of 5% in the
allocation of images to geomorphometric classes. However, the number of Flickr images allocated to
class 8 (gentle slope, low convexity, coarse texture) varies by up to 20% (more than 500000 images)
despite the relatively small change in area allocated to this class. This sensitivity probably reflects the
extreme clustering of Flickr images in urban centers in contrast to the much more evenly distributed
Geograph images, where a single pixel at 9km resolution covering a large area of London could result in
the reallocation of a very large number of images if geomorphometric classes changed.
5.2 Term frequencies and their relationship to geomorphometric classes
Table 1 illustrates each of the eight geomorphometric classes, according to their ranking from the whole
set of elements, qualities and activities6
6 The top 20 terms are available in the supporting materials for this paper.
. Table 2 shows the top 20 terms from all facets and the
geomorphometric classes in which they occur. Since the word lists are derived from those used in the
work of Purves et al. (2011) the potential candidate terms are identical, and thus we refer the reader to
that work for a discussion of the overall differences in terms used between Flickr and Geograph.

16
Table 1 Top 5 ranked terms from Flickr (a) and Geograph (b) (from all categories) for the eight
geomophometric classes (note terms are always given as the stem used in matching)
1 2 3 4 5 6 7 8 sea hill wharf loch street snow night tree landscap landscap castl mountain squar tree street snow hill mountain landscap landscap citi flower water church castl waterfal tree lake night sky light bird boat tree sky castl build sunset river flower
(a)
1 2 3 4 5 6 7 8 hill hill hill glen road road bridg river vallei summit down loch hous farm road bridg down vallei castl hill park hous build road cliff down rock slope build old hous church summit slope top down wood field river hous
(b)
1 steep slope, high convexity, fine texture 5 gentle slope, high convexity, fine texture 2 steep slope, high convexity, coarse texture 6 gentle slope, high convexity, coarse texture 3 steep slope, low convexity, fine texture 7 gentle slope, low convexity, fine texture 4 steep slope, low convexity, coarse texture 8 gentle slope, low convexity, coarse texture
In exploring Table 1 it is important to note that only the top five terms are shown here, and that many
highly ranked terms are relatively ubiquitous across geomorphometric classes (c.f. Table 2). However, it
allows us quickly to gain an overview of the types of terms used and key differences between them.
Perhaps the most obvious features are the very strong distinction, for both Flickr and Geograph between
more natural features for steep classes, which clearly relate to landforms (1-4) (e.g. sea, hill, mountain,
vallei (the stem of valley etc.)) and more anthropogenic features for more gentle slopes (5-8) (e.g. hous
(the stem of house etc.), road, street). It is also clear that the highest ranked terms in Geograph very much
take the form of “something that could be portrayed on a map” (Smith and Mark, 2003). Highly ranked
Flickr terms on the other hand also include more terms related to the moment at which an image was
captured, for example night, sunset, light, bird or snow. Given the relative rarity of snow in low lying
areas of Great Britain, the high ranking of the last term associated with classes 6 and 8 (gentle slope,
high/ low convexity, coarse texture) also indicates the prominence of tags from photographs taken to
illustrate unusual events.
17
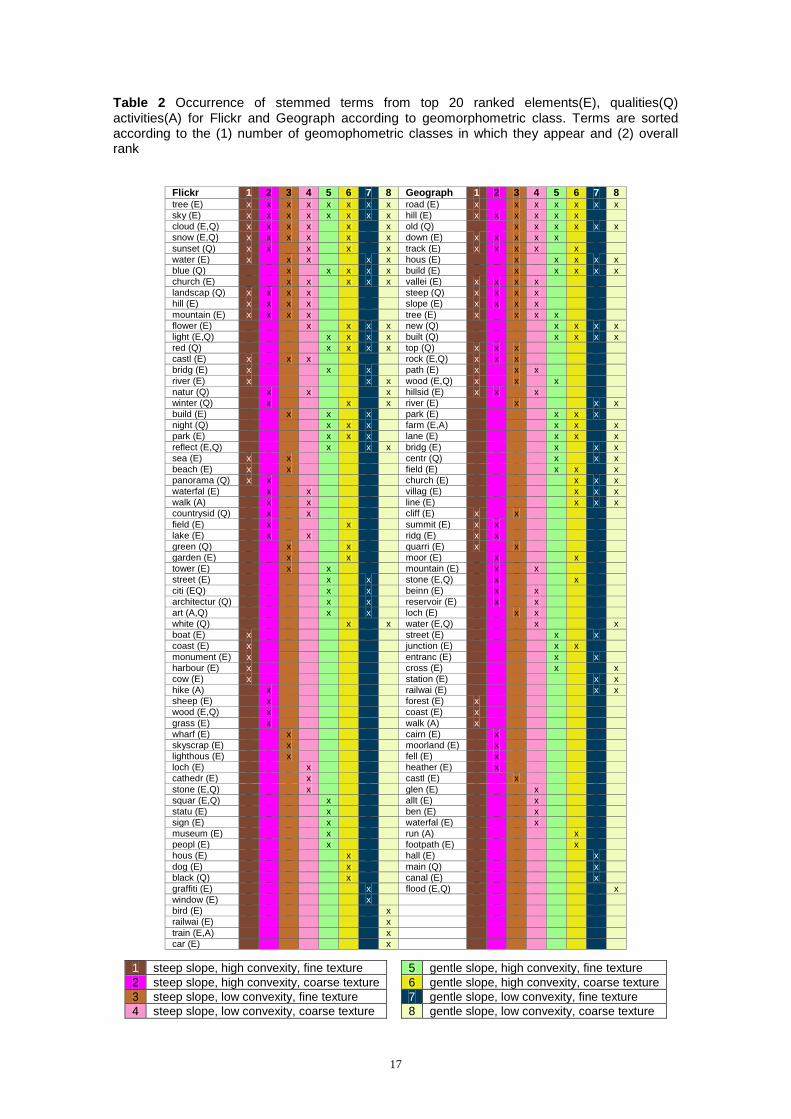
Table 2 Occurrence of stemmed terms from top 20 ranked elements(E), qualities(Q) activities(A) for Flickr and Geograph according to geomorphometric class. Terms are sorted according to the (1) number of geomophometric classes in which they appear and (2) overall rank
Flickr 1 2 3 4 5 6 7 8 Geograph 1 2 3 4 5 6 7 8 tree (E) x x x x x x x x road (E) x x x x x x x sky (E) x x x x x x x x hill (E) x x x x x x cloud (E,Q) x x x x x x old (Q) x x x x x x snow (E,Q) x x x x x x down (E) x x x x x sunset (Q) x x x x x track (E) x x x x x water (E) x x x x x hous (E) x x x x x blue (Q) x x x x x build (E) x x x x x church (E) x x x x x vallei (E) x x x x landscap (Q) x x x x steep (Q) x x x x hill (E) x x x x slope (E) x x x x mountain (E) x x x x tree (E) x x x x flower (E) x x x x new (Q) x x x x light (E,Q) x x x x built (Q) x x x x red (Q) x x x x top (Q) x x x castl (E) x x x rock (E,Q) x x x bridg (E) x x x path (E) x x x river (E) x x x wood (E,Q) x x x natur (Q) x x x hillsid (E) x x x winter (Q) x x x river (E) x x x build (E) x x x park (E) x x x night (Q) x x x farm (E,A) x x x park (E) x x x lane (E) x x x reflect (E,Q) x x x bridg (E) x x x sea (E) x x centr (Q) x x x beach (E) x x field (E) x x x panorama (Q) x x church (E) x x x waterfal (E) x x villag (E) x x x walk (A) x x line (E) x x x countrysid (Q) x x cliff (E) x x field (E) x x summit (E) x x lake (E) x x ridg (E) x x green (Q) x x quarri (E) x x garden (E) x x moor (E) x x tower (E) x x mountain (E) x x street (E) x x stone (E,Q) x x citi (EQ) x x beinn (E) x x architectur (Q) x x reservoir (E) x x art (A,Q) x x loch (E) x x white (Q) x x water (E,Q) x x boat (E) x street (E) x x coast (E) x junction (E) x x monument (E) x entranc (E) x x harbour (E) x cross (E) x x cow (E) x station (E) x x hike (A) x railwai (E) x x sheep (E) x forest (E) x wood (E,Q) x coast (E) x grass (E) x walk (A) x wharf (E) x cairn (E) x skyscrap (E) x moorland (E) x lighthous (E) x fell (E) x loch (E) x heather (E) x cathedr (E) x castl (E) x stone (E,Q) x glen (E) x squar (E,Q) x allt (E) x statu (E) x ben (E) x sign (E) x waterfal (E) x museum (E) x run (A) x peopl (E) x footpath (E) x hous (E) x hall (E) x dog (E) x main (Q) x black (Q) x canal (E) x graffiti (E) x flood (E,Q) x window (E) x bird (E) x railwai (E) x train (E,A) x car (E) x
1 steep slope, high convexity, fine texture 5 gentle slope, high convexity, fine texture 2 steep slope, high convexity, coarse texture 6 gentle slope, high convexity, coarse texture 3 steep slope, low convexity, fine texture 7 gentle slope, low convexity, fine texture 4 steep slope, low convexity, coarse texture 8 gentle slope, low convexity, coarse texture

18
Highly ranked activities, available in the supporting materials, tend to be more similar across classes in
Geograph, with for example farm being a highly ranked term across all geomorphometric classes.
However, Flickr shows interesting differences, with holida (the stem of holiday etc.) being in the top five
terms for steep slopes (classes 1-4), and, presumably, more urban activities such as shop being
represented in gentle slopes (classes 5-8). Somewhat the reverse is the case for qualities, where Flickr is
much more homogenous across geomorphometric classes, with cloud belonging to the top five terms for
six out of eight classes. Geograph, shows more variation, with modifiers that might be more commonly
used with natural features prominent as terms for steep slopes (classes 1-4), e.g. steep, rock, top and those
perhaps more obviously related to settlements prominent for gentle slopes (classes 5-8) e.g. built, centr
(the stem for centre etc.).
When exploring Table 2 it is important to bear in mind that only the top 20 terms for each
geomorphometric class were analyzed, and that terms not appearing in conjunction with a particular class
(for example in the case of Geograph, road in class 2) may simply appear slightly further down the
ranking for this class. One obvious feature of Table 2 is the small number of activities and qualities which
remain in the top 20 terms ranked, illustrating the relatively higher ranking of elements, that is to say
objects which are presumably visible in the images.
Nonetheless, a number of interesting, and we believe meaningful, patterns can be identified in the data
and are worthy of note. Some terms appear to be more or less ubiquitous appearing in many or even all
geomorphometric classes. For example, tree, sky, cloud, snow and sunset are all common in Flickr and
road, hill and old in Geograph. Indeed, hill occurs in all classes except 7 and 8 (gentle slope, low
convexity) suggesting that as soon as any convexities are present, they may be referred to as hills.
Interestingly, despite Flickr’s much greater concentration in urban areas, the term hill is only highly
ranked in Flickr in steep (1-4) classes. This may be the result of one of two effects. Either there is a real
difference in how prominences are perceived in Flickr and Geograph, or more likely, the nature of
Flickr’s content means that in rural areas users are more likely to use tags related to the physical
environment. Both mountain and landscap (the stem of landscape etc.) are also highly ranked only in
steep classes (1-4) in Flickr. Perhaps reflecting the more descriptive nature of the free text in Geograph,
the three terms associated with the same steep classes (1-4) in Geograph are vallei (the stem of valley
19
etc.), steep and slope. In general, a very clear difference is visible between terms which are primarily
found on steep slopes and those on gentle slopes (5-8) – e.g. in Geograph park, farm, lane, bridg, centr,
field, church, villag etc. and in Flickr street, citi, architectur etc. Thus, there is clearly a preference for
more anthropogenic objects on gentle slopes as opposed for more “natural” objects on steep slopes.
Zooming into individual classes also reveals some interesting results. The class most likely to be
associated with very flat areas (class 8) is strongly related to transport in Flickr (railwai, train and car)
and to the term flood in Geograph. However, exploration of some other classes, for example class 1
(steep, convex, fine textured areas) demonstrates that the results are not always so amendable to
interpretation. Here the terms associated with only such locations in Flickr are boat, coast, monument and
harbour which appear paradoxical. However, since the equivalent terms in Geograph (forest, coast and
walk) also include coast, it seems likely that this class is genuinely associated with images taken in
coastal areas. An obvious question, addressed in the following section, is whether the use of coast varies
in space, and if so, how this relates to geomorphological classes.
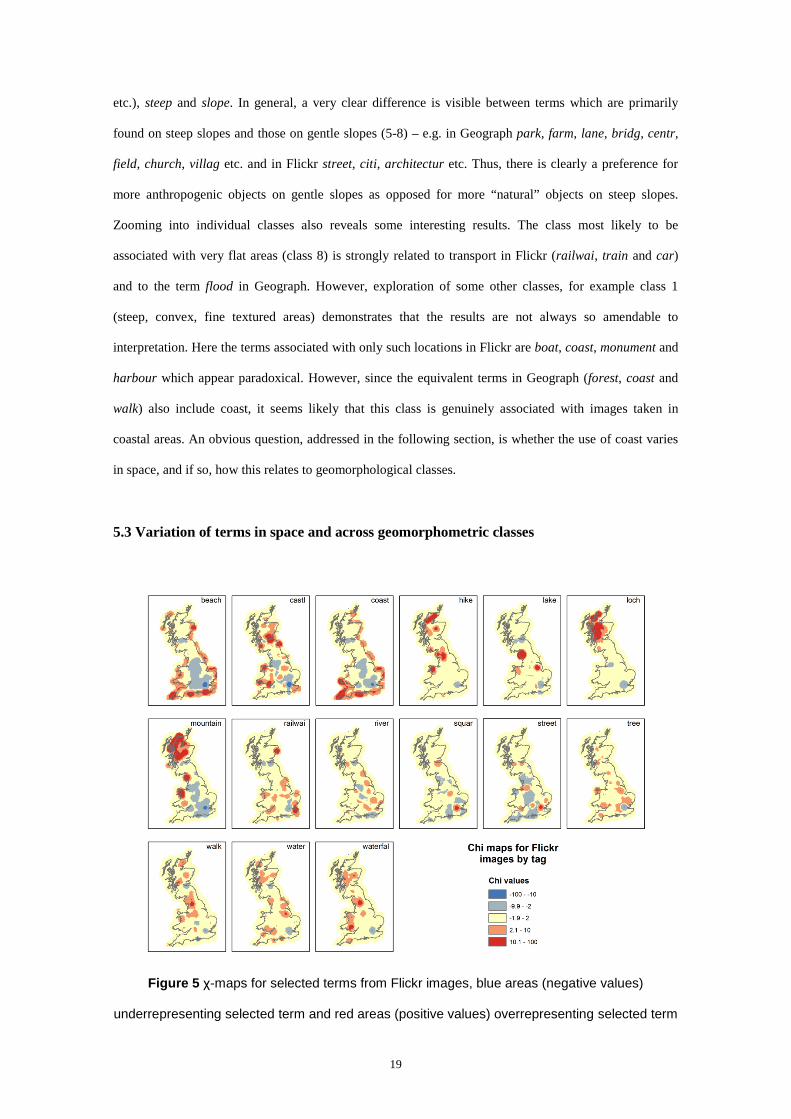
5.3 Variation of terms in space and across geomorphometric classes
Figure 5 χ-maps for selected terms from Flickr images, blue areas (negative values)
underrepresenting selected term and red areas (positive values) overrepresenting selected term

20
Figure 6 χ-maps for selected terms from Geograph images, blue areas (negative values)
underrepresenting selected term and red areas (positive values) overrepresenting selected term
Figures 5 and 6 show χ-maps for a selection of highly ranked terms from Flickr (Figure 5) and Geograph
(Figure 6). Since the number of images in a grid cell is often small at a 90m resolution, we generated χ-
maps at a 9km resolution. Effectively the red areas on the map indicate overrepresentation of a term, and
the blue areas underrepresentation. It is important to note that the expected distributions were based on
the actual distributions in the respective collections, and that thus, for example, the strong urban bias of
Flickr is already accounted for in these maps.
In §5.2 we observed that the term coast was, somewhat surprisingly, associated, in both Flickr and
Geograph, with class 1 (steep, convex, fine textured areas). When the corresponding χ-maps are observed,
it is clear the term coast is not evenly distributed around Great Britain, but appears to be particularly
favorably used in both collections in the southwest of England, and in Geograph in general in the south of
England. This may suggest either some cultural reason for the more prominent use of coast in this region,
or perhaps a particularly scenic or commonly photographed coast.
21
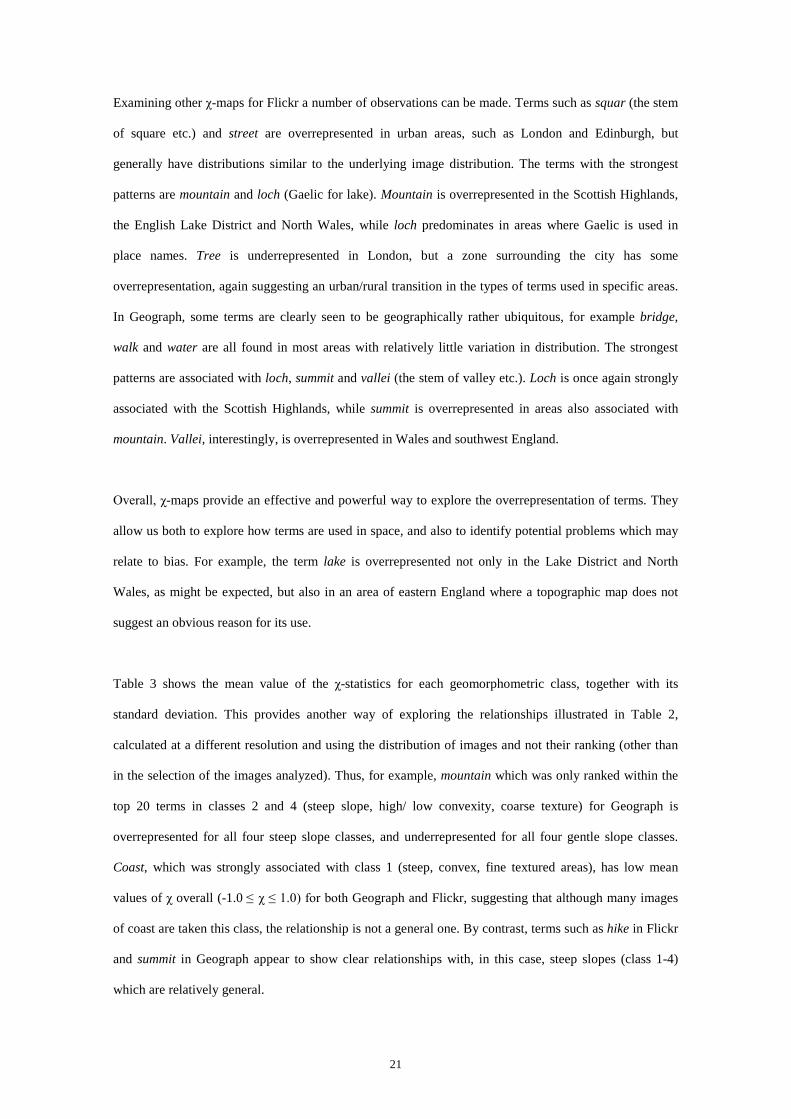
Examining other χ-maps for Flickr a number of observations can be made. Terms such as squar (the stem
of square etc.) and street are overrepresented in urban areas, such as London and Edinburgh, but
generally have distributions similar to the underlying image distribution. The terms with the strongest
patterns are mountain and loch (Gaelic for lake). Mountain is overrepresented in the Scottish Highlands,
the English Lake District and North Wales, while loch predominates in areas where Gaelic is used in
place names. Tree is underrepresented in London, but a zone surrounding the city has some
overrepresentation, again suggesting an urban/rural transition in the types of terms used in specific areas.
In Geograph, some terms are clearly seen to be geographically rather ubiquitous, for example bridge,
walk and water are all found in most areas with relatively little variation in distribution. The strongest
patterns are associated with loch, summit and vallei (the stem of valley etc.). Loch is once again strongly
associated with the Scottish Highlands, while summit is overrepresented in areas also associated with
mountain. Vallei, interestingly, is overrepresented in Wales and southwest England.
Overall, χ-maps provide an effective and powerful way to explore the overrepresentation of terms. They
allow us both to explore how terms are used in space, and also to identify potential problems which may
relate to bias. For example, the term lake is overrepresented not only in the Lake District and North
Wales, as might be expected, but also in an area of eastern England where a topographic map does not
suggest an obvious reason for its use.
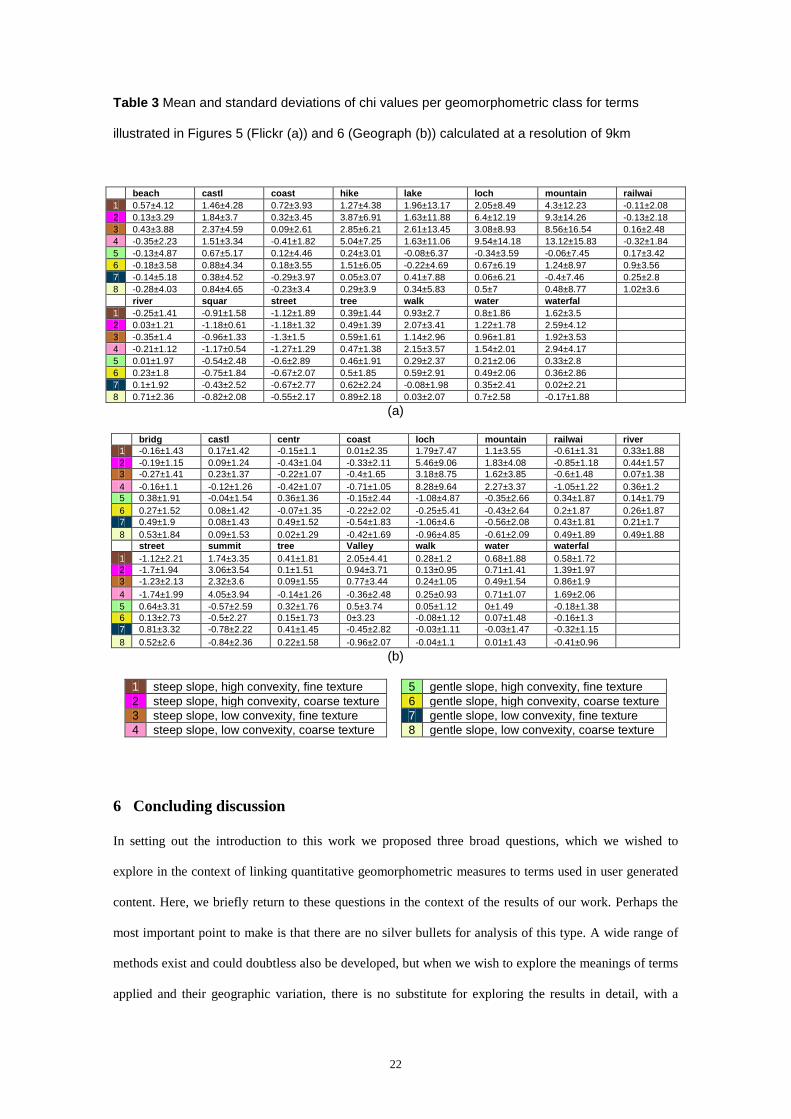
Table 3 shows the mean value of the χ-statistics for each geomorphometric class, together with its
standard deviation. This provides another way of exploring the relationships illustrated in Table 2,
calculated at a different resolution and using the distribution of images and not their ranking (other than
in the selection of the images analyzed). Thus, for example, mountain which was only ranked within the
top 20 terms in classes 2 and 4 (steep slope, high/ low convexity, coarse texture) for Geograph is
overrepresented for all four steep slope classes, and underrepresented for all four gentle slope classes.
Coast, which was strongly associated with class 1 (steep, convex, fine textured areas), has low mean
values of χ overall (-1.0 ≤ χ ≤ 1.0) for both Geograph and Flickr, suggesting that although many images
of coast are taken this class, the relationship is not a general one. By contrast, terms such as hike in Flickr
and summit in Geograph appear to show clear relationships with, in this case, steep slopes (class 1-4)
which are relatively general.
22
Table 3 Mean and standard deviations of chi values per geomorphometric class for terms
illustrated in Figures 5 (Flickr (a)) and 6 (Geograph (b)) calculated at a resolution of 9km
beach castl coast hike lake loch mountain railwai
1 0.57±4.12 1.46±4.28 0.72±3.93 1.27±4.38 1.96±13.17 2.05±8.49 4.3±12.23 -0.11±2.08 2 0.13±3.29 1.84±3.7 0.32±3.45 3.87±6.91 1.63±11.88 6.4±12.19 9.3±14.26 -0.13±2.18 3 0.43±3.88 2.37±4.59 0.09±2.61 2.85±6.21 2.61±13.45 3.08±8.93 8.56±16.54 0.16±2.48 4 -0.35±2.23 1.51±3.34 -0.41±1.82 5.04±7.25 1.63±11.06 9.54±14.18 13.12±15.83 -0.32±1.84 5 -0.13±4.87 0.67±5.17 0.12±4.46 0.24±3.01 -0.08±6.37 -0.34±3.59 -0.06±7.45 0.17±3.42 6 -0.18±3.58 0.88±4.34 0.18±3.55 1.51±6.05 -0.22±4.69 0.67±6.19 1.24±8.97 0.9±3.56 7 -0.14±5.18 0.38±4.52 -0.29±3.97 0.05±3.07 0.41±7.88 0.06±6.21 -0.4±7.46 0.25±2.8 8 -0.28±4.03 0.84±4.65 -0.23±3.4 0.29±3.9 0.34±5.83 0.5±7 0.48±8.77 1.02±3.6
river squar street tree walk water waterfal
1 -0.25±1.41 -0.91±1.58 -1.12±1.89 0.39±1.44 0.93±2.7 0.8±1.86 1.62±3.5 2 0.03±1.21 -1.18±0.61 -1.18±1.32 0.49±1.39 2.07±3.41 1.22±1.78 2.59±4.12 3 -0.35±1.4 -0.96±1.33 -1.3±1.5 0.59±1.61 1.14±2.96 0.96±1.81 1.92±3.53 4 -0.21±1.12 -1.17±0.54 -1.27±1.29 0.47±1.38 2.15±3.57 1.54±2.01 2.94±4.17 5 0.01±1.97 -0.54±2.48 -0.6±2.89 0.46±1.91 0.29±2.37 0.21±2.06 0.33±2.8 6 0.23±1.8 -0.75±1.84 -0.67±2.07 0.5±1.85 0.59±2.91 0.49±2.06 0.36±2.86 7 0.1±1.92 -0.43±2.52 -0.67±2.77 0.62±2.24 -0.08±1.98 0.35±2.41 0.02±2.21 8 0.71±2.36 -0.82±2.08 -0.55±2.17 0.89±2.18 0.03±2.07 0.7±2.58 -0.17±1.88 (a)
bridg castl centr coast loch mountain railwai river
1 -0.16±1.43 0.17±1.42 -0.15±1.1 0.01±2.35 1.79±7.47 1.1±3.55 -0.61±1.31 0.33±1.88 2 -0.19±1.15 0.09±1.24 -0.43±1.04 -0.33±2.11 5.46±9.06 1.83±4.08 -0.85±1.18 0.44±1.57 3 -0.27±1.41 0.23±1.37 -0.22±1.07 -0.4±1.65 3.18±8.75 1.62±3.85 -0.6±1.48 0.07±1.38 4 -0.16±1.1 -0.12±1.26 -0.42±1.07 -0.71±1.05 8.28±9.64 2.27±3.37 -1.05±1.22 0.36±1.2 5 0.38±1.91 -0.04±1.54 0.36±1.36 -0.15±2.44 -1.08±4.87 -0.35±2.66 0.34±1.87 0.14±1.79 6 0.27±1.52 0.08±1.42 -0.07±1.35 -0.22±2.02 -0.25±5.41 -0.43±2.64 0.2±1.87 0.26±1.87 7 0.49±1.9 0.08±1.43 0.49±1.52 -0.54±1.83 -1.06±4.6 -0.56±2.08 0.43±1.81 0.21±1.7 8 0.53±1.84 0.09±1.53 0.02±1.29 -0.42±1.69 -0.96±4.85 -0.61±2.09 0.49±1.89 0.49±1.88
street summit tree Valley walk water waterfal
1 -1.12±2.21 1.74±3.35 0.41±1.81 2.05±4.41 0.28±1.2 0.68±1.88 0.58±1.72 2 -1.7±1.94 3.06±3.54 0.1±1.51 0.94±3.71 0.13±0.95 0.71±1.41 1.39±1.97 3 -1.23±2.13 2.32±3.6 0.09±1.55 0.77±3.44 0.24±1.05 0.49±1.54 0.86±1.9 4 -1.74±1.99 4.05±3.94 -0.14±1.26 -0.36±2.48 0.25±0.93 0.71±1.07 1.69±2.06 5 0.64±3.31 -0.57±2.59 0.32±1.76 0.5±3.74 0.05±1.12 0±1.49 -0.18±1.38 6 0.13±2.73 -0.5±2.27 0.15±1.73 0±3.23 -0.08±1.12 0.07±1.48 -0.16±1.3 7 0.81±3.32 -0.78±2.22 0.41±1.45 -0.45±2.82 -0.03±1.11 -0.03±1.47 -0.32±1.15 8 0.52±2.6 -0.84±2.36 0.22±1.58 -0.96±2.07 -0.04±1.1 0.01±1.43 -0.41±0.96 (b)
1 steep slope, high convexity, fine texture 5 gentle slope, high convexity, fine texture 2 steep slope, high convexity, coarse texture 6 gentle slope, high convexity, coarse texture 3 steep slope, low convexity, fine texture 7 gentle slope, low convexity, fine texture 4 steep slope, low convexity, coarse texture 8 gentle slope, low convexity, coarse texture
6 Concluding discussion
In setting out the introduction to this work we proposed three broad questions, which we wished to
explore in the context of linking quantitative geomorphometric measures to terms used in user generated
content. Here, we briefly return to these questions in the context of the results of our work. Perhaps the
most important point to make is that there are no silver bullets for analysis of this type. A wide range of
methods exist and could doubtless also be developed, but when we wish to explore the meanings of terms
applied and their geographic variation, there is no substitute for exploring the results in detail, with a
23
good geographic knowledge of the region in question. Nonetheless, we believe that the methods and
results presented here are useful and, with care, generalisable and suggest ways in which new sources of
data can be used to explore pressing questions in GIScience.
6.1 Which methods are required to explore the relationship between everyday language
descriptions of landforms and quantitative geomorphometric classifications?
In this work we have combined a range of methods, developed by other authors and ourselves to explore
the linkages between descriptions of landforms and geomorphometric classifications. We knowingly
chose an unsupervised classification scheme, since such a method makes no requirements on the naming
of classes, is widely applied and in the case of the classification by Iwahashi and Pike (2007) is widely
used in geomorphometry and uses terrain attributes which are relatively straightforward to perceive and
thus might also be reflected in images. We adapted methods from Rattenbury and Naaman (2009) to rank
terms, which consider not only term frequency, but also the distribution of terms in space and user
contributions. Such an approach is essential if the effects of bias are to be minimized, since in previous
work we have found that very prominent terms can be introduced by small numbers of users (Purves et al.
2011). We adopted the term lists generated in previous work (Purves et al., 2011) from Flickr and
Geograph for our term analysis, thus giving us access to a classification of terms. This has undoubted
weaknesses, not least since both the actual terms and their types are constrained by this classification, but
the advantage that the work is repeatable and comparable to previous studies. Finally, we compared terms
using ranked lists, and also generated a number of representations of class membership, for example in
the form of highly ranked terms per class or χ-maps indicating over and underrepresentation. Since these
methods were also carried out at high (90m) and low (9km) resolutions, we were also able to compare the
influence of resolution on the results. Overall, the methods allowed us to explore a number of aspects of
the use of UGC and its relationship with geomorphometric classes in detail, and we believe provide an
appropriate and useful approach to the data.
6.2 Can individual geomorphometric classes be related to terms used in user generated
content?
Perhaps the most obvious result is, at least at first glance, disappointing. Relatively few of the terms listed
in Table 2 are explicitly related to geomorphometry, and it could be argued that homogenous regions

24
generated through any methods would result in some interesting patterns. Nonetheless, terms such as hill,
mountain, valley and glen are all clearly related to geomorphometry demonstrating a clear link between
everyday terms found in UGC and an unsupervised classification of a DEM. Seemingly relatively trivial
results (for example the relationship of steep to steep slopes (classes 1-4) are of interest, since they
demonstrate that a simple unsupervised method using mean values of slope appears to approach everyday
perceptions of what steep slopes are. Equally, the most highly ranked terms, especially in Geograph, were
typically elements, which accords with Smith and Mark’s (2003: 419) argument that “the naïve or folk
based disciplines appear to work exclusively – or at least overwhelmingly … with object-based
representations of reality”. However, it is important to note that the list of terms available may also have
biased this result, though it also appears to be supported by Rorissa’s (2010) observations on the use of
basic levels in labelling images. The nature of the terms used in both collections varied, especially at the
level of qualities and activities. Although these differences may be partly due to different term lists, some
of the differences appear to represent real differences in the descriptions. Thus, although qualities are
somewhat less common in Flickr (Purves et al., 2011) they are nonetheless much more common in our
list of highly ranked terms (Table 1), while highly ranked Geograph terms are dominated by elements.
6.3 How does the use of everyday language vary across space and geomorphometric
classes?
The use of χ-maps based on the underlying distribution of images in a collection allowed us to explore
how the use of terms varied with respect to the collection itself. A number of terms show very clear
patterns in space, for example, mountain or loch. These patterns are in some cases clearly related to
geomorphometric classes and in turn relief, and in other cases may be the result of some, as yet
unidentified bias or cultural differences (Mark and Turk, 2003). Thus, loch is a Gaelic term, and
associated not only with steep slopes, but also Gaelic speaking regions. The overrepresentation of coast in
particular areas and for particular geomorphometric classes in both collections, suggest a real difference
in the description of coastal areas which is worthy of further examination, for example through studies of
co-occurrence or enthnophysiographic methods.
25
6.4 Concluding remarks and outlook
In this paper we set out to explore the relationship between UGC and geomorphometry. We believe that
the methods set out have something to offer if we wish to come closer to “folk conceptualizations” of
space which relate to the naïve geography proposed by Egenhofer and Mark (1995) as a key need for the
development of GIS which more closely matches lay expectations. Our methods show that some terms
have clear links to particular geomorphometric classes, and in particular to steep and gentle slopes as
identified by an unsupervised classification. Furthermore, differences between two collections of UGC
are apparent, with, for example, a clear preference in a more “geographically explicit” collection for
elements or objects which might be represented on a map. Such results suggest that our methods have
something to offer in the field of ethnophysiography, and that exploring how landforms are described in
different locations through UGC may be a useful complement at a broad scale to the finer grained
investigations made through ethnographic approaches.
Our long term aim is to be able to link everyday terms to geomorphometric classifications and thus be
able to, for example, automatically generate indexing terms for georeferenced information based on
widely available geographic data such as DEMs. However, although interesting associations are apparent
in the use of terms and geomorphometry investigated in this paper, highly ranked explicitly
geomorphometric terms are relatively uncommon. It may be that by investigating lower ranked terms
more references to everyday landforms will be found, though the frequency of use of many such terms is
likely to be too low to explore spatial patterns. This is a general problem with UGC which might be
addressed by:
i) fusion of multiple collections of UGC, especially those likely to explicitly describe landforms
(e.g. descriptions of mountaineering routes or hiking holidays);
ii) investigation of terms typically used to query information services, particularly those which
deal with landforms; and
iii) text mining methods to link terms used by domain experts to those in everyday use.
26
Acknowledgements
We would like to, as ever, thank Barry Hunter, and all Geograph contributors, for helping us gain access
to Geograph data which is made available under at Creative Commons BY-SA licence
(http://creativecommons.org/licenses/by-sa/2.0/) at http://data.geograph.org.uk/dumps/. Patrick Laube is
thanked for his helpful comments on a draft of the manuscript. This research described in this paper was
partially supported by SNF Project 200021-126659. The comments of two anonymous referees and the
editor helped us to significantly improve the paper.
References
Ames M, and Naaman M 2007 Why we tag: Motivations for annotation in mobile and online media. In
Proceedings of the SIGCHI conference on Human Factors in Computing Systems. San Jose, USA, ACM
Press: 971-80
Burrough P A, Van Gaansa P F M, and MacMillan R A 2000 High-resolution landform classification
using fuzzy k-means. Fuzzy Sets and Systems 113 (1): 37-52
Coleman D, Georgiadou Y, and Labonte J 2009 Volunteered Geographic Information: the nature and
motivation of produsers. International Journal of Spatial Data Infrastructures Research 4: 332-58
Crandall D, Backstrom L, Huttenlocher D, and Kleinberg J 2009 Mapping the world’s photos. In
Proceedings of the 18th International Conference on World Wide Web. 761-70
Davies C, Holt I, Green J, Harding J, and Diamond L 2009 User needs and implications for modelling
vague named places. Spatial Cognition & Computation 9 (3): 174-94, Taylor & Francis
Deng Y 2007 New trends in digital terrain analysis: landform delineation, representation and
classification. Progress in Physical Geography 31 (4): 405-419
27
Deng Y, and Wilson J P, and Bauer B O 2007 DEM resolution dependencies of terrain attributes across a
landscape. International Journal of Geographical Information Science 21 (2): 187-213
Edwardes A, and Purves R 2007 A theoretical grounding for semantic descriptions of place. In
Proceedings of 7th International Symposium on Web and Wireless Geographical Information Systems.
106-21
Egenhofer M, and Mark D 1995 Naive Geography. In A. Frank and W. Kuhn (eds.), Lecture Notes in
Computer Science (COSIT ’95). Semmering, Austria, Springer 988: 1-15
Girardin F, Vaccari A, Gerber A, and Ratti C 2009 Quantifying urban attractiveness from the distribution
and density of digital footprints. Journal of Spatial Data Infrastructure Research 4: 175-200
Goodchild M 2007 Citizens as sensors: The world of volunteered geography. GeoJournal 69 (4): 211-21
Gorokhovich Y, and Voustianiouk A 2006 Accuracy assessment of the processed SRTM-based elevation
data by CGIAR using field data from USA and Thailand and its relation to the terrain characteristics.
Remote Sensing of Environment 104 (4): 409-15, Elsevier
Grothe C, and Schaab J 2009 An evaluation of kernel density estimation and support vector machines for
automated generation of footprints for imprecise regions from geotags. Spatial Cognition & Computation
9 (3): 195-211
Gschwend C, and Purves R 2011 Comparing Flickr tags to a geomorphometric classification. In
Proceedings of the 19th GIS Research UK Annual Conference. Portsmouth, UK, 27 April 2011 - 29 April
2011: 174-8
Gschwend C 2010 Erfassung umgangssprachlicher Geographie im Zusammenhang mit
Geomorphometrie, MSc thesis, Department of Geography, University of Zurich
28
Guy M, and Tonkin E 2006 Folksonomies: Tidying up tags? D-Lib Magazine 12 (1)
Haklay M 2010 How good is OpenStreetMap information? A comparative study of OpenStreetMap and
Ordnance Survey datasets for London and the rest of England. Environment and Planning B 37 (4): 682-
703
Hollenstein L, and Purves R S 2010 Exploring place through User Generated Content: Using Flickr tags
to describe city cores. Journal of Spatial Information Science 1: 21-48
Iwahashi J, and Pike R 2007 Automated classifications of topography from DEMs by an unsupervised
nested-means algorithm and a three-part geometric signature. Geomorphology 86 (3-4): 409-40, Elsevier
Keßler C, Maué P, Heuer J, and Bartoschek T 2009 Bottom–up gazetteers: Learning from the implicit
semantics of geotags. In K. Janowicz, M. Raubal and S. Levashkin (eds.), Lecture Notes in Computer
Science (GeoS ’09). 5892: 83-102
Mark D, and Turk A 2003 Landscape Categories in Yinjibarndi: Ontology, Environment, and Language.
In W. Kuhn, M. F. Worboys and S. Timpf (eds.), Lecture Notes in Computer Science (COSIT ’03).
Ittingen, Switzerland, Springer 2825: 31-49
Montello D, Goodchild M, Gottsegen J, and Fohl P 2003 Where's downtown?: Behavioral methods for
determining referents of vague spatial queries. Spatial Cognition & Computation 3 (2&3): 185-204
Nielsen J 2006 Participation inequality: Encouraging more users to contribute. Alertbox (9 October),
WWW document, http://www.useit.com/alertbox/participation_inequality.html, accessed 31 August 2011
Pike R, Evans I, and Hengl T 2009 Geomorphometry: A Brief Guide. In T. Hengl and H. Reuter (eds.),
Geomorphometry. Elsevier, chapter 1, 3-30
29
Popescu A, Grefenstette G, and Bouamor H 2009 Mining a multilingual geographical gazetteer from the
Web. In Proceedings of the 2009 IEEE/WIC/ACM International Joint Conference on Web Intelligence
and Intelligent Agent Technology. 58-65
Porter M 1980 An algorithm for suffix stripping, Program 14 (3): 130-7
Purves R S, Edwardes A, and Wood J 2011 Describing place through user generated content. First
Monday, September 2011
Purves R S, Edwardes A, Fan X, Hall M, and Tomko M (2010). Automatically generating keywords for
georeferenced images. In Proceedings of the GIS Research UK 18th Annual Conference GISRUK 2010.
University College London (UCL), 14 April 2010 - 16 April 2010: 203-7
Rattenbury T, and Naaman M 2009 Methods for extracting place semantics from Flickr tags. ACM
Transactions on the Web 3 (1)
Rorissa A 2008 User-generated descriptions of individual images versus labels of groups of images: A
comparison using basic level theory. Information Processing & Management 44 (5): 1741-53
Rorissa A 2010 A comparative study of Flickr tags and index terms in a general image collection. Journal
of the American Society for Information Science and Technology 61 (11): 230-42
Sigurbjörnsson B, and Van Zwol R 2008 Flickr tag recommendation based on collective knowledge. In
Proceeding of the 17th International Conference on World Wide Web. 327-36
Smith B, and Mark D 2003 Do Mountains Exist? Towards an Ontology of Landforms. Environment and
Planning B: Planning and Design 30 (3): 411–27
Tversky B, and Hemenway K 1983 Categories of Environmental Scenes. Cognitive Psychology 15: 121-
49

30
Winget M 2006 User-defined classification on the online photo sharing site Flickr... or, how I learned to
stop worrying and love the million typing monkeys. In J. Furner and J. T. Tennis (eds.), Advances in
Classification Research (ASIS&T SIG/CR Classification). Philadelphia, USA 17
Wood J, Dykes J, and Slingsby A 2007 Interactive visual exploration of a large spatio-temporal dataset:
Reflections on a geovisualization mashup. IEEE Transactions on Visualization and Computer Graphics,
13 (6): 1176-83
Wood J 1996 The geomorphological characterisation of digital elevation models, PhD thesis, Department
of Geography, University of Leicester