exploiting context analysis for combining multiple entity resolution systems zhaoqi chen, dmitri v....
Post on 21-Dec-2015
231 views
TRANSCRIPT
Exploiting Context Analysis for Combining
Multiple Entity Resolution Systems
Zhaoqi Chen, Dmitri V. Kalashnikov, Sharad MehrotraUniversity of California, Irvine
© 2009 Dmitri V. Kalashnikov
ACM SIGMOD 2009 Conference, Providence, RI, USA, June 30 – July 2, 2009
Information Quality
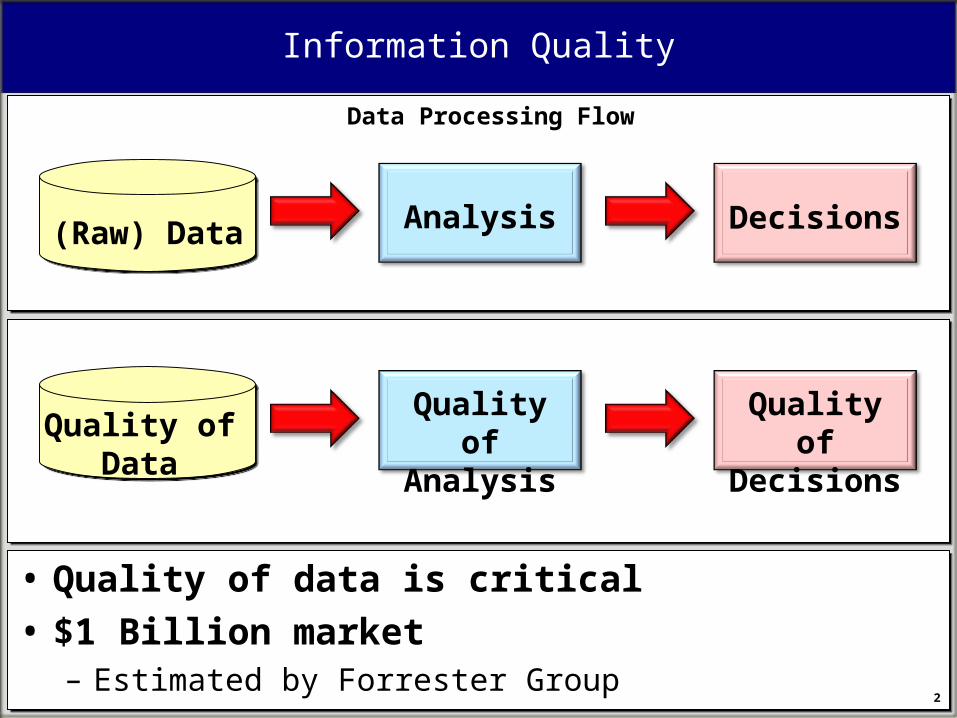
• Quality of data is critical
• $1 Billion market – Estimated by Forrester Group
Quality of Data
Quality of Analysis
Quality of Decisions
(Raw) Data Analysis Decisions
Data Processing Flow
2
Entity Resolution
… J. Smith ...
.. John Smith ...
.. Jane Smith ...
MIT
Intel Inc.
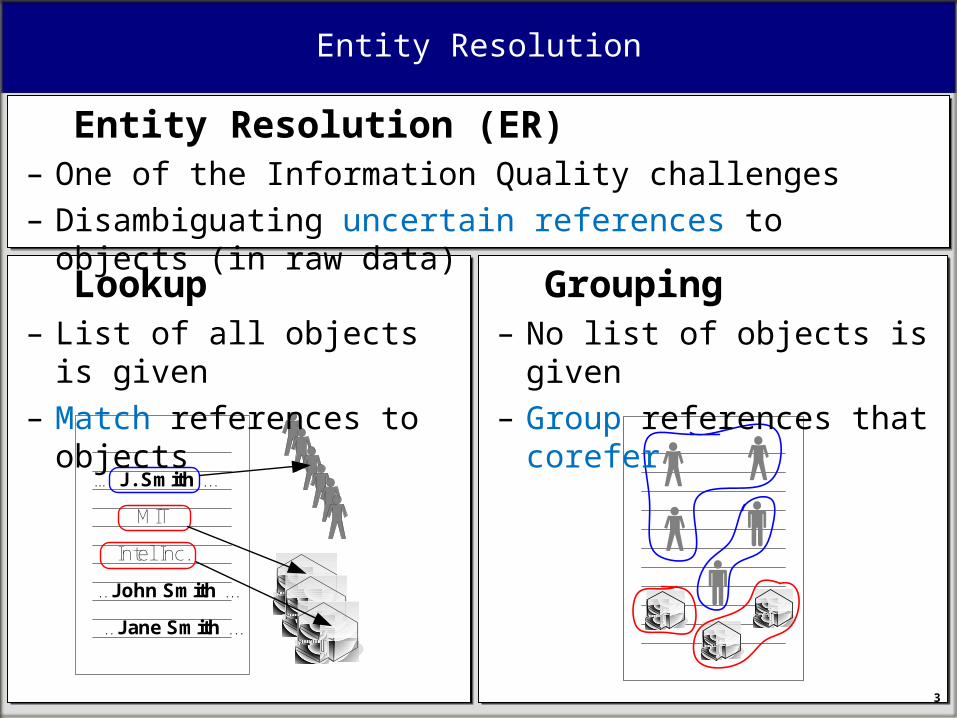
Lookup– List of all objects is given – Match references to objects
Grouping– No list of objects is given – Group references that corefer
Entity Resolution (ER)– One of the Information Quality challenges– Disambiguating uncertain references to objects (in raw data)
3
4
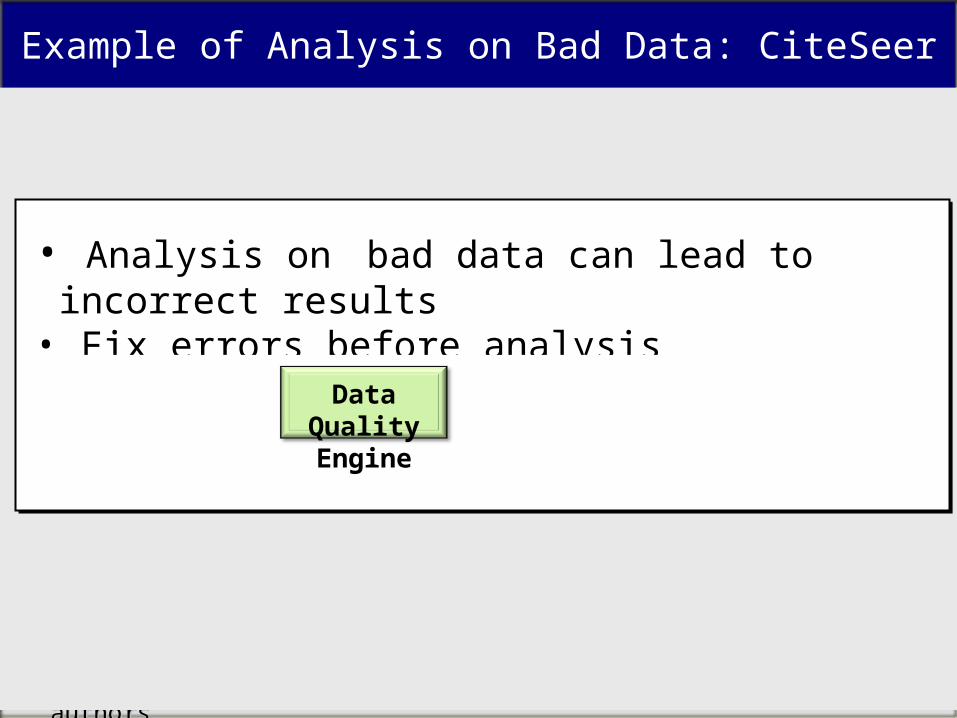
Example of Analysis on Bad Data: CiteSeer
CiteSeer: Top-CiteSeer: Top-kk most cited authors most cited authors DBLPDBLP DBLPDBLP
Unexpected Entries– Lets check two people in DBLP
– “A. Gupta”
– “L. Zhang”• Analysis on bad data can lead to incorrect results• Fix errors before analysis
Raw Data Analysis
Decisions
Data Quality Engine
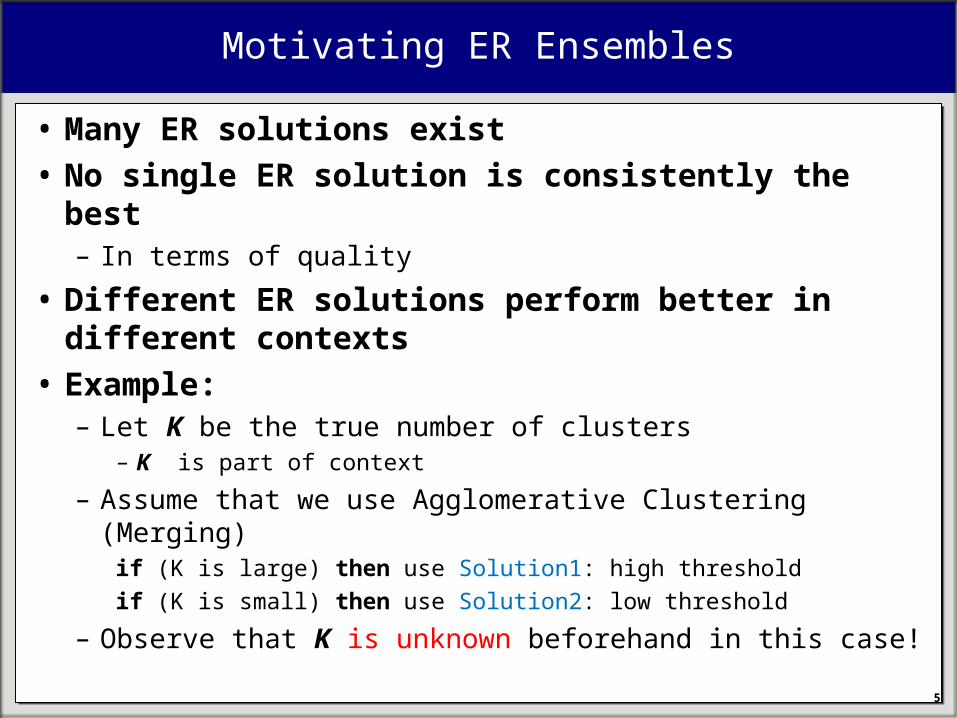
Motivating ER Ensembles
• Many ER solutions exist
• No single ER solution is consistently the best – In terms of quality
• Different ER solutions perform better in different contexts
• Example: – Let K be the true number of clusters
– K is part of context
– Assume that we use Agglomerative Clustering (Merging)if (K is large) then use Solution1: high threshold
if (K is small) then use Solution2: low threshold
– Observe that K is unknown beforehand in this case!
5
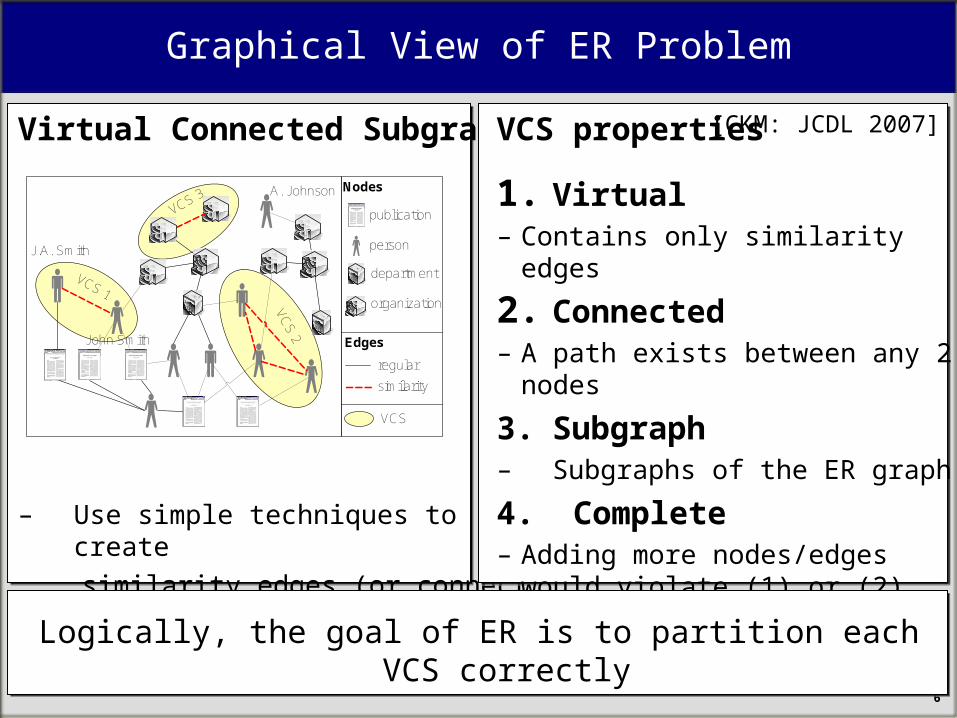
Virtual Connected Subgraph
– Use simple techniques to create
similarity edges (or connect all refs.)– Similarity edges form VCSs
6
Graphical View of ER Problem
person
publication
department
organization
similarity
regular
Nodes
Edges
VCS
VCS 1
VC
S 2
VCS 3
John Smith
J.A. Smith
A. Johnson
VCS properties
1. Virtual– Contains only similarity edges
2. Connected– A path exists between any 2 nodes
3. Subgraph– Subgraphs of the ER graph
4. Complete– Adding more nodes/edges would
violate (1) or (2)
Logically, the goal of ER is to partition each VCS correctly
[CKM: JCDL 2007]
S2S1 SN
Raw Dataset
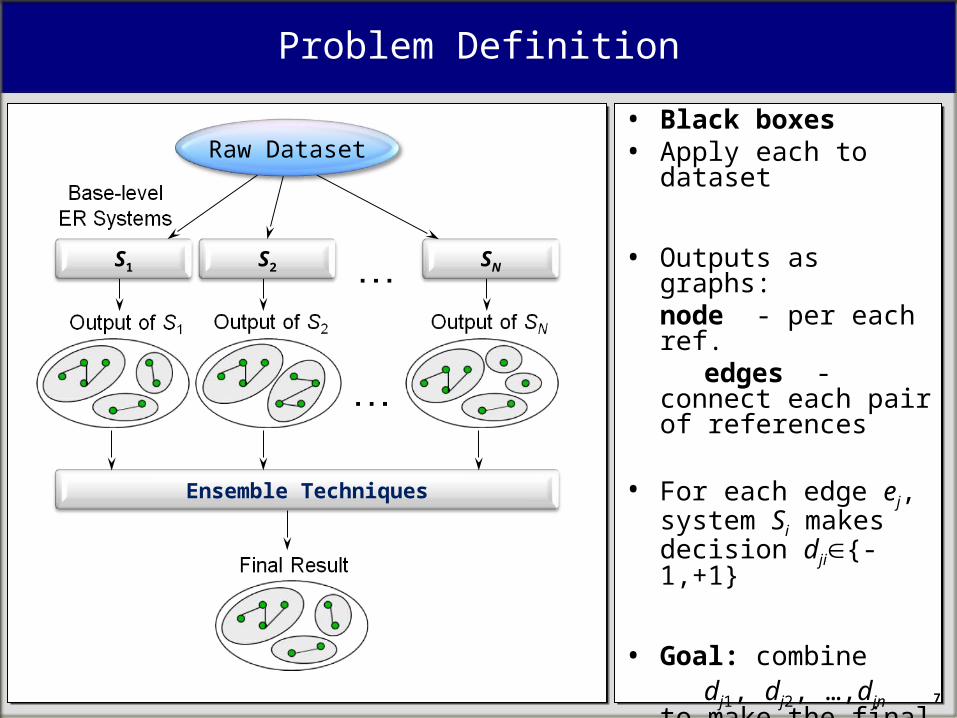
Problem Definition
7
• Black boxes• Apply each to dataset
• Outputs as graphs: node - per each ref.
edges - connect each pair of references
• For each edge ej, system Si makes decision dji{-1,+1}
• Goal: combine dj1, dj2, …,djn to make
the final decision aj* for ej, such that the final clustering is as close to the ground truth as possible
Ensemble Techniques
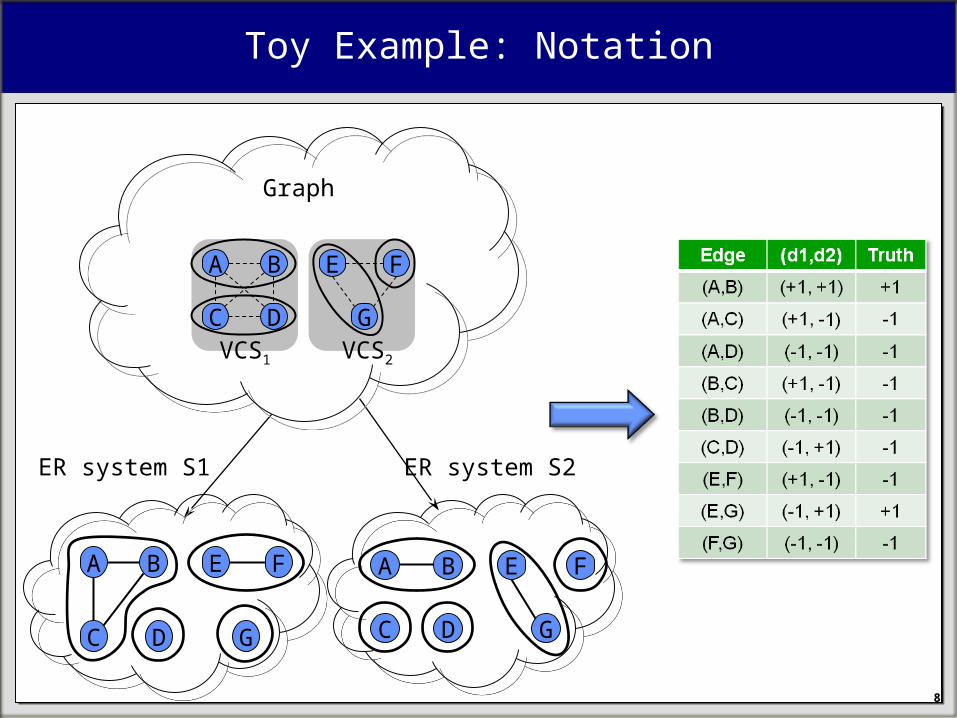
Toy Example: Notation
8
E F
G
A B
C DVCS1 VCS2
A B
C D
E F
G
E F
G
A B
C D
ER system S1 ER system S2
Graph
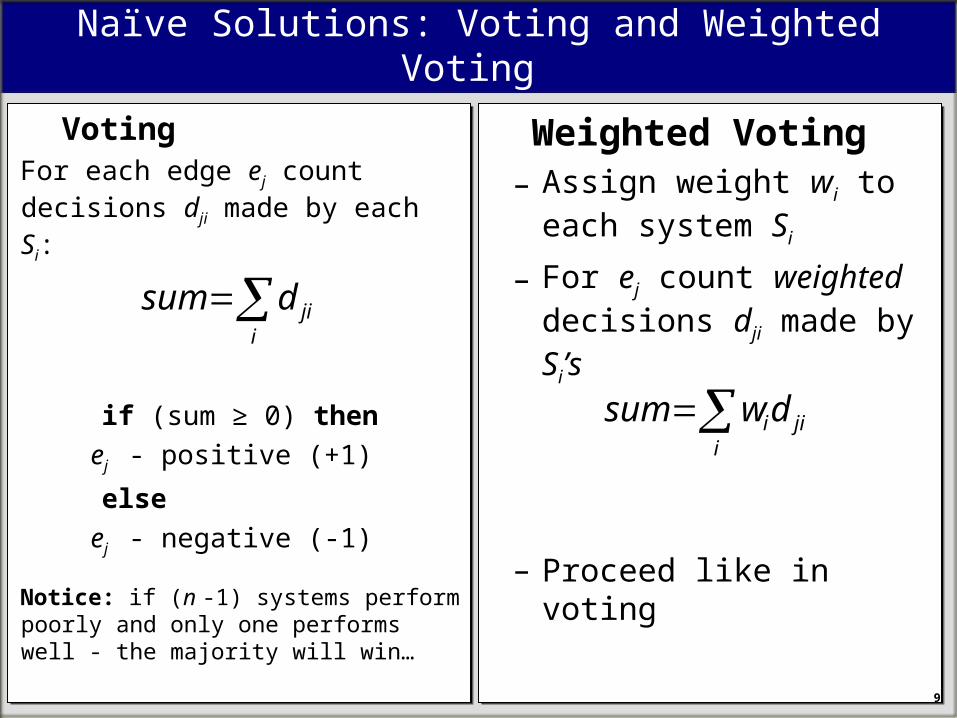
Naïve Solutions: Voting and Weighted Voting
VotingFor each edge ej count decisions dji made by each Si:
if (sum ≥ 0) then
ej - positive (+1)
else
ej - negative (-1)
Notice: if (n -1) systems perform poorly and only one performs well - the majority will win…
9
i
jidsum
i
jiidwsum
Weighted Voting– Assign weight wi to each
system Si
– For ej count weighted decisions dji made by Si’s
– Proceed like in voting
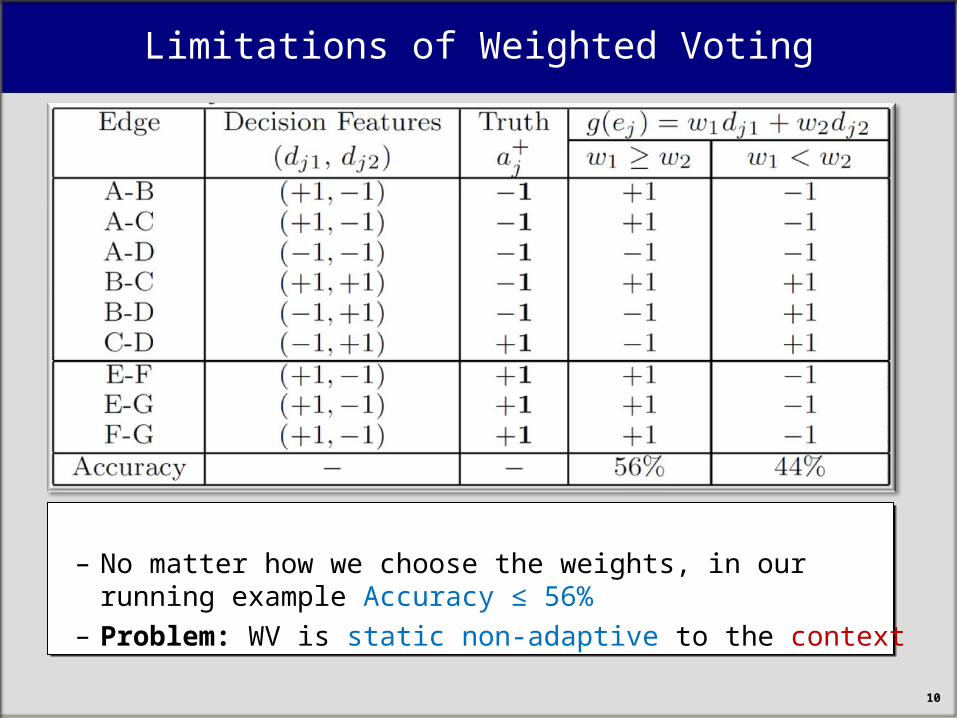
Limitations of Weighted Voting
– No matter how we choose the weights, in our running example Accuracy ≤ 56%
– Problem: WV is static non-adaptive to the context
10
11
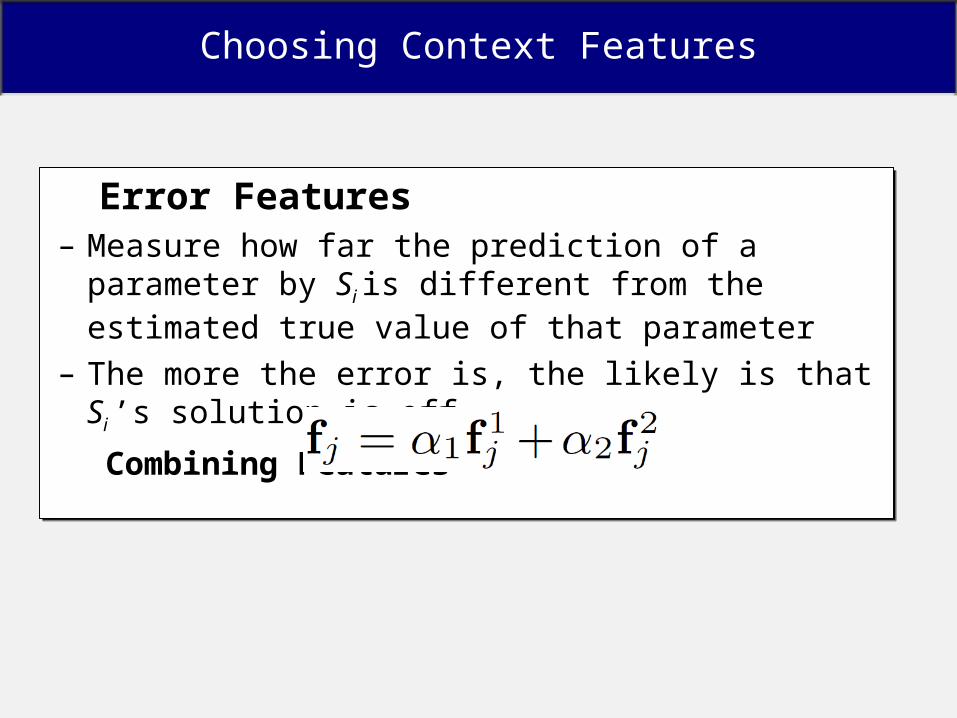
Choosing Context Features
• Effectiveness – should capture well which ER systems work well in the given context
• Generality – should be generic, not be present just in few datasets
11
Number of Clusters (K)– K+ can help (merging ex.)
– But, K+ is unknown!– Use regression to predict
– K1, K2, …, Kn → K*
– Ki is # of clusters by Si
– Features for edge ej:
Node Fanout– Nv
+ is # of pos. edges of v
– Also unknown– Use regression to predict
– Nv1, Nv2,…, Nvn → Nv*
– Nvi is # according to Si
– Features for edge ej:
Error Features – Measure how far the prediction of a parameter by Si is
different from the estimated true value of that parameter
– The more the error is, the likely is that Si ’s solution is off
Combining Features
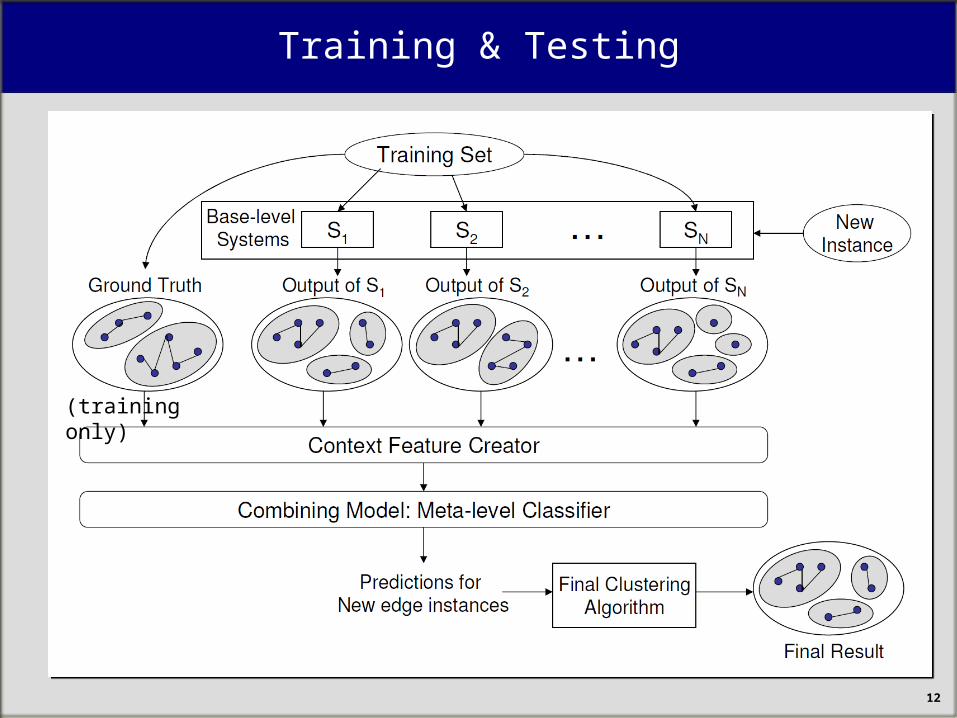
Training & Testing
12
(training only)
Approach 1: Context-Extended Classification
13
f2
d1 d2
d2
≤0.9 >0.9
-1 1
C=-1 C=1
-1 1
-1 1
C=-1 C=1
C=-1
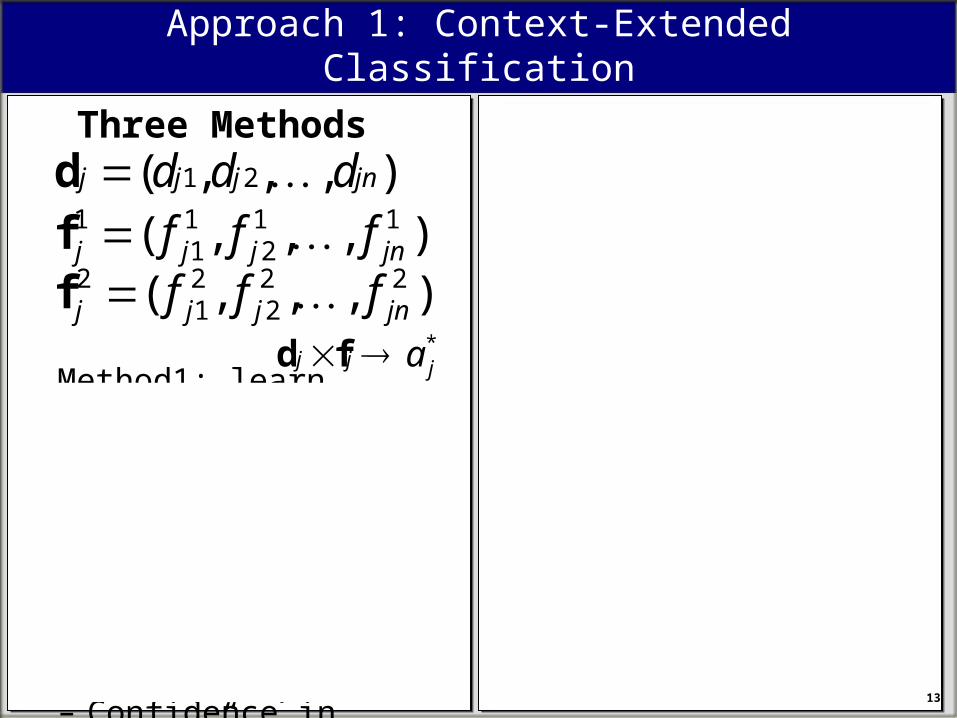
Three Methods
Method1: learn
Method2:
Method3: 2n features → n
– Confidence in “merge”– Learn
),,,( 21 jnjjj ddd d),,,( 11
211
1jnjjj fff f),,,( 22
221
2jnjjj fff f
*jjj afd*jjjj a 21 ffd
),,,( 21 jnjjj vvv v
*jj av
Approach 2: Context-Weighted Classification
14
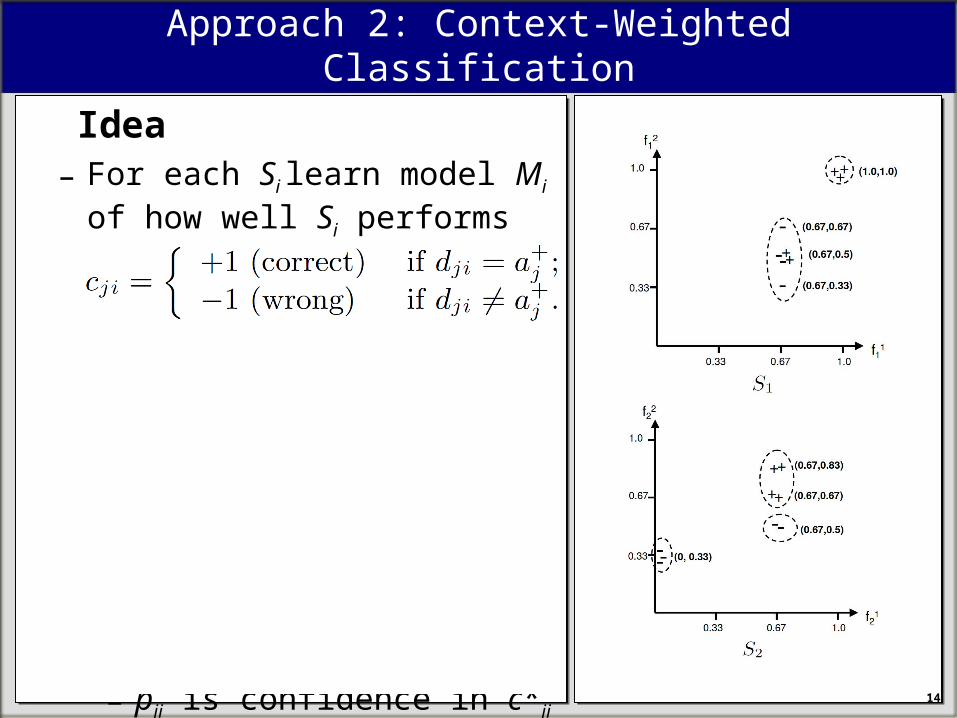
Idea– For each Si learn model Mi of
how well Si performs in context
– Learn fj → cj
Algorithm
– Apply Si, get dj and fj for ej
– Apply Mi on fj, get c*ji and pji
– pji is confidence in c*ji
– vji = dji ·c*ji · pji; vj = (vj1, vj2,…, vjn)
– May reverse some decisions
– Learn/Use vj → a*j mapping
Clustering
15
Example
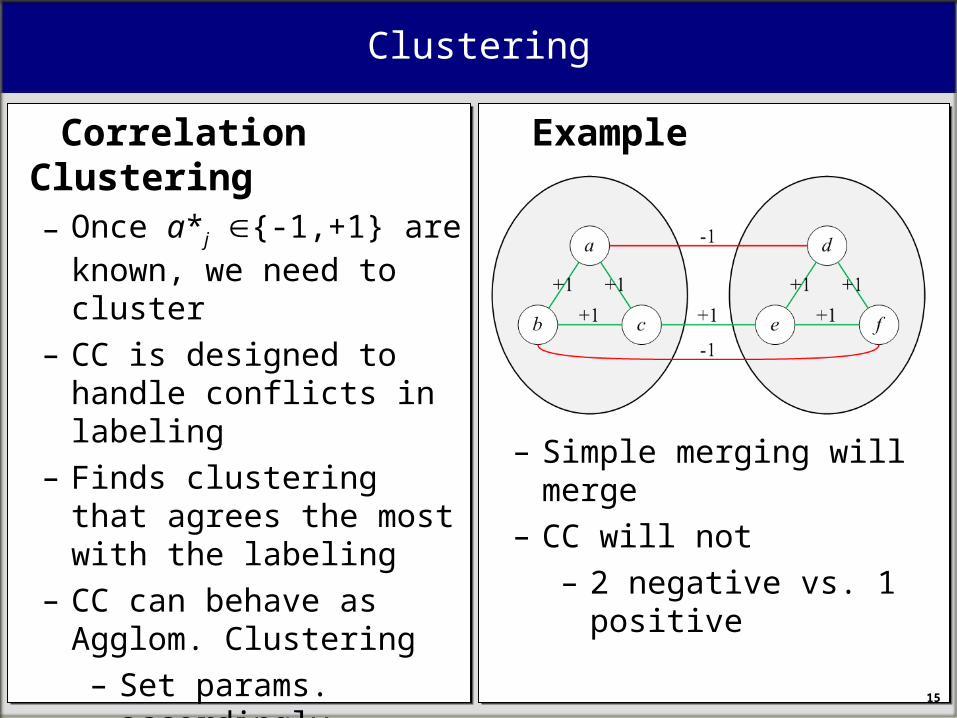
– Simple merging will merge– CC will not
– 2 negative vs. 1 positive
Correlation Clustering – Once a*j {-1,+1} are
known, we need to cluster– CC is designed to handle
conflicts in labeling– Finds clustering that agrees
the most with the labeling– CC can behave as Agglom.
Clustering– Set params. accordingly– More generic scheme
Experimental Setup
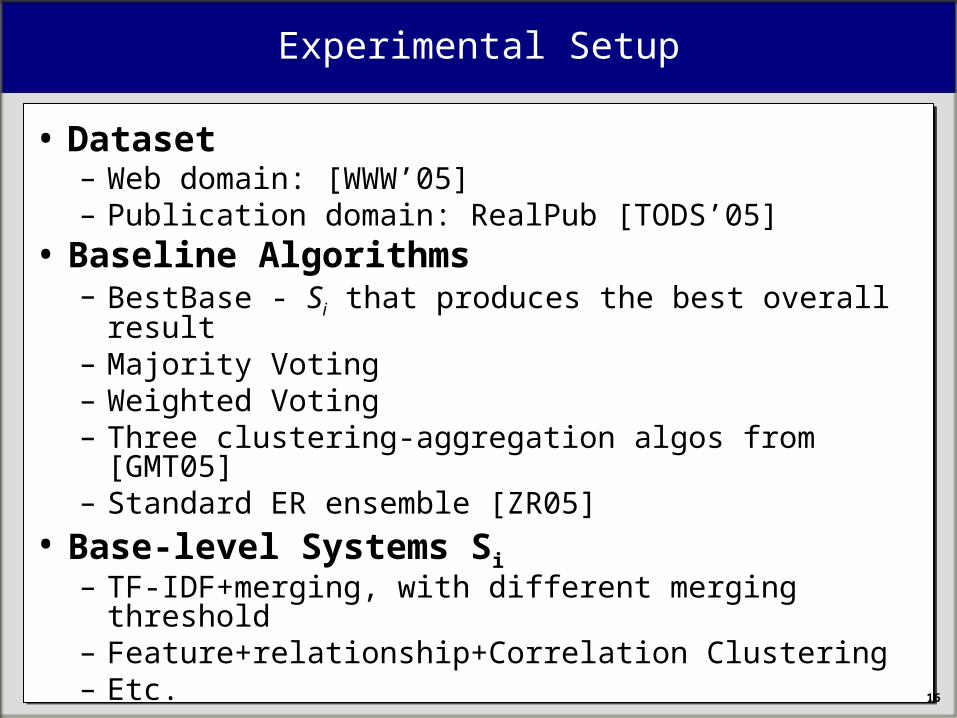
• Dataset– Web domain: [WWW’05]– Publication domain: RealPub [TODS’05]
• Baseline Algorithms– BestBase - Si that produces the best overall result– Majority Voting– Weighted Voting– Three clustering-aggregation algos from [GMT05]– Standard ER ensemble [ZR05]
• Base-level Systems Si– TF-IDF+merging, with different merging threshold– Feature+relationship+Correlation Clustering– Etc.
16
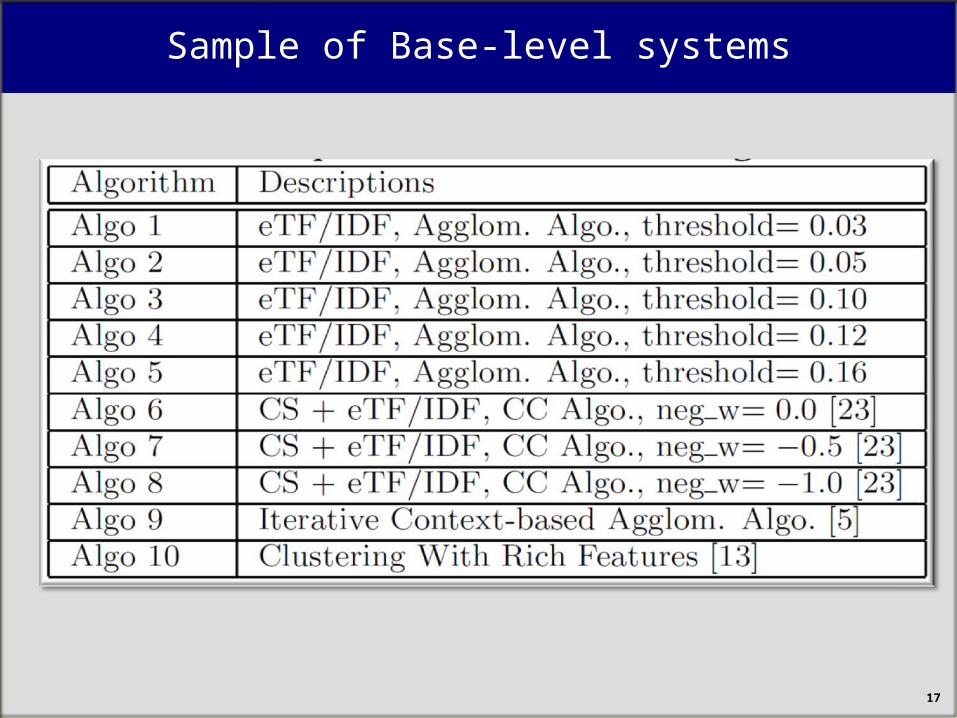
Sample of Base-level systems
17
Experiment 1: “Sanity Check”
• Introduce one “perfect” base-level system that always gets perfect results– Does not exist in practice– Utilizes the ground truth (unknown, of course)
• As expected, the algorithms were able to learn to use that “perfect” system, and to ignore the results of other base-level systems
18
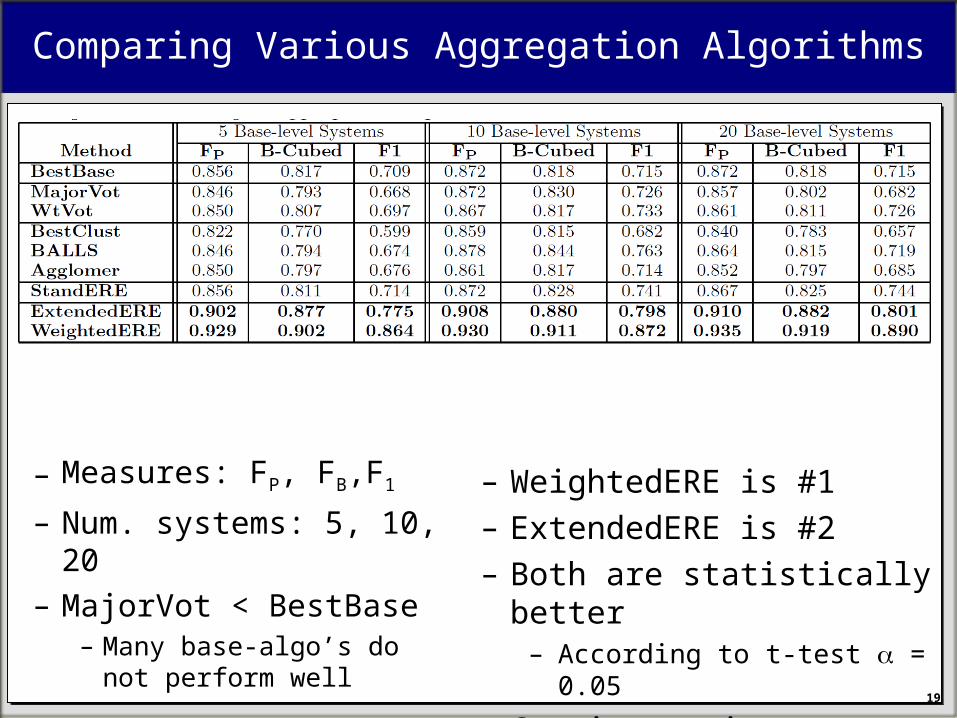
Comparing Various Aggregation Algorithms
– Measures: FP, FB,F1
– Num. systems: 5, 10, 20– MajorVot < BestBase
– Many base-algo’s do not perform well
19
– WeightedERE is #1– ExtendedERE is #2 – Both are statistically better
– According to t-test = 0.05
– Consistent improvement– 5 → 10 → 20
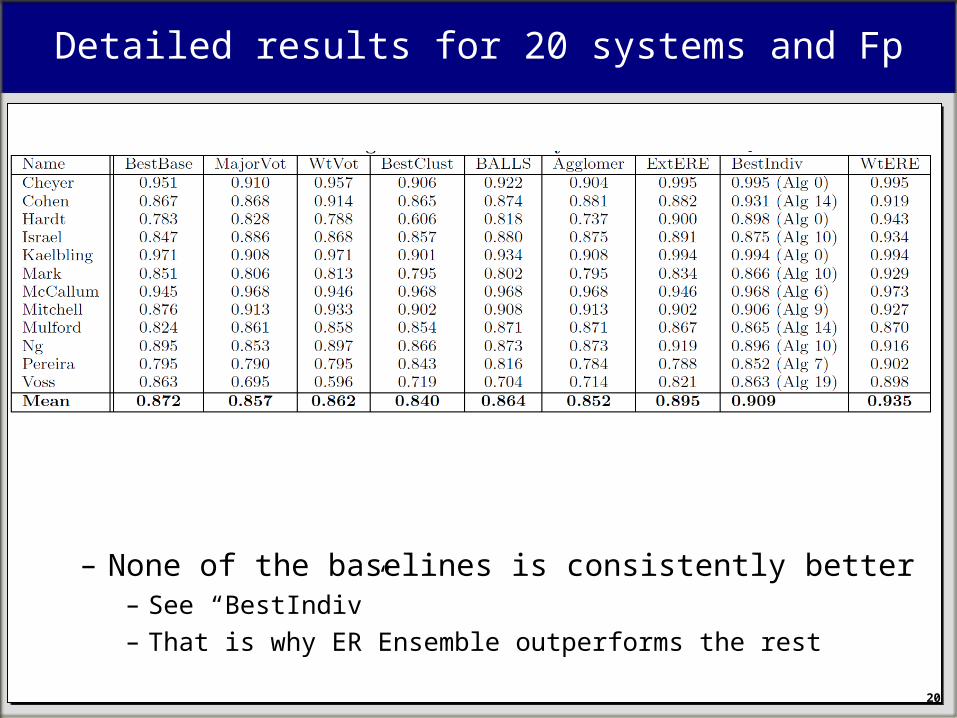
Detailed results for 20 systems and Fp
– None of the baselines is consistently better– See “BestIndiv”– That is why ER Ensemble outperforms the rest
20
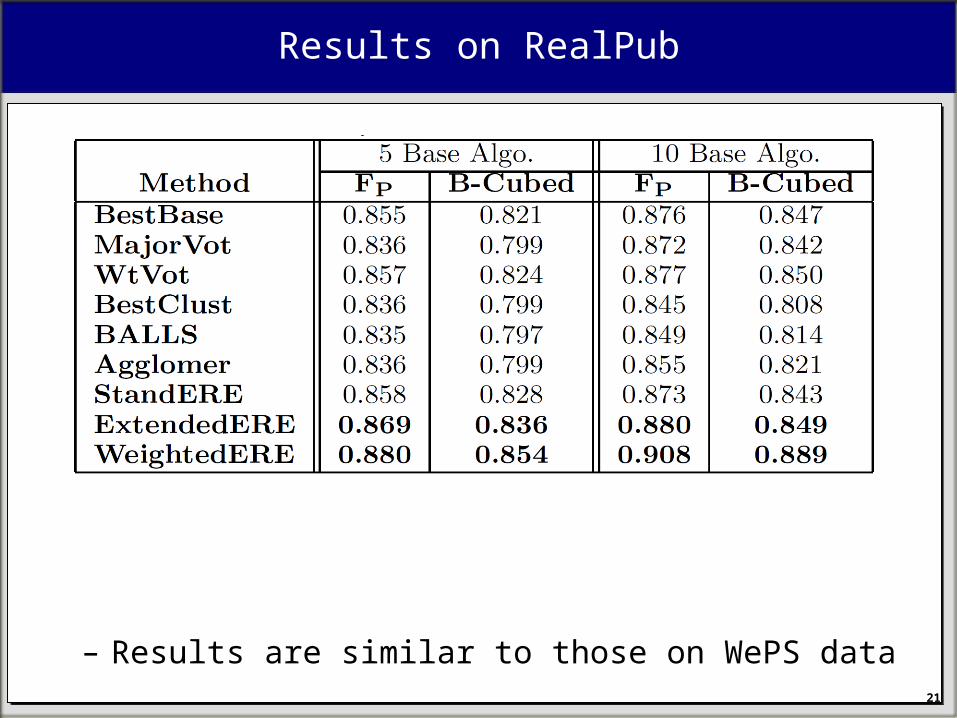
Results on RealPub
– Results are similar to those on WePS data
21
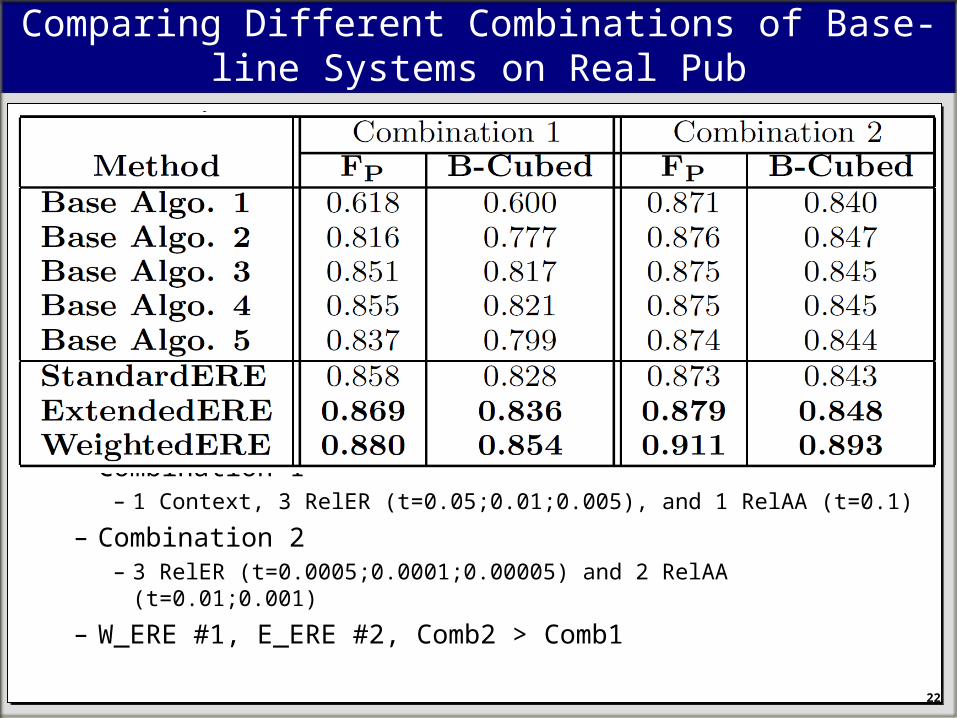
Comparing Different Combinations of Base-line Systems on Real Pub
– Combination 1– 1 Context, 3 RelER (t=0.05;0.01;0.005), and 1 RelAA (t=0.1)
– Combination 2– 3 RelER (t=0.0005;0.0001;0.00005) and 2 RelAA (t=0.01;0.001)
– W_ERE #1, E_ERE #2, Comb2 > Comb122
23
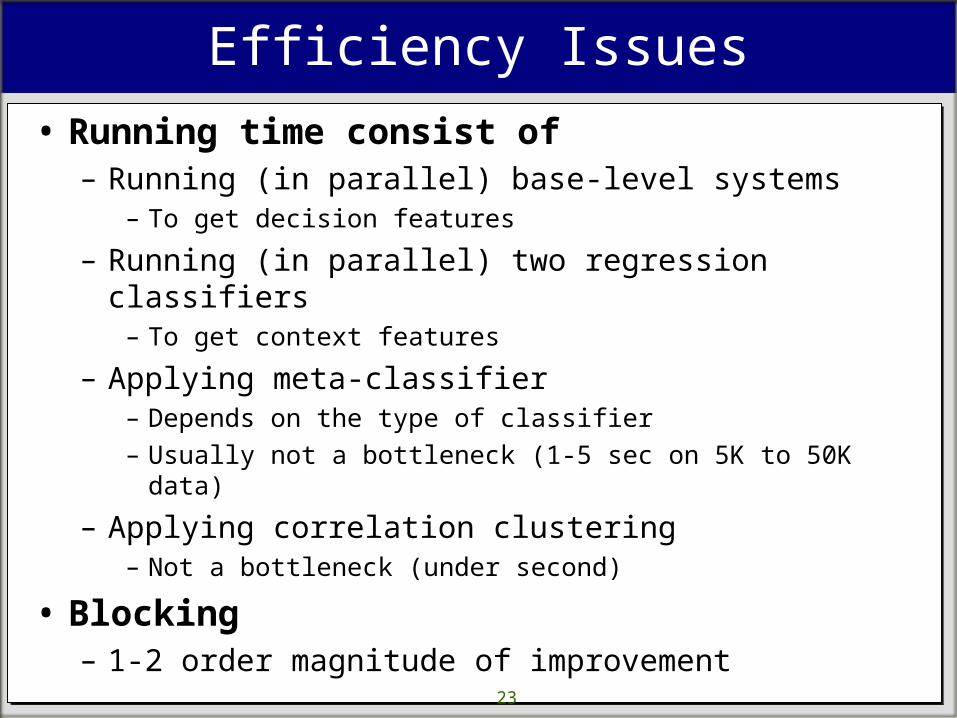
Efficiency Issues
• Running time consist of– Running (in parallel) base-level systems
– To get decision features
– Running (in parallel) two regression classifiers – To get context features
– Applying meta-classifier– Depends on the type of classifier– Usually not a bottleneck (1-5 sec on 5K to 50K data)
– Applying correlation clustering– Not a bottleneck (under second)
• Blocking– 1-2 order magnitude of improvement
Future Work
24
• Efficiency– How to determine which base-level systems to run
– And on which parts of data– Trade efficiency for quality
• Features– Look into more feature types– Improve the quality of predictions
– Apply framework iteratively
24
Questions?
Dmitri V. Kalashnikov
www.ics.uci.edu/~dvk
25
Stella Chen Sharad Mehrotra
www.ics.uci.edu/~sharad
GDF Projectwww.ics.uci.edu/~dvk/GDF