explicit and implicit processes in behavioural adaptation to … & charlton 2006 - explicit...
TRANSCRIPT
Explicit and implicit processes in behavioural adaptation to road width
Ben Lewis-Evans & Samuel G. Charlton* Traff ic & Road Safety Research Group, Depar tment of Psychology, University of Waikato,
Hamilton, New Zealand
*Corresponding author. Tel.: +64 7 856 2889x6534; fax: +64 7 858 5132.E-mail address: [email protected]
Previouisly published as Lewis-Evans, B. & Charlton, S.G. (2006). Explicit and implicit processes in behavioural adaptation to road width. Accident Analysis and Prevention, 38, 610-617 that can be accessed at:
http://dx.doi.org/10.1016/j.aap.2005.12.005
Authors archived copy
2
Explicit and implicit processes in behavioural adaptation to road width
Abstract
The f inding that drivers may react to safety interventions in a way that is contrary to what was intended is the phenomenon of behavioural adaptation. This phenomenon has been demonstrated across various safety interventions and has serious implications for road safety programs the world over. The present research used a driving simulator to assess behavioural adaptation in drivers’ speed and lateral displacement in response to manipulations of road width. Of interest was whether behavioural adaptation would occur and whether we could determine whether it was the result of explicit, conscious decisions or implicit perceptual processes. The results suppor ted an implicit, zero perceived risk model of behavioural adaptation with reduced speeds on a narrowed road accompanied by increased ratings of risk and a marked inability of the par ticipants to identify that any change in road width had occurred.
1. Introduction
In the context of driving, the term behavioural adaptation has been used to refer to changes in behaviour resulting from a road safety intervention that are often contrary to the intended aim of the intervention or where safety gains in one road user group are offset by safety losses in another (Ward, 2000;Wilde, 1988).Acommonly cited example is the f inding that when roads have been widened in order to increase their safety drivers’ speeds often increase as a result, with the net effect of negating any overall increase in safety. Behavioural adaptation has also been referred to as risk compensation and hypothesised to result from drivers’ perceptions of situational risk and their responses to reductions in that risk (Assum et al., 1999; Steizer and Hoffmann, 1996; Wilde, 1982). Other authors have argued for use of the term behavioural change instead of risk compensation or behavioural adaptation in recognition of f indings that changes in driver behaviour may not always be compensatory and that risk perception may not be the underlying phenomenon effecting those changes (McKenna, 1987).
Terminology aside, there is considerable evidence suppor ting the idea that a range of safety measures can produce behavioural adaptation. For example, Sagberg et al. (1997) under took on-road observations of 213 taxis in Oslo and found that those equipped with anti-lock braking systems had signif icantly shor ter headway times of 2.2 s versus the 2.8 s headways of those without anti-lock brakes. In a before and after quasiexperiment, Assum et al. (1999) found that drivers’ speeds increased signif icantly by 3.6 km/h after road lighting was introduced, and were 5% higher than a control section of highway. Garbacz (1991) looked at
3
Explicit and implicit processes in behavioural adaptation to road width
accident data in New Zealand between 1960 and 1985 with the introduction of compulsory seatbelt laws occurring between 1972 and 1979. He found that the safety gains for occupants of cars during this period (represented by lower fatalities) were completely offset by increases in fatalities for vulnerable road users outside of the cars, i.e., cyclists and pedestrians.
It is a well-documented f inding that as lane width and road width increase, drivers’ speeds also increase (Godley, 1999; de Waard et al., 2004) and their lane positions move closer to the road edge (van Driel et al., 2004; Smiley, 2003). These behavioural changes do potentially negate any safety gain produced by wider roads, but perhaps the more interesting question concerns the psychological processes responsible for the behavioural compensation (Trimpop, 1996). One well-known account of behavioural adaptation, Risk Homeostasis Theory (RHT), proposes that drivers possess an internal, target level of risk and they will increase or decrease their safety of action in order to reduce the difference between their momentary perceived level of situational risk and their target level (Wilde, 1982, 1988). In the case of road width, wider roads are presumed to decrease perceived risk, and therefore drivers will increase their risky behaviour, by speeding for example, in order to bring their perceived momentary risk in line with their target level of risk (Wilde, 1988).
Other researchers have taken issue with RHT noting that, as a theoretical account, it has not readily generated quantif iable predictions, and that there has been an over-reliance on aggregated archival data in its development (Dulisse, 1997; Evans, 1986; Hoyes and Glendon, 1993; Hoyes et al., 1996a; McKenna, 1990; Summala, 1996; Trimpop, 1996). An alternative interpretation of behavioural adaptation has been called Zero-Risk Theory (Summala, 1988). This approach suggests that the subjective risk of driving is typically zero in most circumstances, although specif ic events may serve to exceed a driver’s threshold or safety margin and result in a shift in the driver’s risk-related behaviour (Summala, 1996). Habituation to potential risks and a hierarchical structure of risk-taking thus replace the continuous risk perceptions and comparisons implied by most accounts of RHT.
Other accounts of behavioural adaptation have taken the form of economic models of driving intensity (Peltzman, 1975), utility maximisation (Hoyes et al., 1996b; Janssen and Tenkink, 1988), and sensation seeking (Jonah et al., 2001; Zuckerman, 1994). In the latter case, it is levels of general arousal that are being affected by risk-taking activities such as speed and over taking, rather than any specif ic homeostatic mechanism involving target and perceived levels of risk. Still other accounts, specif ic to the behavioural adaptation associated with changes in lane width, propose that narrow roads produce a heightened sense of speed by means of an increase in edge rate information in the peripheral visual f ield of drivers
4
Explicit and implicit processes in behavioural adaptation to road width
(Denton, 1980; Godley, 1999). Thus, widening a road has the effect of lowering a driver’s perceived speed at a preconscious or implicit perceptual level and a tendency to increase their objective speed as a result.
The purpose of the present research was to contrast the various accounts of behavioural adaptation in the context of a laboratory experiment manipulating the lane width of simulated roads. If motivational theories of behavioural adaptation (e.g., RHT and Zero-Risk) are correct, drivers’ ratings of perceived risk should be negatively correlated with lane width for drivers displaying behavioural adaptation. Although these theories differ in regard to the mechanisms responsible, both rely on the driver’s ability to discriminate differential levels of risk associated with roads of different width. Economic theories based on drivers’ judgements of subjective utility predict that any behavioural adaptation would be ref lected in drivers’ ratings of road preferences, independently of any changes in ratings of perceived risk. In contrast, accounts based solely on implicit perceptions of speed might reasonably predict that behavioural adaptation can occur without any concomitant changes in road preference or perceived risk. In fact drivers themselves may be unaware of their changes in speed, inasmuch as speed perception operates at a preconscious level.
Other indicators that can be used to differentiate the various accounts of behavioural adaptation are drivers’ explicit judgements of perceived risk, perceived utility, or their objective speed associated with roads of different width. Thus, in addition to the performance measures of speed and lateral displacement, the present experiment collected a range of subjective measures to gauge whether drivers were explicitly aware of changes in road width and whether this had an effect on their perceptions of risk, safety, driving diff iculty, or speed.
Behavioural adaptation has obvious implications for road safety inasmuch as the nature of the phenomenon is to reduce the intended effect of many road safety interventions as well as having impor tant consequences for many incidental alterations to the road environment (e.g., changes in roadside development). The understanding of the processes involved in behavioural adaptation, i.e., whether it is based on drivers’ explicit consideration and decisions regarding risk or whether it results from implicit processing of visual cues, will inform any attempts to mitigate behavioural adaptation as a problem. For example, evidence for an explicit decision-making process would suggest that public education campaigns might be effective. If, however, the cognitive pathway for behavioural adaptation is an implicit phenomenon, implicit means based on perceptual countermeasures may be best suited to counter it.
5
Explicit and implicit processes in behavioural adaptation to road width
2. Method
2.1 Participants
For ty-nine par ticipants with an unrestricted drivers licence, 25 men and 24 women, took par t in the experiment. The par ticipant’s ages ranged between 18 and 53 years with an average age of 23.78 and a standard deviation of 8.34.
2.2. Driving simulator
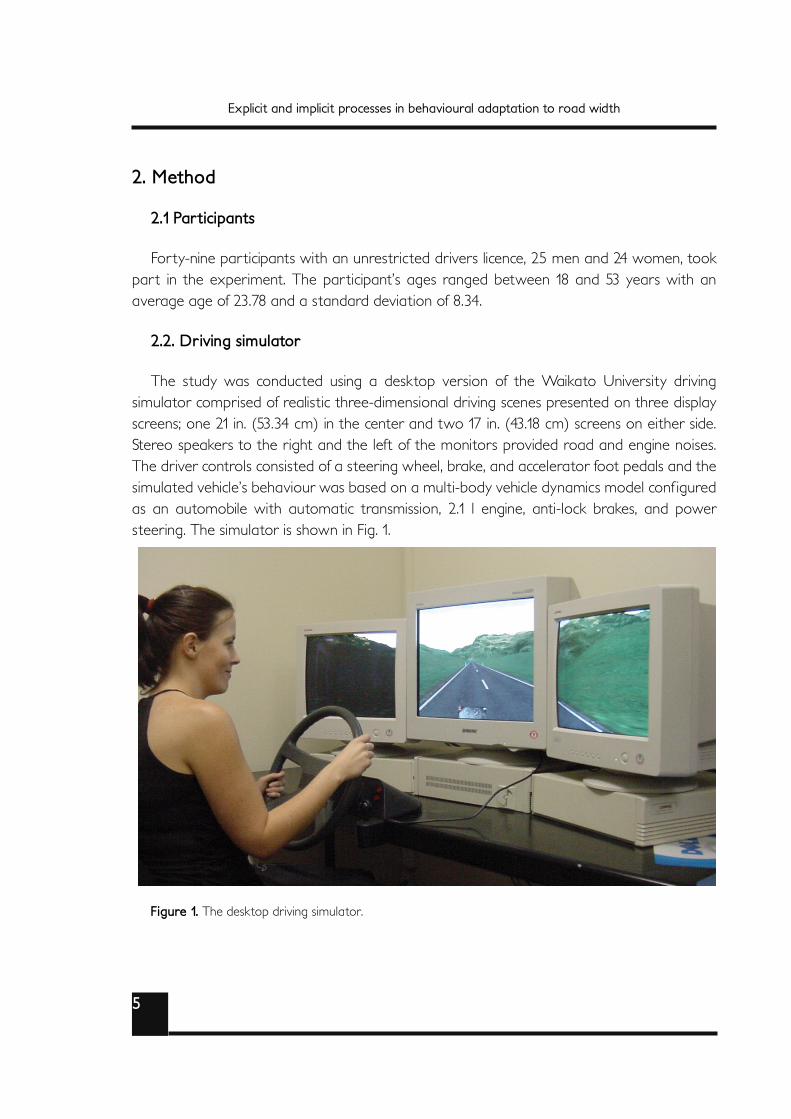
The study was conducted using a desktop version of the Waikato University driving simulator comprised of realistic three-dimensional driving scenes presented on three display screens; one 21 in. (53.34 cm) in the center and two 17 in. (43.18 cm) screens on either side. Stereo speakers to the right and the left of the monitors provided road and engine noises. The driver controls consisted of a steering wheel, brake, and accelerator foot pedals and the simulated vehicle’s behaviour was based on a multi-body vehicle dynamics model conf igured as an automobile with automatic transmission, 2.1 l engine, anti-lock brakes, and power steering. The simulator is shown in Fig. 1.
Figure 1. The desktop driving simulator.
6
Explicit and implicit processes in behavioural adaptation to road width
2.3. Simulated roads
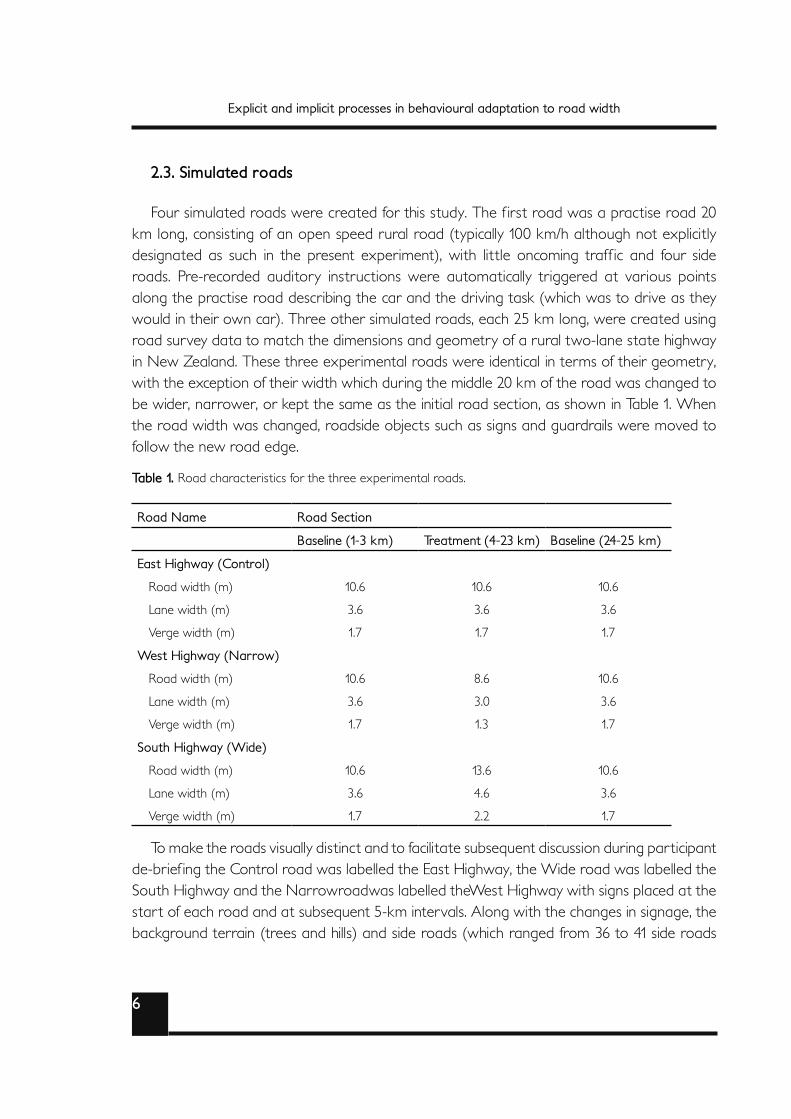
Four simulated roads were created for this study. The f irst road was a practise road 20 km long, consisting of an open speed rural road (typically 100 km/h although not explicitly designated as such in the present experiment), with little oncoming traff ic and four side roads. Pre-recorded auditory instructions were automatically triggered at various points along the practise road describing the car and the driving task (which was to drive as they would in their own car). Three other simulated roads, each 25 km long, were created using road survey data to match the dimensions and geometry of a rural two-lane state highway in New Zealand. These three experimental roads were identical in terms of their geometry, with the exception of their width which during the middle 20 km of the road was changed to be wider, narrower, or kept the same as the initial road section, as shown in Table 1. When the road width was changed, roadside objects such as signs and guardrails were moved to follow the new road edge.
To make the roads visually distinct and to facilitate subsequent discussion during par ticipant de-brief ing the Control road was labelled the East Highway, the Wide road was labelled the South Highway and the Narrowroadwas labelled theWest Highway with signs placed at the star t of each road and at subsequent 5-km intervals. Along with the changes in signage, the background terrain (trees and hills) and side roads (which ranged from 36 to 41 side roads
Table 1. Road characteristics for the three experimental roads.
Road Name Road Section
Baseline (1-3 km) Treatment (4-23 km) Baseline (24-25 km)
East Highway (Control)
Road width (m) 10.6 10.6 10.6
Lane width (m) 3.6 3.6 3.6
Verge width (m) 1.7 1.7 1.7
West Highway (Narrow)
Road width (m) 10.6 8.6 10.6
Lane width (m) 3.6 3.0 3.6
Verge width (m) 1.7 1.3 1.7
South Highway (Wide)
Road width (m) 10.6 13.6 10.6
Lane width (m) 3.6 4.6 3.6
Verge width (m) 1.7 2.2 1.7
7
Explicit and implicit processes in behavioural adaptation to road width
along the 25 km length) were varied to make the roads look different from each other (see Fig. 2 ) and minimise any familiarity effects on behavioural adaptation (Kanellaidis et al., 2000). All of the roads had a representative density of on-coming traff ic (equivalent to 10,000 vehicles per day) although no heading traff ic was included to avoid inf luencing the par ticipants’ speed and lateral positioning.
Par ticipants’ speed and lateral displacement were continuously recorded through four road sections: Section 1, the last 2 km of baseline and the f irst 2 kmof treatment widths (a straight and level section of road); Section 2, 8–12 km (level with a few gentle curves); Section 3, 14–18 km (a hilly section with many curves); Section 4, the last 2 kmof treatment and the 2 kmreturn to baseline width (a slight downhill gradient with a few curves).
2.4. Procedure
Par ticipants were instructed that the purpose of the study was to f ind out more about attitudes and driving habits of road users in New Zealand. They were then asked to complete a shor t questionnaire containing several demographic questions (i.e., age, gender, driving experience). After completing the questionnaire, the par ticipants were allowed to familiarise themselves with the driving simulator using the 20 km practise track and then randomly assigned to one of three counterbalanced presentation orders for the experimental roads. After driving each simulated road each driver was offered a 5-min break to stretch or rest if desired. The simulated driving por tion of the experiment took an average of 1 h and 20 min for par ticipants to complete.
Following completion of the driving simulation, par ticipants were asked to place three unlabelled colour images of road scenes (20 cm×29 cm), one from each simulated road, in an order that made sense to them. The par ticipants were then presented with a four th image of an Intermediate road with lanes 0.5m wider than the Control road (see Fig. 2), and asked to place this image somewhere in their ordering of the three other images. The par ticipants were then asked why they placed the initial three images in the order they did, and also why they placed the four th image where they did. The ordering procedure was intended as a measure of whether par ticipants were able to implicitly or explicitly order the road images in order of risk, road width or some other feature. This was followed by a 12- item questionnaire asking the par ticipants about the appropriate speed for each of the road images, various aspects of the three simulated roads they had driven (the driving diff iculty, the likelihood of an accident, driving conf idence, safety, road preference, risk, and road width), and a f inal question about the relative risk associated with the four static road images. The items in the questionnaire were ordered to ensure that considerations of risk and width were placed last

8
Explicit and implicit processes in behavioural adaptation to road width
so as to minimise the potential for bias from carry-over effects.
Figure 2. Pictures of the three experimental roads and the four th intermediate image used in the static
image task.
3. Results
3.1. Speed
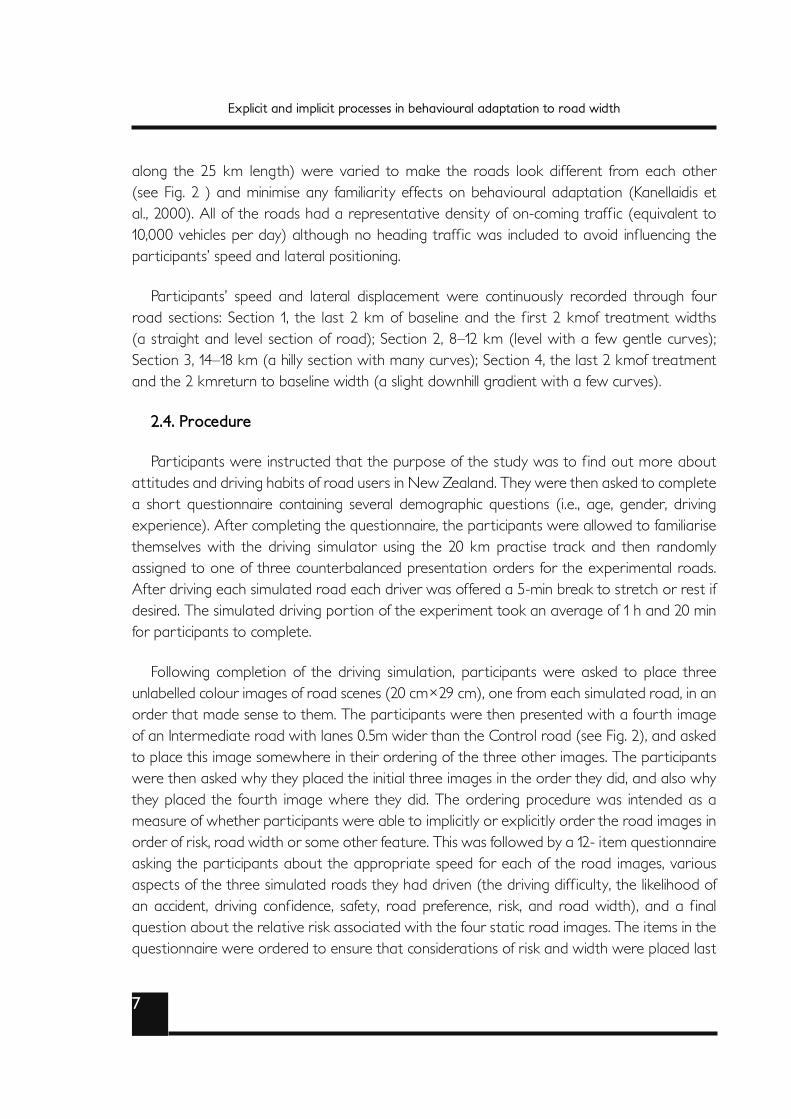
Fig. 3 shows the par ticipants’ speeds across each section of the three simulated roads. Although the various road sections produced different speeds, the relationship between road width and speeds remained uniform, the Narrow road produced the lowest speeds and the Wide road produced the highest speeds. A within-subjects analysis of variance computed on the effects of road width and road section during the f irst half of Section 1 and the second half
9
Explicit and implicit processes in behavioural adaptation to road width
of Section 4 (the initial and f inal baseline sections) indicated a signif icant road section effect (F(1, 48) = 10.863, p < 0.01) but no road width effect (F(2, 47) = 1.292, p > 0.10) or interaction between section and width (F(2, 47) = 0.285, p > 0.10), indicating that while par ticipants drove slower at the end of the road than they did at the beginning, the three simulated roads did not by themselves produce any differential speeds during the baseline sections (when road widths were the same). For the other road sections, the analysis of variance indicated a signif icant effect of road width (F(2, 47) = 11.501, p < 0.001) and a signif icant effect of road section (F(3, 46) = 20.710, p < 0.001), but no width by section interaction (F(6, 43) = 0.828, p > 0.10).
Figure 3. Par ticipants’ average speeds for each road section.
Post hoc pair-wise comparisons using the Bonferroni adjustment for multiple comparisons indicated that speeds on the Narrow road were signif icantly lower than on the Control and Wide roads (p < 0.01) but that speeds on the Wide road were only marginally higher than
10
Explicit and implicit processes in behavioural adaptation to road width
the Control speeds (p < 0.067). The post hoc analysis also indicated that par ticipants’ speeds were highest during the initial por tion of the roads (p < 0.001), lowest during the hilly and windy Section 3 (p < 0.001), but did not differ for Sections 2 and 4 (p > 0.10).
3.2. Lateral displacement
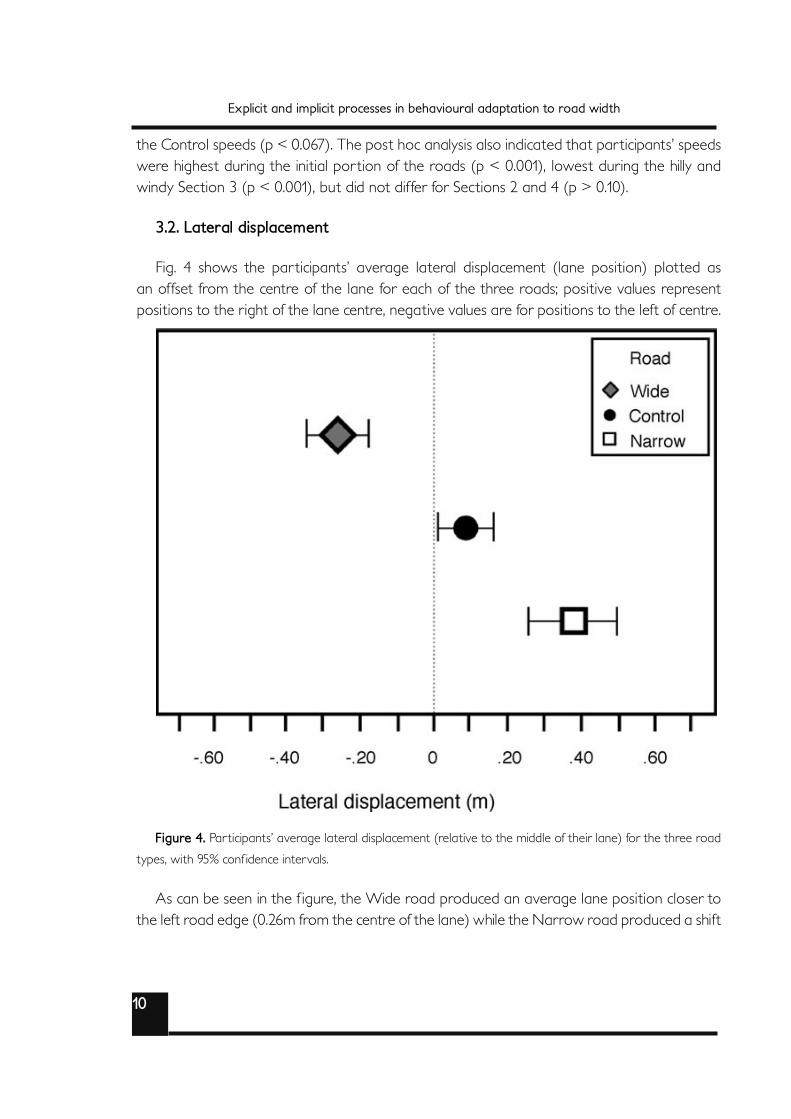
Fig. 4 shows the par ticipants’ average lateral displacement (lane position) plotted as an offset from the centre of the lane for each of the three roads; positive values represent positions to the right of the lane centre, negative values are for positions to the left of centre.
Figure 4. Par ticipants’ average lateral displacement (relative to the middle of their lane) for the three road
types, with 95% conf idence intervals.
As can be seen in the f igure, the Wide road produced an average lane position closer to the left road edge (0.26m from the centre of the lane) while the Narrow road produced a shift
11
Explicit and implicit processes in behavioural adaptation to road width
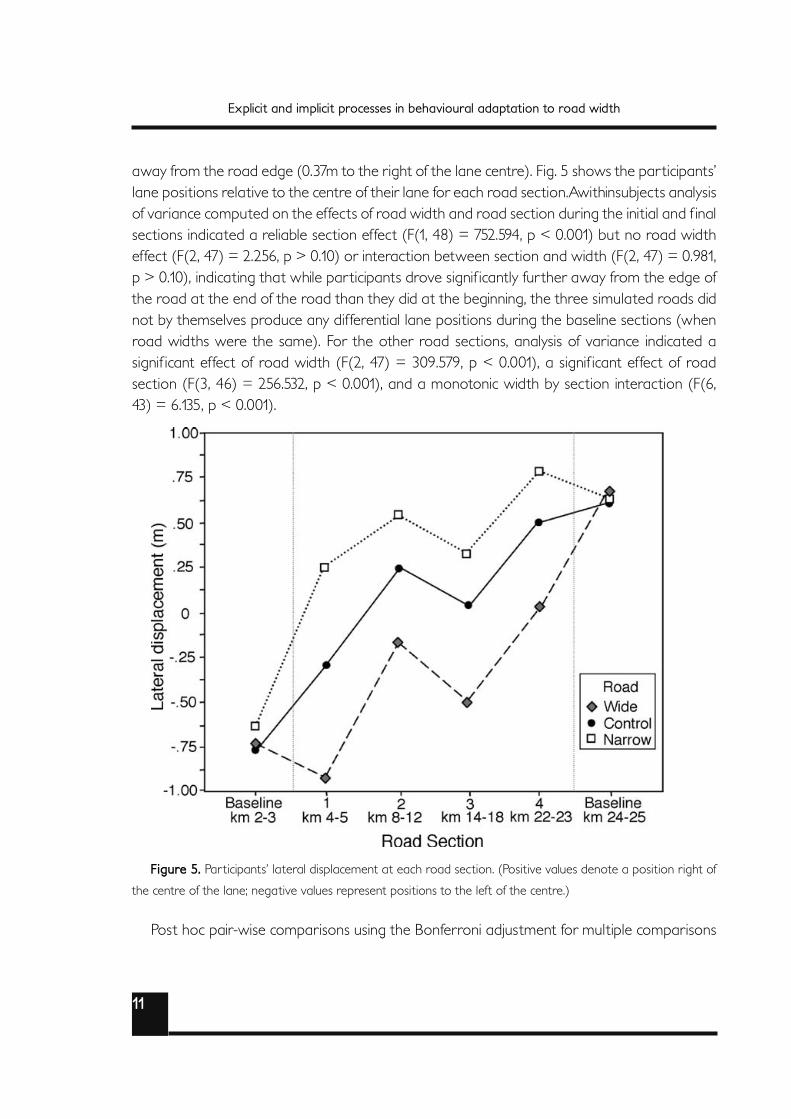
away from the road edge (0.37m to the right of the lane centre). Fig. 5 shows the par ticipants’ lane positions relative to the centre of their lane for each road section.Awithinsubjects analysis of variance computed on the effects of road width and road section during the initial and f inal sections indicated a reliable section effect (F(1, 48) = 752.594, p < 0.001) but no road width effect (F(2, 47) = 2.256, p > 0.10) or interaction between section and width (F(2, 47) = 0.981, p > 0.10), indicating that while par ticipants drove signif icantly fur ther away from the edge of the road at the end of the road than they did at the beginning, the three simulated roads did not by themselves produce any differential lane positions during the baseline sections (when road widths were the same). For the other road sections, analysis of variance indicated a signif icant effect of road width (F(2, 47) = 309.579, p < 0.001), a signif icant effect of road section (F(3, 46) = 256.532, p < 0.001), and a monotonic width by section interaction (F(6, 43) = 6.135, p < 0.001).
Figure 5. Par ticipants’ lateral displacement at each road section. (Positive values denote a position right of
the centre of the lane; negative values represent positions to the left of the centre.)
Post hoc pair-wise comparisons using the Bonferroni adjustment for multiple comparisons
12
Explicit and implicit processes in behavioural adaptation to road width
indicated that each of the road widths produced signif icantly different lane positions, as did each of the road sections (p < 0.01). Over the course of the 25 km drive the par ticipants gradually shifted their lane positions to the right, but as with the speed data, the relationship between road width and lateral displacement remained uniform, the Wide road resulted in lane positions closer to the road edge and the Narrow road produced lane positions closer to the centre of the road.
3.3. Ordering task
During the ordering task, 12 out of the 49 (24.5%) par ticipants placed the images in an order indicative of road width (i.e., either Narrow–Control–Wide or Wide–Control–Narrow). When par ticipants included the four th image (Intermediate road width) in the ordering the number of correct placements (corresponding to road width) was halved to only 6 out of 49. Two par ticipants indicated that they were unable or unwilling to create any ordering of the images. In response to the question of what method or rule they used to order the images, none of the par ticipants indicated that they used road width. The most common type of answer could be characterised as a form of sequential ordering or road building; e.g., “it star ts here, then goes here” and used road features or landmarks in their explanation (30 par ticipants, 7 of them with “correct” widthappropriate orderings). Five of the par ticipants (two of which were for correct orderings) indicated that they arranged the images according to the order they believed they had driven them. Four of the par ticipants (including one correct ordering) included some preferred aspect of road geometry in their explanation; e.g., “I like the drive straights more than making left bend turns”. The remaining par ticipants (including two correct orderings) could not ar ticulate a method used for their orderings; e.g., “don’t know” or “that’s just how it goes”. The par ticipants’ explanations for their second ordering, the inclusion of the intermediate image, produced a similar pattern of responses: 30 used sequential ordering; 4 said they used the order they had driven the roads; 3 mentioned a preference for straight roads; 10 could not identify a specif ic reason (2 par ticipants did not order the roads).
3.4. Ratings of speed, diff iculty, road width, and risk
When asked what speed they would feel comfor table driving the roads shown in the four images the par ticipants provided the lowest speeds for the image of the Narrow road (average of 94.45 km/h), the highest speeds for the Control road (102.90 km/h), with the Wide and Intermediate road images in the middle (99.29 and 98.94 km/h, respectively). A one-way within-subjects analysis of variance indicated a signif icant difference between the speed ratings (F(3, 46) = 16.844, p < 0.001) and post hoc comparisons conf irmed that the
13
Explicit and implicit processes in behavioural adaptation to road width
speeds for the Narrow image were rated as signif icantly lower than on all other roads (p < 0.01) and the Control image speeds signif icantly higher than the other roads(p < 0.01), but that the Wide and Intermediate images did not differ signif icantly (p > 0.10).
A later question asked par ticipants to rate the relative risk associated with each of the four roads on a 10-point scale ranging from “least risky” (1) to “most risky” (10). The par ticipants’ ratings were highest for the Narrow road image (average of 4.88) and lowest for the Control road image (average of 3.10), with the Wide and Intermediate images in the middle (4.16 and 4.18, respectively). A within-subjects analysis of variance indi cated a signif icant difference in risk ratings (F(3, 46) = 16.438, p < 0.001), with the Control image producing risk ratings lower than any other image (p < 0.01) and the Narrowimage producing a risk rating that was higher than the Control image (p < 0.001) but not higher than the Wide or Intermediate images (p > 0.10). The speed and risk ratings for the images were negatively correlated with a Spearman’s rho of −0.388 (p < 0.001) indicating that high speed ratings were related to low risk ratings.
Seven questions asked the par ticipants to rate various aspects of their experiences driving the three simulated roads (rather than the four static images). For these questions Friedman’s nonparametric tests were calculated that indicated that the West Highway (Narrow road) was rated as signif icantly more diff icult, more likely to produce accidents, and more risky than the East or South Highways (Control and Wide roads) (Chisquares ≥ 9.784, n = 49, ps < 0.01). When asked which road they “would be least likely to drive on” 44.9% of the par ticipants indicated they had no preference. When asked which road they would prefer to drive if they “were under time pressure” 19 par ticipants (38.8%) indicated a preference for the South Highway (Wide road), 17 (34.7%) had no preference, 7 selected the Control road, 4 selected the Narrow road, and 2 could not choose between Control road and the Wide road. When asked the reasons for their preferences, only four of the par ticipants mentioned safety or risk and three mentioned driving diff iculty or road width. A f inal open-ended question asked par ticipants to name any differences they could between the three roads they had driven. A range of answers were provided, including 10 (20.4%) par ticipants who included some aspect of road width in their answers and 8 par ticipants who said they could not detect any differences.
A stepwise multiple regression analysis was calculated to identify the subjective road features that best predicted the par ticipants’ speeds on the simulated roads. The analysis indicated an optimal model was comprised of ratings of conf idence, risk, and likelihood of having an accident (adjusted R2 = 0.115, F(3, 143) = 7.305, p < 0.001), with the single best
14
Explicit and implicit processes in behavioural adaptation to road width
predictor being par ticipants’ conf idence ratings (adjusted R2 = 0.094, F(1, 145) = 16.220, p < 0.001). A second regression analysis calculated to identify the factors most closely related to the par ticipants’ risk ratings indicated that ratings of road width, diff iculty, and accident likelihood were the best predictors (adjusted R2 = 0.488, F(3, 143) = 47.383, p < 0.001). Par ticipant gender had no signif icant effect on overall risk ratings (F(1, 47) = 0.307, p > 0.05), but there was a signif icant negative correlation between par ticipants’ ages and risk ratings (r =−0.250, p < 0.01).
4. Discussion
The results indicated signif icant effects of road width on par ticipants’ speeds and lane positions, such that narrowroads were associated with lower speeds and lane positions fur ther away from the road edge while wider roads had higher speeds and lane positions closer to the road edge. These changes were comparable to previously repor ted effects of road width (van Driel et al., 2004; Godley, 1999; Smiley, 2003; de Waard et al., 2004) and, in effect, provide a demonstration of the phenomenon known as behavioural adaptation.
Of considerable interest was the f inding that, when asked, most par ticipants described the amount of traff ic, the number and severity of curves, and amount of signage and road delineation as the differences between the three simulated roads (none of which differed for the three roads). Although the par ticipants did rate the three simulated roads differentially with regard to subjective risk, and their risk ratings were correlated with their driving speeds, risk appeared to be a subjective reaction that arose from their implicit experience of the road environment, rather than an explicit factor motivating conscious decisions about appropriate speeds. Similarly, when asked to order the static road images, the par ticipants did not rank the static images in a way that signif ied any explicit awareness of differences in either risk or road width. Taken together, these results strongly suggest that behavioural adaptation does not rely on explicit consideration of objective risk.
In considering the various theoretical interpretations of behavioural adaptation, an impor tant implication of the Zero-Risk account of behavioural adaptation (Summala, 1988) is that drivers’ perceptions of risk are essentially nil, or preconscious, most of the time. Risk perceptions will be revised upwards (more risky) only when events or circumstances exceed a driver’s threshold or safety margin and then result in a reduction in the driver’s speed. Reductions in objective risk, however, are predicted to be less likely to cross a drivers’ subjective threshold and produce an increase in speeds. In the present experiment, the asymmetric pattern of speed adaptation produced by changes in road (the narrow road decreased
15
Explicit and implicit processes in behavioural adaptation to road width
speeds but the wide road did not reliably increase speeds relative to the control width) would appear suppor t this prediction. A parallel asymmetry existed for the par ticipants’ ratings; the Narrow road was perceived as more diff icult, riskier, and more likely to produce accidents, but the Wide road was not perceived as better than the Control road. These f indings suppor t Summala’s (1988) prediction that changes that decreases in accident risk will not be readily detected by road users, and may help explain why there are often wide discrepancies between the objective risks of driving and the subjective risk experiences of drivers (Watts and Quimby, 1980).
In contrast, accounts which rely on a driver’s ability to accurately and consciously revise safety and risk judgements upwards and downwards in response to changes in road characteristics (e.g., Graham, 1982; Peltzman, 1975; Wilde, 1988), would appear to have diff iculty reconciling the asymmetric speed changes and inability to identify changes in road width. Interpretations based on sensation seeking and speed perception are compatible with the implicit and preconscious aspects ofthe behavioural adaptation produced in the present experiment, but would appear to have diff iculty accounting for the asymmetries of speed change. One possible interpretation is that the Control road was already producing speeds near the standard open road speed limit of 100 km/h, and thus the asymmetry in speeds was indicative of a ceiling effect. One would need to make the fur ther assumption, however, that the implicit perceptual phenomena associated with sensation seeking and speed perception were subject to a conscious limitation on the maximum allowable speed. It could be that larger changes in road width would have eliminated the asymmetry or increased the par ticipants’ explicit awareness of the changes. Unfor tunately, the present experiment did not allow these interpretations to be tested adequately. Future research might manipulate speed limits systematically or include an even greater range of road widths to assess these questions.
It must be noted that the use of a driving simulator to assess risk perception and behavioural adaptation does have potentially signif icant drawbacks inasmuch as the consequences of a simulated crash cannot be equated to that of a real crash (Glendon et al., 1996). Previous researchers have noted that the ar tif iciality of laboratory procedures generally, and simulations specif ically, must be taken into account when generalising the results from such procedures to real-life situations (Gawron et al., 2002). There is, however, an emerging consensus that in order for a driving simulator to be a useful research tool that relative validity (i.e., the equal generalisability of two conditions being compared in a simulated environment) may be more important than absolute validity (e.g., the veridical correspondence between speeds obtained in simulation and on real roads) (Godley et al., 2002). Similarly, the use of static images used to collect some of the risk ratings in the present experiment may not
16
Explicit and implicit processes in behavioural adaptation to road width
have had the same power to elicit subtle differences in perceived risk as would either actual driving or even dynamic images (Cohen, 1981; Zakowska, 1997). In the case of the desktop simulator used in the present experiment, we have had good success in obtaining a high degree of both relative and absolute validity of speeds and lane positions across a range of verif ication trials using instrumented vehicles, speed guns, traff ic counters, and video tape methodologies (Brown and Vroegop, 2003; Charlton et al., 1999; Luther et al., 2004). Fur ther, the added control afforded through simulation provides some greater cer tainty in concluding any changes in driving behaviour obtained are the result of experimental manipulations of road conditions rather than some other aspect of the driving environment. Similarly, while the use of static images to obtain comparative risk ratings may have missed some subtle differences, our previous experience with the procedure has obtained good correspondence to results obtained from other methods (Charlton et al., 2003).
Although caution must be always be taken when generalising from the laboratory to real-life driving situations, our sense is that the results of the present experiment are a ref lection (however imperfect) of similar processes operating on drivers everyday. The present research provides strong evidence that behavioural adaptation to changes in road width does occur, even in a simulated environment where the consequences of driving error are negligible. Fur ther, it suggests that perceptions of risk, and their relationship to driving speed, are implicit and preconscious, rather than explicitly considered by drivers. Finally, the directional asymmetries producing reductions in speed commensurate with reductions in road width, but not increases in speed commensurate with increases in road width, offers some suppor t for a zero perceived risk model of behavioural adaptation. The implications of the f inding that drivers respond tonarrowed roads (an objective increase in risk) by reducing their speeds is good news for those who use perceptual countermeasures to create an illusion of narrowed roads or increased risk. The evidence that behavioural adaptation operates on an implicit level also suggests that, although they may be important for a variety of other reasons, public education campaigns designed to explicitly change road users’ perceptions of risk, may not be the most effective means of effecting changes in vehicle speeds.
17
References
Assum, T., Bjornskau, T., Fosser, S., Sagberg, F., 1999. Risk compensation—the case of road lighting. Accid. Anal. Prev. 31, 545–553.
Brown, P.R., Vroegop, J., 2003. TERNZ/University of Waikato DS3 Driving Simulator: Independent Verif ication of Accuracy for Over taking Lane Research (Technical Repor t). Repor t contracted by Transfund New Zealand. Traff ic Planning Consultants Ltd., Auckland, New Zealand.
Charlton, S.G., Mueller, T., Baas, P.H., 1999. Field Trial of Drivers’ Perception-Decision-Action Times (Technical Repor t). Repor t contracted by Industrial Research Ltd. Transpor t Engineering Research NZ Ltd., Hamilton, New Zealand.
Charlton, S.G., Newman, J.E., Baas, P.H., 2003. Patterns of road use and perceptions of driving risk by New Zealand drivers. Road Transp. Res. 12 (1), 28–39.
Cohen, A.S., 1981. Car drivers’ pattern of eye f ixations on the road and in the Laboratory. Percept. Mot. Skills 52, 515–522.
de Waard, D., Steyvers, F.J.J.M., Brookhuis, K.A., 2004. How much visual road information is needed to drive safely and comfor tably. Saf. Sci. 42, 639–655.
Denton, G.G., 1980. The inf luence of visual pattern of perceived speed. Perception 9, 393–402.
Dulisse, B., 1997. Methodological issues in testing the hypothesis of risk compensation. Accid. Anal. Prev. 29, 285–292.
Evans, L., 1986. Comments on Wilde’s notes on “Risk Homeostasis Theory and traff ic accident data”. Risk Anal. 6, 103–107.
Garbacz, C., 1991. Impact of the New Zealand seat belt law. Econ. Inquiry 2, 310–316.
Gawron, V.J., Dennison, T.W., Biferno, M.A., 2002. Mock-ups, models, simulations & embedded testing. In: Charlton, S.G., O’Brien, T.G. (Eds.), Handbook of Human Factors Testing and Evaluation. Erlbaum, Mahwah, NJ.
Glendon, A.I., Hoyes, T.W., Haigney, D.E., Taylor, R.G., 1996. A review of risk homeostasis theory in simulated environments. Saf. Sci. 22, 15–25.
Godley, S.T., 1999. A Driving Simulator Investigation of Perceptual Countermeasures to
18
References
Speeding. Doctoral Thesis, Depar tment of Psychology, Monash University.
Godley, S.T., Triggs, J.T., Fildes, B.N., 2002. Driving simulator validation for speed research. Accid. Anal. Prev. 34, 589–600.
Graham, J.D., 1982. On Wilde’s theory of risk homeostasis. Risk Anal. 2, 235–237.
Hoyes, T.W., Glendon, A.I., 1993. Risk homeostasis: issues for fur ther research. Saf. Sci. 16, 19–33.
Hoyes, T.W., Dorn, L., Desmond, P.A., Taylor, R., 1996a. Risk homeostasis theory, utility and accident loss in a simulated driving task. Saf. Sci. 22, 49–62.
Hoyes, T.W., Stanton, N.A., Taylor, R.G., 1996b. Risk homeostasis theory: a study of intrinsic compensation. Saf. Sci. 22, 77–86.
Janssen, W., Tenkink, E., 1988. Risk homeostasis theory and its critics: time for an agreement. Ergonomics 31, 429–433.
Jonah, B.A., Thiessen, R., Au-Yeung, E., 2001. Sensation seeking, risky driving and behavioral adaptation. Accid. Anal. Prev. 33, 679–684.
Kanellaidis, G., Zervas, A., Karagioule, V., 2000. Drivers’ risk perception of road design elements. Transpor t. Hum. Factors 2, 39–48.
Luther, R.E., Alley, B.D., Charlton, S.G., Wigmore, B.J., Baas, P.H., 2004. Impact on Driver Behaviour of Over taking Lane Design for New Zealand Roads. Transfund New Zealand Research Repor t No. 255. Transfund New Zealand, Wellington, New Zealand.
McKenna, F.P., 1987. Behavioural compensation and safety. J. Occup. Accid. 9, 107–121.
McKenna, F.P., 1990. In defence of conventional safety measures: a reply to G.J.S. Wilde. J. Occup. Accid. 11, 171–181.
Peltzman, S., 1975. The effects of automobile safety regulation. J. Polit. Econ. 83, 677–725.
Sagberg, F., Fosser, S., Saetermo, I.F., 1997. Investigation of behavioural adaptation to airbags and antilock brakes among taxi drivers. Accid. Anal. Prev. 29, 293–302.
19
References
Smiley, A., 2003. Driver adaptation to the road. In: Seminaire International En S´ecurit´e Rout`ere, Association Qu´eb´eciose du Transpor t et des Routes, Qu´ebec City.
Steizer, A., Hoffmann, D.A., 1996. Risk compensation: implications for safety interventions. Organ. Behav. Hum. Decis. Process. 66, 73–88.
Summala, H., 1988. Risk control is not risk adjustment: the zero-risk theory of driver behaviour and its implications. Ergonomics 31, 491–506.
Summala, H., 1996. Accident risk and driver behaviour. Saf. Sci. 22, 103–117.
Trimpop, R., 1996. Risk homeostasis theory: problems of the past and promises for the future. Saf. Sci. 22, 119–130.
van Driel, C.J.G., Davidse, R.J., van Maarseveen, M.F.A.M., 2004. The effects of edgeline on speed and lateral position: a meta-analysis. Accid. Anal. Prev. 36, 671–682.
Watts, G.R., Quimby, A.R., 1980. Aspects of Road Layout That Affect Drivers’ Perception and Risk Taking. TRL Repor t 920. Transpor t and Road Research Laboratory Limited, Crowthorne, England.
Ward, N.J., 2000. Automation of task processes: an example of intelligent transpor tation systems. Hum. Factors Ergon. Manuf. 10, 395–408.
Wilde, G.J.S., 1982. The theory of RHT: implications for safety and health. Risk Anal. 2, 209–226.
Wilde, G.J.S., 1988. Risk homeostasis theory and traff ic accidents: propositions, deductions and discussion of dissension in recent reactions. Ergonomics 3, 441–468.
Zakowska, L., 1997. Dynamic road view research for road safety and aesthetics evaluation. J. Geom. Graph. 1, 51–57.
Zuckerman, M., 1994. Behavioural Expressions and Biosocial Bases of Sensation Seeking. Cambridge University Press, Cambridge, UK.