explaining first-year seedling survival from quality...
TRANSCRIPT

Open Journal of Forestry, 2018, 8, 362-379 http://www.scirp.org/journal/ojf
ISSN Online: 2163-0437 ISSN Print: 2163-0429
Explaining First-Year Seedling Survival from Quality Distributions of Bare-Root Seedlings and Microsites in Industrial Plantations
Puskar N. Khanal1*, Thomas J. Dean2, Scott D. Roberts3, Donald L. Grebner3, Thomas J. Straka1
1Department of Forestry and Environmental Conservation, Clemson University, Clemson, SC, USA 2School of Renewable Natural Resources, Louisiana State University Agricultural Center, Baton Rouge, LA, USA 3Department of Forestry, Mississippi State University, Starkville, MS, USA
Abstract First-year seedling survival impacts all subsequent management planning in plantation forestry. Descriptive statistics of first-year seedling survival data from the Louisiana Department of Agriculture and Forestry (LDAF) indicated that survival success reaches a plateau at between 79% - 85% under normal weather conditions. We provide an explanation for this plateau based on an analysis of seedling and microsite qualities involved in operational pine plan-tations by: 1) using a conceptual model demonstrating how variation in seedling quality and microsite quality interact to determine plantation surviv-al, 2) presenting an example to characterize quality distributions of seedling and microsite qualities, and 3) comparing model outcomes based on meas-ured distributions to realistic values of first-year survival. Simulation results indicated that consistent survival could result from random pairings of initial seedling and site quality distributions. LDAF data analysis indicated that 72% of seedlings were associated with the most frequent quality class that com-prised seedlings with stem caliper between 3.2 to 4.7 mm and average stem height and volume of 25.75 cm and 3.43 cm3, respectively. Similarly, assess-ment of microsites at planting sites in Southeast Louisiana indicated that 48% of planted seedlings were associated with the most frequent microsite quality class which supported first-year height increment between 9 to 29 cm. Model-ling of current operational practice indicated that using seedlings with larger caliper size would increase first year survival, but would result in higher estab-lishment costs. The conceptual model could be modified to for use in other regions regardless of species types involved.
Keywords Seedling Survival, Site Quality, Microsite, Simulation
How to cite this paper: Khanal, P. N., Dean, T. J., Roberts, S. D., Grebner, D. L., & Straka, T. J. (2018). Explaining First-Year Seedling Survival from Quality Distribu-tions of Bare-Root Seedlings and Microsites in Industrial Plantations. Open Journal of Forestry, 8, 362-379. https://doi.org/10.4236/ojf.2018.83023 Received: May 2, 2018 Accepted: July 21, 2018 Published: July 24, 2018 Copyright © 2018 by authors and Scientific Research Publishing Inc. This work is licensed under the Creative Commons Attribution International License (CC BY 4.0). http://creativecommons.org/licenses/by/4.0/
Open Access
DOI: 10.4236/ojf.2018.83023 Jul. 24, 2018 362 Open Journal of Forestry

P. N. Khanal et al.
1. Introduction
First-year seedling survival is a critical element in plantation forestry since all subsequent management planning depends on the quality of stand establish-ment. Efforts to achieve good seedling establishment can also be the most ex-pensive aspect of a silvicultural regime because high establishment costs are car-ried through the entire rotation. Therefore, the use of high quality seedlings planted on favorable microsites is desirable for ensuring first-year survival suc-cess.
Seedling quality is characterized as the ability of the seedling to quickly be-come established and initiate growth. Nursery techniques often involve standar-dized protocols and subsequent grading to supply quality seedlings that give the best chance of survival and subsequent growth (Feret & Kreh, 1985). Microsite quality refers to the site conditions into which the individual seedling is planted, and how favorable they are to seedling survival and growth (Puttonen, 1989).
A primary goal of site preparation is to create microsites that allow seedlings to realize their growth potential (Dougherty & Gresham, 1988). Since the 1950s, mechanical site preparation techniques have become standard practice in the southern US (Fox et al., 2007a); practices such as disking, bedding, and subsoil-ing alter soil properties so as to affect seedling rootability, water storage, nutrient content and supply, and competing vegetation (Morris et al., 2006). Similarly, the uses of herbicides, and to some extent prescribed fire, influences seedling competition (Amishev & Fox, 2006; Fox et al., 2007b; Harrington et al., 1998).
Various factors define seedling quality relative to plantation establishment. Morphological and physiological parameters such as stem caliper, height, root-shoot ratio, water potential, root regeneration potential, and photosynthetic efficiency have been shown as major indicators of seedling quality (Brønnum, 2005; Larsen et al., 1986; South et al., 2001a; Thompson, 1985). Seedling caliper and height are most frequently used for seedling grading because of the ease of measurement, as well as their positive relationship to seedling survival. Similarly, numerous physical and chemical properties have been used to characterize mi-crosite quality. In the US South, the most frequently cited site factors affecting seedling survival and growth include mechanical resistance (Lincoln et al., 2007), water potential and moisture availability (Fox et al., 2007b; Morris et al., 2006), and the soil nutrient status (Margolis & Brand, 1990). Site preparation tech-niques used to ameliorate these factors include bedding and fertilization treat-ments which, along with competition control, alter microsites to either increase soil resource availability or enhance the ability of seedlings to garner those re-sources (Lincoln et al., 2007).
Nursery and site preparation practices have improved over time, resulting in increased overall seedling and site quality respectively (Boyer & South, 1984). Current tree improvement efforts are working towards genetically improved seedlings suited for specific growth environments which could further improve seedling performance allowing them to achieve their genetic potential (Fox et al.,
DOI: 10.4236/ojf.2018.83023 363 Open Journal of Forestry
P. N. Khanal et al.
2007a). However, there remains a significant difference in survival rates between seedlings in research plantings and those in operational settings.
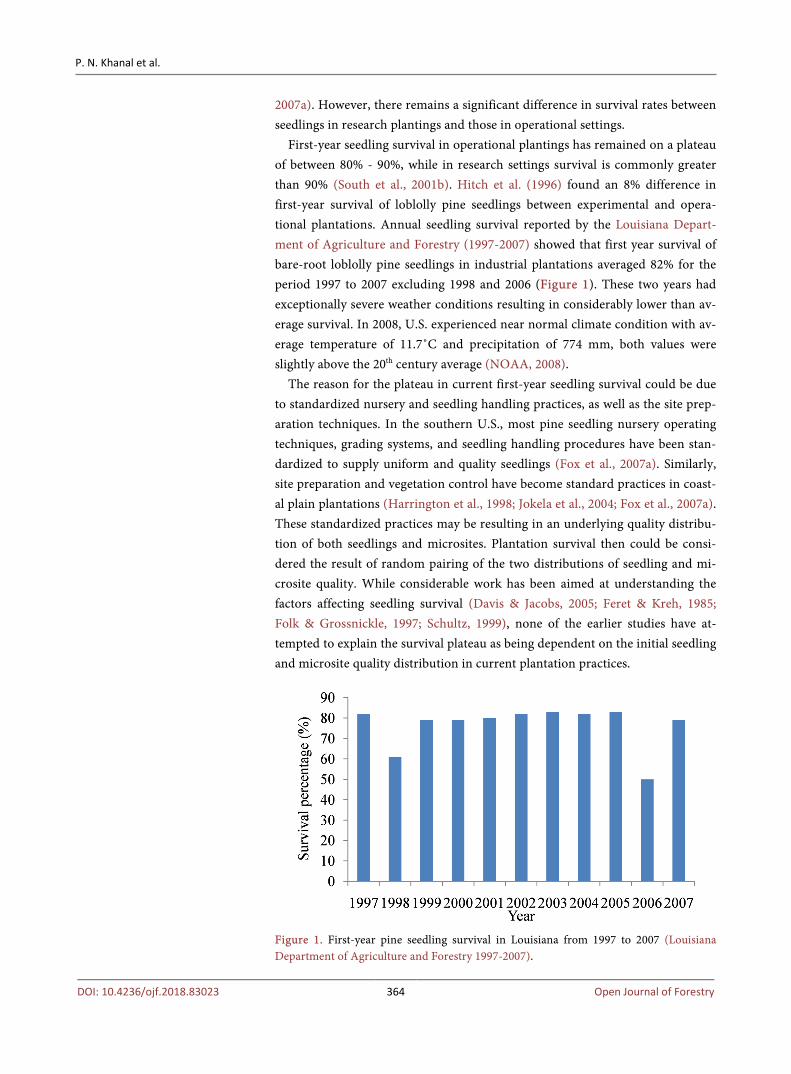
First-year seedling survival in operational plantings has remained on a plateau of between 80% - 90%, while in research settings survival is commonly greater than 90% (South et al., 2001b). Hitch et al. (1996) found an 8% difference in first-year survival of loblolly pine seedlings between experimental and opera-tional plantations. Annual seedling survival reported by the Louisiana Depart-ment of Agriculture and Forestry (1997-2007) showed that first year survival of bare-root loblolly pine seedlings in industrial plantations averaged 82% for the period 1997 to 2007 excluding 1998 and 2006 (Figure 1). These two years had exceptionally severe weather conditions resulting in considerably lower than av-erage survival. In 2008, U.S. experienced near normal climate condition with av-erage temperature of 11.7˚C and precipitation of 774 mm, both values were slightly above the 20th century average (NOAA, 2008).
The reason for the plateau in current first-year seedling survival could be due to standardized nursery and seedling handling practices, as well as the site prep-aration techniques. In the southern U.S., most pine seedling nursery operating techniques, grading systems, and seedling handling procedures have been stan-dardized to supply uniform and quality seedlings (Fox et al., 2007a). Similarly, site preparation and vegetation control have become standard practices in coast-al plain plantations (Harrington et al., 1998; Jokela et al., 2004; Fox et al., 2007a). These standardized practices may be resulting in an underlying quality distribu-tion of both seedlings and microsites. Plantation survival then could be consi-dered the result of random pairing of the two distributions of seedling and mi-crosite quality. While considerable work has been aimed at understanding the factors affecting seedling survival (Davis & Jacobs, 2005; Feret & Kreh, 1985; Folk & Grossnickle, 1997; Schultz, 1999), none of the earlier studies have at-tempted to explain the survival plateau as being dependent on the initial seedling and microsite quality distribution in current plantation practices.
Figure 1. First-year pine seedling survival in Louisiana from 1997 to 2007 (Louisiana Department of Agriculture and Forestry 1997-2007).
DOI: 10.4236/ojf.2018.83023 364 Open Journal of Forestry

P. N. Khanal et al.
We propose a conceptual model that explains plantation seedling survival as the result of the random pairing of seedlings and microsites. This model suggests that the quality distributions of seedlings and microsites are responsible for the observed plateau in seedling survival in loblolly pine plantations. The specific objectives are: 1) to present a conceptual model demonstrating how variation in seedling and microsite quality interact to determine plantation survival, 2) to present an initial attempt to characterize quality distributions of seedling and microsite qualities, and 3) to compare model outcomes based on measured dis-tributions to realistic values of first-year survival.
2. The Conceptual Model
Mathematically, the model consists of two components—the joint frequency distribution of the seedling and microsite quality, and a function for predicting the probability of first year survival using the joint frequency distribution. The sum of predicted probabilities from the joint distribution is the overall seedling survival for the plantation.
The model can also be described in discrete terms using quality classes. The effect of various distributions of quality classes on seedling survival is relatively easy to illustrate. To illustrate the discrete version of the model, we assumed five seedling quality classes, S1 - S5. We chose five quality classes because the current literature regarding seedling quality often discriminates seedlings into advanced quality, high quality, average, poor, and very poor classes. South et al. (1985) di-vided seedling quality into five quality classes: morphologically advanced, grade 1, grade 2, grade 3, and cull class. Similarly, microsites were divided into five classes M1 - M5. For both seedlings and microsites, 1 indicates the highest qual-ity while 5 indicates the poorest quality. Relative frequency values were arbitra-rily assigned to the five seedlings and microsite quality classes to create a distri-bution of each (Table 1).
To simulate a planting of the assumed quality distributions in Table 1, we conducted a repeated random pairing of each seedling and microsite quality by multiplying the relative frequencies of the two respective distributions. The re-peated random pairing implies each seedling gets paired with each microsite, and vice-versa. The pairing generated a 5 by 5 pairing matrix (Table 2). To assess Table 1. Seedling (S) and Microsite (M) quality distribution for the conceptual model, where quality class 5 indicates lowest value and quality class 1 indicates the best value.
Quality class Relative frequency
Seedling (S) Microsite (M)
1 0.10 0.20
2 0.25 0.20
3 0.35 0.35
4 0.20 0.15
5 0.10 0.10
DOI: 10.4236/ojf.2018.83023 365 Open Journal of Forestry
P. N. Khanal et al.
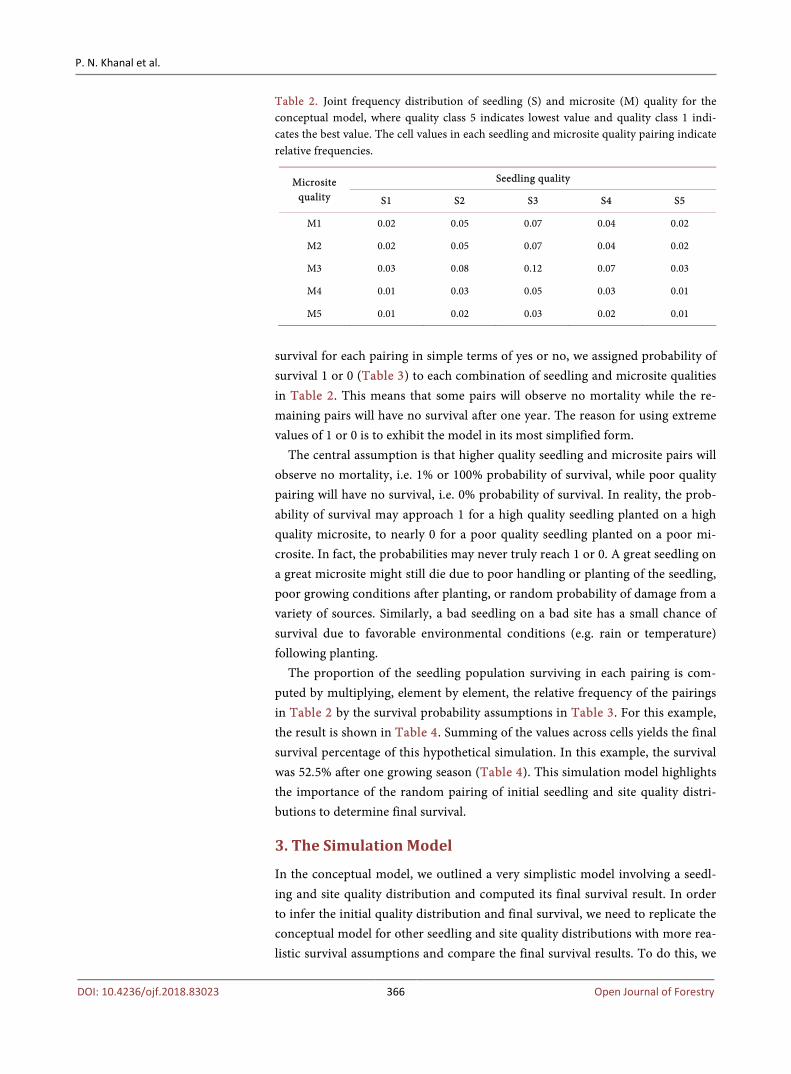
Table 2. Joint frequency distribution of seedling (S) and microsite (M) quality for the conceptual model, where quality class 5 indicates lowest value and quality class 1 indi-cates the best value. The cell values in each seedling and microsite quality pairing indicate relative frequencies.
Microsite quality
Seedling quality
S1 S2 S3 S4 S5
M1 0.02 0.05 0.07 0.04 0.02
M2 0.02 0.05 0.07 0.04 0.02
M3 0.03 0.08 0.12 0.07 0.03
M4 0.01 0.03 0.05 0.03 0.01
M5 0.01 0.02 0.03 0.02 0.01
survival for each pairing in simple terms of yes or no, we assigned probability of survival 1 or 0 (Table 3) to each combination of seedling and microsite qualities in Table 2. This means that some pairs will observe no mortality while the re-maining pairs will have no survival after one year. The reason for using extreme values of 1 or 0 is to exhibit the model in its most simplified form.
The central assumption is that higher quality seedling and microsite pairs will observe no mortality, i.e. 1% or 100% probability of survival, while poor quality pairing will have no survival, i.e. 0% probability of survival. In reality, the prob-ability of survival may approach 1 for a high quality seedling planted on a high quality microsite, to nearly 0 for a poor quality seedling planted on a poor mi-crosite. In fact, the probabilities may never truly reach 1 or 0. A great seedling on a great microsite might still die due to poor handling or planting of the seedling, poor growing conditions after planting, or random probability of damage from a variety of sources. Similarly, a bad seedling on a bad site has a small chance of survival due to favorable environmental conditions (e.g. rain or temperature) following planting.
The proportion of the seedling population surviving in each pairing is com-puted by multiplying, element by element, the relative frequency of the pairings in Table 2 by the survival probability assumptions in Table 3. For this example, the result is shown in Table 4. Summing of the values across cells yields the final survival percentage of this hypothetical simulation. In this example, the survival was 52.5% after one growing season (Table 4). This simulation model highlights the importance of the random pairing of initial seedling and site quality distri-butions to determine final survival.
3. The Simulation Model
In the conceptual model, we outlined a very simplistic model involving a seedl-ing and site quality distribution and computed its final survival result. In order to infer the initial quality distribution and final survival, we need to replicate the conceptual model for other seedling and site quality distributions with more rea-listic survival assumptions and compare the final survival results. To do this, we
DOI: 10.4236/ojf.2018.83023 366 Open Journal of Forestry

P. N. Khanal et al.
Table 3. Expected survival assumption for the conceptual model, where quality class 5 indicates the lowest value and quality class 1 the best value. Cell value 0 indicates no sur-vival, while cell value 1 indicates 100% survival in a pairing of site quality and microsite quality.
Microsite quality
Seedling quality
S1 S2 S3 S4 S5
M1 1 1 1 0 0
M2 1 1 1 0 0
M3 1 1 1 0 0
M4 0 0 0 0 0
M5 0 0 0 0 0
Table 4. Predicted first-year survival for the conceptual model where quality class 5 indi-cates lowest value and quality class 1 indicates the best value. Cell values in each seedling and microsite quality pairing indicates relative frequencies.
Microsite quality
Seedling quality
S1 S2 S3 S4 S5
M1 0.02 0.05 0.07 0 0
M2 0.02 0.05 0.07 0 0
M3 0.03 0.08 0.12 0 0
M4 0 0 0 0 0
M5 0 0 0 0 0
created 20 different distributions for seedling quality and 20 distributions of mi-crosite quality, each with five quality classes as in the conceptual model. The first ten seedling quality and microsite quality distributions included a varied pro-portion of lower quality seedlings and microsites in their respective quality classes S4, S5 and M4, M5, while the remaining 10 seedling and microsite dis-tributions lacked any distribution in very poor quality classes S5 and M5. The relative frequency distribution pattern between quality classes indicated a shift from a few to no seedlings and microsites in lowest quality classes.
We followed the same simulation steps described in the conceptual model to determine final survival in each of these distributions. The pairing of 20 hypo-thetical seedling quality distributions and 20 microsite quality distributions re-sulted in 400 simulated plantings. We arbitrarily assumed a survival probability function that was different than the one used in our explanation of the concep-tual model. Here we assume that even high quality pairings will observe some mortality and resulting in 95% survival and poor quality pairings will have an assumed 60% survival as opposed to the zero probability of survival in the con-ceptual model.
Element by element multiplication of each pairing with its corresponding as-sumed probability of survival, and then summing the resulting values provided
DOI: 10.4236/ojf.2018.83023 367 Open Journal of Forestry

P. N. Khanal et al.
the overall plantation survival of these 400 pairings after one growing season. The results indicate that the overall survival of these 400 simulated plantings va-ried between 49% and 99%. Distributions with higher proportions of seedlings and microsites in S1 and S2 (M1 and M2) classes naturally resulted in higher survival percentages. This demonstrates how overall survival is responsive to the relative frequency distributions between initial seedling and microsite quality classes. These pairings created a survival distribution tending toward the higher end. However, frequency distribution with relatively higher proportions of seedlings and microsites in poor quality classes S4 and S5 (M4 and M5) resulted in final survival fairly insensitive to any changes in the distribution because most of those pairings in lower quality classes were assumed to fail. In other words, there was relatively small change in final survival from the alteration in initial frequency distributions involved in lower quality classes as compared to similar changes in higher quality classes of seedlings and microsites under similar sur-vival probability assumption.
Additionally, the increase in frequency of seedlings and microsites in poor quality classes created distribution tending toward the lower end. These simula-tion results demonstrate how final survival is dependent on the initial quality distributions and how consistent survival could result from the random pairing of similar seedling and microsite quality distributions. This also provides initial support for the concept that our nursery and site preparation practices might be providing consistently similar quality distributions of seedlings and microsites thus resulting in the observed plateau in first year seedling survival.
4. The Case Study
A case study was used to quantify actual quality distributions of seedlings and microsites and randomly combine these pairings to determine how sensitive survival may be to random combinations of the relative frequency of seedling and microsite qualities. The ideal approach for this type of study would be to plant seedlings of known quality at microsites of known quality and measure first-year survival and growth. This could theoretically be accomplished by ei-ther planting commercially available seedlings on uniform microsites to measure seedling variation, or by planting clones on operationally prepared tract to measure microsite variation. However, because of the lack of access to seedlings and microsites prior to planting, a modified approach was followed, and there-fore the results in this section were still hypothetical.
4.1. Seedling and Microsite Measurements
Seedlings and microsites commonly used in operational plantations were used to estimate their quality distributions. Seedling data were obtained using a 1000-seedling bag of bare root loblolly pine (Pinus taeda) seedlings, most com-monly planted and intensively managed commercial pine species in the southern U.S., purchased from the Louisiana Department of Agriculture and Forestry
DOI: 10.4236/ojf.2018.83023 368 Open Journal of Forestry

P. N. Khanal et al.
(LDAF) in 2008. Stem caliper and height were measured on 907 unbroken seedlings. Seedling volume was calculated from the caliper and height measure-ments using the volume formula:
2π 4V d h = (1)
where V is stem volume, d is stem diameter, and h is shoot length. For the 907 seedlings, stem caliper, stem height, and volume averaged 4.05 mm, 25.12 cm and 3.43 cm3, respectively (Table 5). Stem caliper varied between 1.19 to 8.86 mm, stem height between 13 to 39 cm, and stem volume between 0.23 to 16.02 cm3. This clearly demonstrates that the nursery bag did not contain seedlings of uniform size.
Microsite data were collected from measurement of microsite variables at eight randomly selected recent plantations on Weyerhaeuser Inc. lands in Li-vingston Parrish, Louisiana. At each of these planting sites, 200 planted seedlings were randomly identified and their microsite environment assessed. Thus, a total 1600 seedlings and their microsites were assessed from the selected planting sites. The selected seedlings were assessed in spring 2008 and 2009 their first-year height increment was recorded.
To assess microsite, bed height and soil compaction were recorded at each seedling location. Soil penetration was measured using a pin penetrometer in four quadrants around each selected seedling. The penetrometer reading was an arbitrary scale ranging from 0 to 20 indicating the level of resistance. Bed height was measured using a level and a height pole. Measurements of bed height were taken from both sides of the bed where the seedling was planted. Soil samples were collected from every 10th seedling microsite providing 160 samples from which to assess soil moisture content, texture, and mineral nitrogen content of the microsites.
A soil probe was used to collect soil from the rooting zone of the selected seedlings 15 to 25 cm below the soil surface. Mineral nitrogen content was as-sessed using approximate 10 gm of soil from each sample extracted with 2 N KCL. The sample extracts were shaken at 220 rpm for 1 hr. The extract was fil-tered after allowing it to settle for one hour. The filtrate was analyzed for total mineral nitrogen with an ammonia conductivity detector (Timberline Instru-ment Model 550 A). Soil moisture content was determined gravimetrically. Soil texture was determined using the hydrometric method as described in Klute (1986). Table 5. Mean, minimum, and maximum for the caliper, stem height, and volume of the sampled 907 bare-root seedlings.
Seedling variables Mean Minimum Maximum
Caliper (mm) 4.05 1.19 8.86
Stem height (cm) 25.12 13.00 39.00
Volume (cm3) 3.43 0.23 16.02
DOI: 10.4236/ojf.2018.83023 369 Open Journal of Forestry
P. N. Khanal et al.
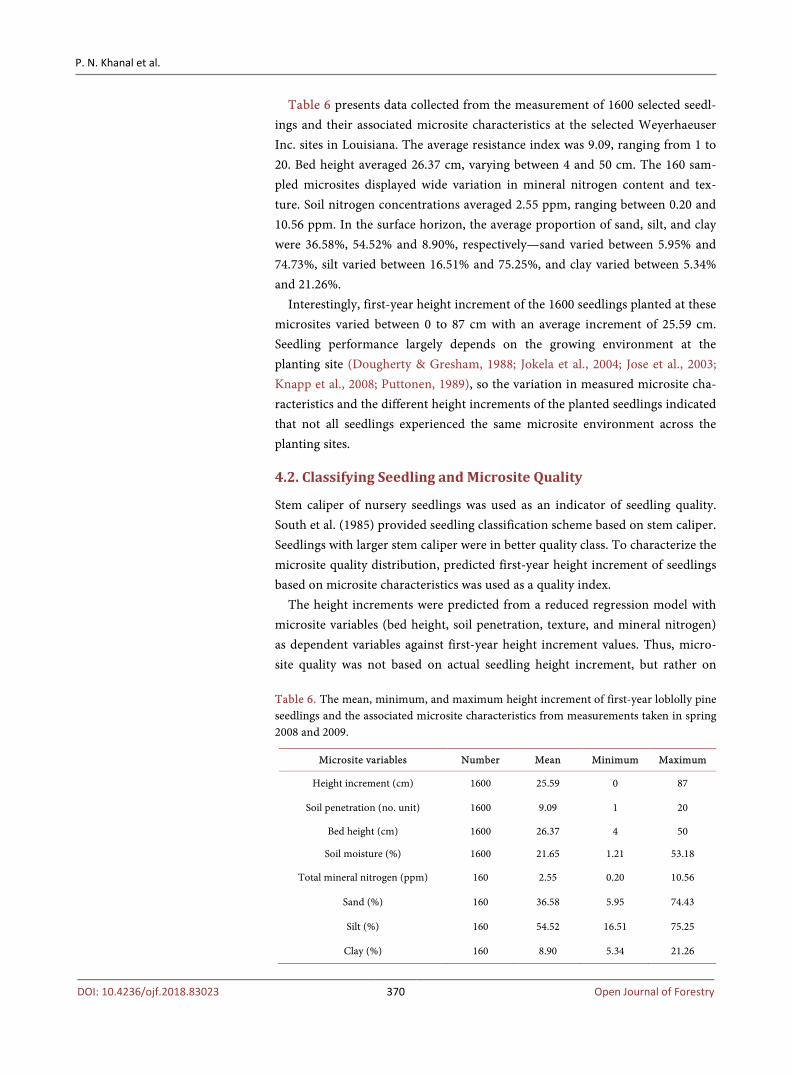
Table 6 presents data collected from the measurement of 1600 selected seedl-ings and their associated microsite characteristics at the selected Weyerhaeuser Inc. sites in Louisiana. The average resistance index was 9.09, ranging from 1 to 20. Bed height averaged 26.37 cm, varying between 4 and 50 cm. The 160 sam-pled microsites displayed wide variation in mineral nitrogen content and tex-ture. Soil nitrogen concentrations averaged 2.55 ppm, ranging between 0.20 and 10.56 ppm. In the surface horizon, the average proportion of sand, silt, and clay were 36.58%, 54.52% and 8.90%, respectively—sand varied between 5.95% and 74.73%, silt varied between 16.51% and 75.25%, and clay varied between 5.34% and 21.26%.
Interestingly, first-year height increment of the 1600 seedlings planted at these microsites varied between 0 to 87 cm with an average increment of 25.59 cm. Seedling performance largely depends on the growing environment at the planting site (Dougherty & Gresham, 1988; Jokela et al., 2004; Jose et al., 2003; Knapp et al., 2008; Puttonen, 1989), so the variation in measured microsite cha-racteristics and the different height increments of the planted seedlings indicated that not all seedlings experienced the same microsite environment across the planting sites.
4.2. Classifying Seedling and Microsite Quality
Stem caliper of nursery seedlings was used as an indicator of seedling quality. South et al. (1985) provided seedling classification scheme based on stem caliper. Seedlings with larger stem caliper were in better quality class. To characterize the microsite quality distribution, predicted first-year height increment of seedlings based on microsite characteristics was used as a quality index.
The height increments were predicted from a reduced regression model with microsite variables (bed height, soil penetration, texture, and mineral nitrogen) as dependent variables against first-year height increment values. Thus, micro-site quality was not based on actual seedling height increment, but rather on Table 6. The mean, minimum, and maximum height increment of first-year loblolly pine seedlings and the associated microsite characteristics from measurements taken in spring 2008 and 2009.
Microsite variables Number Mean Minimum Maximum
Height increment (cm) 1600 25.59 0 87
Soil penetration (no. unit) 1600 9.09 1 20
Bed height (cm) 1600 26.37 4 50
Soil moisture (%) 1600 21.65 1.21 53.18
Total mineral nitrogen (ppm) 160 2.55 0.20 10.56
Sand (%) 160 36.58 5.95 74.43
Silt (%) 160 54.52 16.51 75.25
Clay (%) 160 8.90 5.34 21.26
DOI: 10.4236/ojf.2018.83023 370 Open Journal of Forestry

P. N. Khanal et al.
the modeled relationship between observed height increment and a suite of mi-crosite variables. The reason for using predicted height increment instead of measured height was that empirical measurements of height increment are af-fected by both seedling and microsite quality, and thus confound the measure. Using predicted values isolates the influence of microsite factors on height in-crement.
The nursery seedlings were classified into quality classes based on their stem caliper. The seedlings were grouped into five quality classes and the relative fre-quency in each class was determined. This provided an estimated quality distri-bution for nursery seedlings in current operational plantations in Louisiana in which LDAF seedlings were used. Seedlings in quality class S5 had stem caliper less than 2.4 mm, while stem caliper in quality class S1 were greater than 6.3 mm (Table 7). Seedlings in quality class S5 were smaller, and thus considered infe-rior. Their average stem height and volume were 19.88 cm and 0.65 cm3, respec-tively. Seedlings in class S1 had average stem height and volume 27.16 cm and 10.47 cm3, respectively.
These larger seedlings were presumed to be superior. There were 16% seedl-ings in S4 and S5 quality classes combined. The bale contained only 2% S5 qual-ity seedlings and 10% S2 quality seedlings. Class S3 comprised 72% of the seedl-ings. This indicated that the bale contained mostly S3 class seedlings which could be the desired quality class, according to current standards.
To determine the microsite quality distribution, the range of predicted height increments was divided into five quality classes and the relative frequency in each class was computed. Microsites with less than zero predicted height incre-ment were grouped into lowest quality class and the average height increment was required to be in the middle quality class M3. The M5 microsite quality class included sites with a predicted height increment of less than zero, while the M1 quality classes included sites with greater than 32 cm predicted first-year incre-ment (Table 8). Other quality classes M4, M3, and M2 had predicted increments between 0 and 32 cm on first year. The microsite quality class M1 contained 33% of the microsites and the lowest quality class M5 had 3% of the microsites asso-ciated with it. The quality class M3 was the most frequent microsite with 48% Table 7. Seedling quality classes and the associated caliper range and relative frequency of the 907 bare-root seedlings. Seedling quality class 5 indicates lowest quality and class 1 indicates best quality.
Seedling quality class
Caliper range (mm)
Relative frequency
Average height (cm)
Average volume (cm3)
S1 >6.3 0.02 27.16 10.47
S2 4.7 - 6.3 0.10 26.51 5.69
S3 3.2 - 4.7 0.72 25.28 3.15
S4 2.4 - 3.2 0.15 23.08 1.52
S5 <2.4 0.01 19.88 0.65
DOI: 10.4236/ojf.2018.83023 371 Open Journal of Forestry
P. N. Khanal et al.
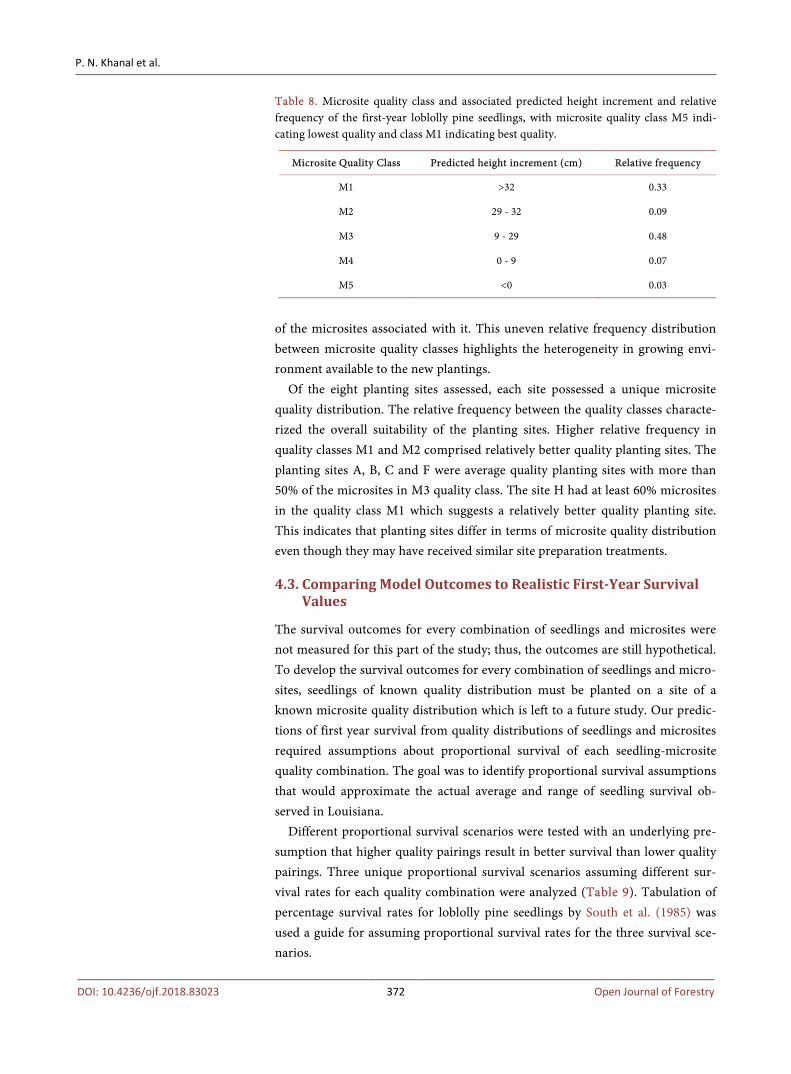
Table 8. Microsite quality class and associated predicted height increment and relative frequency of the first-year loblolly pine seedlings, with microsite quality class M5 indi-cating lowest quality and class M1 indicating best quality.
Microsite Quality Class Predicted height increment (cm) Relative frequency
M1 >32 0.33
M2 29 - 32 0.09
M3 9 - 29 0.48
M4 0 - 9 0.07
M5 <0 0.03
of the microsites associated with it. This uneven relative frequency distribution between microsite quality classes highlights the heterogeneity in growing envi-ronment available to the new plantings.
Of the eight planting sites assessed, each site possessed a unique microsite quality distribution. The relative frequency between the quality classes characte-rized the overall suitability of the planting sites. Higher relative frequency in quality classes M1 and M2 comprised relatively better quality planting sites. The planting sites A, B, C and F were average quality planting sites with more than 50% of the microsites in M3 quality class. The site H had at least 60% microsites in the quality class M1 which suggests a relatively better quality planting site. This indicates that planting sites differ in terms of microsite quality distribution even though they may have received similar site preparation treatments.
4.3. Comparing Model Outcomes to Realistic First-Year Survival Values
The survival outcomes for every combination of seedlings and microsites were not measured for this part of the study; thus, the outcomes are still hypothetical. To develop the survival outcomes for every combination of seedlings and micro-sites, seedlings of known quality distribution must be planted on a site of a known microsite quality distribution which is left to a future study. Our predic-tions of first year survival from quality distributions of seedlings and microsites required assumptions about proportional survival of each seedling-microsite quality combination. The goal was to identify proportional survival assumptions that would approximate the actual average and range of seedling survival ob-served in Louisiana.
Different proportional survival scenarios were tested with an underlying pre-sumption that higher quality pairings result in better survival than lower quality pairings. Three unique proportional survival scenarios assuming different sur-vival rates for each quality combination were analyzed (Table 9). Tabulation of percentage survival rates for loblolly pine seedlings by South et al. (1985) was used a guide for assuming proportional survival rates for the three survival sce-narios.
DOI: 10.4236/ojf.2018.83023 372 Open Journal of Forestry
P. N. Khanal et al.
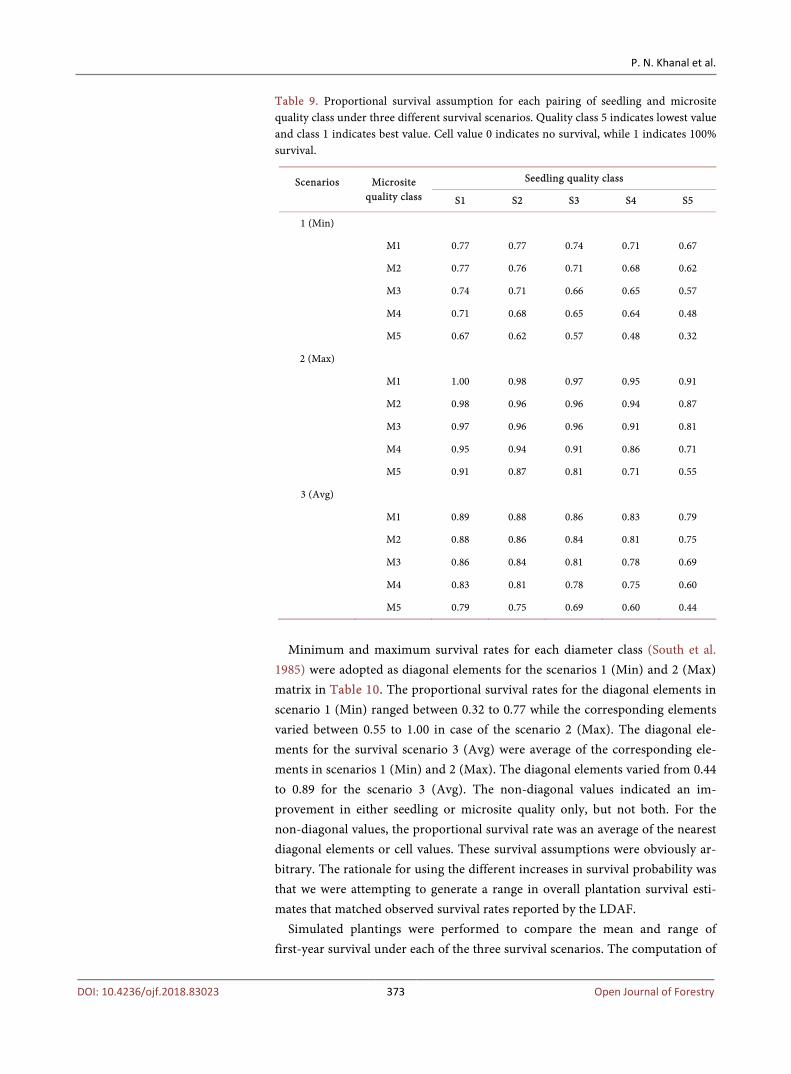
Table 9. Proportional survival assumption for each pairing of seedling and microsite quality class under three different survival scenarios. Quality class 5 indicates lowest value and class 1 indicates best value. Cell value 0 indicates no survival, while 1 indicates 100% survival.
Scenarios
Microsite quality class
Seedling quality class
S1 S2 S3 S4 S5
1 (Min)
M1 0.77 0.77 0.74 0.71 0.67
M2 0.77 0.76 0.71 0.68 0.62
M3 0.74 0.71 0.66 0.65 0.57
M4 0.71 0.68 0.65 0.64 0.48
M5 0.67 0.62 0.57 0.48 0.32
2 (Max)
M1 1.00 0.98 0.97 0.95 0.91
M2 0.98 0.96 0.96 0.94 0.87
M3 0.97 0.96 0.96 0.91 0.81
M4 0.95 0.94 0.91 0.86 0.71
M5 0.91 0.87 0.81 0.71 0.55
3 (Avg)
M1 0.89 0.88 0.86 0.83 0.79
M2 0.88 0.86 0.84 0.81 0.75
M3 0.86 0.84 0.81 0.78 0.69
M4 0.83 0.81 0.78 0.75 0.60
M5 0.79 0.75 0.69 0.60 0.44
Minimum and maximum survival rates for each diameter class (South et al.
1985) were adopted as diagonal elements for the scenarios 1 (Min) and 2 (Max) matrix in Table 10. The proportional survival rates for the diagonal elements in scenario 1 (Min) ranged between 0.32 to 0.77 while the corresponding elements varied between 0.55 to 1.00 in case of the scenario 2 (Max). The diagonal ele-ments for the survival scenario 3 (Avg) were average of the corresponding ele-ments in scenarios 1 (Min) and 2 (Max). The diagonal elements varied from 0.44 to 0.89 for the scenario 3 (Avg). The non-diagonal values indicated an im-provement in either seedling or microsite quality only, but not both. For the non-diagonal values, the proportional survival rate was an average of the nearest diagonal elements or cell values. These survival assumptions were obviously ar-bitrary. The rationale for using the different increases in survival probability was that we were attempting to generate a range in overall plantation survival esti-mates that matched observed survival rates reported by the LDAF.
Simulated plantings were performed to compare the mean and range of first-year survival under each of the three survival scenarios. The computation of
DOI: 10.4236/ojf.2018.83023 373 Open Journal of Forestry

P. N. Khanal et al.
Table 10. Predicted average, minimum, and maximum first-year survival percent from the pairing of seedling and microsites qualities at eight different planting sites under three different proportional survival scenarios. Cell values are first-year survival percentages for each scenario.
Survival (%) Survival scenario
1 (Min) 2 (Max) 3 (Avg)
Average 69 95 82
Minimum 66 93 79
Maximum 71 96 83
expected plantation survival given the planting of LDAF nursery seedling quality distribution (Table 7) at each of the eight planting sites under each survival sce-nario (Table 9) predicted survival for each of the eight planting sites. The mean and range of final survival across the eight sites varied among the survival scena-rios (Table 10).
Under scenario 1 (Min), average survival was 69%, varying from 66% to 71%. Average survival in scenario 2 (Max) was 95% and ranged from 93% to 96%. Average survival in scenario 3 (Avg) was 82%, varying from 79% to 83%. The mean and range of first-year survival for the scenario 1 (Min) and 2 (Max) did not match the survival values reported by LDAF for Louisiana. In scenario 1 (Min), the average and range were relatively lower than reported values, and in scenario 2 (Max), the average and rage were higher than the reported LDAF sur-vival results. Scenario 3 (Max) provided a better approximation of the first-year seedling survival reported in the LDAF data.
The survival range was wide enough to include the observed survival values and the average was relatively similar to the observed average. This survival as-sumption better approximated current operational survival rates in Louisiana. It implies that operational plantation practices in Louisiana might observe similar sensitivity related to first-year survival under given quality class pairings of seedlings and microsites. This scenario was selected for making further infe-rences on strategies to improve the survival plateau. However, we arbitrarily de-veloped this survival probability matrix to try and match the LDAF reported survival rates; and there could be other survival probability matrices that might match the values. But, it is the closest approximation that could be made based on currently available empirical results providing survival rates for first-year loblolly pine seedlings.
The initial seedling and microsite quality distributions were the inputs for the proportional survival assumption for each pairing. Given the initial quality dis-tributions in an operational environment, annual variations in weather condi-tions would be expected to result in variation around the average survival rate. The survival response to such annual variation would, however, largely depend on initial seedling and microsite quality. The lower quality pairings of seedlings and microsites would likely be more sensitive to such variation than high quality
DOI: 10.4236/ojf.2018.83023 374 Open Journal of Forestry
P. N. Khanal et al.
pairings. Thus, the proportional survival of lower quality seedling and microsite pair-
ings might be relatively higher under favorable weather condition but could be unreliable under more adverse conditions. In reality, the survival scenario as-sumption is an approximation rather than a field-based measurement because we never actually get to observe such proportion because of the existing diver-gence in definition of the term quality. However, the use of higher quality seedl-ing and improved site preparation would certainly be expected to improve pro-portional survival. In essence, the initial quality distributions largely determine the underlying proportional survival decision matrix scenarios and ultimately the average survival.
5. Implications for Current Practices
Scenarios that increase plantation survival rates were identified and would indi-cate management actions that should lead to better meeting plant establishment objectives. The presence of lower quality seedlings and microsites appears to be largest contributor to a lower overall survival rate, as seen in scenario 3 (Avg). The inferior seedling/microsite pairing could be avoided by culling poor quality seedlings and avoiding poor microsites (that are identified before or during planting operations).
A simulated scenario included the removal of cull seedlings and adverse mi-crosites. Obviously, the number of usable seedlings in the nursery bale decreased with the increase in minimum size of acceptable seedlings. Avoiding S5 quality seedlings during planting reduced the total number of seedlings available for planting to lower than 907. Similarly, with a strategy to avoid M5 quality micro-sites during planting, the number of usable microsites was less than 200, because the microsites supporting no predicted height were avoided during planting.
Simulation of the pairing of new seedling quality distribution with new mi-crosite quality distribution was evaluated for the decision matrix scenario 3 (Avg). Elimination of S5 quality seedlings and avoiding the lowest quality mi-crosites M5 during planting increased the average survival to over 90%. Imple-mentation of this scenario, however, would not be so simple and straightforward during actual planting operations. While determining seedling quality might be relatively straightforward, identifying and avoiding poor microsites during planting would be difficult and time-consuming. Some sort of sampling process might be required to precisely identify such sites, rather than relying on planting crews to avoid such sites during planting operations. More intensive site prepa-ration practices at a higher cost could eliminate lower quality microsites, but could also alter some soil characteristics important for early height increment of the new seedlings. Thus, the option of avoiding lower quality microsites is not easily implemented.
A more practical option to enhance survival would be to increase the target seedling size in planting operations. Simulating the pairing of the new seedling
DOI: 10.4236/ojf.2018.83023 375 Open Journal of Forestry
P. N. Khanal et al.
distribution after culling inferior seedlings with the original microsite distribu-tion increased the average survival. Eliminating seedlings of less than 3, 5, and 6 mm caliper from the nursery supply increased the average survival to 83% (range 80% to 84%), 85% (range 83% to 87%), and 86% (range 83% to 88%), re-spectively. Similar results have been reported in earlier nursery trial studies (Radoglou & Raftoyannis, 2002; South et al., 2001b). There is a tradeoff. Larger caliper seedlings should significantly increase average plantation survival and could raise the plateau in first-year seedling survival, but would also decrease the percentage of usable seedlings from the nursery supply and increase per seedling costs.
In practice, it would require the nursery to reduce seedling density in their beds, resulting in a higher production cost per seedling. Or, another option could be to discard smaller seedlings during planting. Our case study showed that eliminating seedlings 3, 4, or 5 mm caliper or smaller culled 10%, 51%, and 89% of the seedlings, respectively. This increased the per seedling cost from $0.040 to $0.048, $0.087, and $0.435, respectively. These results indicate that in-creasing caliper size could be a promising strategy to increase first-year survival but at higher establishment cost.
Pine plantations in the southern US are the most intensively managed forests in the world, and this study used seedling and microsite data from the opera-tional plantations in this region. The results of this study could easily be applied to other world regions and species types. The conceptual model, based on a probability distribution to analyze plantation success in an operational envi-ronment, could be modified for other designs of nursery and site preparation interactions. It is a new framework for future research into plantation survival dynamics.
These results particular apply to restoration efforts. The interaction of micro-site and various planting stock factors (like stocktype and container type) in in-fluencing plantation survival is well-established in the literature (Paterson, 1997, Pinto et al., 2011), but little attention has been focused on the seedling quality distribution, much less it’s interaction with microsite, as one of these factors (Grossnickle and MacDonald 2018). Any factor influencing plantation survival can have significant impact on ecosystem restoration projects (Oliet & Douglass, 2012). Thus, these results may prove valuable to managers and planners needing to modify plant establishment and management procedures to better meet res-toration objectives (Harrington, 1999; Nunez-Mir et al., 2015).
6. Conclusion
This study highlights the combined influence of initial seedling quality and mi-crosite quality on first-year seedling survival. Simulation results demonstrate that a consistent average survival rate could result from the repeated pairings of similar seedling and microsite quality distributions. Similarly, our case study re-sults indicated that average first-year survival increased with the increase in seedling and microsite quality distribution.
DOI: 10.4236/ojf.2018.83023 376 Open Journal of Forestry
P. N. Khanal et al.
Recent attempts to use genetically improved seedlings, grading techniques, careful transportation and handling practices, and intensive site preparation practices could be viewed as attempts to use uniform and better quality seedlings and microsites in plantation establishment. Current practices could be consi-dered somewhat standardized in terms of seedling production and site prepara-tion techniques used in operational plantation management. But there remains considerable heterogeneity in seedling and microsite qualities. The availability of a significant proportion of lower quality seedlings and poor quality microsite could be a concern for increasing the first-year seedling survival.
These results suggest that first-year survival is responsive to initial quality dis-tributions of seedlings and microsites, and the observed survival plateau could be the result of repeated pairing of similar quality distributions. This could be the unintentional result of standardized nursery management and site prepara-tion practices providing similar distributions of seedling and microsite quality in operational planting environments. One of the practical strategies to increase first-year seedling survival is to increase seedling size. Larger seedlings could in-crease survival and growth, and ultimately yield from plantations.
Acknowledgements
We thank Weyerhaeuser Company for allowing access to their plantation sites in Louisiana to measure seedlings and collect soil samples and Christopher Allen for his help with field work, and Dr. Q. V. Cao for his help with the analysis. This study was supported by Lucius W. Gilbert Foundation, School of Renewa-ble Natural Resources, Louisiana State University and the National Institute of Food and Agriculture, McIntire Stennis Project under LAB84307. Published with the approval of the Director of the Louisiana Agricultural Experiment Sta-tion as publication No. (pending).
References Amishev, D. Y., & Fox, T. R. (2006). The Effect of Weed Control and Fertilization on
Survival and Growth of Four Pine Species in the Virginia Piedmont. Forest Ecology and Management, 236, 93-101. https://doi.org/10.1016/j.foreco.2006.08.339
Boyer, J. N., & South, D. B. (1984). Forest Nursery Practices in the South.Southern Jour-nal of Applied Forestry, 8, 67-75.
Brønnum, P. (2005). Preplanting Indicators of Survival and Growth of Desiccated Abies procera Bareroot Planting Stock. Scandinavian Journal of Forest Research, 20, 36-46. https://doi.org/10.1080/02827580510008257
Davis, A. S., & Jacobs, D. F. (2005). Quantifying Root System Quality of Nursery Seedl-ings and Relationship to Outplanting Performance. New Forests, 30, 295-311. https://doi.org/10.1007/s11056-005-7480-y
Dougherty, P, M., & Gresham, C. A. (1988). Conceptual Analysis of Southern Pine Plan-tation Establishment and Early Growth. Southern Journal of Applied Forestry, 12, 160-166.
Feret, P. P., & Kreh, R. E. (1985). Seedling Root Growth Potential as an Indicator of Lob-lolly Pine Field Performance. Forest Science, 31, 1005-1011.
DOI: 10.4236/ojf.2018.83023 377 Open Journal of Forestry

P. N. Khanal et al.
Folk, R. S., & Grossnickle, S. C. (1997). Determining Field Performance Potential with the Use of Limiting Environmental Conditions. New Forests, 13, 121-138. https://doi.org/10.1023/A:1006514805052
Fox, T. R., Allen, H. L., Albaugh, T. J., Rubilar, R., & Carlson, C. A. (2007b). Tree Nutri-tion and Forest Fertilization of Pine Plantations in the Southern United States. South-ern Journal of Applied Forestry, 31, 5-11.
Fox, T. R., Jokela, E. J., & Allen, H. L. (2007a). The Development of Pine Plantation Sil-viculture in the Southern United States. Journal of Forestry, 105, 337-347.
Grossnickle, S. C., & MacDonald, J. E. (2018). Why Seedlings Grow: Influence of Plant Attributes. New Forests, 49, 1-34. https://doi.org/10.1007/s11056-017-9606-4
Harrington, C. A. (1999). Forests Planted for Ecosystem Restoration and Conservation. New Forests, 17, 175-190. https://doi.org/10.1023/A:1006539910527
Harrington, T. B., Minogue, P. J., Lauer, D. K., & Ezell, A. W. (1998). Two Year Devel-opment of Southern Pine Seedlings and Associated Vegetation Following Spray-and-Burn Site Preparation with Imazapyr Alone or in Mixture with Other Her-bicides. New Forests, 15, 89-106. https://doi.org/10.1023/A:1006567528659
Hitch, K. L., Shiver, B. D., & Borders, B. E. (1996). Mortality Models for Newly Regene-rated Loblolly Pine Plantations in the Georgia Piedmont. Southern Journal of Applied Forestry, 20, 197-202.
Jokela, E. J., Dougherty, P. M., & Martin, T. A. (2004). Production Dynamics of Inten-sively Managed Loblolly Pine Stands in the Southern United States: A Synthesis of Seven Long-Term Experiments. Forest Ecology and Management, 192, 117-130. https://doi.org/10.1016/j.foreco.2004.01.007
Jose, S., Merritt, S., & Ramsey, C. L. (2003). Growth, Nutrition, Photosynthesis and Transpiration Responses of Longleaf Pine Seedlings to Light, Water and Nitrogen. Forest Ecology and Management, 180, 335-344. https://doi.org/10.1016/S0378-1127(02)00583-2
Klute, A. (1986). Methods of Soil Analysis: Part 1—Physical and Mineralogical Methods (2nd ed.). Madison, WI: American Society of Agronomy, Inc. and Soil Science Society of America.
Knapp, B. O., Wang, G. G., & Walker, J. L. (2008). Relating the Survival and Growth of Planted Longleaf Pine Seedlings to Microsite Conditions Altered by Site Preparation Treatments. Forest Ecology and Management, 255, 3768-3777. https://doi.org/10.1016/j.foreco.2008.03.013
Larsen, H. S., South, D. B., & Boyer, J. M. (1986). Root Growth Potential, Seedling Mor-phology and Bud Dormancy Correlate with Survival of Loblolly Pine Seedlings Planted in December in Alabama. Tree Physiology, 1, 253-263. https://doi.org/10.1093/treephys/1.3.253
Lincoln, M. C., Will, R. E., Morris, L. A., Carter, E. A., Markewitz, D., Britt, J. R. et al. (2007). Soil Change and Loblolly Pine (Pinus taeda) Seedling Growth Following Site Preparation Tillage in the Upper Coastal Plain of the Southeastern United States. For-est Ecology and Management, 242, 558-568. https://doi.org/10.1016/j.foreco.2007.01.069
Louisiana Department of Agriculture and Forestry (1997-2007). Pine Plantation Survival Report (Published Annually). Baton Rouge, LA: Louisiana Department of Agriculture and Forestry.
Margolis, H. A., & Brand, D. G. (1990). An Ecophysiological Basis for Understanding Plantation Establishment. Canadian Journal of Forest Research, 20, 375-390. https://doi.org/10.1139/x90-056
DOI: 10.4236/ojf.2018.83023 378 Open Journal of Forestry
P. N. Khanal et al.
Morris, L. A., Ludovici, K. H., Torreano, S. J., Carter, E. A., Lincoln, M. C., & Will, R. E. (2006). An Approach for Using General Soil Physical Condition—Root Growth Rela-tionship to Predict Seedling Growth Response to Site Preparation Tillage in Loblolly Pine Plantations. Forest Ecology and Management, 227, 169-177. https://doi.org/10.1016/j.foreco.2006.02.031
NOAA, National Oceanic and Atmospheric Administration, National Centers for Envi-ronmental Information (2008). National Climate Report—Annual 2008. https://www.ncdc.noaa.gov/sotc/national/200813
Nunez-Mir, G. C., Iannone, B. V., Curtis, K., & Fei, S. (2015). Evaluating the Evolution of Forest Restoration Research in a Changing World: A “Big Literature” Review. New Fo-rests, 46, 669-682. https://doi.org/10.1007/s11056-015-9503-7
Oliet, J. A., & Douglass, F. J. (2012). Restoring Forests: Advances in Techniques and Theory. New Forests, 43, 535-541. https://doi.org/10.1007/s11056-012-9354-4
Paterson, J. (1997). Growing Environment and Container Type Influence Field Perfor-mance of Black Spruce Container Stock. New Forests, 13, 329-339. https://doi.org/10.1023/A:1006598611412
Pinto, J. R., Marshall, J. D., Dumroese, R. K., Davis, A. S., & Cobos, D. R. (2011). Estab-lishment and Growth of Container Seedlings for Reforestation: A Function of Stock-type and Edaphic Conditions. Forest Ecology and Management, 261, 1876-1884. https://doi.org/10.1016/j.foreco.2011.02.010
Puttonen, P. (1989). Criteria for Using Seedling Performance Potential Tests. New Fo-rests, 3, 67-87. https://doi.org/10.1007/BF00128902
Radoglou, K., & Raftoyannis, Y. (2002). The Impact of Storage, Desiccation and Planting Date on Seedling Quality and Survival of Woody Plant Species. Forestry, 75, 179-190. https://doi.org/10.1093/forestry/75.2.179
Schultz, R. P. (1999). Loblolly—The Pine for the Twenty-First Century. New Forests, 17, 71-88. https://doi.org/10.1023/A:1006533212151
South, D. B., Boyer, J. N., & Bosch, L. (1985). Survival and Growth of Loblolly Pine as In-fluenced by Seedling Grade: 13-Year Results. Southern Journal of Applied Forestry, 9, 76-81.
South, D. B., Rakestraw, J. L., & Lowerts, G. A. (2001b). Early Gains from Planting Large-Diameter Seedlings and Intensive Management Are Additive for Loblolly Pine. New Forests, 22, 97-110. https://doi.org/10.1023/A:1012097924355
South, D. B., Rose, R. W., & McNabb, K. L. (2001a). Nursery and Site Preparation Inte-raction Research in the United States. New Forests, 22, 43-58. https://doi.org/10.1023/A:1012079014625
Thompson, B. E. (1985). Seedling Morphological Evaluation—What You Can Tell by Looking. In: M. L. Durvea (Ed.), Proceedings of Workshop on Evaluating Seedling Qual-ity: Principles, Procedures, and Predictive Abilities of Major Tests (pp. 59-71). Corvallis, OR: Oregon State University, Forest Research Laboratory.
DOI: 10.4236/ojf.2018.83023 379 Open Journal of Forestry